


Evaluating the benefits of euro area dividend distribution recommendations on lending and provisioning
Published as part of the Macroprudential Bulletin 13, June 2021.
This article studies the impact of the ECB’s dividend distribution recommendations on banks’ lending and loss-absorption capacity during the COVID-19 crisis. It finds that the policy has been effective in mitigating the potential procyclical adjustment of banks. Banks that did not distribute previously planned dividends increased their lending by around 2.4% and their provisions by approximately 5.5%, thus strengthening their capacity to absorb losses. Notably, the recommendations appear to have mitigated the procyclical behaviour of banks closer to the threshold for automatic restrictions on distributions. Overall, the recommendations were successful in conserving capital and helping the banking system support the real economy and facilitate the recognition of future losses.
1 Introduction
Following the spread of the coronavirus, authorities took unprecedented measures to dampen its impact on businesses and the real economy. The combination of government support measures[1], monetary policy accommodation, as well as micro- and macroprudential releases was aimed at preventing the banking sector’s potential procyclical reaction and ensuring the flow of credit to the real economy. Accordingly, many Basel Committee on Banking Supervision (BCBS) jurisdictions took measures requiring banks to conserve capital. These measures included a single pay-out cap on dividends and share repurchases (e.g. the United States and Australia), linking capital relief measures to the amount paid out in dividends (e.g. Switzerland), or a total ban on banks paying any dividends at all or suspension of such payments throughout the financial year 2020 (e.g. Hong Kong).[2]
In the euro area, the ECB issued three recommendations following the outbreak of the pandemic asking banks not to pay dividends nor to buy back shares in 2020. The first recommendation was issued on 27 March 2020 and recommended dividend suspensions and share buyback restrictions at least until 1 October 2020; on 27 July this recommendation was extended until 1 January 2021.[3] In view of the considerable uncertainty about the future path of the COVID-19 crisis, and acknowledging, by that time, that the impact of the pandemic on banks’ balance sheets had not manifested itself in full due to the ongoing public support measures and temporal lag in recognition of credit impairments, the ECB issued a third recommendation on 15 December 2020, asking for extreme prudence when paying out dividends or performing share buy-backs. Currently, the ECB expects dividends and share buy-backs to remain below 15% of cumulated profit for 2019-20 or no more than 20 basis points in terms of the Common Equity Tier 1 (CET1) ratio, whichever is lower. The recommendation is related to the current exceptional circumstances and will remain valid until the end of September 2021.[4]
The main motivation behind these recommendations was to ensure that banks remain resilient and continue to fulfil their role in providing lending to the real economy, even in periods of crisis. To this end, the aim was for banks to conserve enough capital that would allow them to absorb losses and support the economy amid the heightened uncertainty caused by the COVID-19 pandemic. In September 2020, dividends not distributed following the recommendations amounted to €26 billion in the euro area. These funds complemented the €140 billion capital relief arising from the releases of macro- (€20 billion) and microprudential (€120 billion) buffers.[5] Combined, the dividend recommendations and the capital relief measures are available to absorb losses or potentially finance up to €1.8 trillion in lending to the real economy.[6]
From a macroprudential perspective, the recommendations on dividend distributions were expected to create additional capital space to sustain the real economy and strengthen bank resilience. The capital that is not paid out to shareholders or managers in the form of dividends or bonuses but that is preserved within the banking system provides an extra cushion to absorb losses caused by the COVID-19 crisis and support lending to households, small and medium-sized business and corporates, which generally create extra demand for credit in times of stress. Indirectly, the additional capital also supports the transmission of the ECB’s monetary policy measures to the real economy. The objective of promoting the continued provision of credit in the short term is complemented by a medium-term objective of facilitating banks’ usage of non-distributed dividends to absorb future losses through increased provisions. From a macroprudential perspective, the policy aims to prevent banks from adjusting to stress conditions by hampering credit provision through deleveraging or de-risking and to thereby mitigate potential pro-cyclical behaviour[7] amid high uncertainty and adverse macroeconomic conditions.
This article provides an empirical assessment of the impact of the ECB recommendations from a macroprudential perspective. To this end, the analysis employs linear panel regressions in differences-in-differences format to study banks’ ability to absorb losses through the build-up of provisions, increase resilience through capital conservation and support lending to the real economy during the COVID-19 pandemic. Emphasis is also placed on banks’ willingness to make use of capital buffers to support lending in times of systemic stress.
The analysis also seeks to assess whether the additional capital accrued by system-wide measures mitigates the effects of impediments to capital buffer use. A desire to avoid market stigma and keep some distance from the threshold for automatic restrictions on distributions (the maximum distributable amount (MDA) trigger) may lead to procyclical adjustment by banks that operate close to the combined buffer requirement (CBR).[8] Given that a contraction of credit supply would compromise the recovery and increase risks to financial stability, capital consumption and thus buffer use is encouraged. The additional capital generated by dividend suspension policies may possibly interact with banks’ unwillingness to breach the CBR and, eventually, enhance credit supply in a downturn.
The remainder of this article is structured as follows. Section 3 describes the methodological approach used for the analysis, Section 4 and Section 5 present and discuss the empirical findings for dividend distribution recommendations on lending and provisioning. Section 6 concludes the analysis.
2 Methodological approach
A difference-in-differences (DiD) econometric specification is employed to measure the impact of the ECB recommendations on system-wide measures. A DiD approach makes it possible to compare the group of banks that followed the ECB recommendations (the “treated” group) with those whose dividend distribution plan was not affected (the “control” group). The analysis is based on a sample of 95 institutions under the direct supervision of the Single Supervisory Mechanism (SSM) and ranges over the fourth quarter of 2019 to the third quarter of 2020, i.e. the two quarters prior to and the two quarters after the first ECB recommendation was announced. It employs confidential bank-level data on lending and provisioning stemming from supervisory and monetary datasets[9], as well as confidential SSM surveys on bank dividend distribution plans.
The analysis measures explicitly the effect of dividend distribution recommendations on deleveraging, resilience and provisioning. Three main hypotheses are tested (Box 1 provides further details on the precise specifications used). First, against the background of the macroeconomic deterioration and heightened uncertainty created by the pandemic, the analysis asks whether banks that followed the ECB recommendations avoided a larger adjustment in their balance sheet through deleveraging and de-risking. Second, it investigates the policy’s effect on resilience and increased capacity to absorb losses through the accumulation of provisions. Third, it questions whether dividend measures limited the side effects stemming from impediments to buffer use.
Banks whose dividend pay-outs were affected by the policy are compared to banks whose dividend distribution plan was not affected. Specifically, treated banks did (i) not distribute dividends after the pandemic, despite a positive distribution plan prior to the shock or (ii) distributed only a fraction of what was originally planned. Control banks are instead characterised by two different behaviours: either they planned to not distribute dividends at all, whether prior to the pandemic or after the shock, or, de facto, they ignored the recommendations by paying out in full the dividends planned. Overall, 59 banks were defined as treated and 36 as not treated and thus used as a control group.
As a robustness check, the analysis also considers alternative definitions of treated bank and control groups, and runs counterfactual tests using placebo dates for the announcement of the policy. Four alternative definitions of the treated and control groups provide similar results in terms of the impact on lending.[10] A more conservative definition is also used as further robustness (see the Table A1 in the Appendix for further details). Placebo tests, generally used as robustness test for the DiD econometric approach, are also performed.[11]
Box 1
Methodological specification and assumptions
The differences-in-differences approach has a long tradition in the policy evaluation literature (Meyer, 1995). Its advantage is that it makes it possible to compare a treated group of banks (those impacted by the policy) with those that are unaffected (the control group or untreated banks). One fundamental assumption is that both groups display the same behaviour in terms of the evolution of the dependent variable of interest, referred to as “parallel trend”. In other words, changes in the dependent variables over time should be the same in both the treated and control groups in the absence of the policy intervention. This assumption holds for the analysis undertaken given that the main dependent variables in both the treated and control groups showed a similar trend between the first quarter of 2019 and the first quarter of 2020, i.e. during the pre-treatment period investigated (Chart A).
Chart A
Evolution of selected variables in the treated and control groups of banks up to the introduction of the dividend distribution recommendations
Loans, provisions, CET1 and risk-weighted assets
(EUR billion in logs; clockwise from the top left: loans, provisions, common equity and risk weighted assets)

Source: ECB supervisory statistics and authors’ calculations.
Notes: The charts exemplify the parallel-trend assumption test and demonstrate that prior to the introduction of the measure the evolution of the selected variables did not differ between the two groups of banks.
Specification
To capture the effect of the ECB recommendations on banks’ dividend distribution, difference-in-differences regressions are estimated applying the following formula:
where i, j and t refer to bank, country and time, respectively. Y identifies the dependent variables employed in the analysis: the logarithm of net lending and its decomposition into lending to non-financial counterparties (NFCs) and households, the logarithm of CET1 and risk-weighted assets (RWAs), the CET1 ratio, the RWA density and the logarithm of changes in provisions. Lagged dependent variables are included to check for persistency. is a dummy variable equal to 1 for banks that did not distribute previously planned dividends and zero otherwise. is a dummy variable equal to 1 for the quarters following the ECB dividend suspension and zero otherwise. By expanding the econometric specification with a triple interaction term, the heterogenous impact across levels of capitalisation and buffer usability constraints on the policy’s effectiveness is also evaluated. The triple interaction term CBR distance separates treated banks holding a management buffer above the sample median from those below the median.
is a vector of lagged bank-specific characteristics used to capture cross-bank heterogeneity. Bank-specific variables include a combination of balance sheet, policy and regulatory measures. Among the balance sheet variables included are the logarithm of bank total assets, the loan-to-deposit ratio, the annualised trailing return on equity, the cost-to-income ratio, the CET1 management buffer and the average interest rates charged on the loan book.
The set of policy control variables include non-conventional monetary policies (i.e. asset purchases, short and long-term refinancing operations), bank take-up of debt moratoria and guarantees, as well as individual bank take-up of other forbearance measures. All policy controls are weighted by bank total assets. Bank-specific characteristics as well as policy control variables are lagged to avoid endogeneity related to the simultaneous determination of balance-sheet variables.
Additionally, the vector is included to control for micro- and macroprudential capital requirements, such as the Pillar 2 Requirement (P2R), CBRs and Pillar 2 Guidance (P2G).[12] is a vector of bank fixed effects used to control for unobservable time-invariant bank characteristics. is an interaction term between country and time-fixed effects that is included in the regressions to control for any time variation at country level, such as country-level loan demand effects, aggregate monetary and fiscal policy effects, supply-side effects, etc. Robust standard errors are clustered at bank-level to account for heteroskedasticity and within cluster serial correlation.
3 Dividend distribution recommendations and lending
Overall, the estimates suggest that the ECB’s dividend distribution policy has been effective in sustaining the real economy amid the COVID-19 crisis. While overall lending had contracted by around €277 billion by the third quarter of 2020, as compared to the first quarter of 2020[13], banks affected by the recommendations decreased their lending supply less than banks in the control group. Banks that altered their distribution plans following the recommendations supported lending by around 2.6% relative to banks whose distribution plans were unaffected (Chart 1 and Table A). According to these results, the aggregated impact of the policy was approximately 0.76% of 2019 euro area GDP and 0.6% of 2019 euro area domestic credit.
Chart 1
Policy impact on selected total lending, lending to NFCs and the CET1 ratio
Percentage change, Q1 2020 - Q3 2020

Source: ECB supervisory statistics and authors’ calculations.
Notes: The charts show the change in net lending, NFC lending and RWAs for the control and treated groups. The shaded bars represent the estimated counterfactual change (average treatment effect on the treated group) without the policy.
While the policy supported lending across all treated banks, its transmission was affected by banks’ proximity to the CBR. On the one hand, albeit limiting potential procyclical adjustments by these banks, the policy induced treated banks with a smaller CBR management buffer (e.g. below the median) to increase lending through their exposure to households. On the other hand, the dividend translated into a portfolio rebalancing from households to NFCs for banks with an above median distance from CBR.
The policy mitigated procyclical adjustments by banks closer to the CBR by supporting their lending to households. The coefficient[14] in Table 1, column 5, shows that banks closer to the CBR did not expand their lending to NFCs in the quarters that followed the introduction of the policy. While banks not affected by the recommendations (i.e. the control group) contracted their lending, treated banks closer to the CBR increased their household exposures (Table 1, column 6). In this sense, the dividend policy mitigated a potentially stronger procyclical adjustment by banks with lower management buffers through household lending. In light of the lower capital costs associated with these exposures, this behaviour is consistent with a desire to push capital ratios away from the regulatory threshold.
Table 1
Impact on lending, broken down by household (HH) and NFC lending and their interactions
(percentage changes)

Notes: Standard errors in parenthesis, clustered at bank level. *** p<0.01, ** p<0.05, * p<0.10
The boost to NFC lending observed was driven by banks with a higher management buffer and lower incentives to de-risk their portfolios. Even after controlling for government guarantees, the risk-weighted assets of banks further away from the CBR increased on the back of stronger lending to NFCs (see Table B). This suggests that dividend distribution policies supported banks’ portfolio expansion to NFCs during the COVID-19 crisis, but only on the part of banks further away from the MDA trigger and thus for banks in a position to weaken their capital ratios (Table 1, columns 5 and 6). The results for these banks (row 2, columns 5 and 6) corroborates the available evidence that banks with higher capital headroom are in a better position to take on more risks than their peers and thus sustain corporates more effectively.[15]
At the same time, the policy increased the level of capital in the system, albeit more strongly for banks with a lower CBR management buffer median. From a financial stability perspective, the capital that is conserved in the banking system increases the resilience of banks. In this regard, the recommendations resulted in a stronger increase of CET1 capital for banks with less CBR headroom (Table 2, column 6). By combining capital increases with a portfolio recalibration towards less capital-intensive sectors, e.g. households, the policy could be seen as having improved banks’ perceived weakness vis-à-vis markets.
The estimated impact on solvency was nevertheless negligible, as rising CET1 levels were offset by increases in risk-weighted assets. In particular, treated banks with greater CBR headroom increased their total risk-weighted assets by around 2.7% (i.e. Table 2, column 3 and 7) and built-up provisions (see Section 5) while significantly decreasing their CET1 levels and ratio (Table 2, columns 5-6). At the same time, there was no significant effect on the CET1 ratio for treated banks closer to the CBR (see second row of Table 2 in column 5).
Table 2
Impact on capital and de-risking
(percentage changes)
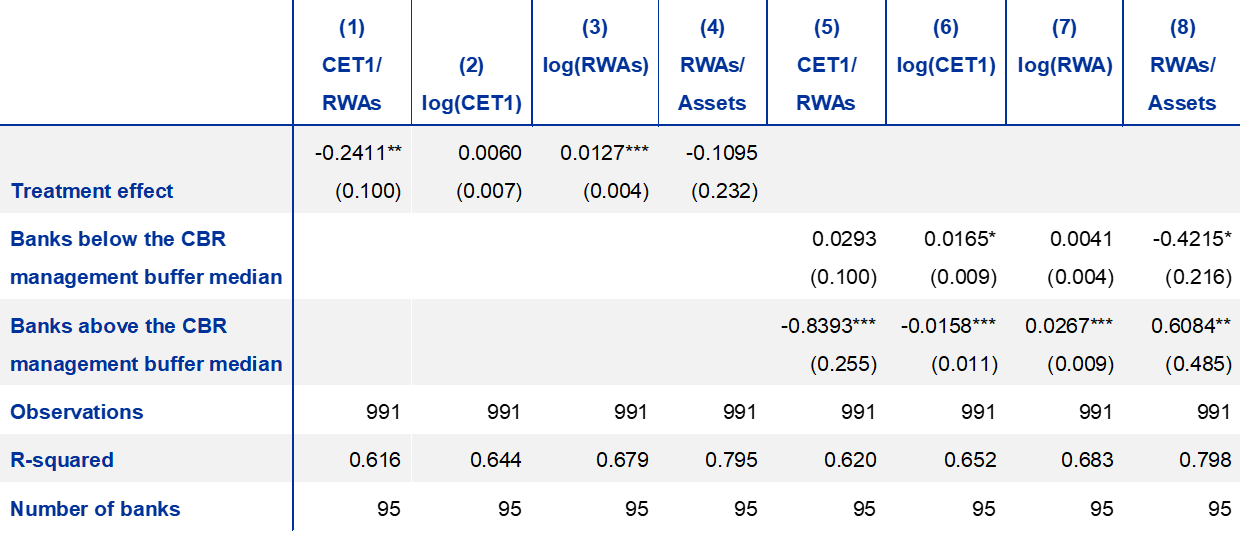
Notes: Standard errors in parenthesis, clustered at bank level. *** p<0.01, ** p<0.05, * p<0.10.
4 Dividend distribution recommendations and provisioning
Banks that did not distribute planned dividends also increased their provisions by around 5.5% relative to other banks. The recommendations thus had a positive and significant effect on banks’ capacity to absorb future losses by facilitating the build-up of provisions (Table 3, column 1). On average, treated banks took advantage of the recommendation on dividend pay-out restrictions by reinforcing provisions to strengthen their loss-absorption capacity and accommodate potential future losses.
Stronger provisions growth was observed for banks with larger management buffers, covering future deteriorations in household and NFC portfolios. Banks with capital buffers above the CBR median increased their growth on accumulated provisions by 12.2% after the policy as compared with untreated banks (Table C, column 2). Furthermore, the effect of the recommendations was stronger in household and NFC portfolios, as reflected in increased provisions in stages 2 and 3. These findings substantiate the capacity of banks with significant capital headroom to provision their exposures in anticipation of the ending of government relief measures while at the same time avoiding deleveraging, as shown in Section 4. This confirms that these banks are better placed to reap the benefits of the dividend policy and reinforce their loss-recognition capacity.
By contrast, the dividend policy had no impact on the provisions of banks with stronger buffer usability constraints, as reflected in the insignificant coefficients for banks closer to the CBR. While using retained capital to reinforce impairments would have facilitated the recognition of future losses, provisions for these banks were unaffected across several portfolios and within all impairment stages (Table 3, columns 2-8).
Table 3
Impact on provisions, broken down by sector and stages
(percentage changes)

Notes: Standard errors in parenthesis, clustered at bank level. *** p<0.01, ** p<0.05, * p<0.10.
5 Conclusion
This article provides an initial evaluation of the impact of the ECB’s dividend policy on banks’ credit provision and loss-absorption capacity during the pandemic. As part of the policy package to dampen the impact of the spread of the coronavirus on businesses and the real economy, the ECB recommended in March 2020 that banks refrain from discretionary dividend payments and share buy-backs throughout the year. Preserving capital resources to support the real economy and absorb losses was deemed to be a priority.
The findings suggest that the policy has been effective in mitigating the potential procyclical adjustment of banks. Allowing for other macroeconomic, monetary and microeconomic factors, banks that refrained from making planned distributions or share buy-backs increased their lending by around 2.4% relative to other banks. In addition, the recommendations had a significant effect on banks’ loss-absorption capacity through the accumulation of provisions, which increased by approximately 5.5% for banks that followed the recommendations.
Importantly, however, the impact and effectiveness of the dividend policy depends on banks’ proximity to the CBR. For instance, when controlling for banks’ capital headroom, the effect on lending to NFCs was only significant for banks with a significant buffer on top of the CBR, while other treated banks supported lending to activities characterised by lower risk weights. This result points to a process of portfolio de-risking to push capital ratios further away from the critical MDA threshold. Furthermore, the objective of strengthening banks’ resilience to absorb future losses by facilitating the build-up of provisions was only achieved by banks with a significant buffer on top of the CBR. These results shed some light on possible interactions between banks’ unwillingness to breach the CBR (and use buffers) and the additional capital generated by dividend suspension policies.
Overall, the recommendations were successful in channelling capital resources in ways that help the banking system to support the real economy. In this regard, the evidence presented in this article provides a basis for discussion of the potential benefits of complementing capital releases with recommendation on temporary restrictions on distributions. At the same time, the findings also indicate that those discussions need to go hand in hand with further conceptual thinking on measures that can mitigate potential impediments to buffer use so as to fully mobilise the benefits of these measures.
References
Altavilla, C, Barbiero, F., Burlon, L. and Boucinha, M. (2020), “The great lockdown: pandemic response policies and bank lending conditions”, Working Paper Series, No 2465, European Central Bank, Frankfurt am Main.
Awad R., Ferreira, C., Jociene, A. and Riedweg, L. (2020), “Restriction of Banks’ Capital Distribution during the COVID-19 Pandemic (Dividends, Share Buybacks, and Bonuses)”, IMF Special Series on COVID-19, International Monetary Fund, Washington, July.
Gambacorta, L. and Mistrulli, P.E. (2004), “Does bank capital affect lending behaviour?”, Journal of Financial intermediation, Issue 13(4), pp. 436-457.
Gambacorta, L., Oliviero, T. and Shin, H.S. (2020), “Low price-to-book ratios and bank dividend pay-out policies”, No 907, Bank for International Settlements, Basel, December.
Hardy, B. (2021), “Covid-19 bank dividend pay-out restrictions: effects and trade-offs”, BSI Bulletin No 38, Bank for International Settlements, Basel, March.
Jiménez, G., Ongena, S., Peydró, J.L. and Saurina, J. (2017), “Macroprudential policy, countercyclical bank capital buffers, and credit supply: Evidence from the Spanish dynamic provisioning experiments”, Journal of Political Economy, Issue 125(6), University of Chicago Press, pp. 2126-2177.
Katsigianni, E., Klupa, K., Tumino, M. and Zsámboki, B. (2021), “System-wide measures on banks’ distributions – motivations and challenges”, Macroprudential Bulletin, Issue 13, European Central Bank, Frankfurt am Main.
Meyer, B.D. (1995), “Natural and quasi-experiments in economics”, Journal of business & economic statistics, Issue 13(2), American Statistical Association, Alexandria, pp. 151-161.
Svoronos, J.P. and Vrbaski, R. (2020), “Banks’ dividends in Covid-19 times”, FSI Briefs, No 6, Bank for International Settlements, Basel, May.
Appendix
Table A.1
Different treatment group definitions
(percentage changes)
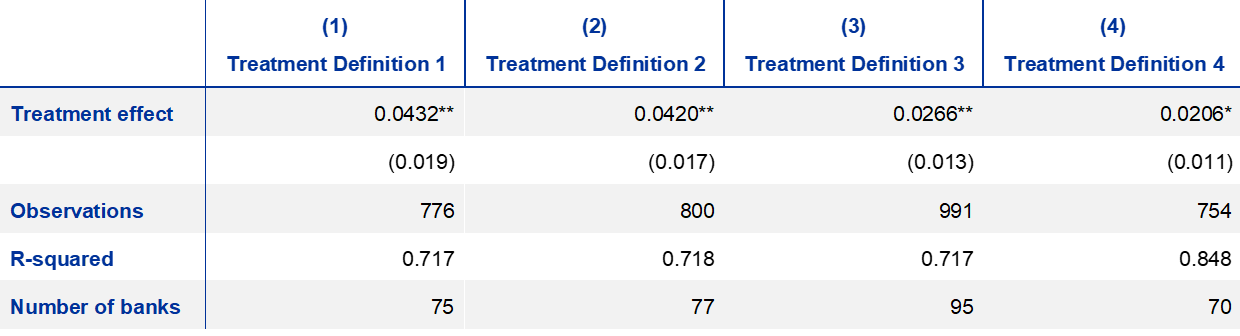
Notes: Treat1 = banks that observed the recommendations were treated; those that distributed dividends in 2020 were left out. The control was banks that did not plan dividend distributions in 2020. Treat2 = Treat1 + banks that distributed all the dividends planned for 2020; these were added in control group since their trend behaviour was not affected by the recommendations. Treat3 = Treat2 + banks that distributed some dividends; these were added to the treatment group since their trend distribution was affected by the recommendations. Treat4 = the inverse of the fraction of distributed dividends is the treatment effect; banks that did not plan to distribute dividends were left out of this definition. In the article, we use Treat3. Standard errors are in parenthesis, clustered at bank level. *** p<0.01, ** p<0.05, * p<0.10.
Table A.2
Placebo test on alternative dividend policy start dates
(percentage changes)
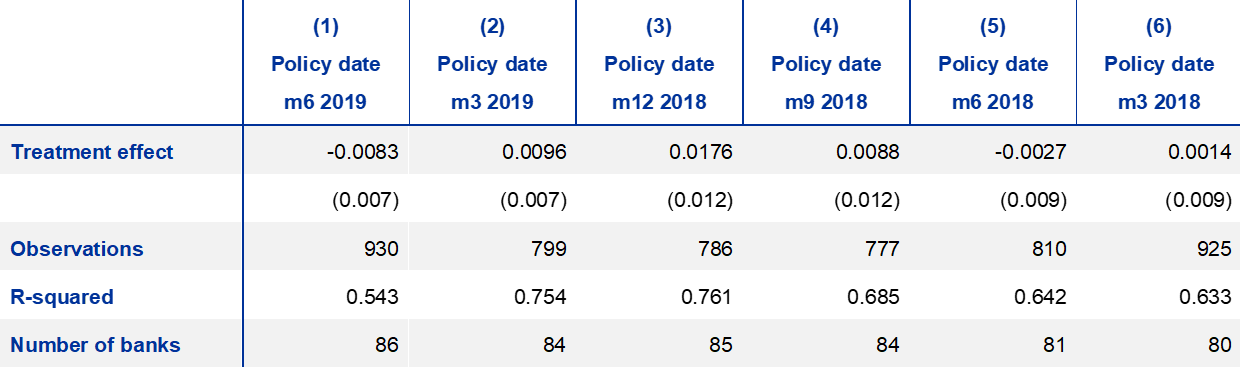
Notes: The table shows the placebo treatment effect that would have been seen had the dividend distribution recommendations been issued on alternative dates. We established alternative dates for the start of the policy in the two years preceding the dividend policy. We kept the estimation time window fixed to one year (i.e. six months before and six months after the policy), as in the main specification. If placebo treatment effects were significant, then our methodology would not have been robust, and the treated and control groups would have exhibited structural differences prior to the policy date. Standard errors are in parenthesis, clustered at bank level. *** p<0.01, ** p<0.05, * p<0.10.
Table A.3
Placebo test on alternative dividend policy start dates: growth in provisions
(percentage changes)

Notes: The table shows the placebo treatment effect that would have been seen had the dividend distribution recommendations been issued on alternative dates. We established alternative dates for the start of the policy in the two years preceding the dividend policy. We kept the estimation time window fixed to one year (i.e. six months before and six months after the policy), as in the main specification. If placebo treatment effects were significant, then our methodology would not have been robust since the treated and control groups would have exhibited structural differences prior to the policy date. Standard errors are in parenthesis, clustered at bank level. *** p<0.01, ** p<0.05, * p<0.10.
Further details on the measures introduced in March is available in Rancoita, E. et al. (2020), “Financial stability considerations arising from the interaction of coronavirus-related policy measures”, Financial Stability Review, ECB, November.
For a review of worldwide policies on dividend distributions in COVID-19 times, see Awad et al. (2020), Gambacorta et al. (2020), Svoronos and Vrbaski (2020) and Hardy, B. (2021).
See the article entitled “System-wide measures on banks’ distributions – motivations and challenges” in this issue of the Macroprudential Bulletin for a detailed overview of the ECB recommendations.
See Recommendation of the European Central Bank of 15 December 2020 on dividend distributions during the COVID-19 pandemic and repealing Recommendation ECB/2020/35 (ECB/2020/62) (OJ C 437, 18.12.2020, p. 1).
For an overview of micro- and macroprudential measures implemented during the COVID-19 crisis and their impact on banks’ capital positions, see ECB (2020), “Macroprudential policy issues”, Financial Stability Review, Chapter 5, Frankfurt am Main, May, and the ECB communication on “Macroprudential measures taken by national authorities since the outbreak of the coronavirus pandemic”.
See Behn, M., Rancoita, E. and Rodriguez d’Acri, C. (2020), “Macroprudential capital buffers – objectives and usability”, Macroprudential Bulletin, Issue 11, ECB, October for a discussion of potential procyclical adjustments.
See footnote 7.
The analysis is based on bank-level supervisory statistics stemming from the common reporting (COREP) and consolidated financial reporting (FINREP), templates, as well as monetary statistics derived from individual monetary financial institution (MFI) balance-sheet items and interest-rate collections.
To control for the robustness of the results, four combinations of treated and control groups are established. In the first, banks that observed the recommendations are considered treated and the control group is composed of banks that did not plan dividend distributions in 2020. In the second, banks that distributed all the dividends planned for 2020 were added to the control group since their trend behaviour was not affected by the recommendations. In the third, banks that distributed some dividends were added to the treatment group since their trend distribution was affected by the recommendations. In the fourth definition, the treatment effect is defined by the inverse of the fraction of distributed dividends while banks that did not plan to distribute dividends are left out. Results based on the third grouping are presented throughout the article while robustness results for the other definitions are presented in Table A.1.
Additionally, we established placebo dates (e.g. “fake” dates) for the start of the policy in the two years prior to the dividend recommendations. If the placebo treatment effects were significant then our methodology would not be robust, and the treated and control groups would exhibit structural differences prior to the policy date. However, these robustness checks supported our methodological approach, the results of which can be found in Tables A.2 and A.3 in the Appendix hereto.
While the specification controls for the releases of capital requirements which took place in the aftermath of the pandemic outbreak, this is not an evaluation of the effects of such releases. Disentangling the effects of capital releases from recommendations on dividend restrictions is generally challenging. Initial evidence on the impact of releases and the supportive monetary policy action can be found in Altavilla et al. (2020).
For a comprehensive review of the euro area banking-sector data, see Banking Supervisory Statistics.
A positive coefficient for the triple interaction term provides information on the marginal lending of treated banks with an above median buffer in addition to the CBR (see Table A, row 2, columns 4-6). By comparison, the coefficients in row 1, columns 4-6, show the effect for banks with a CBR buffer below the median.
See Gambacorta and Mistrulli (2004) and Jimenez et al. (2017).