
Summary
In the ECB Survey of Professional Forecasters (SPF) for the first quarter of 2023, HICP inflation expectations for 2023 and 2024 were revised up from the previous survey round (for the fourth quarter of 2022) to stand at 5.9% and 2.7% respectively.[1] The upward revisions primarily reflect changes to expectations for inflation excluding energy, food, alcohol and tobacco (HICPX). According to respondents, they mainly reflect a combination of recent data outturns, ongoing stronger and broader than expected indirect effects as well as higher forecast wage growth. Expectations for 2025, which were not surveyed in the previous round, stand at 2.1%. Longer-term inflation expectations (for 2027) were revised down by 0.1 percentage points to 2.1%. GDP growth expectations were largely unchanged with positive carry-over from stronger than expected economic activity in the second half of 2022 affecting 2023, but being offset by slightly weaker expectations for 2024 than previously reported. Longer-term GDP growth expectations remained unchanged at 1.4%. The profile for the expected unemployment rate was revised downward by between 0.1 and 0.2 percentage points across all horizons. Following an expected increase to 7.0% in 2023 (the unemployment rate stood at 6.5% in November 2022), the unemployment rate is expected to decline gradually to 6.4% by 2027.
Table 1
Results of the SPF in comparison with other expectations and projections
(annual percentage changes, unless otherwise indicated)

1) Longer-term expectations refer to 2027.
2) As a percentage of the labour force.
1 HICP inflation expectations revised up for 2023 and 2024
SPF respondents revised up their inflation expectations for 2023 and 2024. These stand at 5.9% and 2.7% respectively, 0.1 and 0.3 percentage points higher than in the previous survey round (see Chart 1). Inflation expectations for 2025, which were not surveyed in the previous round (for the fourth quarter of 2022), stood at 2.1%. Compared with the December 2022 Eurosystem staff macroeconomic projections, which were based on November 2022 HICP data as the latest available information, inflation expectations in this SPF round were lower by 0.4 percentage points for 2023 and by 0.7 percentage points for 2024 (see Table 1).
Chart 1
Inflation expectations: overall HICP inflation and HICP inflation excluding energy, food, alcohol and tobacco
(annual percentage changes)

Regarding the near-term outlook, revisions to expected HICPX inflation (i.e. HICP excluding energy and food) were the main factor behind upward revisions to the 2023 and 2024 inflation forecasts. The combined information on HICP and HICPX expectations suggests that SPF respondents have revised their expectations for the sum of HICP energy and food down for 2023 but up for 2024. A number of respondents mentioned the impact of government measures on energy prices in 2023 that might unwind and then imply upward pressure in 2024. The factors underlying revisions to HICPX expectations are discussed below.
Notwithstanding the upward revisions to the calendar year expectations for 2023 and 2024, there are some tentative signs that inflation expectations may be levelling out. The “rolling horizon” expectations for 12 and 24 months ahead of the latest available data (i.e. for December 2023 and December 2024 HICP in the SPF round for the first quarter of 2023) were revised down to 3.6% (for December 2023) from 4.8% (for September 2023) and to 2.2% (for December 2024) from 2.4% (for September 2024).
Although easing slightly, quantitative indicators of uncertainty surrounding the shorter and medium-term inflation outlook remained close to historically high levels.[2] The high level of “aggregate uncertainty” stems from a combination of unprecedented “disagreement” across forecasters about their point forecasts as well as a high average level of “individual uncertainty”. Two-year ahead inflation expectations disagreement (measured by the standard deviation of point expectations) stood at 0.94 percentage points. This is down from 1.25 percentage points in the previous round, but still four times the historical average since 1999. The aggregate probability distributions for the calendar years from 2023 to 2025 are presented in Chart 2. The quantitative balance of risk indicator (calculated as the estimated mean of the aggregate probability distribution minus the average reported point expectation) for the two-year ahead horizon moved back sharply to be broadly balanced. In their qualitative remarks, respondents noted that the main risks related to energy prices (including possible government interventions) and their pass-through, the conflict in Ukraine and possible wage developments. For energy prices, downside as well as upside risks were mentioned. Wage developments were generally considered an upward risk.
SPF expectations for inflation excluding energy, food, alcohol and tobacco (HICPX) were revised up for 2023 and 2024. HICPX expectations for 2023 and 2024 stood at 4.4% and 2.8% respectively – representing upward revisions of 0.5 percentage points for 2023 and 0.2 percentage points for 2024. Expectations for 2025 (not surveyed in the previous round) stood at 2.3%. Respondents indicated that the upward revisions reflect recent data outturns, ongoing stronger and broader than expected indirect effects as well as higher forecast wage growth. Although only a handful provided quantitative assessments, in their qualitative comments, SPF respondents identified indirect effects from energy prices and labour costs as the main factors driving HICPX inflation forecasts. Regarding labour costs, respondents cited a mix of elevated inflation and labour market tightness as factors influencing their forecast evolution. The SPF forecasts for HICPX were broadly similar to those from the December 2022 Eurosystem staff macroeconomic projections – being 0.2 percentage points higher for 2023, the same for 2024 and 0.1 percentage points lower for 2025 (see Table 1).
Chart 2
Aggregate probability distributions for expected inflation in 2023, 2024 and 2025
(x-axis: HICP inflation expectations, annual percentage changes; y-axis: probability, percentages)

Notes: The SPF asks respondents to report their point forecasts and to separately assign probabilities to different ranges of outcomes. This chart shows the average probabilities they assigned to different ranges of inflation outcomes in 2023, 2024 and 2025. To minimise the number of bins in the questionnaire, the upper bin for inflation outcomes was set to ≥ 5.0%. The fact that this would lead to most probability being assigned to the upper bin for some horizons was flagged to respondents when sending out the questionnaire.
2 Longer-term inflation expectations revised down
Longer-term inflation expectations (for 2027) were revised down by 0.1 percentage points to stand at 2.1%. When excluding (trimming) the two highest and lowest responses in both the current and previous rounds, the average would be unchanged at 2.1% for the third consecutive round. The median (and modal) point expectation was unchanged at 2.0%. The estimated mean of the aggregate probability distribution was also revised down by 0.1 percentage points to 2.1% (see Chart 3). There are thus some tentative signs that longer-term expectations, after having moved up noticeably since the third quarter of 2021, have now levelled off. In the most recent round (for the first quarter of 2023), from a balanced panel of 38 respondents who also replied in the previous round, seven respondents revised their longer-term inflation expectations upwards, five revised them downwards and 26 left them unchanged. The distribution of individual point forecasts was broadly unchanged in this round (see Chart 4). Similar to the previous two rounds, the clear modal reply was again 2.0% (45% of respondents), although once again a number of respondents reported longer-term inflation expectations at or above 2.5% (seven, or 16% in both the first quarter of 2023 and the fourth quarter of 2022 rounds). Compared with the distributions over the period from 2014 to 2021, the distribution of longer-term inflation expectations has become much more focused on 2.0%, while expectations of inflation lower than 2% have subsided significantly.
Chart 3
Longer-term inflation expectations
(annual percentage changes)
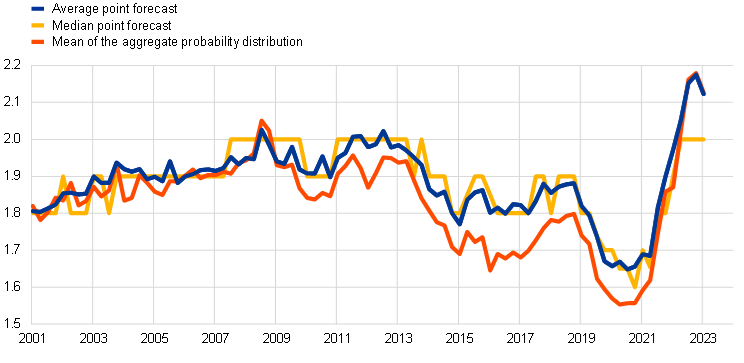
Chart 4
Distribution of point expectations for HICP inflation in the longer term
(x-axis: longer-term HICP inflation expectations, annual percentage changes; y-axis: percentages of respondents)
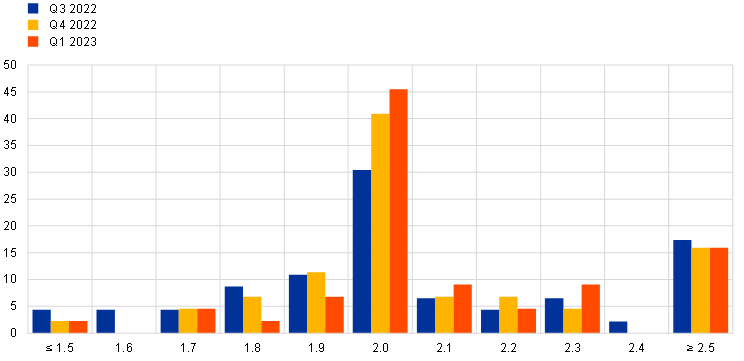
Notes: The SPF asks respondents to report their point forecasts and to separately assign probabilities to different ranges of outcomes. This chart shows the spread of point forecast responses. Longer-term expectations refer to 2027.
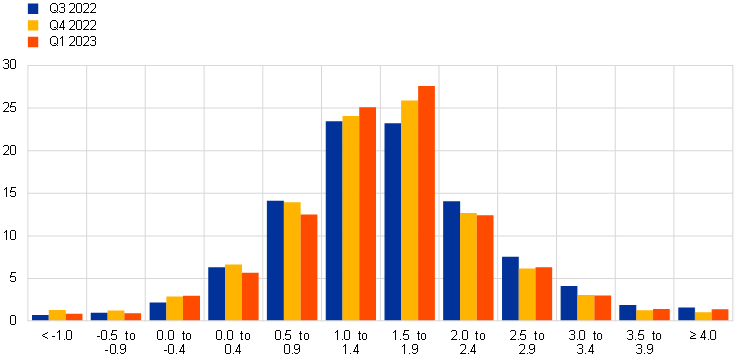
Uncertainty surrounding longer-term inflation expectations eased back but remained at elevated levels, while the balance of risks remained broadly neutral. The decrease in “aggregate uncertainty” (the standard deviation of the aggregate probability distribution) (see Chart 5) was mainly owing to lower “disagreement” (primarily reflecting the downward revision of a strong outlier) but also to some extent to lower “individual uncertainty” (as measured by the average width of the individual probability distributions). The balance of risk indicator remained close to zero (i.e. balanced or neutral). The probability associated with longer-term inflation being in the 1.5-2.5% range increased slightly to 48% from 46% in the previous round. The probability associated with outcomes above this range (i.e. >2.5%) decreased marginally to 32% from 33% and the probability of outcomes below this range (i.e. <1.5%) remained unchanged at 20%.
Chart 5
Aggregate probability distribution for longer-term inflation expectations
(x-axis: HICP inflation expectations, annual percentage changes; y-axis: probability, percentages)

Notes: The SPF asks respondents to report their point forecasts and to separately assign probabilities to different ranges of outcomes. This chart shows the average probabilities they assigned to different ranges of inflation outcomes in the longer term. Longer-term expectations refer to 2027.
The longer-term expectations for HICP inflation excluding energy, food, alcohol and tobacco (HICPX) decreased further to 2.0% from 2.1% in the previous round (and from 2.2% in the third quarter of 2022 round). The median longer-term point expectation for HICPX edged back up to 2.0% from 1.9%, while the modal (most frequent) response remained at 2.0%; 39% reported 2.0% (30% previously), 39% reported 1.9% or lower and 21% reported 2.1% or higher. Of the 28 respondents who provided longer-term HICPX expectations in both the first quarter of 2023 and fourth quarter of 2022 rounds, an equal number (five) revised them up as revised them down, while 18 left them unchanged. The relative evolution of longer-term expectations for HICP and HICPX inflation has been broadly stable for the period of available data since the fourth quarter of 2016 (when expectations for HICPX were first asked), with a level difference of around 0.1 percentage points on average.
3 Real GDP growth expectations largely unchanged
GDP growth expectations in the first quarter of 2023 survey round stood at 0.2% for 2023, at 1.4% for 2024 and at 1.7% for 2025 (see Chart 6). These imply an upward revision compared with the previous round of 0.1 percentage points for 2023, but a downward revision of 0.2 percentage points for 2024. The upward revision for 2023 mainly results from “carry-over” from a more positive second half of 2022 (owing to better-than-expected data for the third quarter and more positive indicators for the fourth). Growth in the fourth quarter of 2022 and the first quarter of 2023 was still expected to be negative (the expectation for the first quarter of 2023 was in line with that from the previous round). In terms of underlying factors, fiscal support is expected to increase and the energy situation is improving (due to comfortable gas reserves, a decrease in prices, supplier diversification and warmer than normal weather). These developments are counterbalanced by persistent inflation and the ongoing pass-through of energy prices to consumers, which will harm real incomes, and to increased costs of financing, due to higher-than-expected rate hikes. Uncertainty has broadly moderated. The degradation in the 2024 outlook can be attributed to the effect of higher interest rates, persistent inflation and fears over the continuity of government support. Risks are still negative. The perspective of persistent inflation and the danger of higher energy prices, along with Europe’s inability to find new energy suppliers remain the most cited risks. Supply bottlenecks were no longer a top concern for respondents, who expect a complete normalisation by 2024. Downward risks related to the war in Ukraine remain. Longer-term growth expectations (which refer to 2027) remained unchanged at 1.4%.
Chart 6
Expectations for real GDP growth
(annual percentage changes)

The respondents’ profile of their short-term GDP outlook (from the fourth quarter of 2022 until the third quarter of 2023) implies two quarters of negative economic growth.[3] Actual quarter-on-quarter real GDP growth for the third quarter of 2022 was 0.3%, substantially higher than the forecast of -0.1% in the previous SPF. In this round, forecasters expected two quarters of negative quarter-on-quarter growth (fourth quarter of 2022 and first quarter of 2023) before some recovery starting in the second quarter of 2023. Overall they expect economic activity to stagnate, at around 0.0% on average between the fourth quarter of 2022 and the third quarter of 2023 (see Chart 7). In more detail, nearly all forecasters expected at least one quarter of negative growth while 85% forecast a “technical recession” (i.e. two consecutive quarters of negative growth) over the period. Compared with the December 2022 Eurosystem staff macroeconomic projections, SPF forecasts were more pessimistic for the first quarter of 2023 (-0.3% vs -0.1%) but were otherwise broadly similar for the second and third quarters of 2023.
Chart 7
Expected profile of quarter-on-quarter GDP growth
(quarter-on-quarter percentage changes)
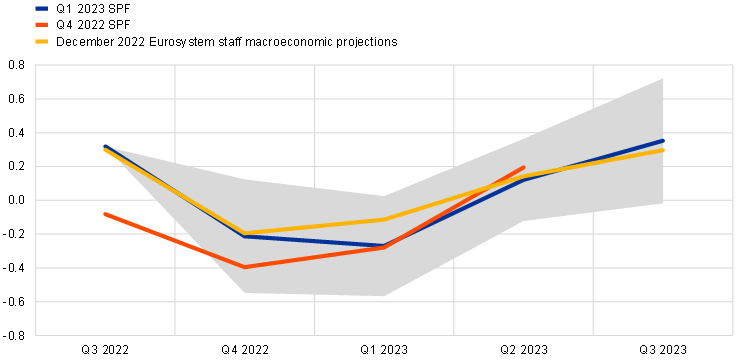
Notes: Grey area indicates one standard deviation (of individual expectations) around average SPF expectation.
Although the profile for the expected level of economic activity has been revised up slightly since the previous round, it still remains substantially (3%) below the profile before the invasion of Ukraine (see Chart 8). Before the Ukraine invasion (first quarter of 2022 round) GDP was expected to surpass the pre-pandemic level of its expected profile in the course of 2023. Now the level of GDP is expected to remain below the pre-pandemic level of its expected profile at least until 2026 (by about 3%). Expected GDP levels in 2024 and 2025 are also slightly lower than forecast in the December Eurosystem staff macroeconomic projections (by about 0.5% and 0.6% respectively) in both cases. Respondents consider current output to be below potential and expect the negative output gap to close only gradually over the SPF horizon.
Chart 8
Forecast profile of real GDP level
(2019 = 100)

Note: Growth expectations for years not surveyed have been interpolated linearly.
Quantitative measures of uncertainty continued moderating this round and the balances of risks improved, especially at the two-year horizon (see Chart 9 and Chart 10). Aggregate uncertainty decreased at the two-year ahead and longer-term horizons, remaining above levels which prevailed before the COVID-19 pandemic, but still considerably lower than at its peak in the second and third quarters of 2020. The balance of risks improved substantially for the two-year ahead horizon but remained slightly on the downside. On the longer horizon, it improved slightly.
Chart 9
Aggregate probability distributions for GDP growth expectations for 2023, 2024 and 2025
(x-axis: real GDP growth expectations, annual percentage changes; y-axis: probability, percentages)
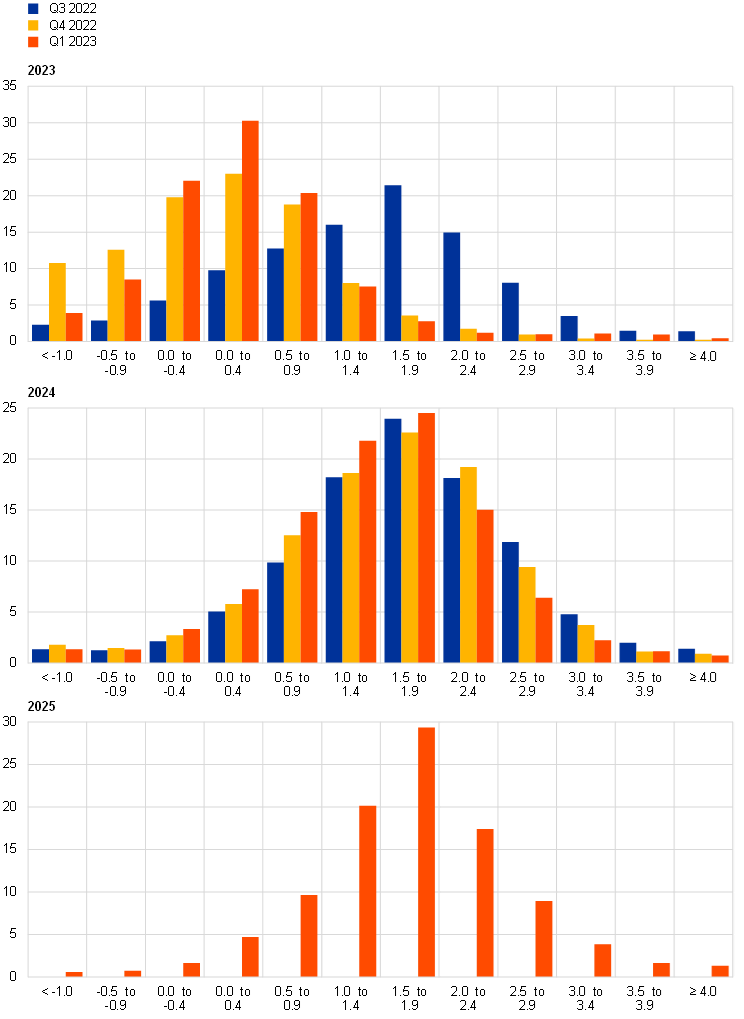
Notes: The SPF asks respondents to report their point forecasts and to separately assign probabilities to different ranges of outcomes. This chart shows the average probabilities they assigned to different ranges of real GDP growth outcomes in 2023, 2024 and 2025.
Chart 10
Aggregate probability distribution for longer-term GDP growth expectations
(x-axis: real GDP growth expectations, annual percentage changes; y-axis: probability, percentages)
Notes: The SPF asks respondents to report their point forecasts and to separately assign probabilities to different ranges of outcomes. This chart shows the average probabilities they assigned to different ranges of real GDP growth outcomes in the longer term. Longer-term expectations refer to 2027.
4 Unemployment rate expectations broadly revised down
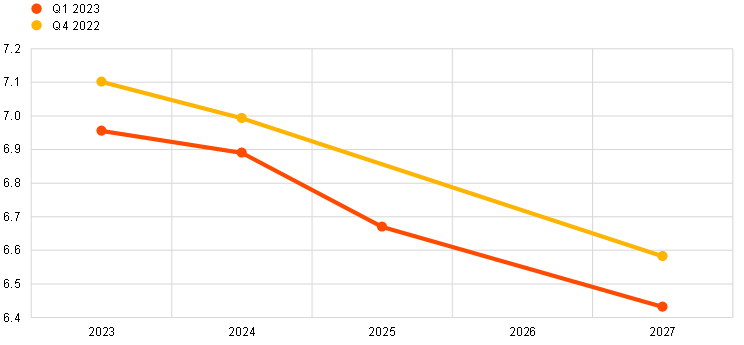
Unemployment rate expectations in the first quarter of 2023 round were 7.0%, 6.9% and 6.7% for 2023, 2024 and 2025 respectively. These were revised down from the previous round by 0.1 percentage points for 2023 and 2024. The expectation for 2027 was 6.4%, with a downward revision of 0.2 percentage points, remaining close to the historical lows observed for the long-term unemployment expectations. After an increase in 2023 (from 6.5% in November 2022), the unemployment rate is expected to follow a downward sloping trajectory parallel to what was observed in the previous round, although at a lower level (see Chart 11). Respondents reported the good state of the labour market, characterised by recent low realisations of the unemployment rate and high vacancy rates, the possible implementation of short-term job retention schemes should they be required, and more optimistic growth expectations, as the reasons for a downward revision of short and medium-term unemployment expectations. Upside risks were seen in a stronger slowdown of economic activity, also due to higher energy and financing costs. By contrast, demographic factors and labour shortages in certain sectors were frequently mentioned as downside risks.
Chart 11
Expectations for the unemployment rate
(percentages of the labour force)
Uncertainty around unemployment rate expectations decreased slightly for all horizons, remaining at relatively high levels and the balance of risks is broadly neutral for all horizons. On balance, the distributions continued losing the somewhat positive skewness of previous rounds, showing a greater degree of symmetry for all horizons (see Chart 12 and Chart 13). The balance of risk indicator for longer-term expectations was marginally positive, as the mean of the aggregated probability distribution (at 6.5%) was slightly above the average point forecast (6.4%).
Chart 12
Aggregate probability distributions for the unemployment rate in 2023, 2024 and 2025
(x-axis: unemployment rate expectations, percentages of the labour force; y-axis: probability, percentages)
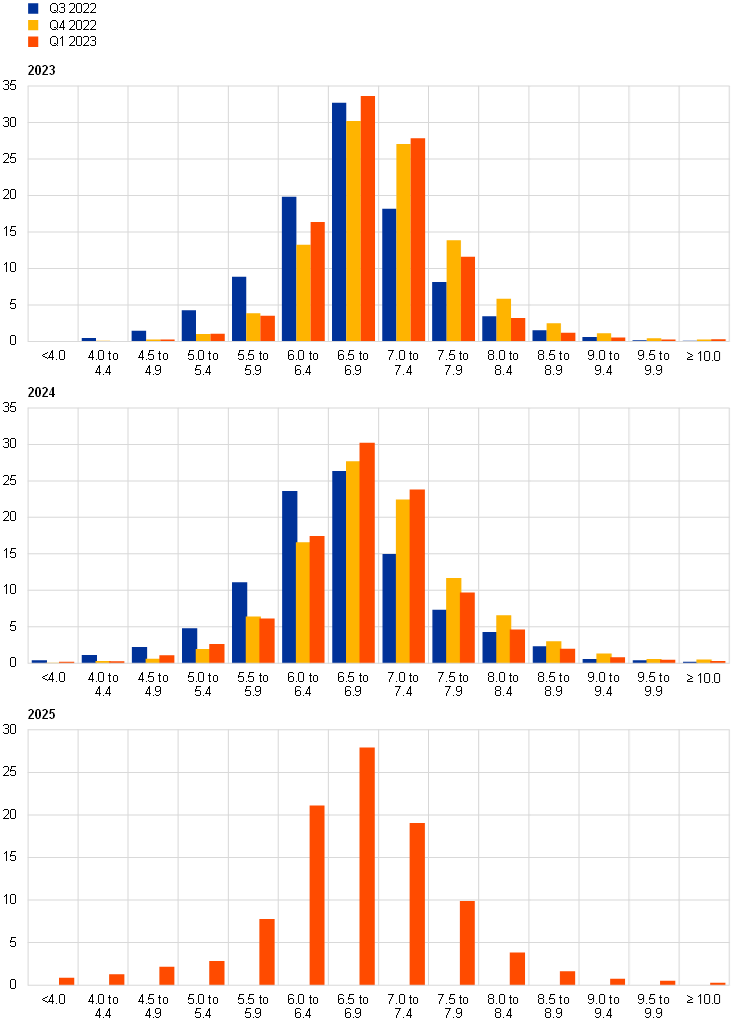
Notes: The SPF asks respondents to report their point forecasts and to separately assign probabilities to different ranges of outcomes. This chart shows the average probabilities they assigned to different ranges of unemployment rate outcomes for 2023, 2024 and 2025.
Chart 13
Aggregate probability distribution for the unemployment rate in the longer term
(x-axis: unemployment rate expectations, percentages of the labour force; y-axis: probability, percentages)
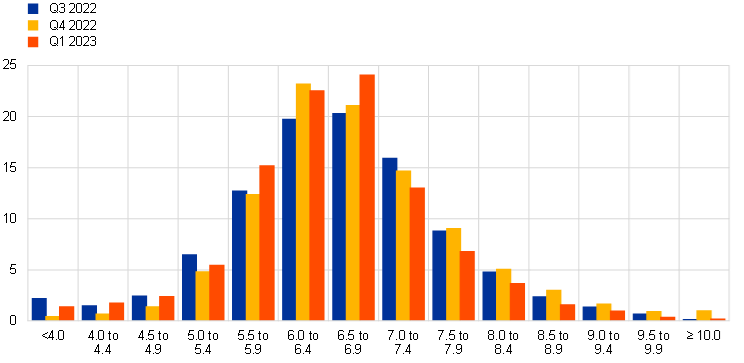
Notes: The SPF asks respondents to report their point forecasts and to separately assign probabilities to different ranges of outcomes. This chart shows the average probabilities they assigned to different ranges of unemployment rate outcomes in the longer term. Longer-term expectations refer to 2027.
5 Expectations for other variables
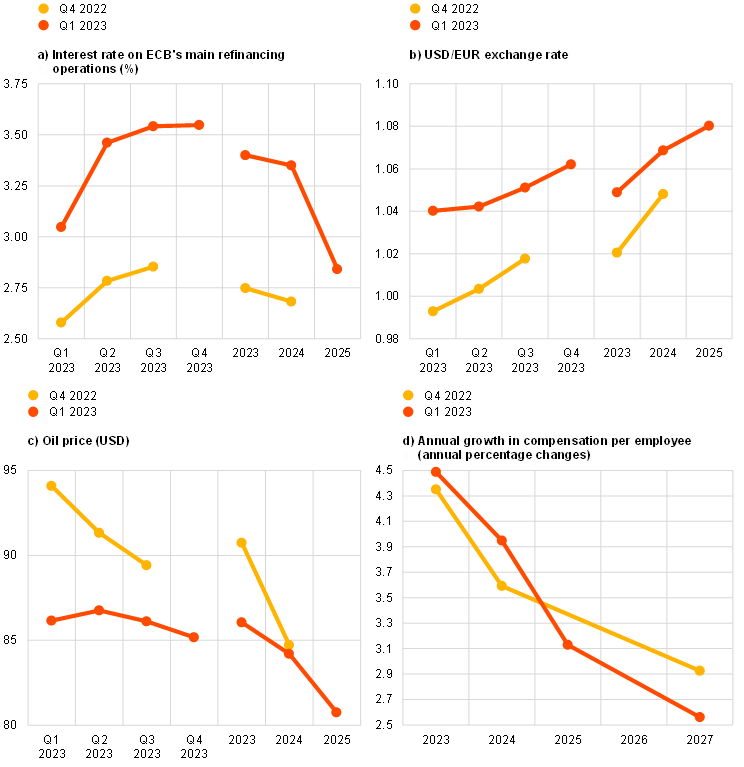
Forecasters expected: the ECB’s key main refinancing operations (MRO) interest rate to increase to 3.0% in the first quarter of 2023 and to 3.5% in the second quarter of 2023, before easing slightly in 2024 and in 2025 to below 3%; the euro to marginally appreciate against the dollar from 1.04 in the first quarter of 2023 to 1.08 in 2025; oil prices to remain around USD 85 per barrel in 2023, before declining towards USD 80 by 2025; and nominal wages to increase by 4.5% in 2023 and 3.9% in 2024 and to moderate to 3.1% in 2025 and to 2.6% in the long term.
Respondents expected the rate on the Eurosystem’s main refinancing operations to increase to 3.0% in the first quarter of 2023 and to 3.5% in the second quarter. They expect it to remain around this level for the remainder of 2023, before declining slightly in 2024 and to below 3% in 2025 (see Chart 14a). The peak expectation is for the fourth quarter of 2023 at 3.55% (although around 30% of respondents expected peak MRO interest rates of 4% or more). Compared with the previous round (for the fourth quarter of 2022), the profile has been revised up by between 0.5 and 0.7 percentage points.
The expected average USD/EUR exchange rate was revised up over all horizons, and is expected to be within the 1.04-1.06 range in 2023 and to then increase marginally to 1.08 by 2025 (see Chart 14b).
Compared with the previous round, the level of US dollar-denominated oil prices (per barrel) was revised down for 2023 but was broadly similar for 2024. Respondents envisage a relatively flat trajectory of around USD 85 per barrel up to 2024, before a decline to USD 80 per barrel in 2025 (see Chart 14c).
Expectations for the annual growth in compensation per employee were revised up slightly by 0.1 percentage points for 2023 and by somewhat more (0.4 percentage points) for 2024 (see Chart 14d). Nonetheless, respondents expect a downward sloping trajectory over the SPF horizons: 4.5%, 3.9% and 3.1% for 2023, 2024 and 2025 respectively and down to 2.6% for the longer-term horizon. Longer-term expectations were revised down by 0.3 percentage points (from 2.9%).
Chart 14
Expectations for other variables
Annex (Chart data)
Excel data for all charts can be downloaded here.
© European Central Bank, 2023
Postal address 60640 Frankfurt am Main, Germany
Telephone +49 69 1344 0
Website www.ecb.europa.eu
All rights reserved. Reproduction for educational and non-commercial purposes is permitted provided that the source is acknowledged.
For specific terminology please refer to the ECB glossary (available in English only).
PDF ISBN 978-92-899-5805-9, ISSN 2363-3670, doi:10.2866/57477, QB-BR-23-001-EN-N
HTML ISBN 978-92-899-5804-2, ISSN 2363-3670, doi:10.2866/436874, QB-BR-23-001-EN-Q
The survey was conducted between 6 and 12 January 2023, with 58 responses received. This is in line with the historical average response rate. Participants were provided with a common set of the latest available data for annual HICP inflation (December 2022 flash estimates: overall inflation, 9.2%; underlying inflation, 5.2%), annual GDP growth (third quarter of 2022, 2.3%) and unemployment (November 2022, 6.5%). This report was drafted on the basis of data available on 17 January 2023.
The width of the reported probability distributions indicates the perceived degree of overall uncertainty, whereas the asymmetry of the distributions indicates whether that uncertainty is more concentrated on higher or lower outturns, i.e. it measures the perceived balance of risks. Regarding uncertainty, it can be shown that the width (or standard deviation) of the aggregated probability distribution (i.e. “aggregate uncertainty”) is a function of the average width (or standard deviations) of the individual probability distribution (i.e. “individual uncertainty”) and standard deviation of the individual point forecasts (i.e. “disagreement”).
49 respondents provided this profile.
- 3 February 2023