
Introduction
Market infrastructures, together with markets and institutions, constitute one of the three core components of the financial system. The market infrastructure for payments[1] consists of the set of instruments, networks, rules, procedures and institutions that ensure the circulation of money. Its purpose is to facilitate transactions between economic agents and to support efficient resource allocation in the economy.
The Eurosystem has the statutory task of promoting the smooth operation of payment systems. This is crucial for a sound currency, the conduct of monetary policy, market functioning and financial stability. A key instrument which the Eurosystem uses for carrying out this task is the provision of payment settlement facilities.[2]
To this end, in 1999 the Eurosystem created the Trans-European Automated Real-time Gross settlement Express Transfer system[3] (TARGET) for the settlement of large-value payments in euro, offering a central bank payment service across national borders in the European Union (EU).
TARGET was developed to meet three main objectives:
- provide a safe and reliable mechanism for the settlement of euro payments on a real-time gross settlement (RTGS) basis;
- increase the efficiency of inter-Member State payments within the euro area;
- serve, most importantly, the needs of the Eurosystem’s monetary policy.
In May 2008 TARGET2 replaced the first-generation system, TARGET. Like its predecessor, TARGET2 is used to settle payments connected with monetary policy operations, as well as interbank payments, customer payments exchanged between banks, and transactions related to other payment and securities settlement systems, i.e. ancillary systems. As TARGET2 provides intraday finality, meaning that settlement is final for the receiving participant once the funds have been credited, it is possible to reuse these funds several times a day.
Since June 2015 TARGET2 participants have been able to open dedicated cash accounts (DCAs) on the TARGET2-Securities (T2S) platform[4], which they can use to settle the cash leg of their securities transactions. In addition, since November 2018 TARGET2 participants have been able to open DCAs for TARGET Instant Payment Settlement (TIPS).[5] TIPS is the service implemented by the Eurosystem for settling euro-denominated instant payments on an individual basis, around the clock.
Building on the synergies between the two market infrastructures, the Eurosystem has been working intensively to consolidate TARGET2 and T2S services. This consolidation will, in particular, enhance the Eurosystem’s RTGS operations. In addition, the project will further strengthen cyber resilience capabilities and establish a single point of access to all Eurosystem market infrastructure services.
TARGET2 offers harmonised market infrastructure services at EU level, as well as a single pricing structure. It provides ancillary systems with a harmonised set of cash settlement services and supports its users with enhanced liquidity management tools. In this manner, it contributes to financial integration, financial stability and liquidity efficiency in the euro area.
TARGET2 is accessible to a large number of participants. Over 1,000 credit institutions in Europe use TARGET2 to make payments on their own behalf, on behalf of other (indirect) participants or on their customers’ behalf. Taking branches and subsidiaries into account, over 44,000 banks worldwide (and thus all of the customers of these banks) can be reached via TARGET2.
The report and its structure
This report is the 21st edition of the TARGET Annual Report. The first edition was published in 2001, covering TARGET’s first two years of operation (1999 and 2000). As in previous years, the report provides information on TARGET2 traffic, its performance and the main developments that took place in 2020. It is aimed mainly at decision-makers, practitioners and academics who need to have an in-depth understanding of TARGET2. We hope it will also appeal to members of the general public with an interest in market infrastructure issues and, in particular, TARGET2.
In addition to the core content, this report includes seven boxes on topics of particular relevance in 2020. The boxes focus, respectively, on the evolution of traffic in TARGET2 and the impact of the coronavirus (COVID-19); the introduction of TIPS pan-European reachability measures; the effects of Brexit on TARGET2 traffic; the strengths of liquidity-saving mechanisms in TARGET2; payment profiles of TARGET2 participants; major TARGET2 incidents in 2020; and the TARGET2/T2S consolidation project and future RTGS services.
In the report, references made to the first-generation TARGET system (which was in operation from January 1999 to May 2008) are also applicable to its second generation, TARGET2 (which replaced TARGET in May 2008).
Note
Liquidity transfers between TARGET2 and T2S/TIPS DCAs and payments processed on T2S/TIPS DCAs are not included in the TARGET2 indicators presented in this report.
Although both T2S and TIPS DCAs are legally part of TARGET2, these (technical) transactions are excluded from the calculations to prevent the system’s indicators from being artificially inflated and to make the figures more easily comparable from year to year. Nevertheless, as a matter of transparency, some general statistics on T2S and TIPS DCAs are provided on the ECB’s website.[6]
TARGET2 activity
In 2020 TARGET2 maintained its leading position in Europe, processing 90% of the total value settled by large-value payment systems in euro. TARGET2 also remained one of the largest payment systems worldwide. Compared with the previous year, the total turnover processed increased by more than 5%, reaching €465.8 trillion.[7] The total volume of payments increased slightly by 1% to 88.7 million transactions.
The highest daily turnover during the year was recorded on 24 June, with a total value of €2,966 billion, and the highest daily volume of payments was recorded on 30 June, when 501,979 transactions were processed.
In 2020 the availability of TARGET2’s Single Shared Platform (SSP) stood at 99.46%.
1 Evolution of TARGET2 traffic
Table 1
Evolution of TARGET2 traffic

Note: There were 255 operating days in 2019 and 257 operating days in 2020.
1.1 TARGET2 turnover
TARGET2 turnover in 2020 amounted to €465.8 trillion, corresponding to a daily average of €1.8 trillion. Chart 1 shows the evolution of the value of TARGET2 traffic over the last ten years. In 2011 and 2012 TARGET2 settlement values continued to recover after the slump caused by the financial crisis, with an annual growth rate of around 3%. The drop of 22% in 2013 was due mainly to a change in the statistical methodology, which involved some transactions ceasing to be included in the aggregate representing the turnover.[8] Overall, after two years of stable figures, TARGET2 turnover on RTGS accounts fell by almost 15% between 2015 and 2017, following the launch of T2S.[9] In 2018 the TARGET2 value stabilised, and in 2019 and 2020 experienced annual increases of 2.0% and 5.6% respectively. These increases in turnover stemmed mainly from payments relating to operations with the central bank and from interbank payments.
Chart 1
TARGET2 turnover
(left-hand scale: EUR billions; right-hand scale: percentages)

Source: TARGET2.
In terms of activities involving market participants (i.e. excluding central bank and ancillary system transactions), interbank transactions (transactions exclusively involving credit institutions) accounted for 76% of the total value of payments in 2020, whereas the remaining share was composed of customer transactions (i.e. transactions processed on behalf of a non-bank party, be they individuals or corporates). This share has remained stable over the past few years (77% of interbank payments in 2019).
A comparison of the TARGET2 turnover and the euro area’s annual GDP (around €9.97 trillion) shows that TARGET2 settles the equivalent of the annual GDP in less than six days of operations. This indicates the role and efficiency of TARGET2, which provides intraday finality for transactions and allows the funds credited to the participant’s account to become immediately available for other payments. Consequently, the same euro can be reused several times by several TARGET2 participants in the same day.
Chart 2 depicts the average daily turnover generated in TARGET2 for each month in 2019 and 2020, thus showing the seasonal pattern of the system. While the general pattern for both years is very similar during the second half of the year, the values recorded in March and April 2020 are significantly higher than they were in the same period of 2019. The difference is largely attributable to the impact of the COVID-19 pandemic, which resulted in increased market activity during these months.
Chart 2
Average daily TARGET2 turnover
(EUR billions)

Source: TARGET2.
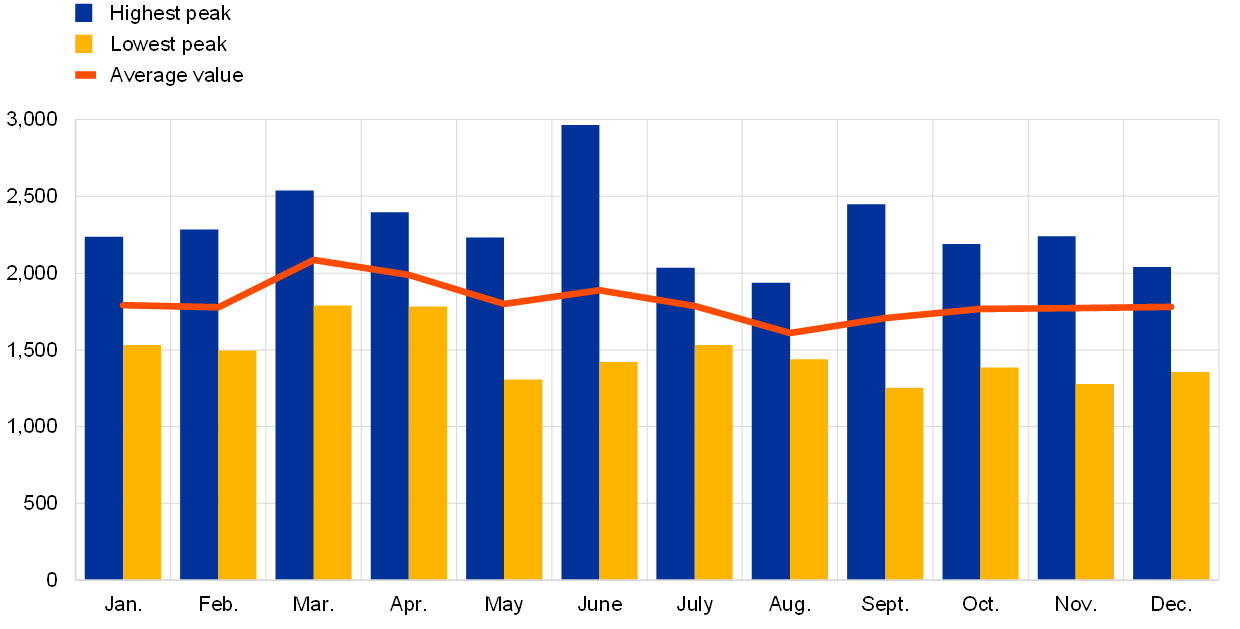
Chart 3 displays the highest and lowest daily TARGET2 values for each month of 2020, as well as the average daily values for each month. Usually, the days with the highest peaks are at quarter-ends, typically on the last day of the month, owing to reimbursements and due dates in various financial markets. This seasonal pattern was also visible in 2020. However, the day with the largest turnover of the year with a total value of €2,966 billion was 24 June, which is largely due to the settlement of the third series of targeted longer-term refinancing operations (TLTRO III) on that day.
Chart 3
Monthly maxima and minima, troughs and averages of TARGET2 daily values in 2020
(EUR billions)
Source: TARGET2.
Throughout 2020, the amplitude of TARGET2 turnover, expressed by the difference between the highest and the lowest values, was 58%, compared with 52% the previous year. Overall, the average values throughout the year followed a well-established seasonal pattern.
Peaks and troughs in the system’s values can also be influenced by other factors, such as TARGET2 holidays or the end of reserve maintenance periods. For example, the lowest values are typically recorded during the summer holidays and on days that are national holidays in some Member States or in other important economies outside the EU. In 2020, for instance, the lowest values processed coincided with a public holiday observed in the United States (7 September).
Finally, Chart 4 compares traffic developments in the world’s major payment systems. In particular, it depicts the daily average turnover in euro equivalents for the last 20 years of TARGET/TARGET2, Continuous Linked Settlement (CLS), Fedwire Funds (the US dollar-denominated RTGS system operated by the Federal Reserve System) and the Bank of Japan Financial Network System (BOJ-NET). Some common patterns, including the effect of the financial crisis on the number of processed transactions, can be identified across systems. However, the comparability of TARGET2 with other systems has been hampered by the change in the TARGET2 statistical methodology in 2013 and the migration of the securities settlement systems to T2S.[10] In the latter case, if the average daily volume in TARGET2 after 2015 is considered together with the average daily turnover for DCAs, which are technically held in T2S, total traffic continues to increase.[11]
Chart 4
Major large-value payment systems around the globe
(EUR billions)
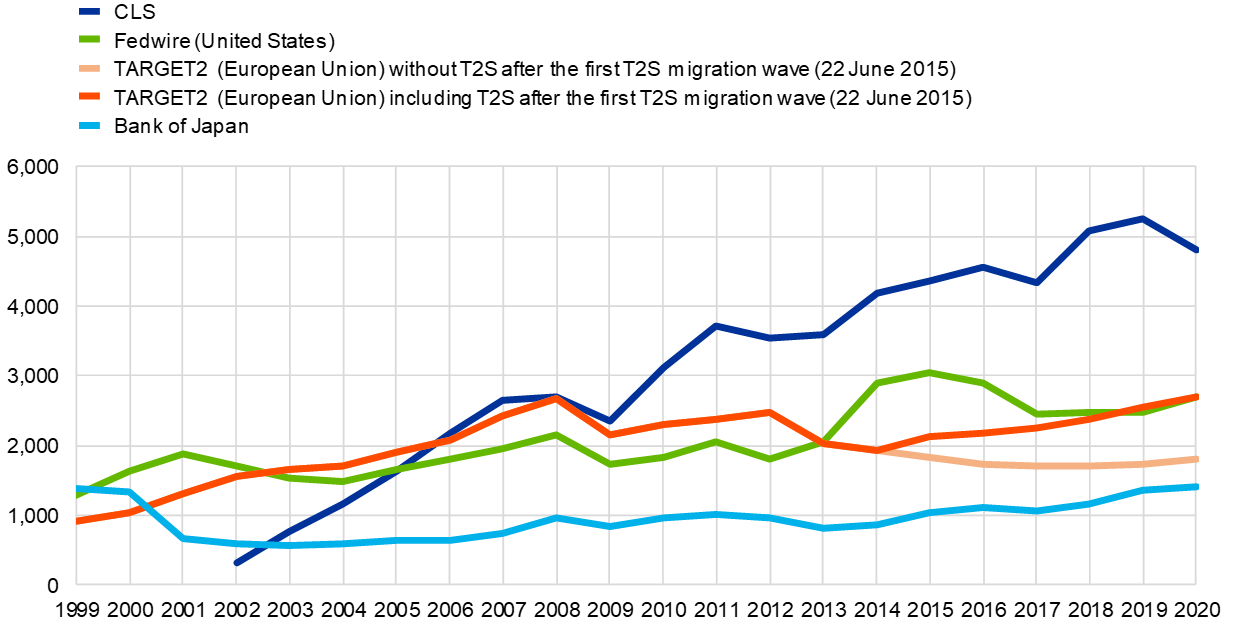
Sources: TARGET2, Fedwire Funds Service (website of the Federal Reserve System); BOJ Time-Series Data (Bank of Japan website); ECB data.
1.2 Volume of transactions in TARGET2
After low transaction volumes resulting from the financial crisis, TARGET2 traffic recovered, posting a positive trend between 2010 and 2013 (Chart 5). Although the number of transactions never reached pre-crisis levels, the system attracted around 4 million transactions more over that period. However, this trend reversed in 2014 and 2015: because the period for migration to Single Euro Payment Area (SEPA) instruments ended,[12] there was, once again, a significant reduction in the customer payment segment, leading to lower TARGET2 volumes. Following the completion of the migration to SEPA, TARGET2 traffic has stabilised at around 88 million transactions yearly.[13]
Chart 5
TARGET2 traffic
(left-hand scale: number of transactions in millions; right-hand scale: percentages)
Source: TARGET2.
The exact volume settled in TARGET2 in 2020 amounted to 88,666,544 transactions, corresponding to a daily average of 345,006 payments. Compared with the previous year, the overall number of processed payments increased by around 1.0%. The increase was driven by a higher number of interbank and customer payments. More detailed information on the evolution of the different traffic segments is provided in Box 1.
In six individual months in 2020, the average daily volumes in TARGET2 calculated on a monthly basis were below the levels recorded for the corresponding months in 2019 (Chart 6). The biggest year-on-year differences, amounting to 10% in each case, were observed in February and April. The difference in April was largely due to the impact of the COVID-19 pandemic, as highlighted in Box 1. Overall, Chart 6 indicates a seasonal pattern similar to that of the previous year.
Chart 6
Average daily TARGET2 volumes per month
(number of transactions)

Source: TARGET2.
The highest average daily volume was recorded in December, when it reached more than 377,000 transactions. This figure may be related to the high daily volumes normally observed at the end of the year.
Chart 7
Monthly peaks, troughs and averages of TARGET2 daily volumes in 2020
(number of transactions)

Source: TARGET2.
Chart 7 depicts the peaks and troughs in terms of the daily volume on RTGS accounts in TARGET2 in 2020 and the average daily volume for each month. As already observed for the value-based figures, the peaks typically fall on the last day of the month, and are especially pronounced at quarter-end for the same reasons (i.e. deadlines in financial markets or for corporate business). In 2020 the highest daily volume was recorded on 30 June, when 501,979 transactions were processed. The lowest daily volume was recorded on 21 May (212,431 transactions), which was a public holiday in most European countries (Ascension Day). Similar developments were also observed in 2019, when the highest yearly peak was recorded on 30 September, and the lowest on 1 November (All Saints’ Day).
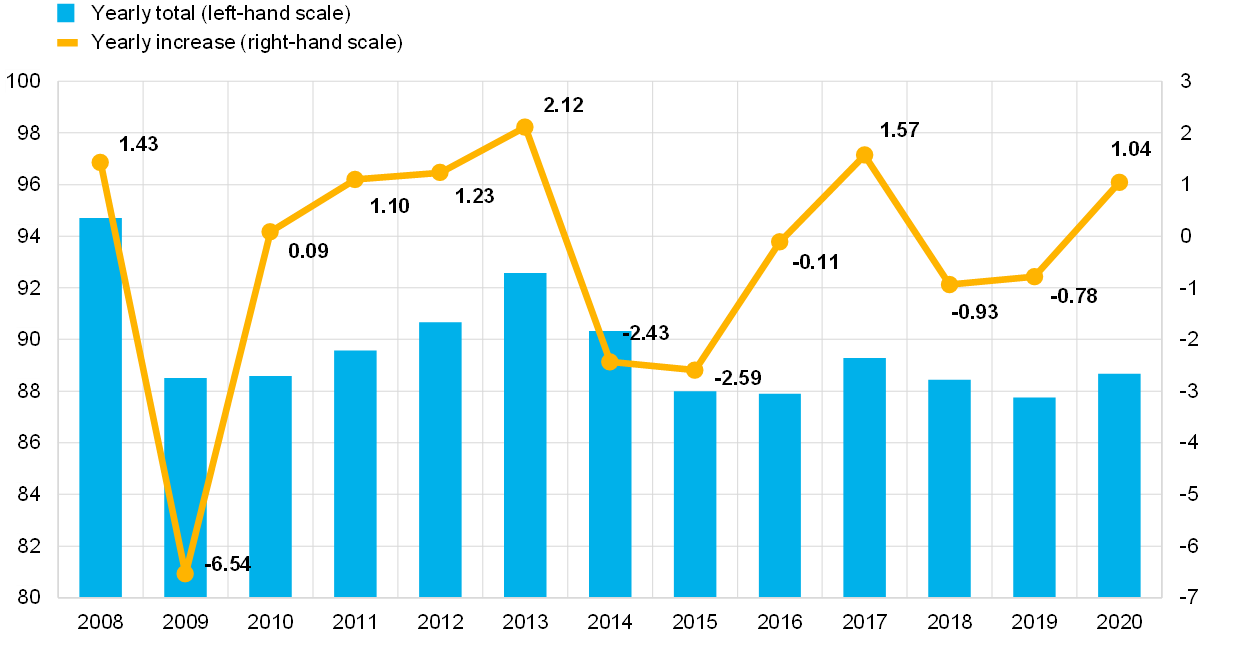
Chart 8 shows the yearly moving average of TARGET2 volumes (i.e. the cumulative volume processed in the preceding 12 months) for each month. This indicator helps to eliminate the strong seasonal pattern observed in TARGET2 traffic. The variation of this cumulative volume from one year to the next is also presented as a percentage. The chart shows that the cumulative volume started to decline in the second half of 2008 with the onset of the financial crisis. The number of transactions continued to drop sharply, almost until the end of 2009. After that, TARGET2 volumes were roughly stable until the end of 2011. They then started to grow moderately until the end of the first quarter of 2014, when they reached their highest point since the crisis. Thereafter, the cumulative volume started dropping for the reasons already explained at the beginning of this section (SEPA migration) and, in October 2014, the cumulative growth rate on a yearly basis turned negative and continued to decrease until mid-2017. The negative trend reversed in 2017 because of the increases observed in the customer and interbank payments segment. It then remained stable throughout 2018 and 2019. In 2020, TARGET2 volumes reached a temporary peak in the first quarter as a result of the market turbulence driven by the COVID-19 pandemic. The trend returned to 2018 and 2019 levels thereafter.
Chart 8
TARGET2 volumes
(left-hand scale: number of transactions in millions; right-hand scale: percentages)

Source: TARGET2.
Chart 9 compares the growth rate (between 2019 and 2020) of traffic in TARGET2 with the growth rates of the major payment systems worldwide and the growth rate of SWIFT payment-related FIN traffic (categories 1 and 2). The chart reveals that the changes in traffic diverged significantly across the systems. The largest increase – almost 11% – was recorded by SIC (CH), while the largest decrease – over 12% – was recorded by EURO1.[14]
Chart 9
Comparison of the changes in traffic in some major large-value payment systems and SWIFT between 2019 and 2020
(percentages)
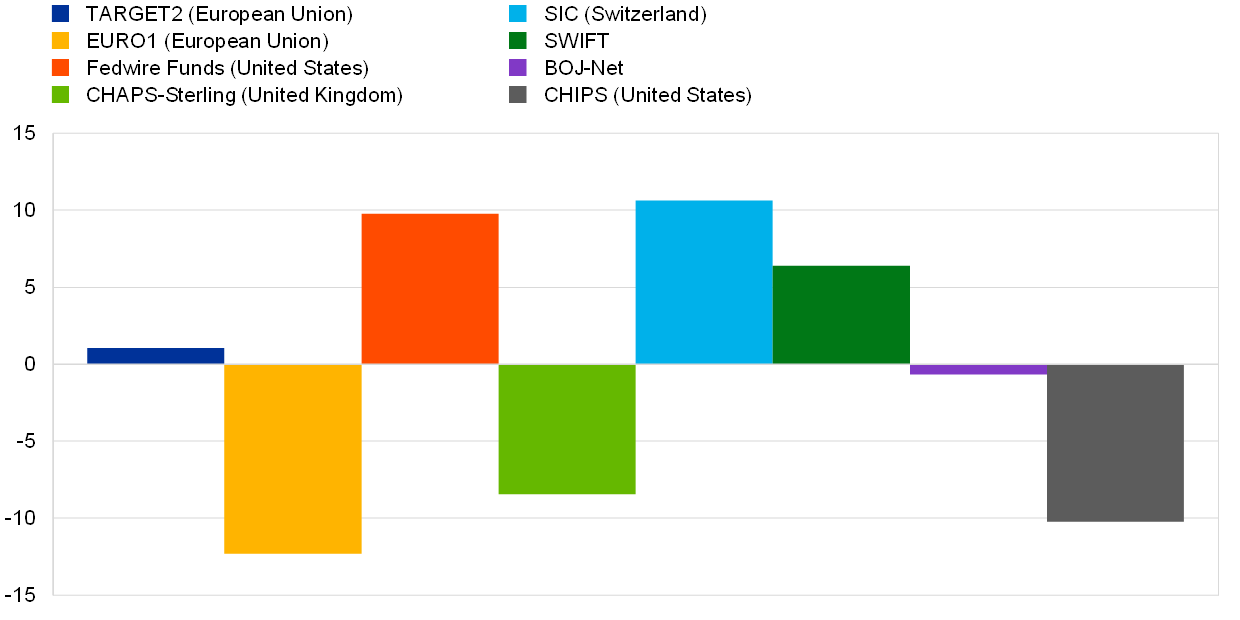
Sources: TARGET2, Fedwire Funds Service (website of the Federal Reserve System); SWIFT FIN Traffic (SWIFT website); BOJ Time-Series Data (Bank of Japan website); Key payment statistics (Bank of England website); Annual Statistics From 1970 to 2019 (the Clearing House website); SIC statistics (SIX website); ECB data.
Box 1
The evolution of TARGET2 traffic and the impact of COVID-19
The Eurosystem has been carefully monitoring the development of TARGET2 volumes over time, especially considering their relevance for TARGET2 revenues and cost recovery. The monitoring was stepped up this year to assess the impact of the coronavirus (COVID-19) pandemic on TARGET2 traffic. Collaboration with other central bank functions was also increased so as to contribute to the analysis of the pandemic’s broader economic impact. The purpose of this box is to share the insights gained from the analysis of 2020 TARGET2 volumes.
In 2020 customer payments accounted for 60% of total TARGET2 traffic in terms of volume, followed by interbank payments (26%), ancillary system payments (8%) and other payments such as central bank operations (6%).
Customer payments traffic increased by 0.99% compared with 2019, driven primarily by higher traffic in Germany (+3.71%). This increase was partially offset by a decrease in Italy (-8.29%). Interbank payments traffic increased by approximately 4.95% compared with 2019 (in 2019 the change was -5.19%). This increase was driven in particular by traffic in France (more than 370,000 payments or +15.34%) and Belgium (about 250,000 payments or + 28.94%). Central bank-related payments showed the greatest relative change with a strong decrease of 7.14%, driven mostly by Germany (-9.82%) and France (-9.98%). It should be noted that in 2020 there were two additional business days compared with 2019.
Chart A
TARGET2 traffic – volume distribution and yearly growth rate for 2020 payments by payment type
(millions: left-hand panel; percentage; right-hand panel)

Sources: TARGET2, ECB calculations.
Ancillary system traffic decreased by 2.28% relative to its level in 2019 (in 2019 the change was +3.07%). The number of payments increased in most countries, with the largest traffic increase taking place in Germany (+0.8% or over 40,000 payments). The overall change was mostly driven by a strong decline in the number of ancillary system payments in Spain (-51.11% or 242,407 payments). This sharp fall in Spain was of a technical nature and was due to an ancillary system switching its settlement procedure.
Overall, there were between 3.8 million and 5 million customer payment transactions per month during 2020. Historically, customer payments exhibit strong seasonal patterns, typically showing a decrease in traffic around April (Easter) and the summer months (August and September), and an increase towards the end of the year. This pattern partially shifted in 2020, with the most noticeable changes coinciding with the outbreak of the pandemic in March 2020. Customer payments recorded high volumes until March, even increasing in the first weeks of COVID-19. In April and May customer payments traffic dropped considerably and did not start to recover until the summer, although it showed the usual seasonality in August. In the fourth quarter of 2020 customer payments stabilised, exhibiting the usual end-of-year peak (see Chart B for the particular patterns observed in 2020). Meanwhile, interbank payments ranged from 1.6 million to 2.1 million transactions per month during 2020 and were affected by a similar trend, although to a lesser extent. Similarly, ancillary systems and operations with central banks were also marginally affected by seasonal and COVID-19 effects.
Chart B
TARGET2 traffic – number of interbank, customer, ancillary system and central bank-related payments per month in 2020
(number of transactions in millions)

Sources: TARGET2, ECB calculations.
The impact of the pandemic on TARGET2 volumes is even more evident when looking at how daily average payments changed on a month-by-month basis compared with 2019 (Chart C). Between April and July, payments across all categories were lower than in 2019, with the partial exception of interbank payments, which appeared more resilient to the impact of COVID-19. The strongest reduction was in customer payments, which dropped by 5.55% in this period. The fall in customer payments was even more pronounced, with a reduction of 7.77%, between April and May, when lockdown measures were implemented in most countries. Ancillary system payments and interbank payments were also affected during the four months from April to July, falling by 4.88% and 0.85% respectively. All of this was reflected in a drop of 4.95% at system level over the four months. The recovery towards the end of the year eventually offset the pandemic’s effect on a yearly basis, as did the strong performance in the first two months of 2020.
Chart C
TARGET2 traffic – year-on-year monthly change in daily averages in 2020

Sources: TARGET2; ECB calculations.
1.3 Interactions between TARGET2 and T2S[15]
T2S is the Eurosystem’s pan-European platform for securities settlement in central bank money, bringing together both securities and cash accounts on a single technical platform.
T2S went live on 22 June 2015, with central securities depositories (CSDs) joining the platform for euro settlement in waves. The final migration wave was completed on 18 September 2017, thus making 2020 the third full year of operations. In addition, on 29 October 2018 Danmarks Nationalbank connected its RTGS and collateral management system, Kronos2, to T2S, so Danish kroner can now also be used to settle the cash legs of securities transactions in T2S. On the same date, VP Securities (a Danish CSD that had already been using T2S for settlement in euro) migrated its Danish kroner settlement to the platform.
Although the accounts are centralised on a single platform, the legal and business relationships of the holders of the securities and cash accounts remain with the CSDs and national central banks respectively. T2S DCAs are opened with the central banks and are used exclusively for the securities settlement business in T2S. Although they are technically held on the T2S platform, euro-denominated DCAs are legally part of TARGET2. Therefore, the rights and obligations of T2S DCA holders are reflected in the TARGET2 Guideline. At the end of 2020 there were 827 active euro-denominated DCAs on the T2S platform.
At the start of each T2S business day, liquidity is sent from TARGET2 to T2S. Towards the end of the day, any remaining liquidity on DCAs is swept back to the RTGS accounts in TARGET2. During the day, liquidity can be freely transferred from TARGET2 to T2S and vice versa.
In 2020 there were an average of 582 inbound liquidity transfers from TARGET2 to T2S and 871 outbound liquidity transfers from T2S to TARGET2 each day.
Chart 10 shows the average cumulative central bank liquidity held in T2S on a daily basis between January and December 2020.[16]
Chart 10
Time distribution of liquidity in DCAs
(EUR billions; daily averages)

Source: TARGET2.
Note: The business day of 12 August is excluded due to the major TARGET2 incident on 11 August, which led to a delayed change of business day on 12 August, thus affecting the timing of liquidity transfers to T2S; the business day of 23 October is also excluded due to a major TARGET2 incident.
In terms of the intraday pattern, liquidity is injected into T2S at the beginning of the TARGET2 night-time phase (19:30 CET) and its level then remains fairly constant until the T2S maintenance window is completed (between 03:00 CET and 05:00 CET). After this, more liquidity reaches T2S and fluctuations occur. There is a spike in the liquidity held in T2S before 16:00 CET, owing to participants sending liquidity to T2S to reimburse auto-collateralisation and to ensure the remaining transactions are settled. At 16:30 CET, the liquidity in T2S decreases sharply as a consequence of the optional cash sweep that brings liquidity back from T2S to TARGET2. The next drop, to zero, is observed towards the end of the business day. This drop is related to the execution of the automated cash sweep from T2S to TARGET2 at 17:45 CET, when all remaining liquidity on DCAs is pushed from T2S back to TARGET2. The optional cash sweep is preferred to the automated cash sweep.
Chart 11 illustrates the daily average value of auto-collateralisation in T2S by month in 2020. Auto-collateralisation is intraday credit granted by a euro area central bank and triggered when a T2S DCA holder has insufficient funds to settle securities transactions.
The average use of auto-collateralisation on stock, i.e. where the credit received from the central bank is collateralised by securities already held by the buyer, remained relatively stable throughout the year. The average daily value was €20.56 billion.
The average usage of auto-collateralisation on flow, i.e. settlement transactions that are financed via credit received from a central bank and collateralised by securities that are about to be purchased, was less stable and peaked at €91.63 billion in November 2020. The average daily value was €82.89 billion.
On average, in 2020, 19.87% of the total value of auto-collateralisation was represented by auto-collateralisation on stock and 80.13% by auto-collateralisation on flow.
Chart 11
Daily average value of auto-collateralisation for euro and Danish kroner activity
(EUR billions)
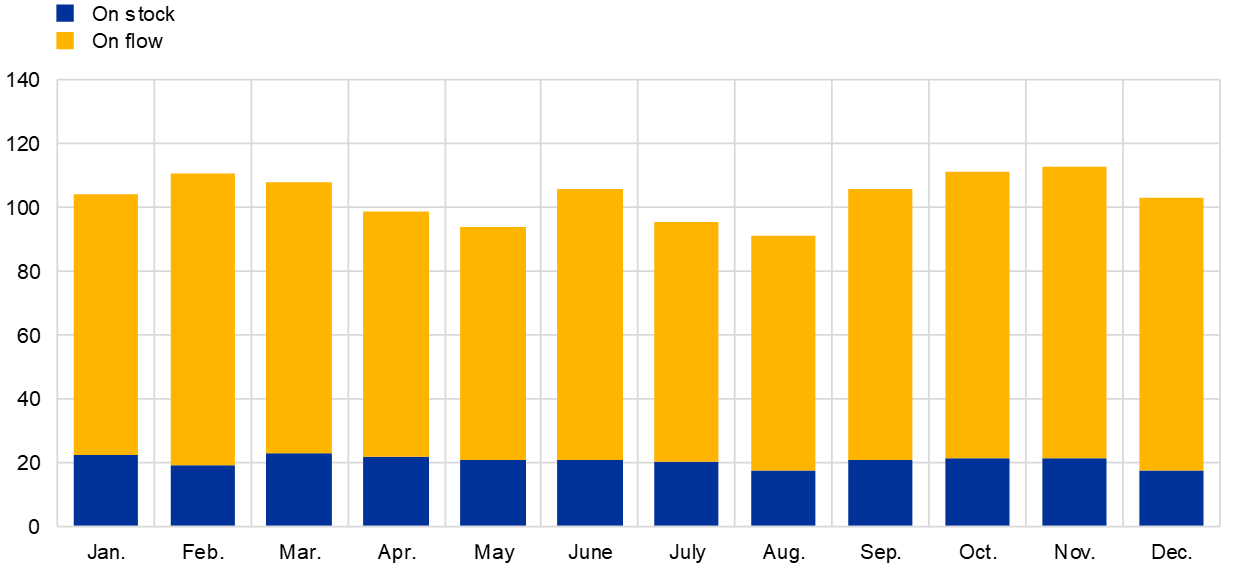
Source: T2S.
Note: Amounts settled in Danish kroner are converted into euro at an exchange rate of EUR 0.13/DKK 1.
1.4 Interactions between TARGET2 and TIPS
TARGET Instant Payment Settlement (TIPS) is a harmonised and standardised pan-European service for the settlement of instant payments in central bank money. TIPS went live on 30 November 2018 with a high capacity and 24/7/365 availability.
TIPS functionalities include the sending and receipt of instant payments, liquidity transfers and recalls of settled instant payment transactions, based on the ISO 20022 standard and in accordance with the SEPA Instant Credit Transfers (SCT Inst) scheme. These instant payments are settled on TIPS DCAs held with the respective national central banks.
Legally, the euro-denominated TIPS DCAs fall within the perimeter of TARGET2, so the rights and obligations of TIPS DCA holders are included in the TARGET2 Guideline. At the end of 2020 there were 58 active euro-denominated TIPS DCAs and 3,944 reachable parties in TIPS.
From its inception, TIPS was designed with multi-currency capability. This means that, on the request of a non-euro central bank, TIPS is able to provide settlement in non-euro central bank money. Following the signing of a cooperation agreement between Sveriges Riksbank and the Eurosystem on 3 April 2020, instant payments in Swedish krona are expected to be settled on the TIPS technical platform supporting the Swedish service RIX-INST as of May 2022.
Box 2
TIPS pan-European reachability measures
On 24 July 2020 the ECB communicated the Governing Council decision to take significant steps to support the full deployment of the pan-European reachability of instant payments, an objective shared with the European Commission. According to the decision, by the end of 2021:
- all payment service providers (PSPs) that are reachable in TARGET2 and that adhere to the SCT Inst scheme shall also become reachable in TIPS, either as a participant or as reachable party;
- automated clearing houses (ACHs) shall migrate their technical accounts from TARGET2 to TIPS.
The implementation of the pan-European reachability measures allows all PSPs that have adhered to the SCT Inst scheme to be reachable across the entire euro area, irrespective of which clearing and settlement mechanism (CSM) they are using for instant payments (i.e. TIPS or an ACH).
The advantages of these measures include the following in particular.
- PSPs will be able to comply with the SEPA regulation: PSPs which have adhered to SCT Inst will be able to comply with their legal obligation to support full reachability, without having to become participants in multiple CSMs.
- Reachability will be made a commodity, reflecting the fact that it is a legal requirement: Not only would TIPS benefit from 100% pan-European reachability, but all ACHs competing in the provision of instant payment services would automatically make this part of their service offer. ACHs would no longer depend on bilateral agreements to establish links, and there would be no potential credit exposure for cross-ACH transactions.
- Liquidity traps will be removed: ACH accounts can be funded and defunded from central bank money accounts in TIPS at any time (24/7/365), in contrast with the current limitations imposed by the opening hours of TARGET2. This also enables liquidity to be moved from one ACH to another without any time limitation, which can be particularly valuable during long weekends.
- The marketplace will be competitive: Each PSP may decide independently (i) where to instruct an instant payment (in an ACH or in TIPS) and (ii) where to hold its liquidity and settle (in an ACH or in TIPS). The choice that one PSP makes in this respect does not condition the choices of other PSPs.
In order to further support the development of the Single Market and SEPA, the pan-European reachability measures are ultimately aimed at enabling European citizens and businesses to give instructions for electronic payments to be made in euro from and to any country in real time, with the confidence that such payments will be settled and will not be rejected because of an inability to reach the beneficiary PSP. This is also a key element supporting the continuous innovation of front-end solutions, which will benefit the euro community and pave the way for instant payments becoming the “new normal”.
To ensure the timely implementation of the measures, the entire Eurosystem, including all national central banks (NCBs) and the ECB will assist the market in its preparations. A dialogue with the market has already been established in different fora including the Advisory Group on Market Infrastructures for Payments (AMI-Pay). To facilitate the on-boarding process, the Eurosystem will continue to collaborate with the market, also taking advantage of the well-established communication channels between NCBs and their national communities.
1.5 Comparison with EURO1
EURO1 is the only direct competitor to TARGET2 among large-value payment systems denominated in euro. Thus, the market share of TARGET2 is defined as its relative share vis-à-vis EURO1, as shown in Chart 12.
The two systems are different by design, since EURO1 operates on a net settlement basis and only achieves final settlement in central bank money (in TARGET2) at the end of the day. Furthermore, they respond partly to different business cases, since only TARGET2 settles individual transactions in central bank money and processes ancillary system transactions and payments related to monetary policy operations.
However, the actual composition of the traffic in the two systems is made up largely of interbank and customer payments. This helps to explain, in part, the relative share of TARGET2 vis-à-vis EURO1, which only takes these two payment categories into account. In 2020 TARGET2 maintained its share in terms of both the value and the volume of payments processed. It processed 90% of the value and 66% of the volume settled by large-value payment systems in euro.
It should be kept in mind that Chart 12 does not give a full picture of the banks’ routing preferences vis-à-vis all systems, but only a partial picture of the market’s preferences in relation to the settlement of large-value euro-denominated transactions. In particular, it does not reflect the extent to which payments are channelled through automated clearing houses (ACHs) or correspondent banking arrangements.
Chart 12
Market share of volumes and values settled in TARGET2 vis-à-vis EURO1
(percentages)

Source: TARGET/Euro LVPS (ECB’s website).
Note: This chart is not affected by the change in the statistical methodology implemented in 2013, since the calculations are based on interbank and customer payments only, and do not include transactions with the central banks, which were most affected by the methodological change.
1.6 Value of TARGET2 payments
Chart 13 shows the evolution of the average value of a TARGET2 payment between 2008 and 2020.[17] The continuous decrease from 2015 to 2017 was largely related to the migration of securities settlement system traffic to T2S.[18] In 2020 the average value of a payment increased slightly to €5.3 million, from €5.0 million in 2019.
Chart 13
Average value of a TARGET2 payment
(EUR millions)

Source: TARGET2.
Chart 14 illustrates the distribution of TARGET2 transactions per value band, indicating the shares, in terms of volume, that fall below a certain threshold. The picture remains similar to that of the previous year. Generally, about 70% of all TARGET2 transactions were for values of less than €50,000. Payments of above €1 million accounted for only 9% of traffic.
Chart 14
Distribution of TARGET2 transactions across value bands in 2020
(percentages)

Source: TARGET2
On average, almost 173 payments with a value of above €1 billion were made per day, accounting for 0.05% of payment flows. Given the wide distribution of transaction values, the median payment in TARGET2 is calculated as €6,660, which indicates that half of the transactions processed in TARGET2 each day are for a value lower than this amount. This figure confirms that TARGET2 offers a range of features attracting a large number of low-value transactions, especially those of a commercial nature. Although the picture has changed slightly since completion of the migration to SEPA, particularly with regard to commercial payments, TARGET2 is still widely used for low-value payments, in particular urgent customer transactions. This is not unusual in the field of large-value payments and is also observed in other systems worldwide. It remains to be seen whether the increased prominence of instant retail payments has an impact on this in the future.
Chart 15
Intraday pattern: average value of a TARGET2 payment
(EUR millions)

Source: TARGET2.
Chart 15 depicts the average value of TARGET2 payments executed at different times of the day. The chart indicates that in 2020, as in previous years, TARGET2 settlement showed a strong intraday pattern. After the system opens at 07:00 CET, the hourly average value of transactions fluctuates minimally throughout the day. Between 09:00 CET and 13:00 CET, the average value increases slightly owing to the settlement of CLS and other ancillary system transactions. A more visible increase is recorded between 16:00 CET and 17:00 CET relating to an optional cash sweep from T2S DCAs to TARGET2 and ancillary systems such as EURO1 settling their cash balances in TARGET2. The last hour of operations, between 17:00 CET and 18:00 CET, is reserved for interbank transactions, while the cut-off time for customer payments is 17:00 CET. The average size of payments increases dramatically at this time, owing to banks squaring their balances and refinancing themselves on the money market. Overall, the last two hours of the TARGET2 operation are characterised by a limited number of transactions, albeit at very high values.
The average payment value in 2020 during the last TARGET2 opening hour continued its downward trend and was 25% lower than in 2019. In 2020 the average payment was a further 27% lower than in 2019. This trend most probably stems from excess liquidity conditions in the market.
The chart does not take into account payments that take place before the start and after the end of the business day, since these transactions fall under the night-time settlement category (Section 1.7) and relate strictly to accounting practices, for example liquidity transfers from the local accounting systems of central banks or the fuelling of sub-accounts as well as T2S DCAs.
1.7 Night-time settlement in TARGET2[19]
TARGET2 operates during the day from 07:00 CET to 18:00 CET, and also offers the possibility of settling payments during the night. Although the system is open for regular payments from financial institutions and ancillary systems during the day-trade phase, night-time settlement is only for ancillary systems connecting via the Ancillary System Interface (ASI), as well as for liquidity transfers to/from T2S and TIPS. Other operations, such as bank-to-bank transactions or customer payments, are only allowed during the day.
There are two night-time settlement windows: 19:30 CET to 22:00 CET and 01:00 CET to 07:00 CET. The two windows are separated by a technical maintenance window, during which no settlement operations are possible.
Since the system is closed during the night to any other form of payments processing, ancillary systems can take advantage of banks’ stable and predictable liquidity situations, thereby settling their transactions efficiently and safely. In general, the night-time windows are used mainly by retail payment systems. In 2020 on average around 1,800 payments, representing a value of €17 billion, were settled every night in TARGET2. This constitutes an increase of about 18% both in terms of value and volume of payments compared with 2019. This increase was partly related to the liquidity transfer supporting the settlement of instant payments and banknote operations in Spain.
Chart 16 shows how the volumes and values settled in TARGET2 during the night have evolved since 2009. The increase in volume in November 2011 resulted from the SEPA Clearer ancillary system starting to make use of the night-time settlement service in TARGET2. Thereafter, the number of payments settled at night increased steadily, notably in 2014, whereas values remained fairly stable. The trend reversed in 2015, with night-time settlement values and volumes decreasing continuously. As indicated above, the changes in the night-time settlement pattern in this period can be attributed primarily to securities settlement systems that had migrated their operations to T2S. Since December 2018 night-time settlement values and volumes have reached historically low levels because some ancillary systems’ TARGET2 night-time settlement activity has moved to the day-trade phase.
Chart 16
Night-time settlement in TARGET2
(left-hand scale: number of transactions; right-hand scale: EUR billions)
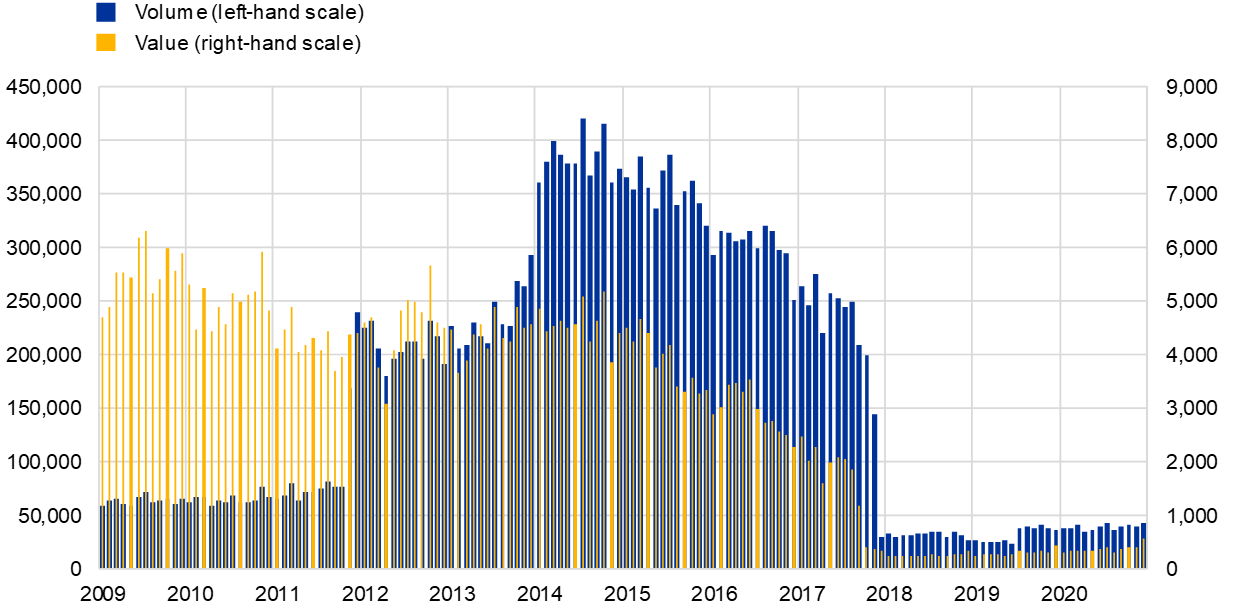
Source: TARGET2.
1.8 Payment types in TARGET2
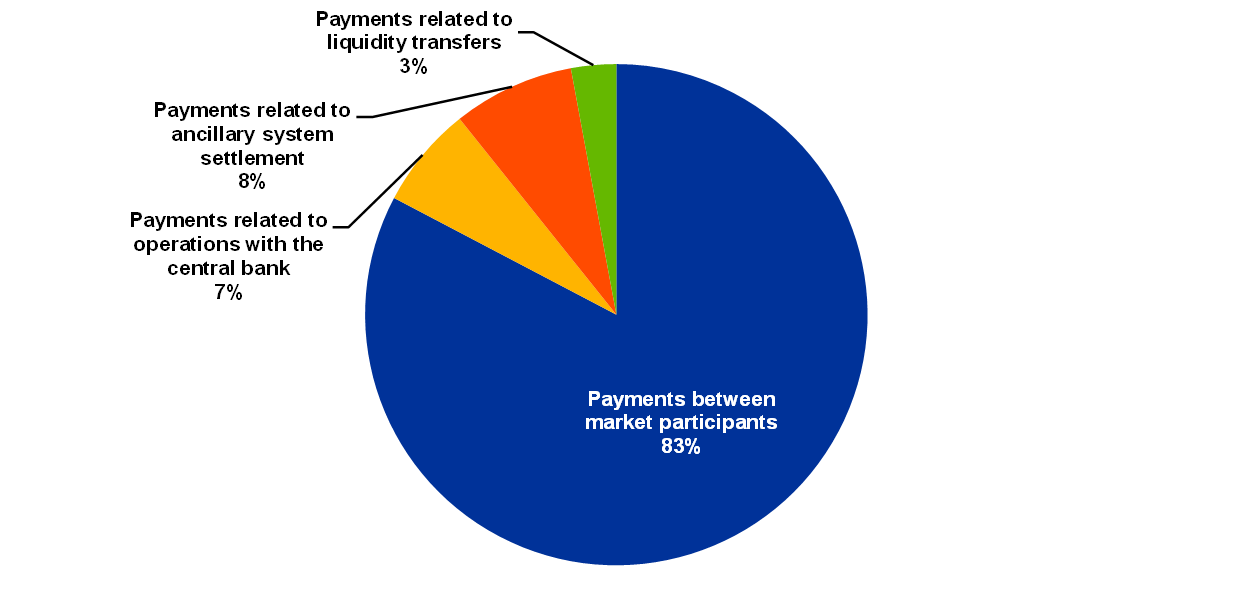
Charts 17 and 18 present a breakdown of TARGET2 volumes and turnover by type of transaction. Traffic is divided into four categories: payments to third parties (for example interbank transactions and customer transactions), payments related to operations with the central bank (such as monetary policy operations and cash operations),[20] ancillary system settlement, and liquidity transfers between participants belonging to the same group.
About 83% of the TARGET2 volume is made up of payments to third parties, i.e. payments between market participants. The volume of ancillary system settlement represents 8% of the total volume, while 7% is generated through operations with the central bank and the remaining 3% is linked to liquidity transfers. Overall, these figures remained similar to those for the previous year.
Chart 17
Breakdown of TARGET2 volumes in 2020
(percentages)
Source: TARGET2.
Chart 18
Breakdown of TARGET2 turnover in 2020
(percentages)
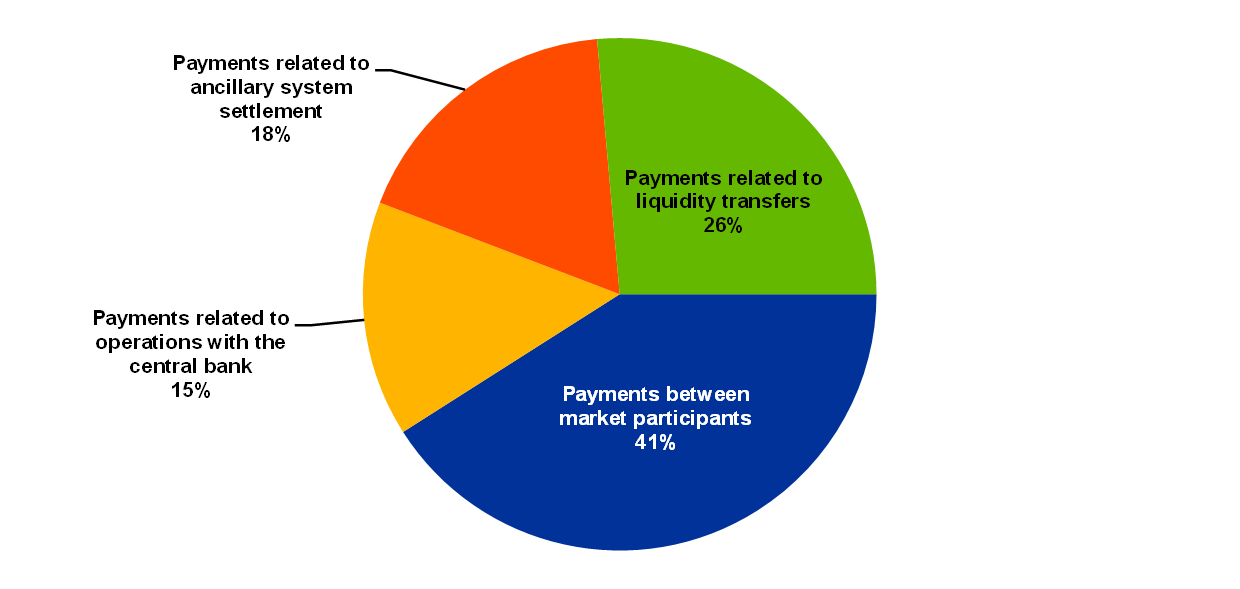
Source: TARGET2.
With regard to turnover, payments between participants represent only 41% of total value. The value of ancillary system settlement represents 18% of the total volume, 15% is generated through operations with the central bank and the remaining 26% is linked to liquidity transfers. Overall, these figures remained similar to those for the previous year.
The difference between the volume-based and the value-based indicators across payment categories stems from the fact that the average sums involved in monetary policy transactions, ancillary system instructions and liquidity transfers are typically much larger than payments to third parties.
Box 3
The impact of Brexit on TARGET2
As part of the Brexit process[21], participants based in the United Kingdom with direct access to TARGET2 had to assess whether their access model needed to change.[22] Credit institutions established in the European Economic Area (EEA) are eligible to connect directly to TARGET2, while credit institutions established outside the EEA may only connect to the system through a branch in the EEA, subject to the provision of a satisfactory country opinion demonstrating no significant conflict of laws could arise.[23] Consequently, UK institutions with no branch or subsidiary in the EEA or with only a branch established in the EEA had to reconsider their access model. Three options were available to them: (1) establish a branch in the EEA and obtain a satisfactory country opinion; (2) establish a subsidiary in the EEA; or (3) close their TARGET2 account. If they decided to terminate their direct participation, they could still participate indirectly in TARGET2 using correspondent banking arrangements. Participants based in the United Kingdom started to reconsider their access to TARGET2 from March 2017, while adjustments took place until the end of 2020.
Before Brexit, UK institutions connected directly to TARGET2 via seven TARGET2 national components: Germany, Spain, France, Ireland, Italy, Luxembourg and the Netherlands. Direct participation was concentrated in four out of the seven locations: Germany – in 2017 UK banks contributed on average 24.4% of the total payments value of the German TARGET2 component and 23.6% of the central bank reserves[24] held by banks in the German TARGET2 component, France – 2.0% and 7.7% respectively, Luxembourg – 0.9% and respectively 5.7% and the Netherlands – 28.8% and 5.3% respectively. By 2020 those UK-based banks which were participating directly in TARGET2 in 2017 had diminished their weight in these TARGET2 components. More specifically, the share held by these banks in the central bank reserves held by the respective jurisdictions decreased, reaching on average 13.6% in Germany, 6.0% in France, 4.5% in Luxembourg and 0.7% in the Netherlands.[25] In terms of payments value, the shares decreased to 7.4% in Germany, 1.4% in France and 0.1% in the Netherlands, while slightly increasing to 1.5% in Luxembourg. The most significant changes in the direct participation of UK banks were thus observed in Germany and the Netherlands. In addition, as of 2020 Belgium became a new point of access for UK-based banks.
All in all, following Brexit, the overall payments value processed in TARGET2 has remained broadly unchanged. At the same time, Brexit may have had an impact on the relative distribution of central bank reserves across the TARGET2 national components. The German TARGET2 component decreased its share of the overall holdings of central bank reserves in TARGET2 by 4.0 percentage points compared with 2017, reaching 25.8% in 2020, the Dutch share by 2.1 percentage points to 11.1%, while the French share increased by 1.1 percentage points to 27.0%.[26] However, these figures do not solely reflect the impact of Brexit, but are rather the result of several factors, such as the introduction of the two-tier system for the remuneration of excess liquidity in October 2019.[27]
1.9 The use of prioritisation
Priority options help TARGET2 participants optimise their liquidity usage by allowing them to reserve a certain amount of liquidity for specific payment priorities. When submitting payments in TARGET2, participants can assign them a certain priority: “normal”, “urgent” or “highly urgent”. In general, payments are settled immediately on a “first in, first out” basis, as long as sufficient liquidity is available in the participant’s RTGS account. However, if this is not the case, payments that cannot be settled immediately are queued according to priority. Participants can reserve a set amount of their liquidity for the priority classes “urgent” and “highly urgent”, and less urgent payments are made when excess liquidity is sufficient. This is a way of securing liquidity for more urgent payments. The priorities for pending transactions can be changed at any time via the information and control module (ICM).
Chart 19 gives an overview of the use of priorities in TARGET2 in 2020 in terms of the overall TARGET2 volume. It shows that 85% of transactions were assigned as having a “normal” priority, 9% as “highly urgent” and the remainder as “urgent”. The distribution of the use of the priorities when submitting payments to TARGET2 has remained stable over the years.
Chart 19
Use of priorities in TARGET2 in 2020

Source: TARGET2.
1.10 Non-settled payments
Non-settled payments in TARGET2 are transactions that have not been processed by the end of the business day owing to, for example, erroneous transactions made by participants, a lack of funds in the account to be debited, or a sender’s limit being breached. The transactions are, ultimately, rejected. Chart 20 shows the monthly evolution of the daily average of non-settled payments in terms of both volume and value between 2009 and 2020.
In 2018 the average daily number and value of non-settled transactions decreased sharply driven mainly by the migration of one of the securities settlement systems to T2S at the end of 2017. As a result of its gross settlement model, some of its transactions were rejected, owing to either liquidity shortage or cancellation, and reported as non-settled TARGET2 payments. As in 2019, the average daily number of non-settled transactions in 2020 remained low at 254. The average total value of these transactions also remained stable at €2.2 billion in 2020.
Chart 20
Non-settled payments in TARGET2
(left-hand scale: number of transactions; right-hand scale: EUR billions)

Source: TARGET2.
Overall, non-settled payments in 2020 represented less than 0.1% of the total daily volume and about 0.1% of the total daily turnover in TARGET2. The levels may be considered very low and confirm that liquidity was appropriately distributed across participants throughout that period.
1.11 Use of credit lines in TARGET2
The intraday credit line is a facility in TARGET2 through which banks can overdraw their intraday account against eligible collateral. The average maximum intraday credit line at participant level remained broadly unchanged compared with the previous year, standing on average at €2.1 billion. At the same time, its usage decreased, with 3.3% of the payments settled using the intraday credit line in 2020, compared with 5.0% in 2019 (Chart 21). This decrease has been observed since the start of the ECB’s asset purchase programme (APP). Throughout 2020 it was further supported by the additional stimulus provided by the Eurosystem in response to the COVID-19 pandemic. With more central bank reserves available on their TARGET2 accounts, participants are less reliant on their intraday credit line.
Chart 21
TARGET2 intraday credit line and its usage
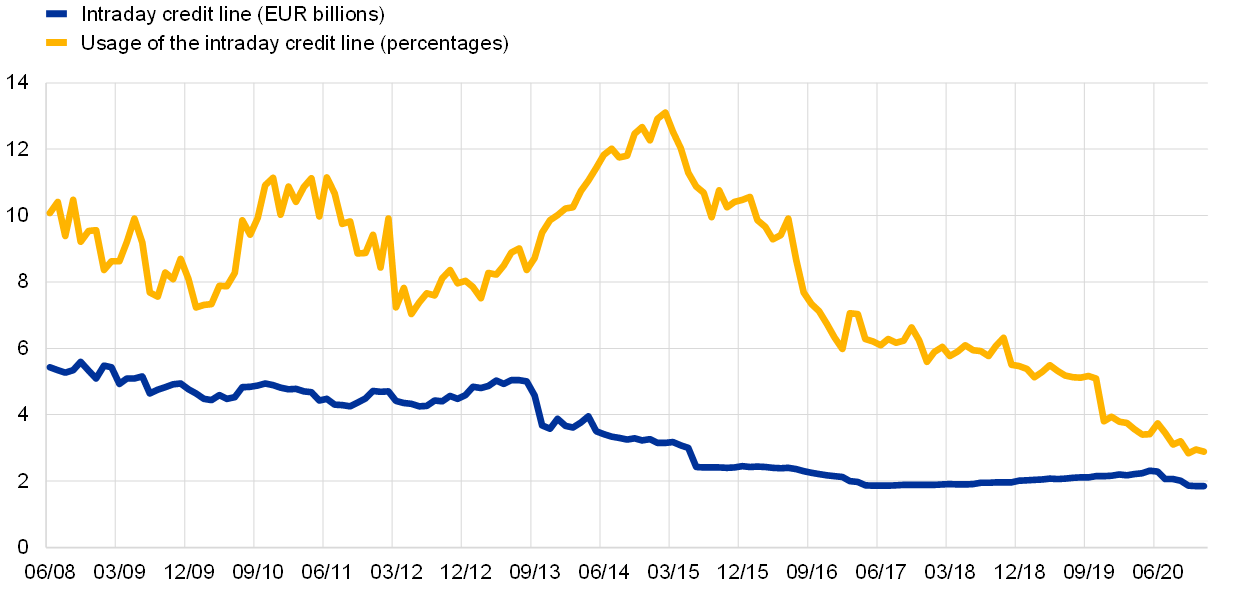
Source: TARGET2.
Notes: The chart covers the period from June 2008 to December 2020. Figures represent monthly averages. The intraday credit line is calculated as the maximum intraday credit that can be accessed, on average, by one bank during the day against collateral posted. The usage of the intraday credit line represents the percentage of payments that are settled using the intraday credit line. Calculations exclude TARGET2 accounts that do not have an intraday credit line set and follow McAndrews, J. and Rajan, S., “The timing and funding of Fedwire Funds transfers”, Economic Policy Review, Federal Reserve Bank of New York, 2000.
1.12 Share of inter-Member State traffic
The share of inter-Member State traffic in TARGET2 indicates the percentage of traffic that is exchanged between participants belonging to different banking communities. Chart 22 shows that there has been a positive trend for both volume-based and value-based indicators since 2009. This trend reflects the increasing level of financial integration in the large-value payment segment, which is mainly supported by TARGET2. While this trend continued in 2020, with the share reaching 47% in volume, it decreased slightly in value to 44%.
Chart 22
Share of inter-Member State traffic in TARGET2
(percentages)

Source: TARGET2.
When analysing these data, it should be borne in mind that whether a payment is sent or received by a given banking community may depend more on a bank’s internal organisation than on its actual geographical domicile. For example, a subsidiary of a French bank, located in Italy, because of its internal organisation, may send TARGET2 payments to another bank, also located in Italy, via its headquarters in France. In this case, the payment flow will be considered to be cross-border, even though the payment is taking place between two entities located in the same country. By contrast, banks located in European Economic Area (EEA) countries whose central banks do not provide TARGET2 services, such as the Czech Republic or Sweden, can participate in TARGET2 component systems provided by other central banks. For example, if a Swedish bank participating in TARGET2-Bank of Finland sends TARGET2 payments to banks in Finland that also participate in TARGET2-Bank of Finland, the payment flows will be considered to be domestic, even though they are taking place between entities located in different countries.
The inter-Member State payments depicted in Chart 22 were identified based on the national banking communities of the sending and receiving direct participants on the platform. Since it is also possible to connect to TARGET2 from a non-EEA country, for example as an indirect participant or an addressable BIC holder, changes in the cross-border share in terms of volume were also computed on the basis of the originator and the beneficiary of the payment, taking into account the full payment chain information (i.e. originator, sending settlement bank, receiving settlement bank and beneficiary). When calculating the inter-Member State shares based on the originator and beneficiary of the payment, the share of cross-border payments in 2020 amounted to 60% in terms of volume and 40% in terms of value. Therefore, taking the full payment chain into account leads to a cross-border share that is significantly higher in volume but lower in value.
Box 4
Strengths of liquidity-saving mechanisms in TARGET2
Real-time gross settlement (RTGS) systems like TARGET2 settle transactions on an individual basis and can be liquidity-intensive for their participants. To reduce the liquidity needs and support liquidity management, TARGET2 offers its participants a combination of customer services and in-built instruments that include, inter alia, priorities, reservations, timed payments, as well as highly advanced offsetting and queue management algorithms, also known as liquidity-saving mechanisms (LSMs). LSMs in TARGET2 aim to optimise the liquidity usage in the system and improve its settlement capabilities. They are composed of a combination of event-driven and time-driven settlement algorithms that work either by offsetting payments after they enter the system or by optimising the queuing facility.
The Eurosystem has recently performed an analysis in order to better understand the performance of LSMs and their ability to effectively support the settlement capacity of the system. By using the TARGET2 Simulator[28], “what-if” scenarios, in which the TARGET2 settlement logics were altered by removing one or more LSMs, were analysed. Four different scenarios were selected, starting from a scenario close to a plain RTGS system (i.e. no LSM) and progressively reintroducing LSMs (bilateral and multilateral offsetting, and partial and multiple queue optimisation). This allowed the effectiveness of the individual algorithms to be tested. End-of-day settlement levels in the simulated scenarios were then compared to the results obtained under normal TARGET2 parameters in order to assess the impact of LSMs on settlement in TARGET2. The analysis covered the period from 2014 to 2019 to account for different liquidity levels in the system.
Chart A shows the average increase in the share of unsettled transactions at the end of the day in the simulated scenarios in terms of value and volume. In general, and somehow quite logically, removing the LSM leads to higher unsettled payments in TARGET2 in most of the periods under analysis. However, the change is rather limited, with additional unsettled payments remaining in a range well below 1% of the daily average TARGET2 traffic both in terms of value and in volume. For almost all years, the most severe changes in terms of deviations from the benchmark are observed for Scenario 1, which is the closest to a pure RTGS system. In value terms, the increase in unsettled payments ranges between 0.18% and 0.57% of the daily average TARGET2 traffic (excluding 2018), corresponding to a daily average value of unsettled payments of €10.5 billion. In volume terms, the impact appears to be slightly more pronounced and in line with the severity of the scenarios, with unsettled payments increasing between 0.35% and 0.59% of the daily average TARGET2 transactions (1,721 payments per day on average). As the configured system becomes closer to the TARGET2 set-up and the LSMs are re-introduced, settlement capacity improves and unsettled payments decline, especially with bilateral and multilateral offsetting (Scenario 2), and multiple optimisation (Scenario 4). Both volume and value indicators show low signs of a relation between the level of settlement deterioration in the scenarios across years and the liquidity available in TARGET2, except for the first two years analysed, for which the impact of the most constrained scenario is stronger in value.
Chart A
Unsettled transactions in terms of value (left panel) and in terms of volume (right panel) by scenario
(percentages)

Sources: TARGET2, Eurosystem calculations.
LSMs should not only reduce the level of unsettled transactions, but also smooth settlement by increasing settlement speed and reducing queuing times. Therefore, the effect of removing algorithms on settlement times is also analysed by comparing the average queuing time in the different scenarios (Chart B). The average daily queuing time at system level increases in all scenarios, in particular in the pure RTGS system scenario (Scenario 1). The impact is consistent with the severity of the constraints imposed. For example, in 2017 the median of the daily queuing time in Scenario 1 increases to 5.7 minutes compared with 3 minutes in the benchmark simulation, while in Scenario 2 it stands at 4.2 minutes. In line with the previous results, improvements are more pronounced when re-introducing offsetting and multiple optimisation algorithms. Scenario 4 leads to results very similar to those in the benchmark simulation. The relation with overall liquidity levels in the system appears to be quite weak, except for in the past two years, for which the average speed of settlement marginally increases across all scenarios.
Chart B
Queuing time of customer and interbank payments
(minutes)

Sources: TARGET2, Eurosystem calculations.
Notes: The indicator is calculated taking into account all payments with all settlement statuses – directly settled, queued, unsettled. Unsettled payments enter the calculation with a queue time until their respective cut-off time. The box displays the 25th, 50th and 75th percentiles, whereas the whiskers mark the minimum and maximum observations within the 25th/75th percentile ± 1.5 times the interquartile range.
The study confirmed that LSMs in TARGET2 support the efficient use of liquidity and improve the settlement performance of the system. As the algorithm configuration comes closer to the TARGET2 set-up, settlement efficiency improves: the share of unsettled payments tends to decline and queuing times are reduced. This holds true, in particular, for bilateral and multilateral offsetting and for multiple optimisation algorithms. At the same time, the impact of these features on settlement levels is marginal. This can be explained by the fact that, first, LSMs process a small amount of TARGET2 payments. Second, the liquidity levels in TARGET2 have been extremely high owing to the accumulation of excess liquidity especially for the last few years of analysis. This suggests that, while settlement in TARGET2 may also have worked well without the inclusion of liquidity-saving algorithms, the latter provide an important buffer against possible future changes of conditions. Algorithms are proven to be effective in increasing settlement efficiency in TARGET2 without any additional measures being taken by participants, including in current liquidity conditions. It is also expected that their role in improving settlement efficiency would be more pronounced in the event of a significant change in liquidity conditions. The future T2 system will offer a similar type of LSM, thus continuing to support liquidity-saving and optimisation for participants.
1.13 Tiering in TARGET2
Tiered participation arrangements occur in a payment system when a direct participant of that system provides services that allow other participants to access the system indirectly. The indirectly connected participants benefit, in turn, from the clearing and settlement facility services offered by direct participants.
While indirectly connected parties, i.e. indirect participants and addressable BIC holders, benefit from the settlement facility that would otherwise be costly to access directly, these types of arrangement also entail risks. Tiered participation arrangements can create dependencies that may lead to overall credit, liquidity or operational risks for the payment system, its participants or the stability of the banking system. Close monitoring of the tiering level in TARGET2 is thus of paramount importance. It is also an oversight requirement under Article 17 of the SIPS Regulation.[29]
The image below shows the map of TARGET2 flows based on the location of the payment originators and final beneficiaries. This shows that, when considering the institutions at both ends of the payment chain, TARGET2 has global reach.
Figure 1
TARGET2 transfers based on the locations of the originator and final beneficiary banks

Source: TARGET2.
In 2020 the aggregate level of tiering on the sending side in TARGET2 reached around 6.59% in terms of value and 22.58% in terms of volume (Chart 23). This meant that, on average, for every euro sent by direct participants in TARGET2 during the year, only 6.59 cents were settled on behalf of indirectly connected parties outside their banking group perimeter. More than 75% of the tiered business (consolidated at banking group level) comes from outside the EEA, showing that TARGET2 makes it possible for institutions around the world to access the euro market.
Chart 23
Tiering by sender in TARGET2
(x-axis: ten-day moving averages; y-axis: percentages)

Source: TARGET2.
The largest indirect participant in terms of value sent (consolidated at banking group level) was ranked approximately 40th out of all TARGET2 participants in 2020.
Further analysis reveals that 59.27% of all direct participants in TARGET2 (consolidated at banking group level) did not conduct any business during the year on behalf of indirect parties. Overall, these statistics for 2020 point to a relatively stable and contained level of tiered participation in TARGET2.
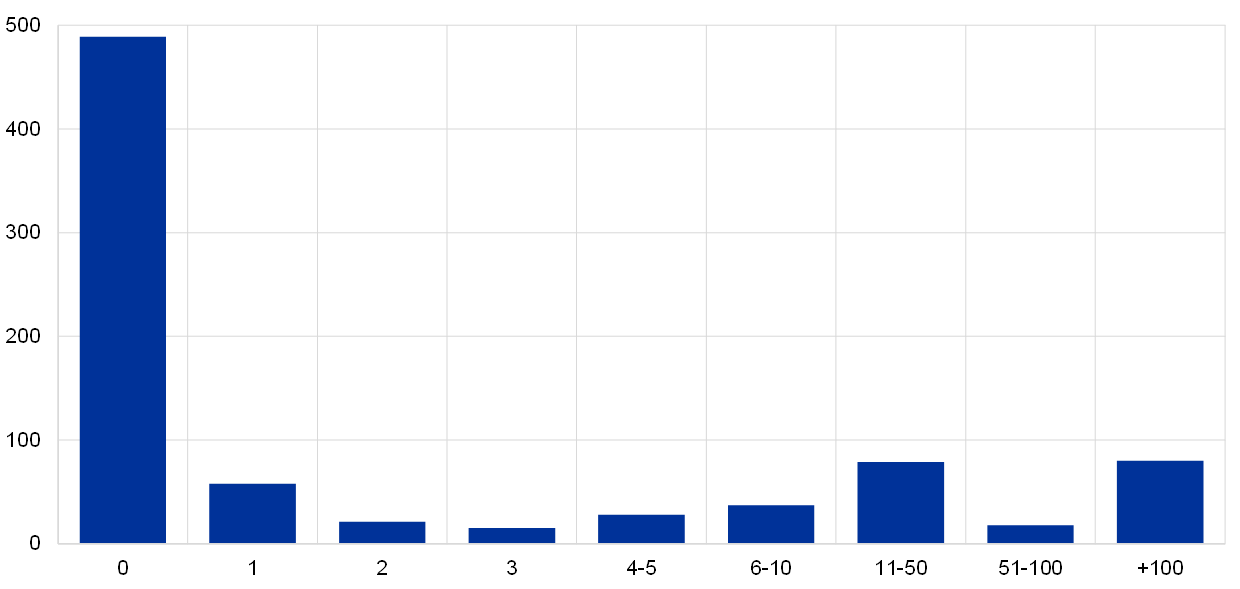
In more detail, Chart 24 shows that around 489 direct participants do not send or receive any tiered payments while 58 send or receive payments on behalf of only one tiered banking group. At the other end of the spectrum, around 80 direct participants act as a settlement bank for more than 100 tiered banking groups.
Chart 24
Tiered groups per direct participant group
(x-axis: tiered participants; y-axis: direct participants)
Source: TARGET2.
1.14 Money market transactions in TARGET2
Market participants use TARGET2 for settling unsecured money market transactions in central bank money. By applying the Furfine algorithm[30] it is possible to identify TARGET2 transactions which are related to money market loans, or, more precisely, to the unsecured overnight money market.[31] This unique dataset is updated regularly to obtain the latest information about the money market. Overall, TARGET2 transaction data provide a rich source of information for both the analysis of monetary policy implementation and TARGET2 operations. The importance of the money market is thus twofold: (i) it is an important vehicle for the redistribution of liquidity among TARGET2 participants, and (ii) it is a large-value and time-critical area of business that the operator needs to be aware of, in particular when dealing with abnormal situations.
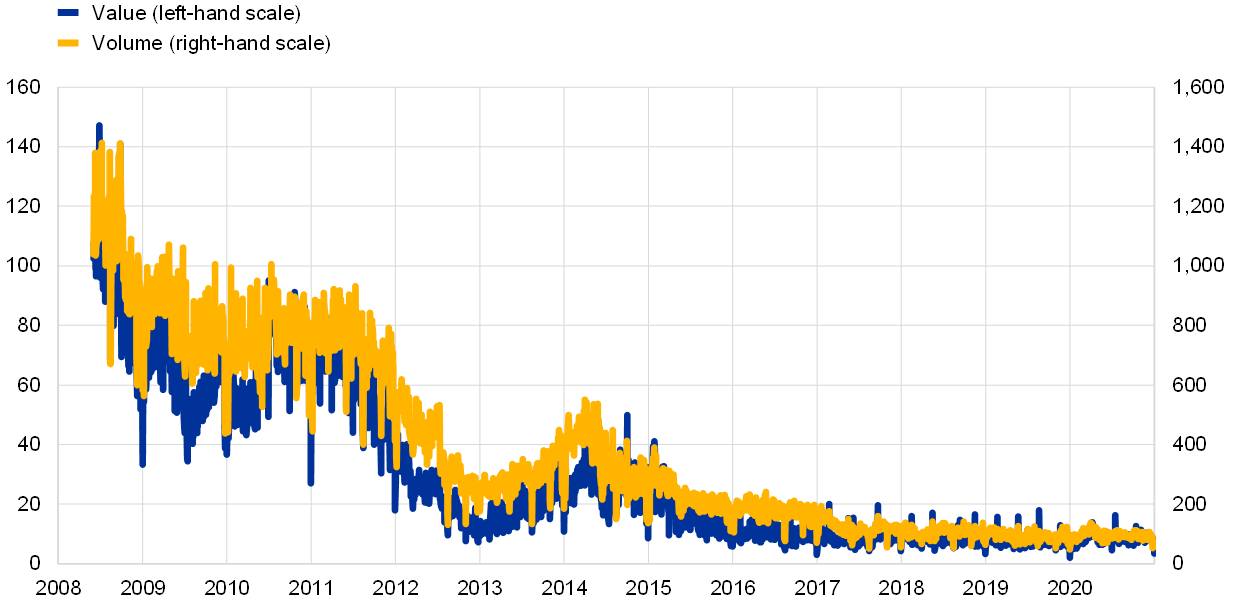
The dataset has been developed using the TARGET2 Simulator environment and comprises data from June 2008 onwards.[32] In 2020 around 24,500 money market loans, with a total value of about €2.19 trillion, were identified. Overall, the amount of unsecured funds traded on the overnight market remained at low levels compared with the period before the financial and sovereign debt crises. However, activity was higher in 2020 compared with 2019 (Chart 25). Activity increased during the market tensions following the COVID-19 outbreak in March, but then decreased from the second half of April amid the ECB’s response to the pandemic.
Chart 25
Unsecured overnight money market activity in TARGET2
(left-hand scale: daily totals, EUR billions; right-hand scale: number of transactions)
Source: TARGET2.
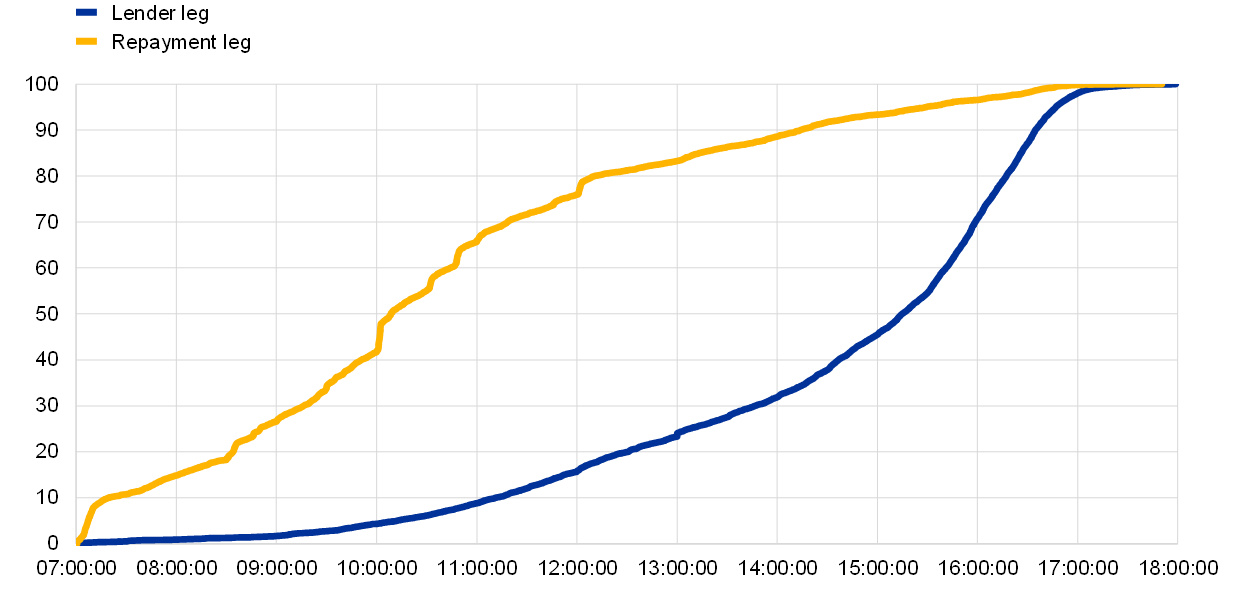
Chart 26 complements this analysis by showing the cumulative distribution in value of all money market transactions across the day in 2020. On the lending leg, 50% of the total value is settled by around 15:15 CET, while 98% is settled by around 17:00 CET. This confirms the assumption that the last few hours of TARGET2 operations are particularly important for the interbank market. In terms of repayment, three-quarters of the loans are repaid by around 11:50 CET and 90% by around 14:15 CET. These patterns ensure that the repaid liquidity can be reused for payment purposes later that day.
Chart 26
Cumulative distribution of money market transactions during the day in terms of value
(x-axis: time of day; y-axis: percentages)
Source: TARGET2.
Note: The business days of 11 August and 23 October 2020 are excluded in light of two major TARGET2 incidents.
1.15 Shares of national banking communities
The following two charts break down TARGET2 volumes and turnover according to the share of the biggest national banking communities contributing to its traffic.
Chart 27
Country contributions to TARGET2 volume

Source: TARGET2.
Chart 28
Country contributions to TARGET2 value

Source: TARGET2.
In terms of volume, in 2020 similar to previous years, the largest contributor to TARGET2 traffic was Germany, which accounted for more than half of the transactions settled in the system. Adding France, Italy, Spain, the Netherlands and Belgium, the share of transactions increases to 89%, which is on a par with previous years. The shares of the biggest contributors to the TARGET2 volume remained stable.
With regard to turnover, Germany is the main contributor, followed by France, the Netherlands and Luxembourg. The top four countries by turnover generated over three-quarters of the total value settled in TARGET2 in 2020. The concentration of turnover remained stable compared with the year before.
It should be noted that the high concentration of both TARGET2 values and volumes in certain countries is not only the result of the size of particular markets. It can also be attributed to the fact that, since November 2007 the TARGET2 system has allowed the activities of banking groups to be consolidated around a single RTGS account held by the group’s head office, thereby increasing the concentration in countries where a large number of these groups are incorporated.
1.16 Pattern of intraday flows
Chart 29 shows the intraday distribution of TARGET2 traffic, i.e. the percentage of daily volumes and values processed at different times of the day in 2020. This indicator is important for the operator of TARGET2 as it represents the extent to which settlement is evenly spread throughout the day or concentrated at certain peak times. Ideally, the value/volume distribution should be as close as possible to linear to avoid liquidity and operational risk.
Chart 29
Intraday distribution of TARGET2 traffic in 2020
(x-axis: time of day; y-axis: percentages of daily volumes and values)

Source: TARGET2.
In terms of value, the path is typically very close to a linear distribution, indicating an even spread throughout the day, which in turn ensures the smooth settlement of TARGET2 transactions.
In terms of volume, the curve is well above the linear distribution, with over one-fifth of transactions being submitted to the system within one hour of the start of operations –including transactions sent during the night by participants and warehoused payments – and almost half submitted within three hours of the start. By one hour before the system closes, almost 100% of the TARGET2 volume has already been processed. A comparison with previous years shows no significant deviations.
Box 5
Payment profiles of TARGET2 participants
In a real-time gross settlement (RTGS) system set-up like TARGET2, participants submit payments throughout the day, thus leading to the emergence of intraday patterns. The intraday payment behaviour of participants is a very important feature. It needs to be monitored by the Eurosystem in order to facilitate quantifying and assessing risks, for example in the event of a liquidity shortage or free-riding behaviour and to identify deviations that may indicate abnormal situations requiring specific follow-up, such as an operational outage or anomalous payments.
A clustering methodology has been recently developed[33] to identify groups of large TARGET2 participants with similar payment behaviours. Several factors characterise the payment behaviour of a participant, such as the timing of the submission, the value, the beneficiary and the payment type. As participants can influence the timing at which payments are sent but usually not their value, the timing of transactions is the most relevant factor from an intraday behaviour perspective and was thus used to build the clusters. The exercise considered the timing of the payments submitted in 2020 by the top 200 TARGET2 participants, all of which were credit institutions. These participants alone made up 95.8% of the system’s volume and 77.3% of its turnover. Furthermore, only transactions that are initiated by participants themselves[34] are considered.
Different groups of participants exhibit relatively homogenous intraday payment patterns, making it possible to identify nine payment profiles[35] based on the results of the clustering exercise (Chart A). Overall, these profiles clearly define different payment behaviours. While the majority of participants initiated the bulk of their transactions within the first hour of operation of TARGET2 (defined as Early or Extreme Early Birds), only a few participants entered a significant number of their transactions in TARGET2 in the second half of the day (defined as Late Payers). Looking more closely at the daily intraday payment behaviour, it turned out that participants were assigned to payment profiles that differ from their predominant profile on different days. However, this was limited to a small number of days, with the exception of a few participants that seemed to change their payment behaviour daily.
Chart A
Intraday payment behaviour of TARGET2 participants by payment profile in 2020
(x-axis: TARGET2 business hours; y-axis: percentages; yearly average relative share of transaction volume)
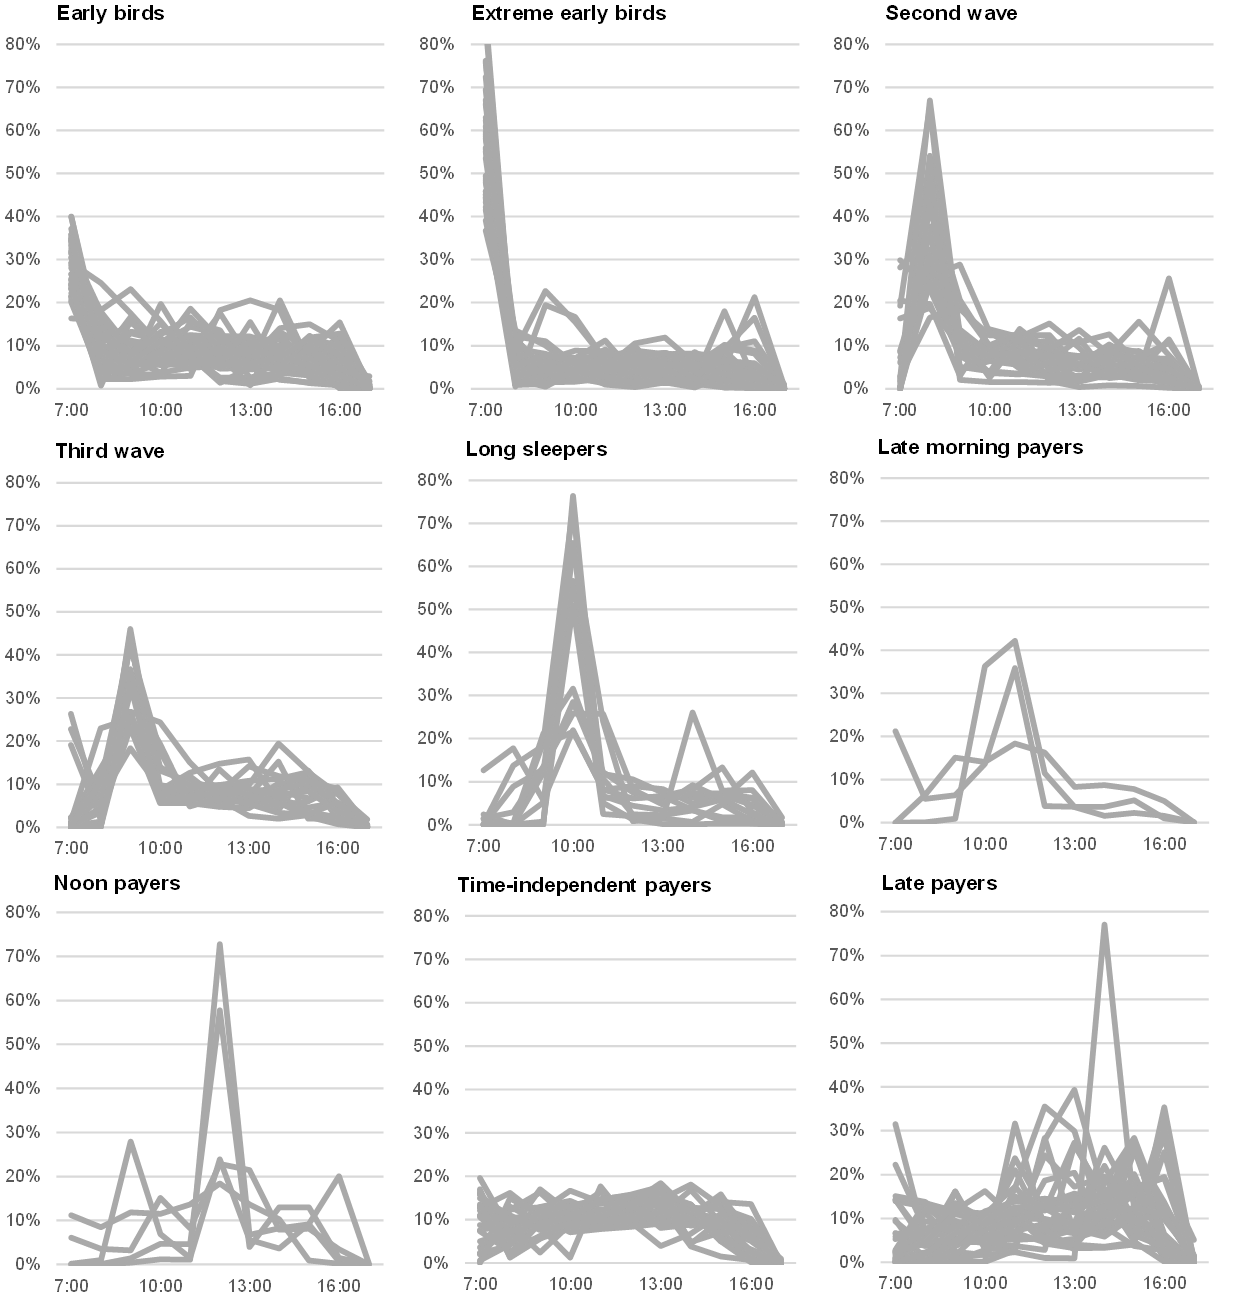
Source: TARGET2.
Going forward, the relationships between the participants in the different profiles and the factors influencing the payment behaviour of the participants, such as liquidity levels, location or traffic composition, could be explored. In addition, the deviations of participants from their predominant profile could be analysed in more detail. This will allow regular deviations to be distinguished from occasional ones that might indicate an abnormal situation.
This analysis is part of an effort to gain an understanding of the payment behaviour of TARGET2 participants. In general, this helps better identify, quantify and mitigate risks in payment transactions. Additionally, it allows for the assessment of risk and potentially the development of early warning indicators.
2 TARGET2 service level and availability
In 2020, 99.58% of all payments settled in the payments module of TARGET2 were processed in less than five minutes. This indicator was at its lowest level since the inception of TARGET2. However, this was not due to an overall deterioration of TARGET2 service levels, but related to three major incidents that took place in 2020. By contrast, this figure stood at 100% in 2019.
While service delivery times and payment processing times generally remained stable in 2020, they were impacted by three major TARGET2 incidents (Box 6). The Eurosystem strives to achieve a high performance level of TARGET2’s SSP. An excellent performance is very advantageous for the banking community, particularly for its real-time liquidity management.
Payment processing times are measured for all the payments settled in TARGET2, with the exception of the following: ancillary system settlement transactions using the ASI, payments settled during the first hour of operations (see below on the “morning queue effect”), and payments that have not been settled owing to a lack of funds or a breach of limit. In practice, around 30% of all TARGET2 payments fall into these three categories of exceptions, meaning that the statistics on processing times apply to around 70% of the system’s traffic.
With regard to requests or enquiries, 99.97%[36] were processed in less than one minute and only 0.03% in one to three minutes, with levels remaining the same as in 2019.
Chart 30 helps to better quantify the system’s performance by showing the distribution of processing times on the SSP, i.e. the percentage of traffic with a processing time below a certain number of seconds. The reference point taken is the peak day of the year recorded by the SSP, namely 30 June 2020, when 501,979 payments were settled. The chart shows that on this day 50% of transactions were settled within 26 seconds and 90% within 38 seconds, thereby confirming the system’s high level of performance.
Chart 30
Processing times on 30 June 2020, excluding the first hour
(x-axis: seconds ; y-axis: percentages)

Source: TARGET2.
A specific phenomenon worth reporting in the context of TARGET2 performance is the “morning queue effect”. When TARGET2 starts daylight operations at 07:00 CET, a large number of transactions (about 20% of the daily volume on peak days) are already waiting for settlement, corresponding either to payments submitted by banks on previous days with a future value date (i.e. “warehoused payments”) or to payments released by banks via SWIFT in the hours preceding the opening of the system. On peak days, more than 100,000 transactions may be processed in the first hour, which affects the average settlement time during this period. This huge volume of transactions normally takes around 30 to 45 minutes to process. In order to neutralise this effect, the first hour of operations is excluded when TARGET2 processing times are calculated.
Specifically in the first hour, the use of urgency flags (“urgent” and “highly urgent”) is still highly recommended for payments considered to be time-critical (such as CLS pay-ins). Using urgency flags circumvents settlement delays by using different queues (one queue for each type of priority). In addition, attention should be drawn to the possibilities offered in TARGET2 to reserve funds for highly urgent and urgent payments (see Section 1.8 The use of prioritisation).
2.1 Technical availability
In light of TARGET2’s importance for the functioning of the financial system and the knock-on effects that any potential malfunctions could have on other market infrastructures, the Eurosystem pays particular attention to ensuring its smooth operation. While the SSP of TARGET2 achieved 100% technical availability in 2019, three major TARGET2 incidents resulted in this availability dropping to 99.46% in 2020 (Box 6).
Technical availability is measured on TARGET2 business days during the day-trade phase (including end-of-day processing), from Monday to Friday between 07:00 CET and 18:45 CET (19:00 CET on the last day of the minimum reserve period), including extensions required to complete the operational day (e.g. delayed closing owing to a technical problem in TARGET2 or in T2S, which has an effect on TARGET2, or to major problems in ancillary systems settling in TARGET2). The availability measurement does not include systems or networks not directly managed by TARGET2 (in particular, the availability of the SWIFTNet services). Incidents occurring during night-time settlement are not included either.
Technical availability is not intended to measure the impact of partial outages involving TARGET2’s SSP. For example, incidents affecting only the processing of ancillary system transactions without any effect on other payment processing activities cannot be measured within this figure, although they have an overall impact on TARGET2 and are taken into account when assessing the system’s performance. However, such incidents are, where applicable, considered when measuring processing times and, in addition, reported transparently and followed up accordingly.
2.2 Incidents in TARGET2
The ECB publishes up-to-date information about the availability of TARGET2 via the Market Information Dissemination tool.[37] All incidents relating to TARGET2 are followed up with a detailed incident report and risk management process. The aim of this approach is to learn from these events in order to avoid a recurrence of the incident or incidents of a similar nature.
Chart 31
TARGET2 incidents and delays in closing the system
(left-hand scale: number of incidents/delays; right-hand scale: yearly data in percentages)
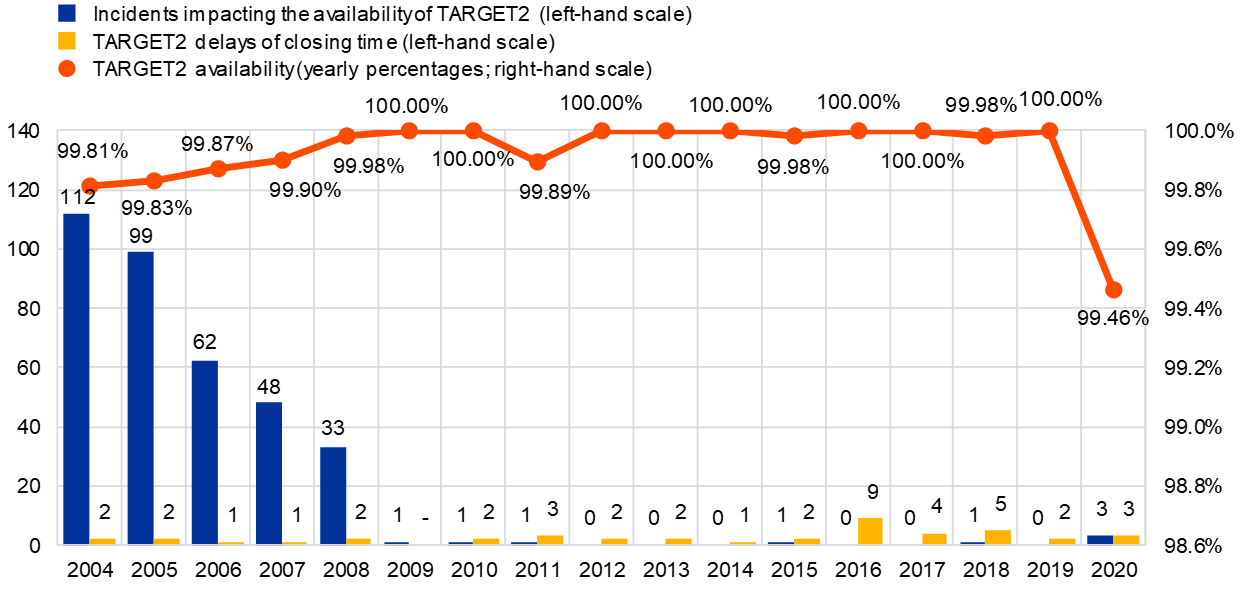
Source: TARGET2.
In 2020 the closing of the interbank payments cut-off at 18:00 CET was delayed on two occasions (on 11 August and 23 October) as a result of a major TARGET2 incident (Box 6). In addition, the closing of the interbank payment cut-off at 18:00 CET was delayed on 22 June owing to problems in T2S, which prevented the timely repatriation of funds from T2S to TARGET2 RTGS accounts.
Box 6
Major TARGET2 incidents in 2020
Since its inception, TARGET2 has displayed a high level of resilience, with the SSP reaching an availability figure of 100% in eight out of its 13 years of operation. Owing to a few operational disruptions, the availability of the SSP fell marginally below 100%, but remained at or above 99.89% over the four years of its operation (2008, 2011, 2015 and 2018).
However, the year 2020 constituted an exception to this robustness: as a result of three major incidents, the SSP availability fell to 99.46%. This is the lowest availability figure even when extending the comparison of availability figures to also cover the time of the first-generation Eurosystem RTGS, i.e. TARGET.
The major incidents in 2020 took place on 16 March, 11 August and 23 October. As part of the efforts to restore normal operations during the latter two incidents, the Eurosystem carried out the intra-region and inter-region failover procedures respectively, for the very first time since the SSP commenced live operations in November 2007. TARGET2 relies for resilience purposes on a “four sites – two regions” model. Major TARGET2 outages can be addressed by either activating a second site located in the same operating region (intra-region failover) or by failing over to another region (inter-region failover).
Monday, 16 March 2020
- The incident started at around 11:00 CET, and normal operations were resumed shortly after 13:00 CET. The incident had an impact on the availability of the ICM, the processing of FIN messages and the ancillary system settlement.
- The incident assessment identified as a root cause of the problem the interruption of the communication processes between internal technical components. The automatic restart of these components was unsuccessful, meaning they had to be restarted manually to restore the full TARGET2 service.
Tuesday, 11 August 2020
- The TARGET2 single platform experienced an incident as of approximately 13:10 CET onwards owing to which all settlement services became unavailable (including liquidity transfers from/to TIPS and T2S). Moreover, access to the system via the ICM became unavailable.
- After the necessary investigations, the Eurosystem decided to failover to the secondary site in the same region. The failover was initiated around 15:45 CET and was technically completed around 16:45 CET. However, the A2A traffic and U2A access to ICM via SWIFT were not immediately available due to additional issues encountered on the secondary site.
- The connection to T2S was available again at 17:54 CET and the TARGET2 A2A traffic (ICM and ASI) was restored at 18:30 CET. The system closed for value date 11 August 2020 at 20:00 CET. The ICM access was only restored at 21:51 CET. An additional issue blocked the change of the next business day, which was further delayed to 22:13 CET. As a result, the first night-time settlement phase in TARGET2 was skipped, and the system went into the maintenance window at 22:34 CET. The second night-time settlement phase started at 01:09 CET. All operations had fully recovered from the incident the following business day.
- The root cause assessment identified a human error as the source of the incident: work was carried out almost simultaneously on power supply units that otherwise provide for redundancy.
Friday, 23 October 2020
- Owing to an internal issue affecting the TARGET2 single platform, all settlement services became unavailable from approximately 14:40 CET. Consequently, no payments, ancillary system instructions or liquidity transfers from/to TIPS and T2S could be processed for several hours. The ICM was also unavailable.
- After the necessary investigations, it appeared that neither the failover to the secondary site in the same region nor the opening of the contingency solution were possible.[38] To restore normal operations, it was necessary to move the production site from one region to the other. The failover was initiated around 20:30 CET and was technically completed around 22:30 CET, after which the ICM was again available. Settlement services were then progressively restarted. The settlement of FIN messages could only be fully resumed around 01:20 CET on Saturday, 24 October 2020.
- The system closed for the value date of 23 October 2020 at 3:30 CET on Saturday, 24 October 2020 after all pending instructions had been processed. All participants subsequently received the end-of-day statements reflecting all transactions settled for value date 23 October 2020. The participants were thereafter invited to complete their reconciliation for this value date and to report on any mismatch to their national central bank. TARGET2 reopened for night-time settlement with the value date of 26 October 2020 at 5:55 CET on Saturday, 24 October 2020.
- The T2S system was also adversely affected by this TARGET incident. While the settlement of securities transactions remained available, the transfer of liquidity from/to TARGET2 was not available for several hours. As a consequence, the closing of the system had to be postponed until 3:30 CET on Saturday, 24 October 2020 and the night-time settlement phase only started at 6:05 CET on Saturday, 24 October 2020.
- The root cause of the incident was a software defect in a third-party network device used in the internal network of the central banks operating the TARGET2 service on behalf of the Eurosystem. Furthermore, it corresponds to maintenance work that was carried out on the network during business hours.
The TARGET2 incidents in 2020 were exceptional. Therefore, the Eurosystem has initiated a number of internal investigations both as operator of TARGET2 and in its oversight capacity. Immediate action has already been taken to avoid these incidents reoccurring. Moreover, the ECB decided to launch an independent review of its market infrastructure operations (also covering T2S) with the aim of restoring the operational resilience of the systems to the levels expected of them.
The independent review, which will be carried out by Deloitte, will allow the Eurosystem to draw lessons from the incidents and address them. It will investigate the robustness of the business continuity model, the adequacy of the regular recovery tests, the efficiency of the change management procedures and the communication protocols. The main findings of the review will be shared with market participants and made public by the second quarter of 2021.
The Eurosystem is fully committed to restoring market and public confidence in the robustness of TARGET2 and to ensuring that TARGET2 operations remains stable until the day the platform is replaced by the T2-T2S Consolidation. Furthermore, all lessons learned will be taken into account when preparing for the operational phase of the T2-T2S consolidated platform.
3 TARGET2 participants
3.1 RTGS accounts
In December 2020 the total number of RTGS accounts active in TARGET2 (encompassing the direct participants, the technical accounts, the ancillary system accounts and the special-purpose accounts) was 2,020, i.e. slightly higher compared with the end of 2019.
Chart 32
Number of RTGS accounts in TARGET2

Source: TARGET2.
Internet-based participation
In November 2010 internet-based participation was introduced to allow small banks to obtain a direct connection to TARGET2 without necessarily being connected to the SWIFT network. The service, which is subject to a monthly fee of €70, is designed mainly for low-volume participants that wish to hold an account directly with their central bank: either an RTGS account[39] or a home accounting module account (provided the respective central bank has opted for this module).
While the initial number of internet-based participants was relatively modest (68 at the end of 2012), it increased significantly in 2013 (reaching 509 participants by the end of 2013), with the phasing-out of the last proprietary home accounts still offering payment settlement services. Another increase during the second half of 2016 (reaching 634 participants by September 2016) was driven by some banks opening TARGET2 accounts via internet-based access solely for the purpose of settling the long-term refinancing operations. While the total amount of internet-based participation gradually declined thereafter, a third increase took place as of mid-2020 (reaching 630 participants by December 2020). This increase was driven by some banks opening TARGET2 accounts via internet-based access solely for the purpose of settling the long-term refinancing operations. The largest share of internet-based participants is in Germany, followed by France and Italy.
Chart 33
Internet-based participants

Source: TARGET2.
3.2 Participation types
At the end of December 2020, 1,028[40] direct participants held an account on the SSP of TARGET2 and were registered as such in the TARGET2 directory. Through these direct participants, 575 indirect participants from the EEA and 4,253 correspondents worldwide were able to settle their transactions in TARGET2.
Table 2
Participation types

Including the branches of direct and indirect participants, a total of 44,165 BICs around the world (81% of which are located in the EEA) were accessible via TARGET2 at the end of 2020. Compared with the number of reachable BICs at the end of 2019, this figure represents a drop of around 2%.
Participants and institutions addressable via TARGET2 are listed in the TARGET2 directory, which is available to all direct participants for information and routing purposes. In addition to the direct participants that hold an RTGS account for sending payments to and receiving payments from all other direct participants, a number of banks have opted for the opening of special-purpose RTGS accounts, which are not reported as direct participants in the TARGET2 directory. These special-purpose accounts are used, among other things, for the settlement of a specific business, for example Eurosystem open market operations or to fulfil reserve obligations in countries where reserves are computed on RTGS accounts. There were 512 of these accounts, which are also known as “unpublished BICs”, at the end of 2020 (compared with 514 in 2019).
3.3 Ancillary systems
At the end of 2020 a total of 83[41] ancillary systems were using the TARGET2 SSP for settlement purposes, including 31 retail payment systems, 22 securities settlement systems and 19 clearing houses (including four central counterparties).
Of the 83 ancillary systems using the SSP for settlement purposes, 64 made use of the ASI, a feature which was developed to facilitate and harmonise the cash settlement of these systems in TARGET2[42]. Table 3 shows the number of times each of the available ASI models was used at the end of the year.
Table 3
ASI settlement model
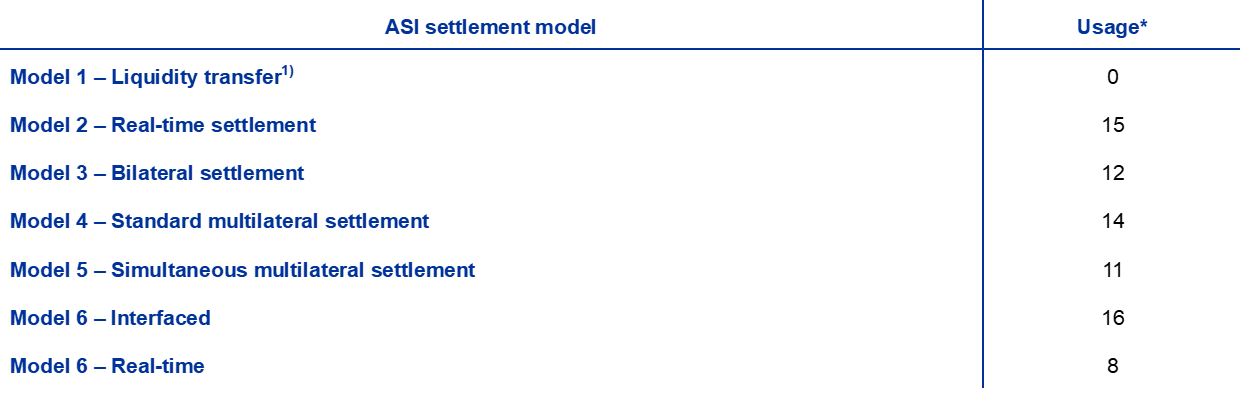
Notes: * An ancillary system may make use of more than one ASI settlement model.
1) As a result of the migration to T2S, model 1 (which supports the integrated model) is no longer used.
4 TARGET2 financial performance
4.1 Cost recovery objectives
The objective initially set by the ECB’s Governing Council in 2007 was for TARGET2 to recover all its costs (with the exception of the “public good factor”)[43] over the six-year amortisation period, i.e. between May 2008 and April 2014. This included its development costs, running costs, overhead costs and capital costs.
The evolution of TARGET2’s cost recovery rate since the finalisation of its migration phase in 2008 is shown in Chart 34.
Chart 34
TARGET2 annual cost recovery rate
(percentages)

Source: ECB calculations.
Note: The data for 2008 only cover the period July-December.
At the time of TARGET2’s development, a number of assumptions were made about the volume of operations in relation to cost recovery. It was estimated that in the first year of operations (i.e. from May 2008 to April 2009), TARGET2 would settle a total of 93.05 million transactions and that this figure would then need to increase by an average of 6% per year. Although the objective was met the year the system was launched, the overall economic slowdown and exceptional market conditions in the ensuing years made it impossible to meet the targeted 6% increase.
Since TARGET2’s launch, the system has seen an average annual decrease in billed traffic of 0.7%, which largely explains why cost recovery, for the first few years of operation, was only around 90%.
In July 2012, acknowledging this underperformance, the Eurosystem decided to amend TARGET2’s single pricing scheme as of January 2013. The fixed periodic fee for users was increased, while transaction fees remained unchanged. The new pricing scheme represents an acceptable compromise, with a limited increase in participants’ fees and a reasonable extension of the system’s payback period. In 2013 the amended pricing scheme helped to bring cost recovery close to 100%.
In 2014 the majority[44] of the investment costs were amortised, which substantially reduced the costs still to be recovered and lifted cost recovery to more than 100%. These annual profits are used to offset the losses accumulated over the first few years of operation.
While TARGET2 has generated annual profits since 2014, the level of cost recovery has fluctuated considerably on an annual basis. The reasons for this are, first, that the SEPA migration end-date resulted in a one-off drop in the total amount of customer payments settled in TARGET2. Second, T2S migration had an effect on TARGET2 from both a cost and a revenue perspective. TARGET2 underwent adaptations in preparation for the launch of T2S, the costs of which started to be recouped from 2015 onwards. These adaptation costs are passed on to system participants in the form of a specific fee.[45] Furthermore, the successful migration of the respective CSDs to T2S from June 2015 onwards reduced the total amount of ancillary system transactions settled in TARGET2.
The total amount of billable traffic in TARGET2 increased by 0.7 million transactions, in 2020 and overall revenues declined to €43.5 million. Annual cost recovery also decreased to 102.3%.
4.2 Financial performance of TARGET2 in 2020
In 2020 the total annual costs to be recovered for the provision of the core services of TARGET2 amounted to €42.5 million. On the revenue side, TARGET2 participants were billed for 86.6 million transactions, which, together with the fixed monthly fees, generated total revenues of €43.5 million. This resulted in a cost recovery rate of 102.3% and an annual profit of €1.0 million. At the end of 2020 the loss accumulated since the launch of TARGET2 had therefore decreased by the same amount, and stood at €7.1 million.
Chart 35
Accumulated profit
(EUR millions)

Source: ECB calculations.
Note: The data for 2008 only cover the period July-December.
4.3 Analysis of revenues collected in 2020
Based on 2020 figures, the following observations can be made:
- 94% of direct participants in the SSP opted for the flat fee option (i.e. option A), while 6% opted for the degressive fee option (i.e. option B).[46] This shows that TARGET2 is capable of attracting both major market players and a large number of small and medium-sized institutions.
- Participants that opted for pricing option B generated, in total, around 89% of billed traffic.[47] As a result of this concentration effect, 32% of all billed transactions were priced at the lowest pricing band, i.e. €0.125. This demonstrates that key participants, particularly multi-country banks, benefited from the attractive degressive fee option offered by TARGET2 and from the competitive group pricing offers.[48]
- Transactions between credit institutions generate around 90% of TARGET2 volumes, with the remaining 10% attributable to ancillary system transactions.
- 73% of TARGET2 revenues were variable, i.e. came from transaction fees, while fixed subscription fees accounted for 27%.
- When measured since the start of the system, the total cost recovery of TARGET2 stands at 98.7%.
5 TARGET2 risk management and oversight activities
5.1 TARGET2 risk management
Managing information security risks is a key element of TARGET2’s governance structure. In order to meet this responsibility, the Eurosystem has established a comprehensive risk management framework comprising, among other things, a fact-finding analytical component, as well as dynamic elements, to ensure that information security risks are identified in a timely manner, continuously monitored and managed throughout the TARGET2 lifecycle.
In particular, TARGET2’s risk management processes are designed to: (i) monitor developments to ensure that progress on the implementation of security controls in response to issues resulting from risk assessments is satisfactory; (ii) enable those involved to learn from operational experience, thereby ensuring that appropriate measures are taken to prevent an incident from recurring; and (iii) proactively identify new threats and vulnerabilities that could emerge from the changing environment in which the TARGET2 system operates and, if needed, initiate deliberations on the implementation of additional security controls to prevent these threats from materialising.
With regard to information security and cyber resilience, in 2018 the Governing Council approved three cyber resilience enhancements as part of the Eurosystem Action Plan on Cyber Resilience established in 2017. These three enhancements are aimed at further improving the Eurosystem’s capabilities in relation to the identification and detection of cyber-attacks, as well as protection against and recovery from cyber-attacks, particularly in the areas of security services, security testing, data recovery and restart capabilities. The implementation of these enhancements is largely completed, with further (already agreed) refinements to the security services due when the T2-T2S Consolidation project goes live. A further cyber resilience enhancement to prevent and detect software integrity issues and reconstruct affected software was approved by the Governing Council in December 2019 and will be implemented for the new T2-T2S Consolidation project.
Following a recommendation from the TARGET2 Overseer, a three-lines-of-defence model[49] was adopted for risk management that defines a second line of defence governance reporting to the Market Infrastructure Board (MIB) and considers the operational risks for all TARGET services holistically. At this stage, the main focus of the second line of defence will be the enhancement of the TARGET Services risk management frameworks.
5.2 Oversight activities
In 2020, as part of the continuous oversight cycle, the ECB oversight function organised a number of bilateral meetings at different levels between the TARGET2 operator and the ECB as the competent authority, as well as at the level of the European System of Central Banks via the joint Payment Systems Oversight Working Group‑Working Group on TARGET2 (PSOWG-WGT2) and Market Infrastructure and Payments Committee-Market Infrastructure Board (MIPC-MIB) meeting. These and other meetings have helped to provide the operator with a detailed overview of the overseer’s expectations and have enabled the overseer to effectively monitor the system’s risk profile, as well as any recent developments in the system.
The outbreak of the COVID-19 pandemic in 2020 required TARGET2 to operate largely remotely and to deal with high volatility, peak turnovers and reduced traffic in later months of the year. The oversight function monitored developments through continuous dialogue with the TARGET2 operator, also inquiring about the possible impact of the pandemic on the risk situation of TARGET2 and TIPS.
In July 2020 the oversight function reviewed and validated the actions taken by the TARGET2 operator to address the recommendations arising from previous oversight assessments carried out until the cut-off date of 1 March 2020. The overseer agreed to close a number of recommendations that had been addressed by the TARGET2 operator. Specifically, three out of four recommendations deriving from the comprehensive assessment of TARGET2 against the SIPS Regulation concluded in 2016 were closed. Two infringements for TARGET2 from that assessment remain outstanding.
Following the review of TARGET2 against the strategy of the Committee on Payments and Market Infrastructures on endpoint security in wholesale payment systems, seven recommendations were considered as having been addressed and one remains outstanding. Furthermore, following the TIPS service major change assessment against the SIPS Regulation in November 2018, 12 recommendations were raised in total. The overseer closed eight recommendations as a result of the actions taken by the TARGET2 operator and four recommendations still need to be addressed. Finally, following the review of the remediation actions taken by the operator, the overseer closed all recommendations except one arising from the assessment of two incidents that occurred in 2018 (the assessment was completed in 2019).
The revised SIPS Regulation and accompanying legal acts were published in November 2017. Following a transition period granted to the SIPS to implement the additional requirements, a gap assessment was launched in January 2019 against the revised SIPS Regulation to assess the compliance of TARGET2 with the new requirements contained therein. The gap assessment also includes a separate assessment against the Eurosystem Cyber Resilience Oversight Expectations (CROE) published in December 2018. The TARGET2 interim gap assessment report excluding the CROE part (to be completed in the course of 2021) was approved by the Governing Council in July 2020. As a result of the assessment, three infringements and eight recommendations were raised for the operator. The oversight function follows up on the remediation plans prepared by the TARGET2 operator to address the infringements and recommendations.
On 24 July 2020 the ECB’s Governing Council took significant steps to support the full deployment of instant payments across the euro area through a pan-European reachability package (Box 2). The implementation of the measures is scheduled for November 2021 and will be subject to Eurosystem oversight review in 2021.
Three major incidents occurred in TARGET2 in 2020, i.e. on 16 March, 11 August and 23 October. The incidents on 11 August and 23 October caused notable outages of TARGET Services for several hours (Box 6). TARGET2 oversight assigned high priority to conducting a thorough assessment of the incidents to ensure the operator takes the necessary steps to avoid their reoccurrence and to ensure the resilience of TARGET2.
In July 2020 the Governing Council decided to extend the timeline of the T2-T2S Consolidation project by one year, putting forward the scheduled go-live and the adoption of ISO20022 to November 2022. The oversight function is carefully monitoring the migration plans, as well as the testing and contingency planning under development by the operators.
6 System evolution
6.1 Release 14.0
Release 14.0 was implemented on 23 November 2020. It did not include any change requests raised by users following a Eurosystem decision not to call for additional functional changes owing to the limited remaining lifetime of TARGET2. Furthermore, no adaptations were required as part of the SWIFT Standards Release 2020.
The TARGET2 release 14.0 contained only mandatory changes to the system, i.e. bug fixes, as well as alignment of TARGET2 schema files and formats related to upgrades in T2S.
6.2 Release 15.0
Based on the Governing Council’s decision to postpone the T2-T2S Consolidation project go-live by one year, the TARGET2 release 15.0 needs to be planned for November 2021. As with release 14.0, the Eurosystem decided not to seek any change request from TARGET2 participants. The TARGET2 release 15.0 will only include a change request implemented as the part of the evolution of TIPS that will impact the current TARGET2 system. Moreover, the TARGET2 release 15.0 will include mandatory changes to the system, namely bug fixes.
Furthermore, no adaptations are required to the SWIFT Standards Release 2021.
Box 7
T2‑T2S Consolidation will go live in November 2022
The T2-T2S Consolidation project will replace the current TARGET2 with a new RTGS system and will introduce a centralised tool (CLM) for liquidity management across all TARGET services (T2, T2S, TIPS and ECMS).
Following the publication of the User Detailed Functional Specifications (UDFS) the year before, the functional specification phase of the project ended in 2020, with the publication of the first version of the User Handbooks (UHBs).
The handbooks are the result of more than two years of work involving the service-providing central banks, the Eurosystem central banks and market participants. It provides details on the Graphical User Interface (GUI) screens, as well as on interaction between the new T2 service and its users.
With the end of the specification phase, the UDFS and the UHBs are stable, and further changes before the go-live will be kept to a minimum. Planned future versions of those deliverables aim only to include potential corrections and necessary changes. Nevertheless, through the publication of any approved change request on the ECB’s website, the Eurosystem will allow market participants to see those corrections and changes early on, without having to wait for the next version of the UDFS or the UHBs.
Revised project timeline
In July 2020, the Eurosystem Governing Council decided to reschedule the timeline of the T2-T2S Consolidation project by one year with a new go-live date scheduled for November 2022 instead of November 2021. This decision resulted from a formal request from the European banking community motivated by the adverse impact of (i) the coronavirus (COVID-19) pandemic, and (ii) the postponement of SWIFT ISO20022 cross-border migration to November 2022. Having considered the challenges triggered by the pandemic on the readiness of banks and the need to allow participants benefit from synergies between the SWIFT and T2 ISO20022 migrations, the Governing Council approved this request and extended the project timeline by one year.
Migration, testing and readiness
The T2‑T2S Consolidation project will go live in November 2022 following a “Big Bang” migration approach. This means that the current TARGET2 SSP will be discontinued at the time of the launch of the new T2 service. Transition in stages is not possible because the current SWIFT FIN Y-copy message flow used in TARGET2 cannot co-exist with the V-shape message flow that will be employed by the new T2 service. The V-shape set-up provides for network-agnostic connectivity and enhanced information security.
The Eurosystem amended the due dates for the “Overall Key Milestones to ensure a Successful “Big Bang” Migration in November 2021” to take account of the re-planning. The revised document was published on the ECB’s website.
Eurosystem Acceptance Testing continued throughout 2020. This collaboration between the central banks allows for a thorough quality assessment in advance of the start of Central Bank Testing in June 2021.
In the course of 2022 the migration process will be intensively practised in a set of go-live rehearsal tests, some of which will include the whole TARGET Community.
The Eurosystem will provide a pre-production test environment for T2 users to carry out their testing and participate in tests coordinated by the ECB and in the aforementioned rehearsal tests.
The Community Readiness Reporting process follows the Community Readiness Framework which is outlined in the Migration, Testing and Readiness Strategy document. The readiness of the community to migrate in November 2022 will be assessed against these milestones throughout 2021 and 2022 in quarterly cycles.
Additional data
Table
Distribution of payment flows in TARGET2
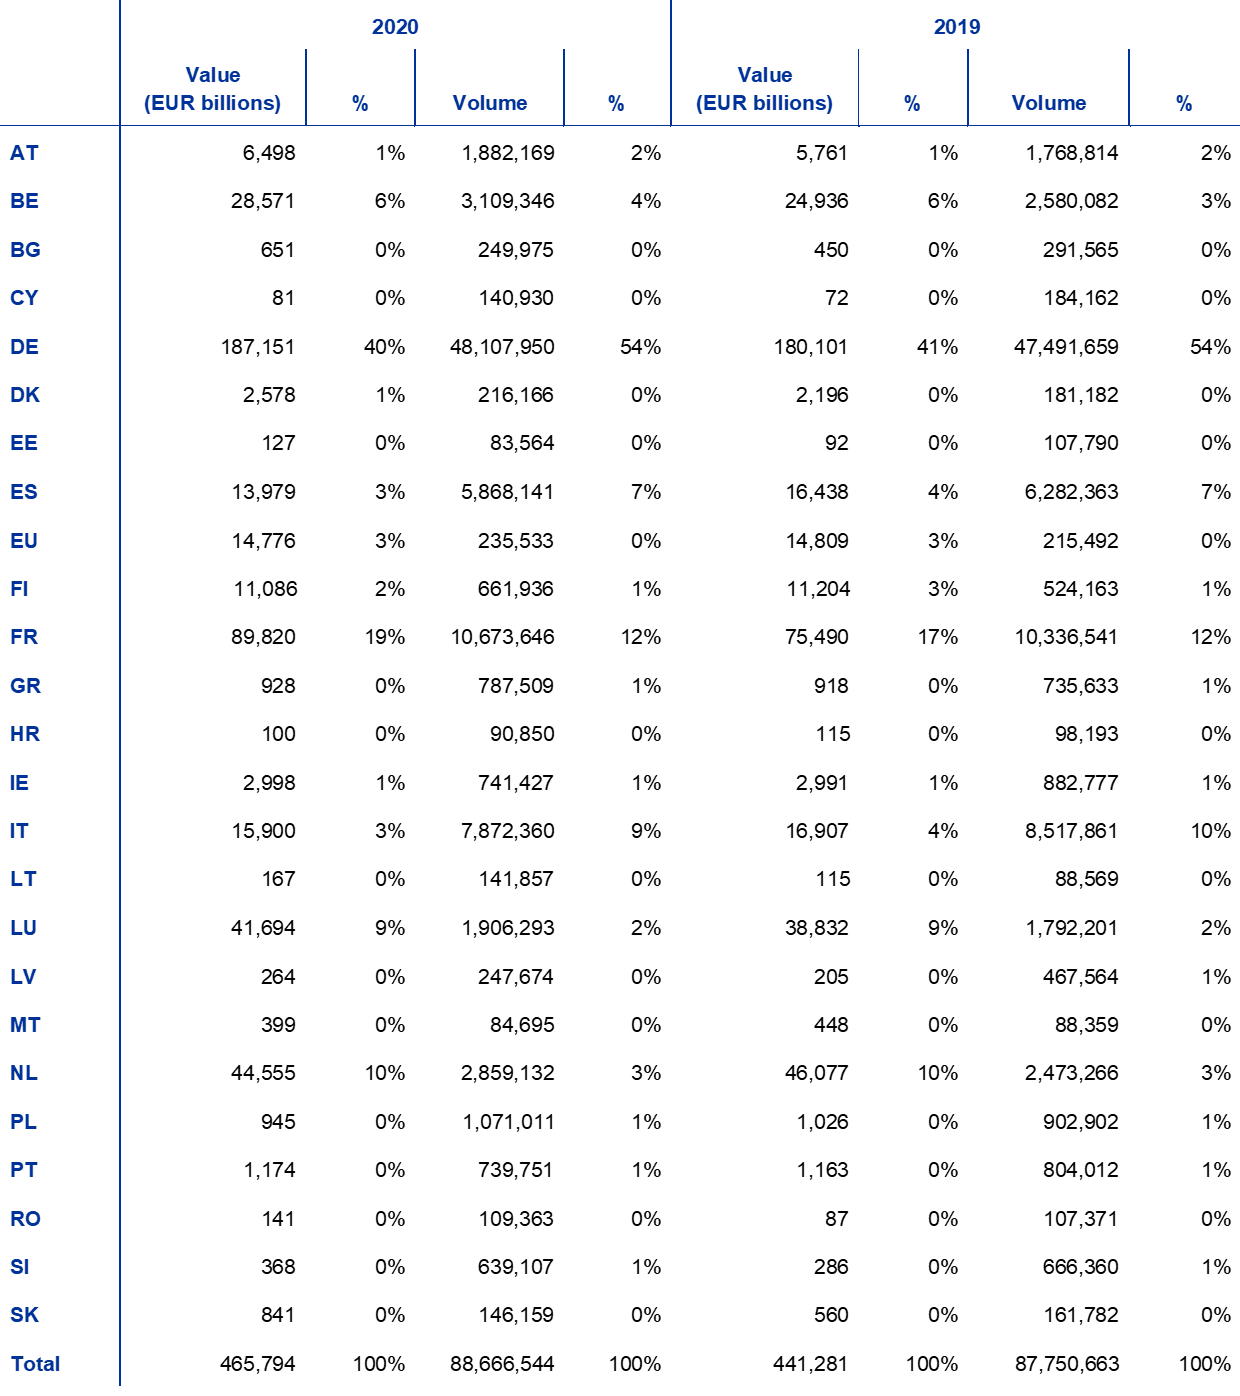
© European Central Bank, 2021
Postal address 60640 Frankfurt am Main, Germany
Telephone +49 69 1344 0
Website www.ecb.europa.eu
All rights reserved. Reproduction for educational and non-commercial purposes is permitted provided that the source is acknowledged.
For specific terminology please refer to the ECB glossary (available in English only).
PDF ISBN 978-92-899-4739-8, ISSN 1725-4884, doi: 10.2866/937463, QB-AC-21-001-EN-N
HTML ISBN 978-92-899-4740-4, ISSN 1725-4884, doi: 10.2866/029356, QB-AC-21-001-EN-Q
- A payment is defined as the process by which cash, deposit claims or other monetary instruments are transferred between economic agents.
- The Eurosystem fulfils this task by:
- providing payment and securities settlement facilities (TARGET2 (including TIPS) and TARGET2‑Securities (T2S)), as well as a mechanism for the cross-border use of collateral (the correspondent central banking model (CCBM));
- overseeing the euro payment and settlement systems;
- setting standards for the use of securities clearing and settlement systems;
- acting as a catalyst for change (e.g. facilitating the development of the Single Euro Payments Area (SEPA)). - A real-time gross settlement (RTGS) system is a payment system in which processing and settlement take place in real time (i.e. continuously), rather than in batch-processing mode. It enables transactions to be settled with immediate finality. Gross settlement means that each transfer is settled individually, rather than on a net basis. TARGET and its successor TARGET2 are both RTGS systems.
- For more information, see the ECB’s website: What is TARGET2-Securities (T2S)?
- For more information, see the ECB’s website: What is TARGET Instant Payment Settlement (TIPS)?
- See Monthly statistics of payment instructions processed by TARGET and EURO1/STEP1.
- Together with the payments processed on T2S DCAs, the overall turnover in 2020 reached €690.7 trillion, corresponding to a daily average of €2.7 trillion. More detailed information can be found on the ECB’s website: Value of transactions per month processed by TARGET and selected interbank funds transfer systems.
- See the box entitled “Changes to the statistical framework of TARGET2”, TARGET Annual Report 2013, ECB, May 2014.
- As a result, of the migration of the central securities depositories (CSDs) to T2S, final securities settlement of the cash leg of securities transactions is no longer carried out on the RTGS accounts of their participants in TARGET2. Instead, it takes place via the DCAs held in T2S.
- It should, however, be taken into account that, while the trends illustrated give an indication of the size of each system and a long-term pattern, they are also affected by fluctuations in the euro’s exchange rate vis-à-vis the US dollar and the Japanese yen, which may distort the figures. As both Fedwire Funds and CLS publish their turnover in US dollars, while the Bank of Japan uses Japanese yen, the turnover in euro is calculated on the basis of the exchange rate of the ECB for the last business day of the year in question.
- In 2020 the average daily turnover of TARGET2 including transactions on T2S DCAs amounted to over €2,700 billion, compared with about €2,500 billion in 2019.
- With this major change for the industry, some participants reconsidered the routing policies for their customer payments and, ultimately, favoured channels other than TARGET2 (mainly SEPA-compliant ACHs), with some banks’ customers (mainly large corporates) specifically requesting this.
- If the volume of transactions processed in T2S DCAs is included, this figure more than doubles, reaching 232 million transactions. More details of the number of transactions settled on T2S DCAs, i.e. the cash legs of delivery-versus-payment transactions, can be found on the ECB’s website: Monthly statistics of payment instructions processed by TARGET and EURO1/STEP1.
- A detailed comparison of TARGET2 with EURO1 is provided in Section 1.5.
- For more information on T2S, please refer to the T2S Annual Report 2020.
- The overall liquidity is computed hourly.
- As explained in Section 1.1, the sudden drop in the average value in 2013 can be attributed to the change in the statistical methodology.
- The cash legs of security transactions are typically high-value operations.
- As explained in the disclaimer at the beginning of the chapter, the figures for night-time settlement do not include liquidity transfers between TARGET2 and TIPS/T2S.
- For example, banknote/coin withdrawals and deposits.
- On 29 March 2017 the United Kingdom began the process of withdrawing its membership from the European Union, known as Brexit. While the withdrawal officially took place on 31 January 2020, a transition period was established until 31 December 2020.
- See Box 3 in TARGET Annual Report 2018.
- See TARGET2 Guideline, Annex II, Articles 4 and 8.
- Central bank reserves refer to the funds held by banks at the central bank, including the minimum reserves they must hold.
- Note that these figures do not account for any new forms of direct participation of UK-based participants that may have occurred between 2017 and 2020 in these jurisdictions. The same applies for the figures regarding traffic.
- Several UK-based banks decided to shift their point of access via France therefore contributing to the increase in the French share of the overall central bank reserve holdings.
- See Box 1 in the article entitled “Liquidity distribution and settlement in TARGET2”, Economic Bulletin, Issue 5, ECB, Frankfurt am Main, 2020.
- The TARGET2 Simulator was developed by the Bank of Finland and is a version of the Bank of Finland’s Payment and Settlement System simulator tool (BoF-PSS2) adapted for TARGET2.
- Regulation of the European Central Bank (EU) No 795/2014 of 3 July 2014 of 3 July 2014 on oversight requirements for systemically important payment systems (ECB/2014/28) and Regulation of the European Central Bank (EU) 2017/2094 of 3 November 2017 amending Regulation (EU) No 795/2014 (ECB/2017/32).
- For more information, see Frutos, J., Garcia-de-Andoain, C., Heider, F. and Papsdorf, P., “Stressed interbank markets: evidence from the European financial and sovereign debt crisis”, Working Paper Series, No 1925, ECB, Frankfurt am Main, June 2016.
- For further information, see the box entitled “The usefulness of TARGET2 transaction data for the analysis of the unsecured overnight money market”, Economic Bulletin, Issue 6, ECB, 2015.
- See Box 2 entitled “The TARGET2 Simulator”, TARGET Annual Report 2013, ECB, May 2014.
- See Glowka, M. (2020), “Profiling banks: how to use cluster analysis with payment system data”, The Journal of Financial Market Infrastructures, Vol. 8(2), pp. 21–45.
- In particular, the study focuses on customer and interbank payments, as well as transactions to CLS.
- Compared with the original clustering methodology described in Glowka (2020), two participant profiles have been merged.
- This figure covers the InterAct messages received by the SSP, in both U2A and A2A mode.
- For further information, please see Market Information Dissemination.
- However, later investigations showed that the contingency solution would have been available. It was due to a miscommunication that the contingency solution was confirmed as being unavailable during the incident.
- An RTGS account for an internet-based participant will also incur additional monthly fees for the account itself and a flat rate fee of €0.80 per transaction.
- This figure represents the number of direct participants with at least one account in TARGET2. Direct participants may have more than one account, which is why the figure is lower than the number of RTGS accounts reported in Section 3.1.
- From a technical perspective, TARGET2 has 87 ancillary systems (one more than in 2019). However, this figure also includes, for example, central banks making use of the ASI for settling monetary policy operations. At the end of 2020, a total of 83 ancillary systems that are legally recognised as separate ancillary systems, were using TARGET2 SSP for settlement purposes.
- Ancillary systems not using the ASI, alternatively, hold a regular RTGS settlement account and exchange normal credit transfers with their settlement banks.
- For further considerations on the public good factor, see “Public good issues in TARGET – Natural monopoly, scale economies, network effects and cost allocation”, Working Paper Series, No 505, ECB, Frankfurt am Main, July 2005, “Settlement finality as a public good in large-value payment systems” Working Paper Series, No 506, ECB, Frankfurt am Main, July 2005 and “Incorporating a “public good factor” into the pricing of large-value payment systems”, Working Paper Series, No 507, ECB, Frankfurt am Main, July 2005. A special study group analysed various issues relevant for the design of TARGET2. On completion of the group’s work, the ECB issued a series of published papers in its Working Paper Series.
- This part corresponds to the initial development costs (i.e. release 1.0). Only the costs corresponding to the development of annual releases that have not yet been fully amortised (i.e. release 2.0 and beyond) were still to be recovered.
- In 2015 a new monthly fee was introduced for the DCAs linked to the TARGET2 RTGS accounts and for the use of the value-added services.
- Option A (i.e. a monthly fee of €150 and a flat transaction fee of €0.80) is intended for small and medium-sized institutions submitting fewer than 8,625 TARGET2 transactions per month. For institutions making greater use of TARGET2, option B (i.e. a monthly fee of €1,875 and a degressive transaction fee of between €0.60 and €0.125) is proposed.
- These are accounted for by core pricing participants, central banks using the ASI for “other purposes”, ancillary systems and liquidity pooling.
- Some specific features of TARGET2 (e.g. liquidity pooling or multi-addressee access) offer the possibility of applying the degressive transaction fee to all payments initiated from accounts belonging to the same group.
- See “The three lines of defense in effective risk management and control”, IIA Position Paper, Institute of Internal Auditors, January 2013.