
Non-financial corporate health during the pandemic
Published as part of the ECB Economic Bulletin, Issue 6/2021.
This box takes stock of the impact of the coronavirus (COVID-19) pandemic on the health of the euro area non-financial corporate sector. It also assesses the extent to which policy support measures have alleviated corporate financing strains and dampened upward pressure on their vulnerabilities. The analysis is based on quarterly sectoral accounts data for the euro area aggregate. Accordingly, the box provides an aggregate picture of the non-financial corporate sector, without distinguishing between individual countries, economic sectors, industries or firms.
The pandemic threatened the profitability and operating efficiency of the euro area non-financial corporate sector. Profitability and operating efficiency are essential for a company’s health. While companies can survive for a long time without being profitable if they have the goodwill of creditors and investors, to survive in the long run they must eventually attain and maintain profitability. Profit growth, as measured by gross operating surplus and cash flow growth, has been negative since the start of the pandemic (Chart A, panel a). Gross operating surplus has declined at similar rates to those seen during the global financial crisis, while the decline in cash flow has been more severe than during that period. A similar picture emerges when looking at the net operating surplus to value added ratio and the cash flow to output ratio (Chart A, panel b).
Chart A
Non-financial corporate profit growth and operating efficiency in the euro area
a) Profit growth
(annual percentage changes)
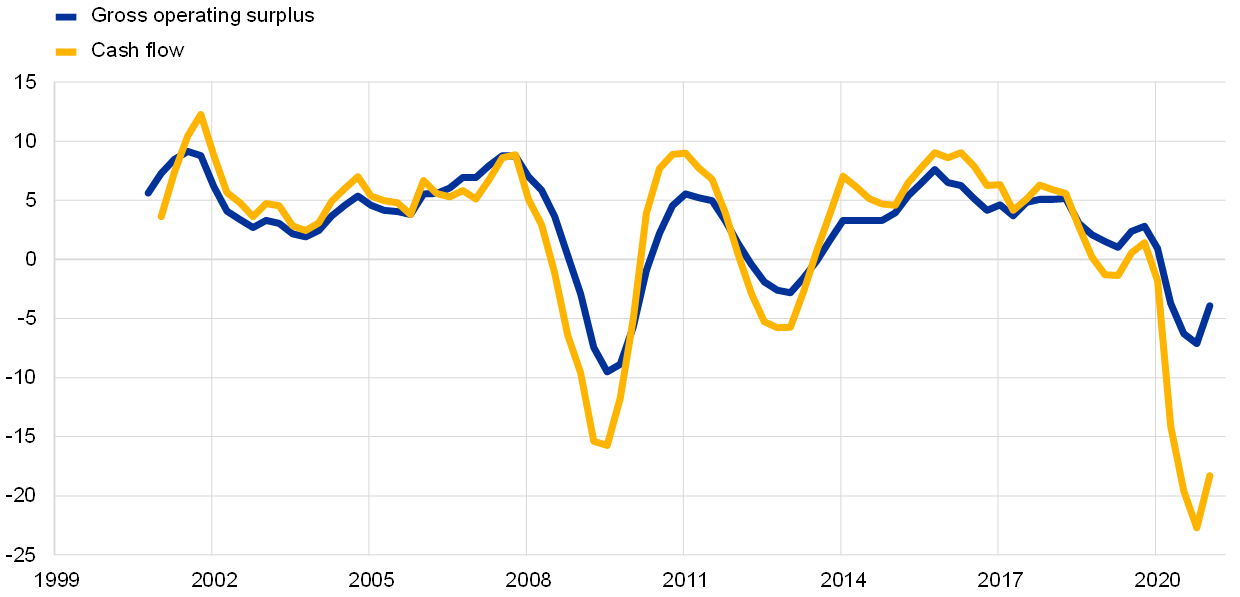
b) Operating efficiency
(percentages)
Sources: Eurostat, ECB and authors’ calculations.
Notes: Net operating margin is calculated as net operating surplus as a percentage of net value added. Cash flow is calculated as gross value added minus wages paid, consumption of fixed capital and net interest payments. Output refers to gross value added. The latest observations are for the first quarter of 2021.
The liquidity of the non-financial corporate sector has been heavily supported by policy measures.[2] Facing a deterioration in internally generated funds in 2020 compared with 2019, non-financial corporations (NFCs) not only started to hoard cash for precautionary purposes, but also received about €550 billion in government support. Without these measures, corporate savings net of capital depreciation would have been significantly negative in 2020. Total credit to NFCs, used by firms both to avoid a liquidity crisis and to further hoard cash, increased by about €240 billion more in 2020 than in 2019, with the increase being particularly marked in the first half of 2020.[3] Firms’ access to credit and their financing conditions received substantial support from the new targeted longer-term refinancing operations (TLTROs), the pandemic emergency purchase programme (PEPP), government loan guarantees and supervisory measures.[4] Cash holdings rose strongly as firms massively increased their recourse to debt financing to compensate for the decline in earnings. For precautionary reasons, they parked a major part of the funds they obtained in deposits to brace for possible cash shortages and to pre-fund working capital needs, as has also been the case during previous crisis periods.
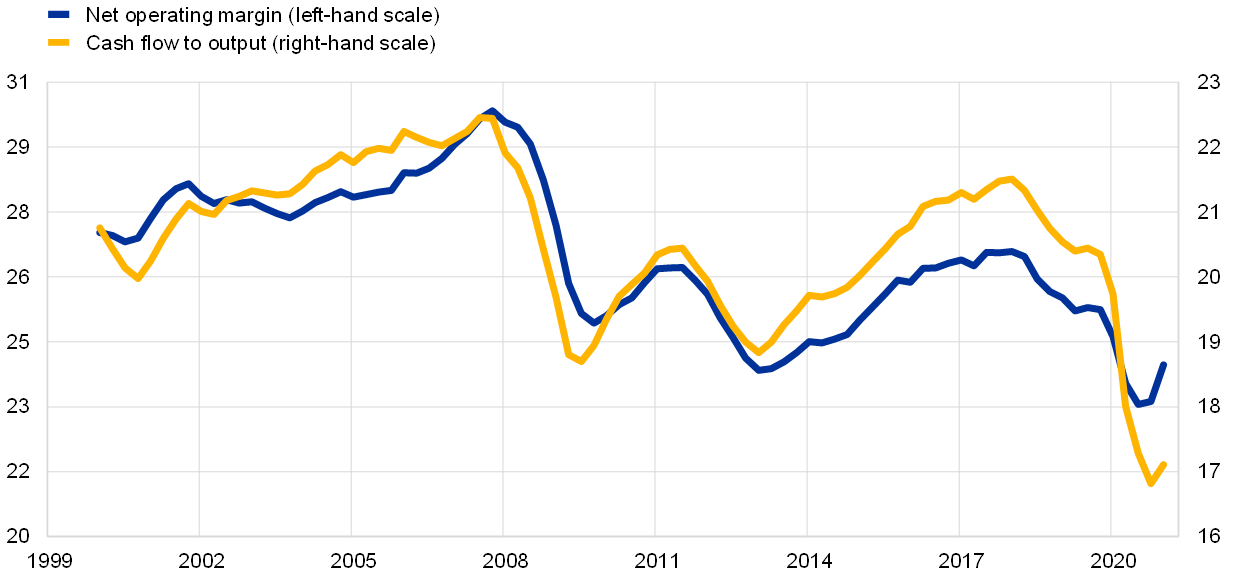
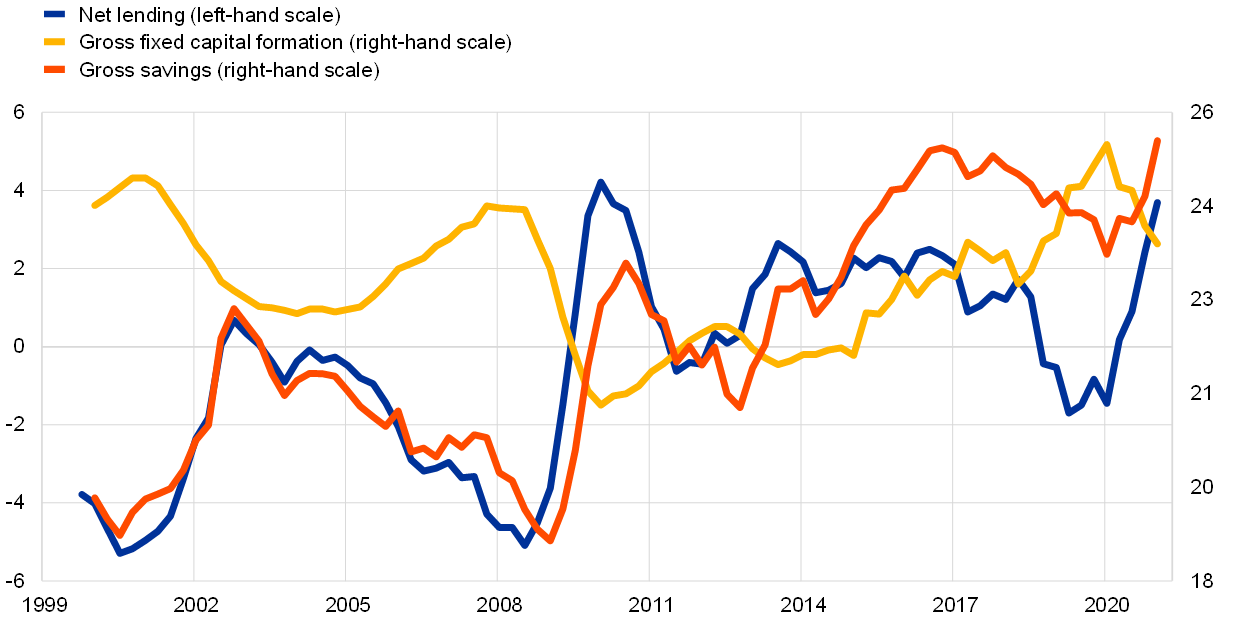
In addition to policy support measures, firms’ own efforts also improved their liquidity conditions. In times of crisis a company’s ability to meet its short-term obligations becomes its top priority. An important aspect of liquidity is a company’s ability both to sell assets quickly to raise cash, and to swiftly reduce all types of costs and expenditures.[5],[6] The latter includes delaying and cancelling investment projects to the extent possible. All in all, NFC cash holdings increased by about €400 billion more in 2020 than in 2019 – also mirroring the increased recourse to credit – with the increase concentrated mainly in the second quarter of 2020. The net outcome of the reduction in costs and investment is reflected in the net lending position (or financing gap) of NFCs (Chart B, panel a). In terms of gross value added, savings increased and investment decreased, leading to net lending increasing and actually turning positive in the second quarter of 2020. The cancellation of investment projects may, however, leave longer-term scars in the economy by hampering future growth potential.
The amount of cash firms have available to pay their interest expenses is currently at comfortable levels. Cash coverage, i.e. the ratio of cash and deposit holdings to gross interest payments, has increased very significantly since 2010 and this increase accelerated during the COVID-19 crisis (Chart B, panel b). Higher cash positions and lower gross interest payments have both played a decisive role. Gross interest payments continued to decline during the pandemic – despite the strong increase in debt – also thanks to the policy response in the form of the PEPP, TLTROs, government loan guarantees and supervisory measures.
Chart B
Non-financial corporate saving/investment balance and cash coverage in the euro area
a) Saving, investment and net lending
(four-quarter moving sums as a percentage of gross value added)
b) Cash coverage
(cash as a percentage of four-quarter moving sums of gross interest payments)

Sources: Eurostat, ECB and authors’ calculations.
Notes: Cash includes currency and deposits. Gross interest payments are calculated before financial intermediation services indirectly measured. The latest observations are for the first quarter of 2021.
The decline in the euro area NFC gross debt ratio since 2015 has been fully reversed since the COVID-19 pandemic outbreak. Firms’ consolidated gross indebtedness has increased by 18.9 percentage points since the end of 2019, reaching 167.0% of their gross value added in the first quarter of 2021, which is only 1.1 percentage points below the record high level reached in early 2015 (Chart C, panel a).[7] 57% of the increase in the gross debt ratio since the end of 2019 can be explained by the marked declines in economic activity and turnover (the denominator effect), while the rest is attributable to greater recourse to debt financing. This implies that only part of the increase in the debt ratio can be expected to passively reverse in the coming years if the economy returns to a more normal growth path. However, as the situation normalises, a decline in cash holdings could support a reduction of gross debt, as suggested by net debt developments.
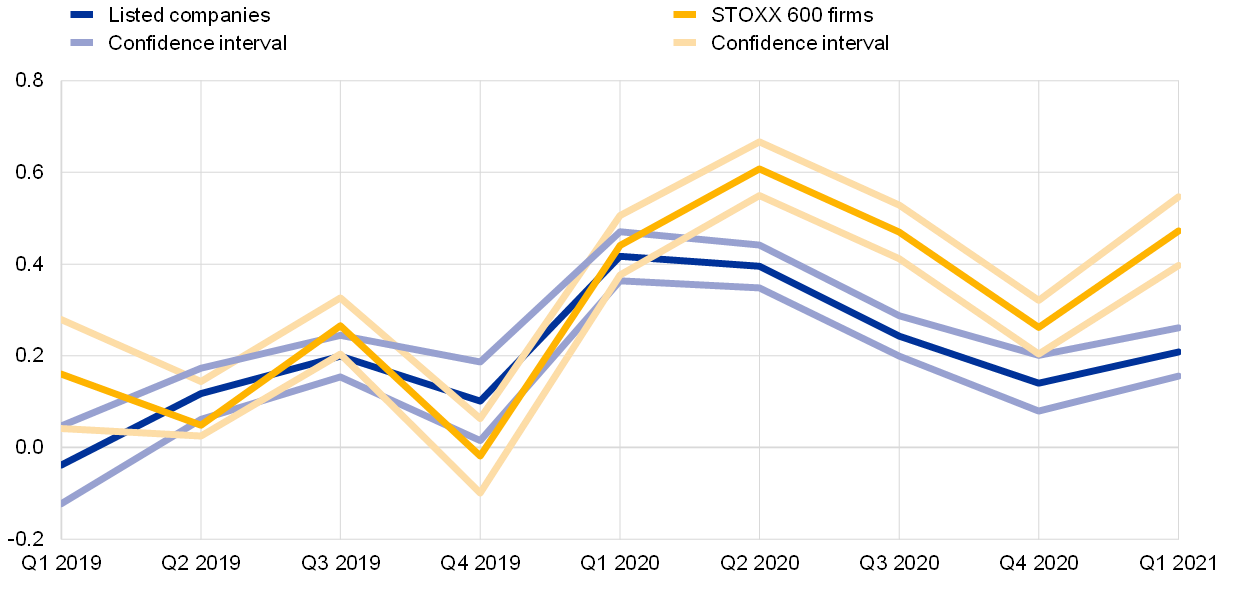
Due to the large amount of accumulated liquid assets, the net debt ratio has increased much less than gross indebtedness. Net debt currently stands below the level it reached at the end of 2019 (Chart C, panel a). Cash can act as a mitigating factor for companies’ high debt, provided that it is the firms that have high debt levels that are holding this high level of liquidity. At the peak of the COVID-19 pandemic, large companies increased their cash and debt levels simultaneously (Chart C, panel b). However, for smaller (listed) firms, cash accumulation was not as effective in mitigating their increase in indebtedness. The correlation between cash and debt increases started to normalise after the peak of the COVID-19 pandemic.
Chart C
Non-financial corporate balance sheets in the euro area
(percentages of gross value added; percentage points)
a) Aggregate level: consolidated debt

b) Firm level: elasticity of gross debt to cash
(x-axis: quarter of observation; y-axis: regression)
Sources: Eurostat, ECB, Refinitiv and authors’ calculations.
Notes: Panel a – consolidated gross debt is defined as the sum of total loans granted to NFCs net of intra-sectoral lending, debt securities issued and pension liabilities. Consolidated net debt is defined as consolidated gross debt net of currency and deposit holdings. The latest observations are for the first quarter of 2021.
Panel b – each quarter, firm-level cross-sections of balance sheets are used to compare the change in debt to the change in liquid asset holdings. All variables are measured relative to total assets. Companies in the panel are euro area NFCs that are included in the STOXX 600 index and all listed companies available via Refinitiv. The latest observations are for the first quarter of 2021.
It is likely that the impact of the pandemic on NFC vulnerabilities will be long-lasting, given the high level of heterogeneity in cash holdings between firms. Firms’ vulnerabilities – as measured by the composite vulnerability index – increased sharply in the wake of the pandemic, exceeding the levels observed in the aftermath of the global financial crisis (Chart D, panel a).[8] The rise in NFC vulnerabilities was largely driven by declining sales, lower profitability and an increase in leverage and indebtedness. However, since the middle of 2020 the improvement in economic activity and in firms’ actual and expected profits has contributed to a decrease in the vulnerability index and an improvement in the corporate leverage situation. The vulnerabilities in early 2021 were close to their average historical levels and their levels at the end of 2019, while the gross debt ratio remained high and cash holdings were mainly concentrated in large listed companies, as highlighted above. However, the vulnerabilities of small and medium-sized enterprises remain high and also mask significant heterogeneity across countries and sectors.[9]
The far-reaching monetary, fiscal and supervisory policy measures have limited the increase in corporate vulnerabilities. These measures have prevented financing and rollover risks from materialising by providing direct liquidity support, improving access to credit, keeping debt servicing costs at historical lows and allowing the maturity of outstanding debt to be extended. A counterfactual exercise also shows that, without these measures, the vulnerability index would have reached a significantly higher value in the middle of 2020, and in early 2021 it would have remained slightly below the level it reached during the European sovereign debt crisis (Chart D, panel a).[10]
The number of bankruptcies declined in 2020, despite the sharp fall in the level of economic activity during the COVID-19 pandemic. In the past, firm insolvencies have been closely correlated with real GDP growth. This relationship broke down during the pandemic (Chart D, panel b). Low debt financing costs, government support measures including bankruptcy moratoria, and the closing of courts prevented the deterioration in corporate health from leading to a surge in defaults at the height of the crisis. However, it cannot be excluded that many firms, particularly those in sectors more affected by the pandemic, could still be forced to file for bankruptcy, especially if the support measures are lifted too early or bank lending conditions tighten significantly.[11]
Chart D
Corporate vulnerabilities and bankruptcies for euro area NFCs
a) Composite vulnerability index
(z-scores)

b) Bankruptcies and real GDP growth
(x-axis: annual percentage changes; y-axis: percentage deviation from the historical mean)

Sources: Eurostat, ECB, Merrill Lynch, Refinitiv and authors’ calculations.
Notes: Panel a – the composite vulnerability index is based on a broad set of indicators along five different dimensions: debt service capacity (measured by interest coverage ratio, corporate savings and revenue generation); leverage/indebtedness (debt-to-equity ratio, net debt-to-earnings before interest, taxes and depreciation ratio, and gross debt-to-income ratio); financing/rollover (short-term debt to long-term debt ratio, quick ratio, overall cost of debt financing and credit impulse); profitability (return on assets, profit margin and market-to-book ratio); and activity (sales growth, trade creditors ratio and change in accounts receivable turnover). Quick ratio is defined as current financial assets divided by current financial liabilities. Credit impulse is calculated as CIt = 100 * ((Ct – Ct-1) / GDPt-1 – (Ct-4 – Ct-5) / GDPt-5), where C is the notional stock of total credit granted to NFCs and GDP is nominal gross domestic product at market prices. NFCs’ total credit is defined as total liabilities of NFCs minus equity issued by NFCs. The indicators are standardised by transforming them into z-scores, i.e. they are converted into a common scale with a mean of zero and a standard deviation of one. Composite sub-indicators are computed for each of the five dimensions by taking the simple arithmetic average of the respective underlying z-scores of the individual indicators. Finally, the overall composite indicator is obtained by equally weighting the composite z-scores of the five sub-categories. Positive values indicate higher vulnerability, negative values indicate lower vulnerability. The latest observations are for the first quarter of 2021.
Panel b – expected data for 2020 based on a linear interpolation of the past relationship between bankruptcies and real GDP. The latest observations are for the fourth quarter of 2020.
To summarise, the COVID-19 pandemic has had a marked impact on corporate health in the euro area. Firms made a substantial effort to build up their cash buffers which, coupled with massive support from the monetary, fiscal, and supervisory authorities, averted a liquidity crisis. At the same time, non-financial corporate profitability, operating efficiency and solvency came under pressure during the lockdowns. Looking ahead, the uneven high level of gross and net indebtedness across countries, sectors and firm size could limit the strength of economic growth over the medium term and increase the risk of a rise in firm defaults.
- We would also like to thank A. Consolo and V. Botelho for their contributions on policy support measures.
- For information on how the fiscal packages have been used to help firms’ liquidity needs, see De Santis, R.A., Ferrando, A. and Gabbani, E.S., “The impact of fiscal support measures on the liquidity needs of firms during the pandemic”, Economic Bulletin, Issue 4, ECB, 2021.
- Here, we only consider firms’ borrowing from banks and their net issuance of debt securities in 2020 compared with 2019.
- For an estimate of the impact of monetary and prudential policies on firms’ employment, see Altavilla, C., Barbiero, F., Boucinha, M. and Burlon, L., “The great lockdown: pandemic response policies and bank lending conditions”, Working Paper Series, No 2465, ECB, September 2020.
- Euro area firms significantly reduced their granting of loans to the rest of the world in the first quarter of 2020 and of loans to other financial institutions (i.e. financial corporations other than MFIs, insurance corporations and pension funds) in the second quarter of 2020. They also notably reduced their holdings of money market fund shares/units in the first quarter of 2020 and of listed shares in the second quarter of 2020.
- See Panetta, F., “Cash still king in times of COVID-19”, keynote speech at the Deutsche Bundesbank’s 5th International Cash Conference – “Cash in times of turmoil”, 15 June 2021. This is also confirmed by the ECB’s July 2021 bank lending survey, which reported a steep rise in working capital needs in the initial stages of the COVID-19 crisis. For evidence at the industry and country levels, see “European corporates: Cash-rich sectors get richer”, Economic Insights, Euler Hermes, 19 April 2021.
- For further information, see “Corporate solvency challenges could weigh on sovereigns, households and creditors”, Financial Stability Review, ECB, May 2021. For developments at the industry and country levels, see “The business insolvency paradox in Europe: Miracle and mirage”, Economic Publications, Coface, 16 March 2021.
- See also Gardó, S., Klaus, B., Tujula, M. and Wendelborn, J., “Assessing corporate vulnerabilities in the euro area”, Financial Stability Review, ECB, November 2020.
- See also “Survey on the Access to Finance of Enterprises in the euro area, October 2020 to March 2021”, ECB, and Battistini, N. and Stoevsky, G., “The impact of containment measures across sectors and countries during the COVID-19 pandemic”, Economic Bulletin, Issue 2, ECB, 2021.
- The counterfactual exercise assumes an economy without firms’ cost relief measures from governments, TLTRO III, PEPP, government loan guarantees and supervisory measures. With no cost relief from governments, NFCs would have had to increase their debt financing by €550 billion in 2020 to compensate for their revenue shortfalls. In the corporate vulnerability index this would have translated into higher corporate leverage and gross interest payments and a reduction in internally generated funds. Additionally, in the absence of the additional monetary policy and supervisory measures and government loan guarantees, the effective interest rate on firms’ outstanding debt and the share of long-term debt in total debt would have remained at the levels they reached at the end of 2019. These effects were mapped back into the counterfactual index using accounting identities while keeping the shares of interest payments and long-term debt in total debt fixed.
- There is some evidence, though, that the longer-term scarring effects of epidemic crises are smaller than those of financial crises or wars. See Martín Fuentes, N. and Moder, I., “The scarring effects of past crises on the global economy”, Economic Bulletin, Issue 8, ECB, 2020.