
- PRESS RELEASE
- 19 November 2019
Euro area monthly balance of payments: September 2019
- In September 2019 the current account of the euro area recorded a surplus of €28 billion, compared with a surplus of €29 billion in August 2019.
- In the 12-month period to September 2019, the current account recorded a surplus of €321 billion (2.7% of euro area GDP), compared with a surplus of €378 billion (3.3% of euro area GDP) in the 12 months to September 2018.
- In the financial accounteuro area residents made net acquisitions of foreign portfolio investment securities totalling €234 billion in the 12-month period to September 2019 (down from €335 billion in the 12 months to September 2018). Over the same period, non-residents made net acquisitions of euro area portfolio investment securities amounting to €246 billion (up from €141 billion).
Euro area current account balance
(EUR billions unless otherwise indicated; working day and seasonally adjusted data)
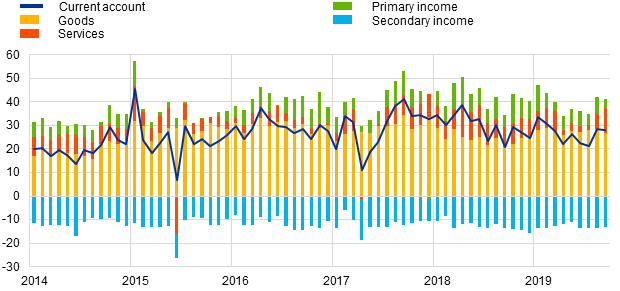
Source: ECB.
The current account of the euro area recorded a surplus of €28 billion in September 2019, compared with a surplus of €29 billion in August 2019 (see Chart 1 and Table 1). Surpluses were recorded for goods (€27 billion), services (€10 billion) and primary income (€4 billion). These were partly offset by a deficit for secondary income (€13 billion).
Current account of the euro area
(EUR billions unless otherwise indicated; transactions; working day and seasonally adjusted data)

Source: ECB.
Note: Discrepancies between totals and their components may be due to rounding.
In the 12 months to September 2019, the current account recorded a surplus of €321 billion (2.7% of euro area GDP), compared with a surplus of €378 billion (3.3% of euro area GDP) in the 12 months to September 2018. This decline was mainly driven by a smaller surplus for services (down from €118 billion to €77 billion) and a larger deficit for secondary income (up from €139 billion to €160 billion). These developments were partly offset by a bigger surplus for goods (up from €315 billion to €321 billion), while the surplus for primary income remained stable over the same periods at €84 billion.
Selected items of the euro area financial account
(EUR billions; 12-month cumulated data)
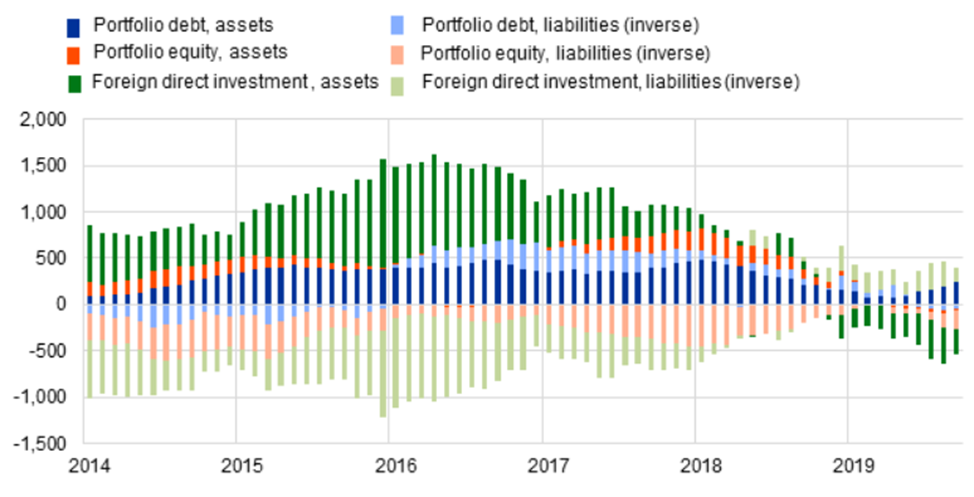
Source: ECB.
Notes: For assets, a positive (negative) number indicates net purchases (sales) of non-euro area instruments by euro area investors. For liabilities, a positive (negative) number indicates net sales (purchases) of euro area instruments by non-euro area investors.
In direct investment, euro area residents made net disinvestments of €284 billion in non-euro area assets in the 12-month period to September 2019, following net investments of €71 billion in the 12 months to September 2018 (see Chart 2 and Table 2). At the same time, non-residents made net disinvestments in euro area assets of €155 billion in the 12-month period to September 2019, following net disinvestments of €57 billion in the 12 months to September 2018.
In portfolio investment, net acquisitions of foreign debt securities by euro area residents increased to €247 billion in the 12-month period to September 2019, following net purchases of €218 billion in the 12 months to September 2018. Over the same period, euro area residents made net sales of foreign equity of €13 billion, after net purchases of €117 billion in the 12 months to September 2018. Non-residents made net purchases of euro area debt securities (€42 billion) in the 12 months to September 2019, after recording net sales of €54 billion in the 12 months to September 2018. Over the same period, non-residents’ net purchases of euro area equity rose to €204 billion from €195 billion.
Financial account of the euro area
(EUR billions unless otherwise indicated; transactions; non-working day and non-seasonally adjusted data)

Source: ECB.
Notes: Decreases in assets and liabilities are shown with a minus sign. Net financial derivatives are reported under assets. “MFIs” stands for monetary financial institutions. Discrepancies between totals and their components may be due to rounding.
In other investment, euro area residents’ net acquisitions of foreign assets increased to €386 billion in the 12 months to September 2019 (compared with €259 billion in the 12 months to September 2018), while their net incurrence of liabilities decreased to €98 billion from €332 billion.
Monetary presentation of the balance of payments
(EUR billions; 12-month cumulated data)

Source: ECB.
Notes: MFI net external assets as reported in the consolidated MFI balance sheet items statistics. B.o.p. transactions refer only to transactions of non-MFI residents of the euro area. Financial transactions are shown as liabilities net of assets. “Other” includes financial derivatives, other investment and statistical discrepancies.
The monetary presentation of the balance of payments (see Chart 3) shows that the net external assets of euro area MFIs increased by €343 billion in the 12-month period to September 2019. This increase was mainly driven by the euro area’s current and capital accounts surplus and by euro area non-MFIs’ portfolio investment equity and direct investment net inflows. The increase was only partly offset by net outflows in euro area non-MFIs’ portfolio investment debt securities.
In September 2019 the Eurosystem’s stock of reserve assets decreased to €827.0 billion, down from €836.5 billion in the previous month (see Table 3). This decrease was driven by negative price changes (€7.5 billion) and net sales of assets (€6.2 billion), which were partly offset by positive exchange rate changes (€3.9 billion).
Reserve assets of the euro area
(EUR billions; amounts outstanding at the end of the period, flows during the period; non-working day and non-seasonally adjusted data)

Source: ECB.
Note: “Other reserve assets” comprises currency and deposits, securities, financial derivatives (net) and other claims.
Data revisions
This press release incorporates revisions to the data for July and August 2019. These revisions did not significantly alter the figures previously published.
Next press releases:
- monthly balance of payments: 20 December 2019 (reference data up to October 2019)
- quarterly balance of payments and international investment position: 10 January 2020 (reference data up to the third quarter of 2019)
For media queries, please contact Philippe Rispal, tel.: +49 69 1344 5482.
Notes
- Hyperlinks in this press release lead to data that may change with subsequent releases as a result of revisions.
Европейска централна банка
Генерална дирекция „Комуникации“
- Sonnemannstrasse 20
- 60314 Frankfurt am Main, Germany
- +49 69 1344 7455
- media@ecb.europa.eu
Възпроизвеждането се разрешава с позоваване на източника.
Данни за контакт за медиите