
- SPEECH
Small steps in a dark room: guiding policy on the path out of the pandemic
Speech by Fabio Panetta, Member of the Executive Board of the ECB, at an online seminar organised by the Robert Schuman Centre for Advanced Studies and Florence School of Banking and Finance at the European University Institute
Frankfurt am Main, 28 February 2022
After many years of too-low inflation in the euro area, fears have turned to the prospect that inflation may remain too high for too long. Across advanced economies, the current inflation spike is proving to be broader and more persistent than initially expected, leading central banks to reassess the risk that it could become entrenched. This is no easy task, especially in the euro area.
Economic conditions in the euro area have benefited from the strong response of monetary policy and its positive interactions with fiscal policy during the pandemic. But this is not a typical business cycle, and we are not seeing a typical recovery.
The current inflation spike is for the most part not being driven by domestic factors – by an economy that is “running hot”, in other words. Demand remains below its pre-crisis trend.
Instead, the economy is experiencing a series of imported supply shocks that are pushing up inflation and depressing demand. The exit from the pandemic is characterised by global mismatches between demand and supply – in energy and goods markets in particular – with uneven effects across sectors.
As a result, past economic regularities may be a poor guide for the future.
This makes medium-term developments extremely hard to anticipate. There are forces at play that could delay the recovery and contain underlying price pressures, and others that could lead to accelerating inflation. Policy mistakes in either direction could push the economy onto an unfavourable path.
Faced with such uncertainty, there is a case for the central bank to accompany the recovery with a light touch, taking moderate and careful steps in adjusting policy, so as not to suffocate the as yet incomplete recovery.
If we are to durably escape the low inflation and low growth environment that has defined the past decade, we cannot afford to waste the progress we have made so far. In the spirit of William Brainard[1], we should take small steps in a dark room.
The dramatic conflict in Ukraine is now weighing negatively on both supply and demand conditions, making uncertainty more acute and exacerbating risks to the medium-term inflation outlook on both sides. In this environment, it would be unwise to pre-commit on future policy steps until the fallout from the current crisis becomes clearer. And the ECB stands ready to act to avoid any dislocation in financial markets that could stem from the war in Ukraine and to protect the transmission of monetary policy.
Inflation as an imported phenomenon
The recent inflation data in the euro area do not make for easy reading. Headline inflation reached 5% in January and is expected to stay above 2% for the entire year, while core inflation is at 2.3%. Inflation pressures are becoming widespread (Chart 1).[2]
To determine how monetary policy should respond, we need to understand the drivers of this inflation spike. I have previously spoken about “good”, “bad” and “ugly” inflation in this context, and each of these has different implications for policy.[3]
In short, good inflation is driven by domestic demand and wages consistent with our target, which monetary policy should seek to nurture until that target is reached. Bad inflation instead reflects negative supply shocks that raise prices and depress economic activity, which monetary policy should look through. Ugly inflation – the worst type of inflation – is driven by a de-anchoring of inflation expectations, which monetary policy should immediately stamp out.
Data indicate that bad inflation is still dominating in the euro area today.
Unlike in the United States, our economy is not experiencing excess domestic demand. Household nominal income has not recovered its pre-pandemic trend and households are saving more of their income than they did before the pandemic (Chart 2). Consumer spending and investment both remain well below their pre-crisis trends (Chart 3).
Inflation is largely imported, reflecting global shocks to supply and demand that are spilling over to our economy through import prices (Chart 4, left panel).
Around 60% of inflation in January was energy, of which the euro area is a net importer (Chart 4, right panel). This is the consequence of the recent extraordinary increases in oil and gas prices (Chart 5, left panel). These in turn mainly reflect shocks that compress energy supply, rather than stronger aggregate demand (Chart 5, right panel). The rise in the cost of energy has further accelerated after the Russian aggression against Ukraine.
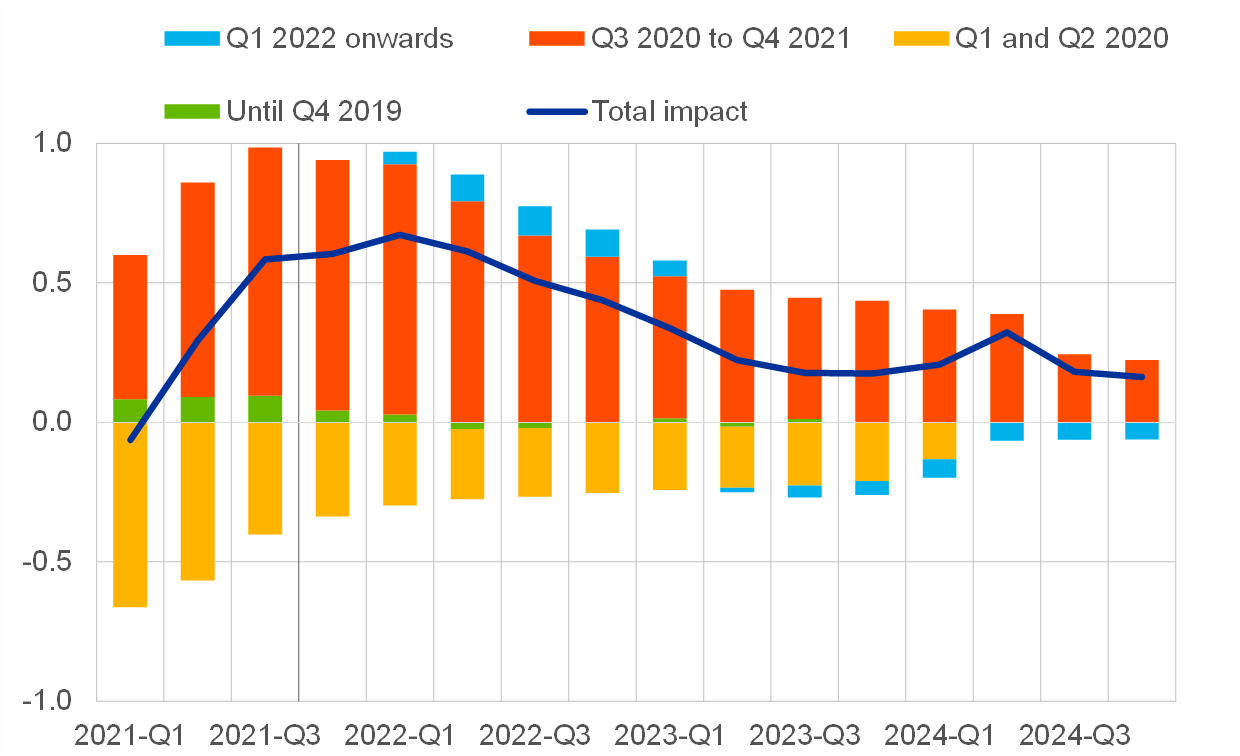
Inflation is also being fuelled by the global shift in consumer spending from services to manufactured goods at a time when the pandemic has disrupted production. This has translated into global supply chain bottlenecks, high durable goods prices and strong pipeline pressures. This effect, which also represents a supply shock for the euro area, is now being reabsorbed, but at a different pace in different economies (Chart 6).
These global supply-driven increases in prices – above all energy and industrial goods, but also food – explain a good part of the currently high headline inflation (Chart 7, left panel).
In contrast, services inflation – the most domestic inflation component – has so far largely come from high-contact sectors (Chart 7, right panel). These sectors are experiencing frictions created by the pandemic and the reopening of the economy, and some of them (such as transport services) are also sensitive to energy prices.
Chart 1
Broadening and accelerating inflation pressures
(left-hand scale: percentages; right-hand scale: annual percentage changes)
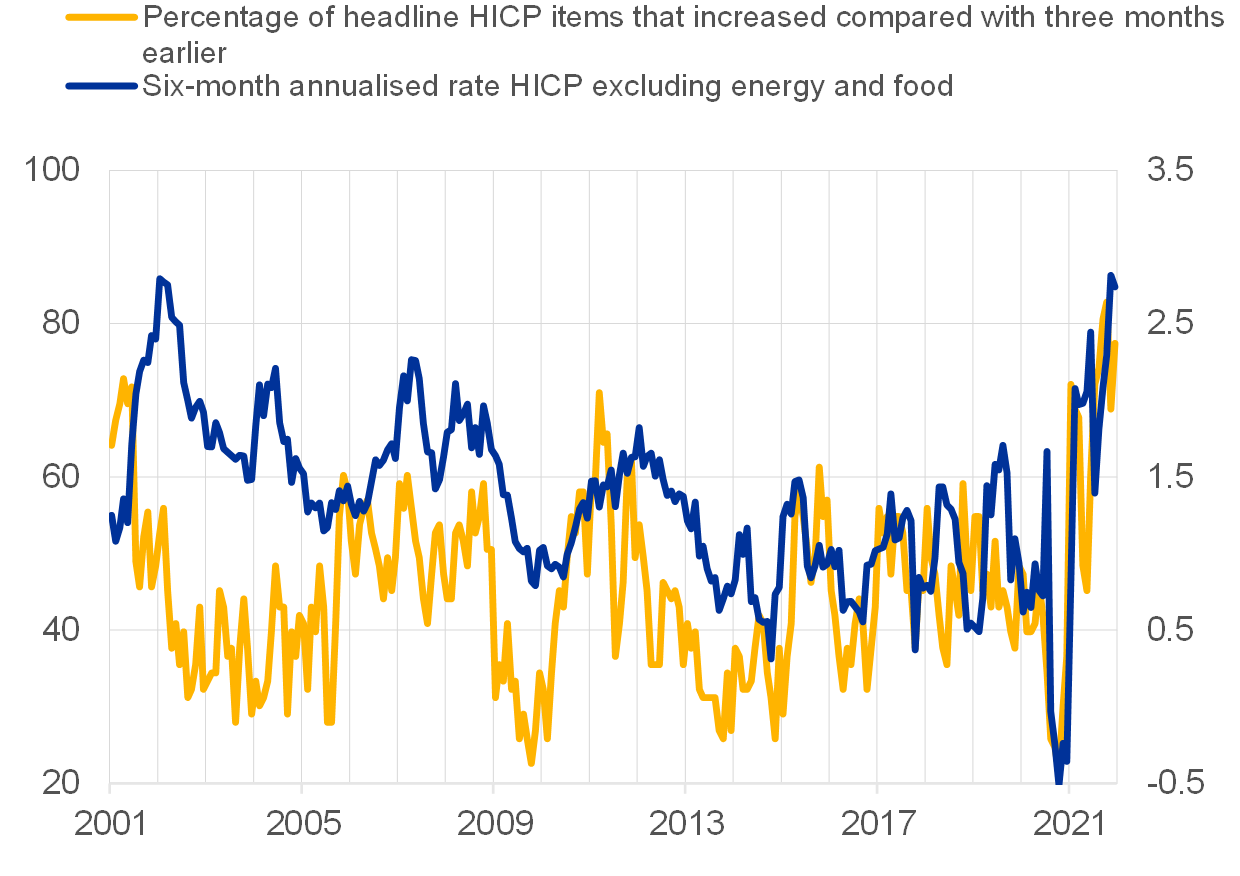
Sources: Eurostat and ECB calculations.
Note: The latest observations are for December 2021.
Chart 2
Income and savings in the United States and euro area
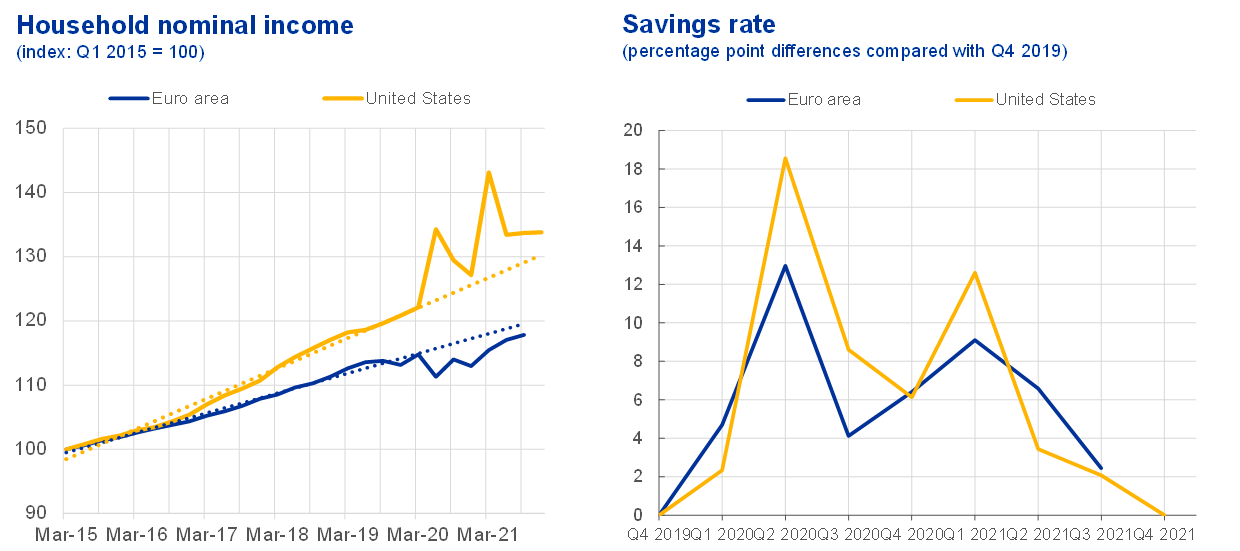
Sources: Left panel: Eurostat and Federal Reserve System; right panel: Eurostat, Bureau of Economic Analysis and ECB calculations.
Notes: US quarterly data are computed as averages of monthly data. The latest observations are for the fourth quarter of 2021 for the United States and the third quarter of 2021 for the euro area.
Chart 3
Domestic demand in the United States and euro area
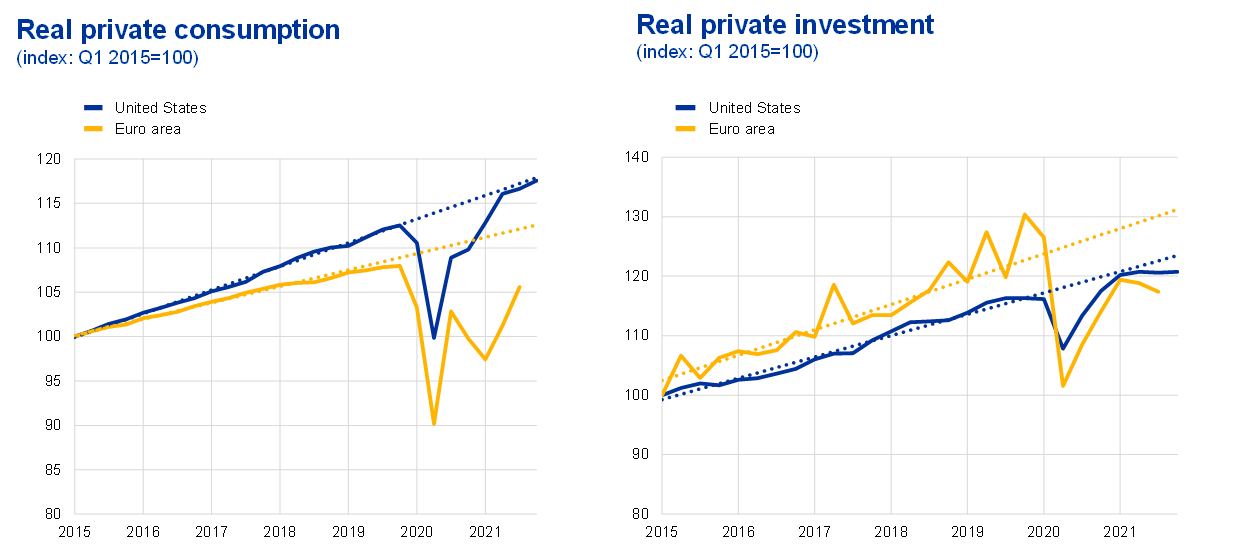
Sources: ECB and Federal Reserve System.
Notes: The latest observations are for the fourth quarter of 2021 for the United States and the third quarter of 2021 for the euro area. For the right panel, Ireland is excluded from the euro area aggregate due to the volatility it would impose on the data series, as large multinational firms use Ireland as their base of operations, which leads to large swings in investment in intellectual property products.
Chart 4
Strength of imported inflation
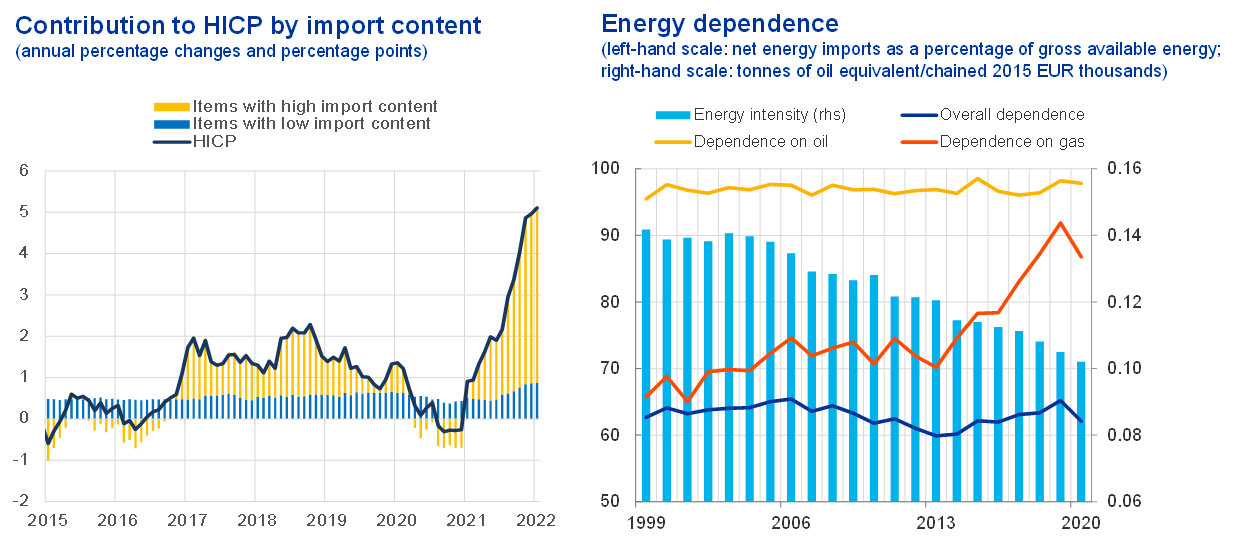
Sources: Left panel: World Input-Output Database, Eurostat and ECB staff calculations; right panel: Eurostat and ECB calculations.
Notes: Energy intensity is measured as the ratio between gross available energy and real GDP. The latest observations are for December 2021 for the left panel, and 2020 for the right panel.
Chart 5
Energy supply shocks in the euro area

Sources: Refinitiv and ECB staff calculations.
Notes: An energy equivalent price compares the price of two energy sources for the same energy content. Structural shocks are estimated using the spot price, futures to spot spread, market expectations of oil price volatility and stock price index. The latest observations are for 24 February 2022.
Chart 6
Shift in spending between goods and services

Sources: Bureau of Economic Analysis, Eurostat and ECB staff calculations.
Notes: Aggregation of all euro area countries except Slovenia, Greece, Lithuania, Slovakia, Portugal and Belgium, and using estimated values for Spain. The latest observations are for December 2021 for the United States and the third quarter of 2021 for the euro area.
Chart 7
Uncertain domestic inflation

Sources: Left panel: ECB and ECB staff calculations; right panel: Eurostat and ECB staff calculations.
Note: The latest observations are for December 2021.
Uncertainty in the inflation outlook
Imported supply shocks that underpin bad inflation increase the uncertainty surrounding the medium-term inflation outlook in two main ways.
First, energy-driven inflation acts as a “tax”[4] on consumption and a brake on production, over time generating effects akin to an adverse demand shock. This adds to the uncertainty around the growth outlook, making it harder to judge when the economy is likely to reach full capacity.
Before the invasion of Ukraine, the economy was seeing a bounceback after the slowdown created by the Omicron wave. But we were still some way short of returning to our pre-crisis GDP trend, across a range of possible estimates (Chart 8). In my view, GDP reaching the bottom end of this range would be the bare minimum needed to conclude that resources are fully utilised[5] – and current projections suggest that this will not happen until the middle of 2023.
The terms of trade tax from higher energy prices could further delay the return to that growth path. The heavier energy bill has already reduced household purchasing power by around 2% (Chart 9, left panel) and is negatively affecting consumer confidence (Chart 9, right panel). It is also eroding the financial buffers built up during the pandemic, especially for households with low incomes, reducing the degree to which dissaving can support consumption in the future (Chart 10).
Second, prolonged imported price shocks make it harder to assess whether inflation is feeding into domestic price pressures. The fact that core inflation is increasing above 2% may initially seem to suggest that domestic inflationary pressures are accumulating. However, rising core inflation is partly due to higher energy prices, which are pushing up costs in almost all sectors (Chart 11).
Similarly, industrial goods inflation may remain elevated in the near term due to higher input costs, but beyond that its dynamics are hard to predict. Inventory levels are starting to return to normal, which suggests that demand might have peaked. The memory of supply shortages might prompt firms to build precautionary stocks that initially prolong tensions but ultimately lead to excess inventories once bottlenecks ease. This would amplify the manufacturing cycle and the volatility of goods inflation.
The Russian invasion of Ukraine is now intensifying this uncertainty.
We face greater financial volatility in the short term. There is a risk of renewed market dislocations as investors anticipate the potential impact of sanctions and possible retaliatory actions. And these dislocations might be felt unevenly, threatening the smooth transmission of our monetary policy across the euro area.
But we also face greater macroeconomic uncertainty in the medium term. The higher energy prices triggered by the conflict in Ukraine point to a longer period of above-target inflation, while supply disruptions of raw materials and food could prove more persistent[6]. At the same time, these factors increase the terms of trade tax and depress economic confidence, aggravating downside risks to growth and further delaying the return to full capacity.
Chart 8
Real GDP remains below pre-pandemic trends
(Index: Q1 2015 = 100)
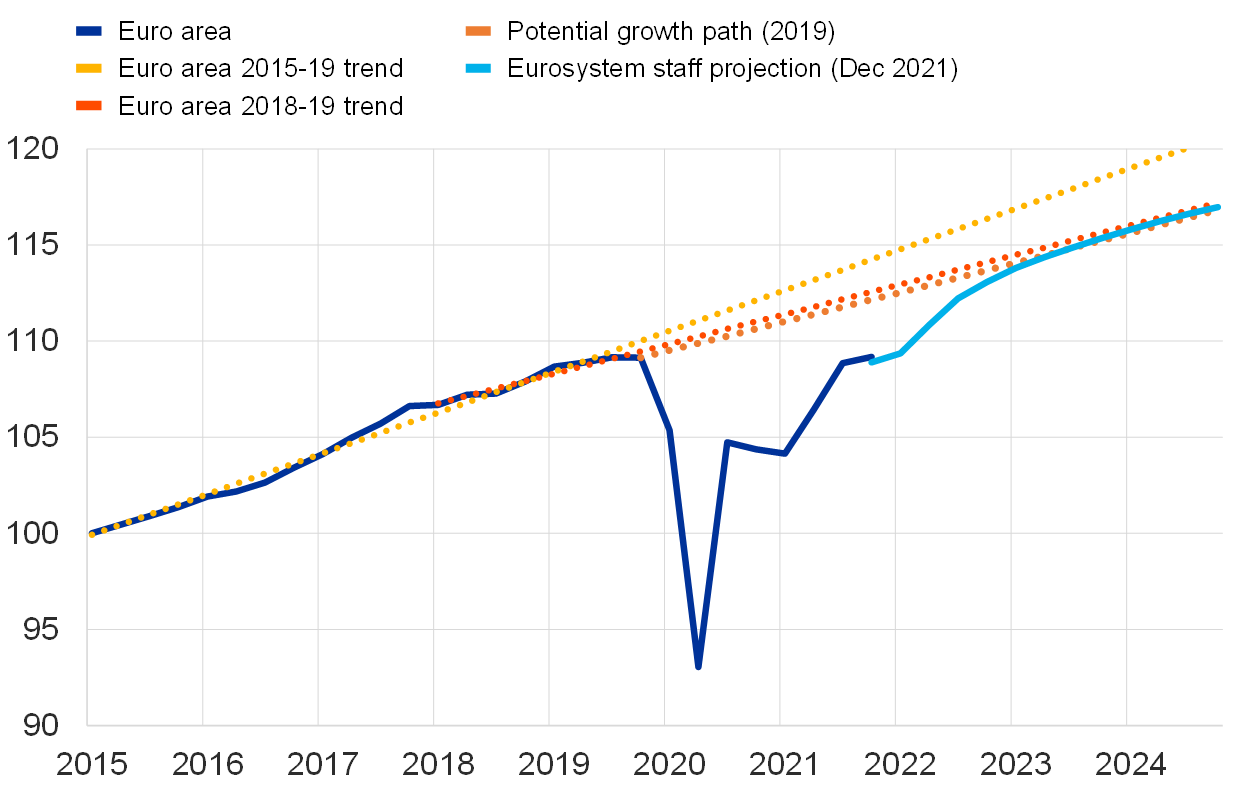
Sources: Eurostat, European Commission, ECB and ECB staff calculations.
Note: Potential growth based on European Commission estimates.
Chart 9
Impact of “bad” inflation on demand

Sources: Left panel: ECB and ECB staff calculations; right panel: European Commission.
Notes: Changes in purchasing power due to energy price fluctuations are computed as the year-on-year percentage change in the real price of energy, weighted by the nominal energy expenditure share (see Edelstein, P. and Kilian, L. (2009), “How sensitive are consumer expenditures to retail energy prices?”, Journal of Monetary Economics, Vol. 56, No 6, pp. 766-779). A negative value indicates a loss in consumer purchasing power. The latest observations are for January 2022.
Chart 10
Erosion of household savings due to higher energy inflation in 2021
(percentage points of income; income quintile)
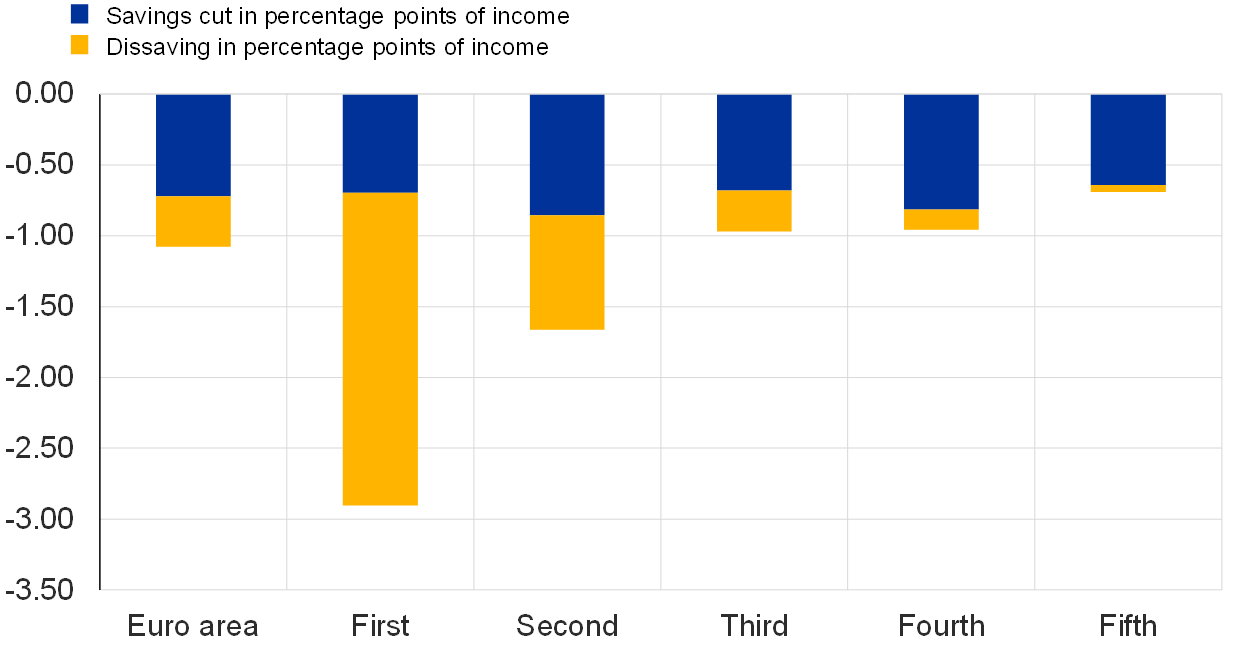
Sources: ECB Consumer Expectations Survey and ECB staff calculations.
Notes: The chart refers to average aggregate effects across the income distribution, to savings cut for those households that have positive savings and rely on them to face the shock, and to dissaving for households that do not have positive savings and thus rely on alternative sources, like accumulated savings or payment deferrals, to face the shock. In 2021 the perceived average price change for utilities was 11%, and for transport services it was 9%. The actual inflation rates for energy items could suffer from an underestimation bias in cases of rising prices because domestic energy consumption is billed with a delay. The latest observations are for January 2022.
Chart 11
Impact of oil price changes on HICP excluding energy and food
(percentage points)
Sources: ECB and ECB staff calculations
Notes: The impact of oil price changes on HICP excluding energy and food are computed using the September 2021 basic model elasticities (BMEs) of the forecasting models in use in the national central banks of the Eurosystem.
The path to price stability
This uncertainty means the path to price stability is exposed to pitfalls on both sides.
As imported inflation now looks set to last longer, we will need to see wages catch up sufficiently to avoid a further fall in purchasing power. If that does not happen, we might face an adverse scenario of a slower closure of the output gap and renewed disinflationary pressures once bad inflation subsides.
However, we could be also confronted with an opposite, equally adverse scenario where high inflation proves to be so persistent that it destabilises inflation expectations. That could feed into wage negotiations and domestic price pressures, entrenching inflation above our target.
Whether the economy can avoid these risks and move along a stable path depends crucially on our policy response. In such a finely balanced situation, any errant policy measure could easily push the economy onto the wrong path and put at risk what we have achieved so far.
If we respond to a false signal and react to a rise in inflation that might not be lasting, we could suffocate the recovery. But if we are too timid in the face of mounting signs that inflation is becoming a domestic process, we might inadvertently give the impression that we lack determination to secure price stability.
In both scenarios, we should not infer the medium-term inflation outlook from present inflation figures. We need to carefully assess the prospects for wage growth, productivity growth and inflation expectations. This requires us to cross-check forward-looking indicators with evidence of what we can observe in the real economy.
So far, the labour market is not looking excessively tight, especially in comparison with other jurisdictions (Chart 12, left panel), and even a significant increase in wage growth would not put it much above trend productivity growth plus our inflation target (Chart 12, right panel).[7] Wage growth has remained moderate to date[8], perhaps reflecting workers’ concerns about job security, and the shock from the Ukraine conflict could prompt further caution. Different measures of inflation expectations also show no signs of de-anchoring on the upside (Charts 13 and 14).[9]
Therefore, the danger of high inflation becoming entrenched seems contained at the moment. At the same time, I would like to see more evidence that improvements in labour markets are translating into wage growth consistent with our 2% target to be confident that the low-inflation scenario has fully disappeared.
Indeed, a key conclusion of our strategy review was that, when coming out of a long period of low inflation, we should wait to see underlying inflation sufficiently advanced before adjusting policy, of which wages are a central component. And option-implied probabilities of tail events suggest that markets still see risks of eventually falling back into a too-low inflation regime.[10]
In the current situation, the task for the ECB is therefore twofold.
First, with the crisis in Ukraine raising uncertainty to unprecedented levels, our immediate priority is to protect the functioning of the financial sector and bolster confidence, in order to contain the impact of the shock on the economy and keep in place the conditions for the smooth implementation of monetary policy.
Second, we should aim to accompany the recovery with a light touch, taking moderate and careful steps as the fallout from the current crisis becomes clearer.
Chart 12
Wage pressures are not a cause for concern
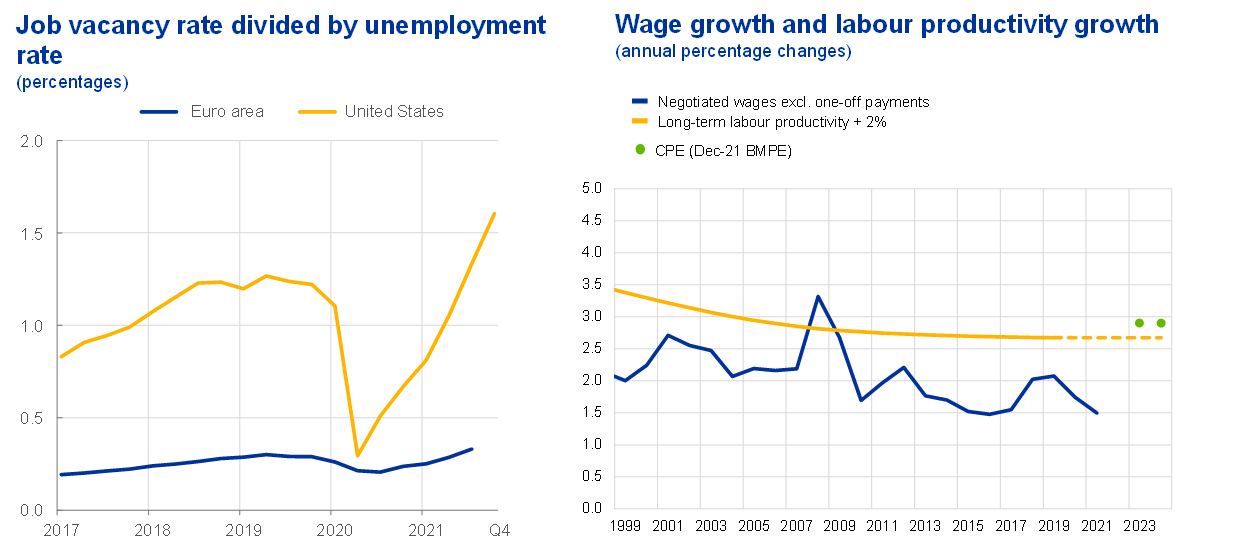
Sources: Left panel: Eurostat, Bureau of Labour Statistics and ECB staff calculations; right panel: Eurostat and ECB staff calculations.
Chart 13
Consumer inflation expectations rise but fall back

Note: These data are derived from responses to the quantitative question on inflation expectations in the ECB’s Consumer Expectations Survey.
Chart 14
Inflation expectations are re-anchoring at 2%
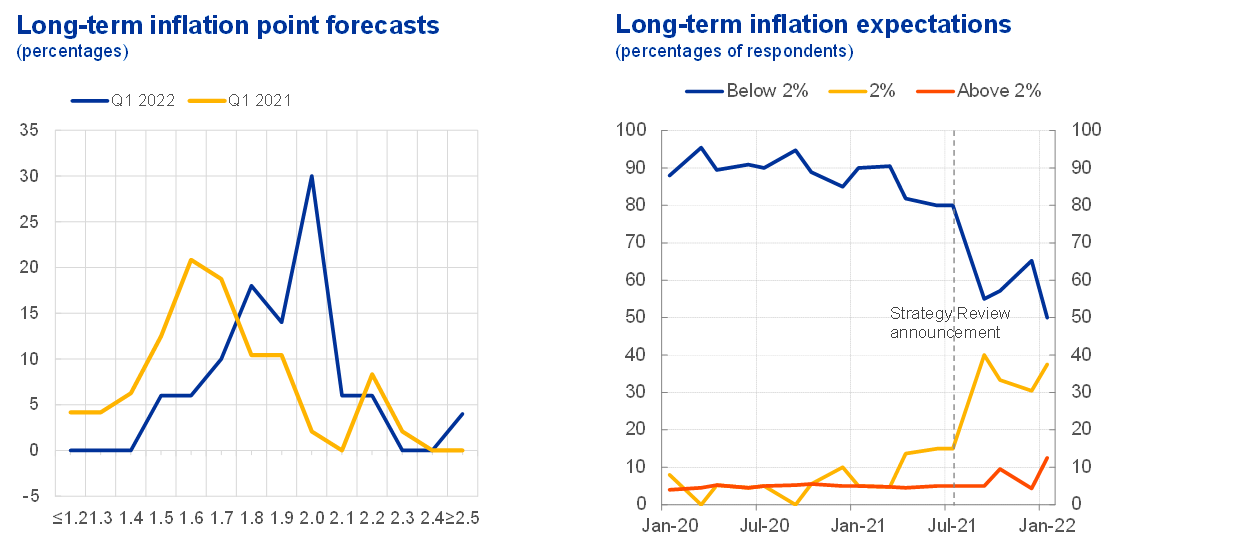
Sources: Left panel: ECB Survey of Professional Forecasters; right panel: ECB Survey of Monetary Analysts.
Note: Values were rounded to one decimal place prior to aggregation.
Accompanying the recovery with a light touch
More than 40 years ago, William Brainard proposed the “conservatism principle”, which calls for cautious action when policymakers are faced with uncertainty.[11]
This principle does not apply to all forms of uncertainty. For example, when faced with deflationary shocks that risk rooting interest rates at the lower bound, it pays to act more decisively.[12] The same is true when inflation expectations are at risk of becoming de-anchored.[13] Both these considerations informed the ECB’s resolute response during the first phase of the pandemic.
And if measures to avoid market dislocations prove necessary in response to the war in Ukraine, we should intervene with equal determination, using all our instruments.
In this respect, we reiterated in our February decisions that “within the Governing Council’s mandate, under stressed conditions, flexibility will remain an element of monetary policy whenever threats to monetary policy transmission jeopardise the attainment of price stability”.
But when policymakers are uncertain about the effects of their policy on the economy, it is advisable to take small steps – and this is the case for the path out of the pandemic. Confronted with supply shocks that are both inflationary and contractionary, we should adjust our policy moderately and progressively as we receive feedback on the effects of our actions.
We began reducing the pace of net asset purchases last year and we are on track to return to our pre-pandemic policy setting by September this year (Chart 15, left panel). Longer-term real yields have already returned to their pre-pandemic levels in the euro area (Chart 15, right panel).
The inflation outlook is stronger today than it was before the pandemic. Therefore, once the current crisis has abated, ensuring that monetary policy accompanies the recovery with a light touch may be consistent with a further adjustment in our net asset purchases. Beyond that, additional modifications to our stance should be considered carefully, for three main reasons.
First, in recent months euro area real yields have already risen more than in the United States, in spite of the different positions in the cycle (Chart 15, right panel). It would be imprudent to move further until we have strong confirmation that both actual and expected inflation is durably re-anchoring at 2% in a world of tighter financing conditions. This is especially important given that the equilibrium real interest rate is subject to large uncertainty (Chart 16), making it difficult to judge how far away we are from a neutral policy stance.
Second, we need to be certain that removing accommodation too suddenly will not trigger market turmoil, as this could lead to financial markets overreacting and financing conditions tightening abruptly. This would set back the recovery in underlying inflation and the re-anchoring of inflation expectations at our target.
We have already seen that, in the current environment, inflation expectations are highly sensitive to abrupt changes in the expected path of policy. Before the escalation of tensions in Ukraine, markets had brought forward their expectations of rate lift-off. This was associated with a reversal in the improvement of market-based inflation expectations (Chart 17, left panel).[14]
The fact that this decrease in inflation expectations was unique to the euro area[15] might have revealed concerns that the ECB would overreact to current inflation numbers and adjust its monetary policy too much and too quickly. These concerns were also hinted at by the shape of the €STR forward curve, which peaked in 2024 and then inverted somewhat, reflecting investors’ perceptions that the economy would be unable to sustain interest rates at those levels (Chart 17, right panel).
The end of net asset purchases in the euro area in 2018 was smooth mainly because short-term rates remained anchored by our forward guidance. We have not been in a situation before where markets are simultaneously reappraising the path of asset purchases and the path of rates, which could increase term premia along the yield curve. Moreover, markets are reappraising the tightening intentions of all major central banks at the same time, increasing the risk of undesirable spillovers on euro area financing conditions.
Third, a key lesson from the previous crisis is not only that rates should not be raised prematurely, but also that doing so without the right framework in place can lead to renewed financial fragmentation. And this fragmentation could force monetary policy into a trade-off: we would face a choice between triggering an excessive tightening of financing conditions in some parts of the euro area, which would result in domestic demand that is too low, or adjusting the stance by less than would be optimal.
Today, fragmentation could result from the legacy effects of the pandemic, so we need a different mechanism for addressing it than during the financial crisis.[16] We have a framework that has served us well over the last two years, when the flexibility of our pandemic emergency purchase programme and the European Commission’s Next Generation EU instrument proved sufficient to stem fragmentation. This gives us a good indication of the direction we should now take. And we know from experience that the more credible a backstop is, the less likely it is to be used.
Chart 15
The policy normalisation already achieved

Sources: Left panel: ECB and ECB calculations; right panel: Refinitiv, Bloomberg and ECB calculations.
Notes: APP stands for asset purchase programme. PEPP stands for pandemic emergency purchase programme. The euro area real rate is the difference between the nominal overnight index swap rate and the inflation-linked swap (ILS) rate. The US real rate represents the difference between treasury yields and the US breakeven inflation rate. The latest observations are for 15 February 2022 for the left panel, and 24 February 2022 for the right panel.
Chart 16
Econometric estimates of the real equilibrium rate
(percentages)
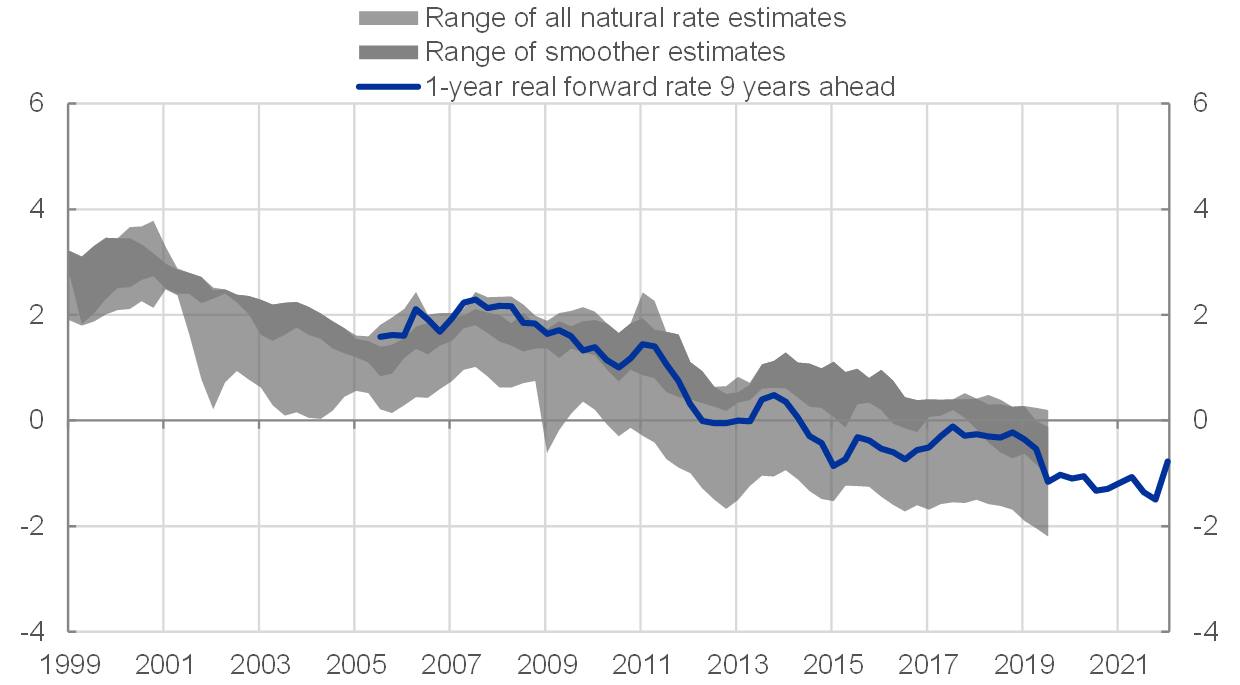
Sources: Brand, C., Bielecki, M. and Penalver, A. (eds.) (2018), “The natural rate of interest: estimates, drivers, and challenges to monetary policy”, Occasional Paper Series, No 217, ECB, December; Brand, C., Goy, G.; Lemke, W. (2020), “Natural Rate Chimera and Bond Pricing Reality”, DNB Working Papers, No 666, De Nederlandsche Bank, January; Ajevskis, Viktors (2018): “The natural rate of interest: information derived from a shadow rate model,” Latvijas Banka Working Paper, (2/2018); Brand, C. and Mazelis, F. (2019) “Taylor-rule consistent estimates of the natural rate of interest.” Working Paper Series 2257, European Central Bank; Fiorentini, G., Galesi, A., Pérez-Quirós, G. and Sentana, E. (2018): “The Rise and Fall of the Natural Interest Rate,” Banco de Espanã, Documentos de Trabajo, (1822); Geiger, F. and Schupp, F. (2018), “With a little help from my friends: survey-based derivation of euro area short rate expectations at the effective lower bound”, Bundesbank Discussion Paper, No 27; Holston, K., Laubach, T., and Williams, J. C. (2017). Measuring the natural rate of interest: International trends and determinants. Journal of International Economics, 108:59–75.; Jarocinski, Marek (2017): “VAR-based estimation of the euro area natural rate of interest,” ECB Draft Paper; Johannsen, B.K. and Mertens, E. (2021), “A Time-Series Model of Interest Rates with the Effective Lower Bound”, Journal of Money, Credit and Banking, 53: 1005-1046; ECB calculations.
Notes: Ranges span point estimates across models to reflect model uncertainty and no other source of r* uncertainty. The dark shaded area highlights smoother r* estimates that are statistically less affected by cyclical movements in the real rate of interest. The latest observations are for 16 February 2022.
Chart 17
Risks of a premature tightening

Sources: Left panel: Refinitiv and ECB Calculation; right panel: Refinitiv, Bloomberg and ECB calculations.
Notes: Left panel: The chart shows the one-year inflation linked-swap (ILS) rate four years ahead and the five-year ILS rate five years ahead. The solid vertical line refers to the day before the December Governing Council meeting (15 Dec), the day before the February Governing Council meeting (2 Feb) and the day of the Russian’s invasion of Ukraine (24 Feb). The solid vertical line refers to the day before the December Governing Council meeting (15 Dec). Latest observation: 24 February 2022. Right panel: The lift-off date is defined as the month during which the €STR forward rate exceeds by at least 10 bps the current €STR rate (respective red vertical lines). Latest observation: 24 February 2022 for realised €STR.
Conclusion
Let me conclude.
Whenever we are uncertain about the consequences of our actions, it makes sense to act prudently. Faced with high uncertainty surrounding the medium-term inflation outlook with pitfalls on both sides, we should adjust policy carefully and recalibrate it as we see the effects of our decisions, so as to avoid suffocating the recovery and cement progress towards price stability.
That was already the case before the invasion of Ukraine, but this terrible event has made the need for prudence even greater. The world has become darker, and our steps should be smaller still.
At the ECB we stand by the people of Ukraine, who are now seeing what they hold dearest threatened by an unjustifiable act of aggression that violates the most fundamental principles of international law. That a country can be subjected to a full military invasion should steel our determination to defend those principles wherever we are, however we can.
The ECB’s role is clear: we will take any measures necessary, using all our instruments to shore up confidence and stabilise financial markets. This is the duty of a central bank in times of emergency. And we will swiftly implement the sanctions decided on by the European Union.
The scenes we have witnessed this past week will scar our memories forever. But I hope that, one day, we will look back on this moment and be proud that we did our duty, showed resolve and unity, and sought to uphold the universal values of peace, freedom and prosperity.
- Brainard, W.C. (1967), “Uncertainty and the Effectiveness of Policy,” The American Economic Review, Vol. 57, No 2, pp. 411-425.
- Around 60% of items in the inflation basket are currently above 2%, and the share of items that have seen price increases over the last three months is at a record high.
- Panetta, F. (2021a), “Patient monetary policy amid a rocky recovery”, speech at Sciences Po, 24 November.
- The effect of higher energy prices is similar to that of a terms of trade tax that the euro area is paying to the rest of the world. See Panetta, F. (2021a), op. cit.
- Pre-crisis trends do not always represent the right benchmark for the recovery. The great financial crisis, for example, was created by excessive borrowing from the future which then had to be reabsorbed through a prolonged process of deleveraging. But the pandemic was a temporary exogenous shock which should not have significantly reduced the supply capacity of the economy. The pre-crisis growth path is therefore a reasonable standard. Panetta, F. (2021b), “Monetary autonomy in a globalised world”, welcome address at the joint BIS, BoE, ECB and IMF conference on “Spillovers in a “post-pandemic, low-for-long” world”, 26 April.
- For instance, Russia and Belarus produce large quantities of potash, Ukraine produces rare gases needed to produce lasers used in semi-conductor production, and Russia and Ukraine are large exporters of wheat.
- The ECB’s survey of large corporates paints a similar picture, foreseeing average wage increases to rise from around 2% in the recent past to 3% or more this year, although with significantly higher rates of wage growth in some sectors with labour shortages. See Gareis, J., Morris, R. and Roma, M. (2022), “Main findings from the ECB’s recent contacts with non-financial companies”, Economic Bulletin Issue 1, ECB.
- The average rate of negotiated wages growth was 1.5% in 2021 after 1.8% in 2020 as a whole, below our December projections.
- Consumers’ expectations, which arguably feed most directly into wage negotiations, show a distinct but temporary “hump” shape compared with January last year (the distribution in January 2022 shifts out for 1-year ahead expectations but shifts back in for 3-year ahead expectations, see Chart 13). Longer-term expectations are also becoming more concentrated around the 2% level compared with a year ago (Chart 14, left panel), while a growing number of monetary analysts see inflation stabilising at 2%, with only a small proportion seeing inflation above this target (Chart 14, right panel).
- Despite the surge in short-term inflation, recent research analysing the option-implied probabilities of tail events indicates that investors still fear the euro area may fall back into a deflationary trap in the future, whereas for the United States the opposite risk is higher. See Hilscher, J. Raviv Bar-Ilan, A. and Reis, R., (2022), How likely is an inflation disaster?, mimeo, London School of Economics, February. The paper also shows that in 2021 market perceptions of a high-inflation outcome rose significantly for the United States, but not for the euro area. These results (which estimate the tail probabilities for persistently very high or very low inflation using the prices of inflation options) reflect, among other things the credibility of the central bank and its monetary policy regime.
- Brainard, W.C. (1967), —op. cit.
- In September 2020, for example, I made the argument that “the risks of a policy overreaction are much smaller than the risks of policy being too slow or too shy to react and the worst-case scenarios materialising.” See Panetta, F. (2020), “Asymmetric risks, asymmetric reaction: monetary policy in the pandemic”, speech at the meeting of the ECB Money Market Contact Group, 22 September.
- Söderström, U. (2002), “Monetary Policy with Uncertain Parameters,” The Scandinavian Journal of Economics, Vol. 104, No 1, pp. 125-145.
- This fall is also visible in measures adjusted for risk premia at shorter horizons.
- In the United States and the United Kingdom measures of inflation expectations have remained broadly unchanged in recent weeks.
- In the past, the issue was resolved with an instrument – the Outright Monetary Transactions – designed for a situation where the main driver of fragmentation was unsound national policies, for which macroeconomic adjustment programmes were designed.
Европейска централна банка
Генерална дирекция „Комуникации“
- Sonnemannstrasse 20
- 60314 Frankfurt am Main, Germany
- +49 69 1344 7455
- media@ecb.europa.eu
Възпроизвеждането се разрешава с позоваване на източника.
Данни за контакт за медиите-
28 February 2022