


- THE ECB BLOG
A year of international trade diversion shaped by war, sanctions, and boycotts
12 April 2023
Sanctions and voluntary boycotts have forced Russia to change its international trade since its invasion of Ukraine. The country has reoriented towards the east, away from Europe. This ECB Blog post sheds light on these shifts. It is the third entry in a series about the economic effects of the war.
Russia’s invasion of Ukraine prompted the EU and its partners[2] to impose wide-ranging sanctions on Russia, including banning exports of certain types of machinery and transport equipment to the country.[3] Many European firms and households also scaled down or entirely froze their trade with Russian firms. As the war dragged on, the EU and G7 also imposed bans and price caps on seaborne imports of Russian oil. The result of these actions has been a fundamental change in Russia’s trade relations with the EU and the rest of the world.[4]
Russia was an important euro area trade partner before the war. In 2021, it was the world’s 11th largest economy[5] and accounted for around 3% of goods exported to the euro area and 5% of goods imported from there. It was particularly important in certain strategic sectors: Russia accounted for around a quarter of EU crude oil imports, close to 40% of EU natural gas imports and almost half of EU coal imports. The country’s role in global markets for energy, raw materials and metal industries also make it important at the start of the production process for global value chains, which also affects trade with the euro area via third countries.[6]
As a result of the war and the sanctions, trade between the euro area and Russia has plunged dramatically. It is now at roughly half of pre-war levels (Chart 1). Euro area exports to Russia fell particularly quickly. In the first months of the war, this reflected declines in exports of both sanctioned and non-sanctioned categories of goods. Since then, however, exports of non-sanctioned categories of goods have gone back towards pre-invasion levels,[7] while exports of sanctioned categories of goods remain low.[8] Imports from Russia fell more gradually. Before the war the euro area mainly imported energy from Russia. Those imports have fallen as the EU progressively banned imports of coal (from August 2022), then crude oil (from December 2022) and, most recently, refined oil products (from February 2023).
Russia has also gradually reduced the flows of natural gas to Europe so that, by February 2023, gas imports from Russia to Europe were 90% lower than their historical average.[9] Europe has replaced gas from Russia with pipeline gas from Norway, Algeria and Azerbaijan, while also substantially increasing its imports of liquified natural gas (LNG), which is mainly transported by sea. Russia’s market power in European energy markets has consequently diminished substantially.
Chart 1
Euro area trade with Russia
(Index, February 2022 = 100)
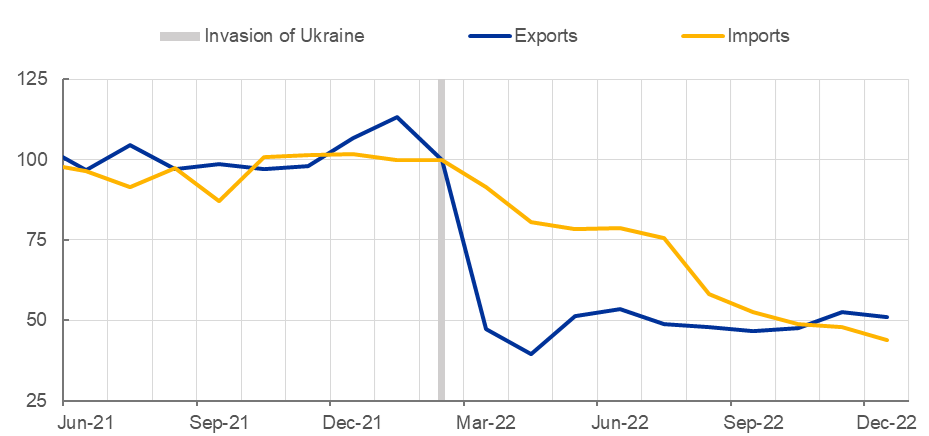
Sources: Eurostat and ECB staff calculations.
Note: Exports from the euro area to Russia and imports to the euro area from Russia measured in volumes, i.e. adjusted for price developments. Last observation: December 2022.
International sanctions have prompted a significant shift in Russia’s trade patterns. At first the aggregate value of Russia’s imports almost halved as all of its trading partners, not just sanctioning countries, reduced their exports. However, those countries that are not imposing sanctions have since increased their exports to Russia again. By the start of 2023 the value of Russia’s imports had risen almost back to pre-war levels (Chart 2).[10] Russia’s global trade has been significantly reorientated: it trade dependencies have shifted, and its suppliers are geographically much less diverse. As of January 2023, China alone provides almost half of Russia’s goods imports.[11]
While Russia has now largely restructured its supply chains and its goods imports have recovered, what remains unclear is whether the new imports are of the same quality as those that were lost. Russian industry relied heavily on high-tech goods from western trading partners before the war. The sanctions imposed on these products have meant that they are either unavailable, have been replaced by low-quality substitutes, or have become much more expensive. This setback will likely weigh on productivity growth in Russia, reducing the economy’s long-term growth prospects.[12]
Chart 2
Russia has become more dependent on China and other eastern countries for its imports
Change in share of total Russian imports from January 2022 to January 2023, percentage points
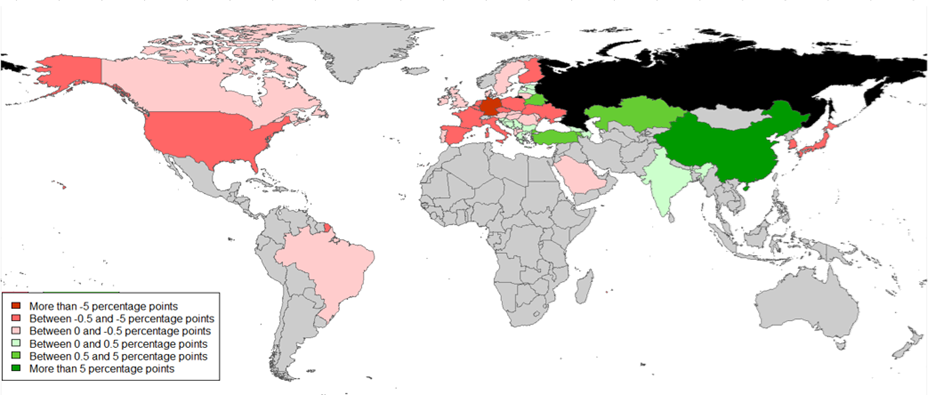
Sources: Trade Data Monitor, national statistical authorities and ECB staff calculations.
Notes: Based on customs data from 51 of Russia’s main trading partners
Russia’s export patterns have also changed substantially. The country still relies heavily on energy exports. Indeed, the volume of Russian exports of oil, its largest export commodity, has actually increased despite EU and G7 sanctions targeting it. This is because Russia has redirected flows from Europe to China and Türkiye as well as to new trading partners in India, Africa and the Middle East. This larger volume of oil is, however, being offered at a significant discount. Urals grade oil, which is Russia’s main export grade to Europe, traded at USD 48 per barrel on average in February, well below the USD 83 average price per barrel of Brent crude, the global benchmark. Russia’s gas exports by pipeline have proved harder to redirect, as they require extensive infrastructure to export to more distant destinations. Having shut its pipelines to Europe, Russia has only been partially able to offset gas exports by increasing pipeline flows to China and selling more LNG to the world market. Overall, Russian gas exports in 2022 were around 25% lower than in 2021.
In short, the sanctions and voluntary boycotts by European firms in response to Russia’s invasion of Ukraine have led to a considerable diversion of Russian trade with the euro area. This has made Russia more dependent on non-sanctioning trade partners, making the country’s economy more fragile overall. It has also been forced to offer discounts on its commodity exports to attract new customers to replace the euro area. The nature of Russian goods trade also means that re-directing its supply chains will likely lead to a squeeze on productivity growth in the country’s economy. The EU has also had to divert trade as a result of the war, in particular commodities trade away from Russia and thus diversifying its external energy dependency.
The views expressed in each blog entry are those of the author(s) and do not necessarily represent the views of the European Central Bank and the Eurosystem.
Subscribe to the ECB blogWe would like to thank Martina Di Sano and Simone Maso for their support in preparing this blog post.
These partners include Australia, Canada, Japan, New Zealand, Norway, Singapore, South Korea, Switzerland, Taiwan, the United States and the United Kingdom.
Since the invasion, the EU has issued nine packages of sanctions against Russia, including sanctions on individuals and restrictions on the media, transport and financial sectors as well as on trade. Initial trade measures targeted goods and products that serve to enhance Russia’s military, transport and technological sectors. More recent restrictions focused on luxury goods (both imported and exported) and other revenue-generating goods exported by Russia, including coal and oil.
For a broader discussion of geopolitical developments and EU policies, see Ioannou, D., and Pérez, J. J. (co-leads) (2023), “The EU’s Open Strategic Autonomy from a central banking perspective. Challenges to the monetary policy landscape from a changing geopolitical environment”, European Central Bank Occasional Paper Series, No 311, International Relations Committee Workstream on Open Strategic Autonomy, March.
As measured by GDP at market exchange rates.
Indirect EU imports from Russia were about three times as high as direct imports in 2018, according to OECD’s Trade in Value Added database 2021.
Non-sanctioned goods represented about 35% of euro area aggregate exports to Russia before the war.
The granularity of data on goods volumes does not allow a differentiation between sanctioned and non-sanctioning goods at the product level. Instead, we differentiate between broader types of goods that are predominantly subject to sanctions (e.g. transport equipment) and types that are left mainly unsanctioned.
This in turn led European energy import prices to surge. See the ECB Blog post by Arce, O., Koester, G. and Nickel, C. (2023), “One year since Russia’s invasion of Ukraine – the effects on euro area inflation”.
See also Borin, A., Conteduca, F. P. and Mancini, M. (2022), “The Real-time Impact of the War on Russian Imports: A Synthetic Control Method Approach” for an account of developments in Russia’s trade patterns since the start of the war.
According to ECB Staff estimates based on customs data from 51 of Russia’s main trading partners.
See, for example, The World Bank “Global Economic Prospects – January 2023” or the Bank of Finland Institute for Emerging Economies “BOFIT Forecast for Russia 2023–2024: An unprecedented fog of uncertainty”.