
- SPEECH
- London, 27 February 2020
How long is the medium term?Monetary policy in a low inflation environment
Speech by Isabel Schnabel, Member of the Executive Board of the ECB, at the Barclays International Monetary Policy Forum
We are currently living through times of tremendous challenges for the conduct of monetary policy.
Although the actions of major central banks over the past few years have succeeded in easing financial conditions and thereby stabilising growth and inflation, current and expected inflation rates remain stubbornly below target, in spite of years of exceptional monetary policy support.
Subdued price pressures have given rise to widespread scepticism about the ability of monetary policy to bring inflation back to target. While it is widely accepted that central banks cannot fine-tune inflation in the short term, some now even doubt their ability to reach their objective in the medium term.
Today I would like to speak to these concerns by shedding light on some factors that may impede a more forceful and rapid return of inflation to levels closer to 2%, focusing on the euro area.
I will argue that the nature and properties of the shocks that have been hitting the euro area over the past few years require central banks to exercise more patience in reaching their inflation aim, in particular when approaching the effective lower bound. This implies that the medium-term horizon over which the ECB pursues the sustainable alignment of inflation with its aim is considerably longer than in the past.
Communication on the factors affecting the length of the medium term increases the public’s understanding of the ECB’s monetary policy, thereby also reducing the risks of a destabilisation of inflation expectations.
A shock-dependant monetary policy
In calibrating monetary policy, central banks typically distinguish between two broad types of shocks affecting the inflation outlook.
The first type is demand shocks, which pull both output and inflation in the same direction. The euro area sovereign debt crisis is a good example. As credit conditions tightened in parts of the euro area, both the public and private sector cut back sharply on spending, thereby pushing down prices and wages.
Such demand shocks typically call for determined policy action. By acting swiftly and forcefully, central banks minimise the adverse impact of a decline in consumption and investment on prices and wages.
Supply shocks – the second type – are different, as they typically pull inflation and output in opposite directions. A sharp exogenous increase in oil prices, for example, pushes inflation up while harming growth and employment.
To minimise volatility in economic activity, supply shocks therefore usually require a smoother and more protracted policy response.
The implication is that central banks generally choose to bring inflation back to their aim over horizons of different length. The choice of the horizon, in turn, depends, among other things, on the nature, size and persistence of the shocks hitting the economy, as well as on the speed and scope of the transmission of monetary impulses to prices and wages, which may vary with the use of different instruments.
Supply-side shocks typically imply longer horizons than demand-side shocks. And while central banks can usually afford to “look through” temporary shocks, more persistent shocks that risk destabilising inflation expectations may require a shorter horizon. I will come back to this later.
For the ECB, this means that the length of the “medium term” – which is an integral part of its definition of price stability – will vary over time.
In reality, of course, economies are constantly hit by a wide variety of shocks, and central banks often have only a limited understanding of the precise configuration of the forces pushing inflation in either direction, which complicates the conduct of monetary policy.
Over the past few weeks, for example, the dramatic events around the spread of the coronavirus have increased uncertainty about the global growth outlook, and also the outlook for the euro area. But very little is yet known about the potential medium-term implications.
Today I will focus on other, more slow-moving structural factors that may influence the transmission of monetary policy to inflation.
I will start from the question as to why inflation has not seen more persistent upward pressure despite years of exceptional monetary stimulus.
There are several competing hypotheses.
The first hypothesis is that unconventional policy instruments have been ineffective. Although we have not yet heard the final word on this topic, in my opinion the available empirical evidence broadly dismisses this view.[1]
The use of these instruments has substantially loosened financing conditions, with beneficial effects for economic growth, employment and inflation.
Unconventional policy instruments had considerable positive impact
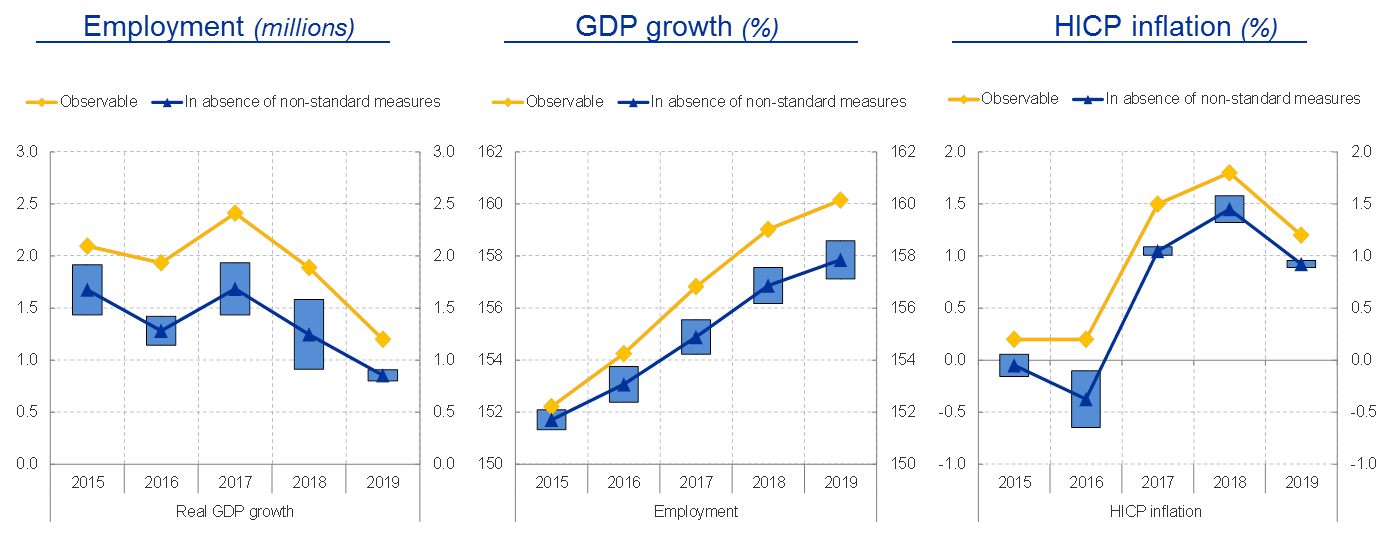
Source: ECB calculations. Notes: The calculations are based on estimates by Eurosystem experts and the estimates in Rostagno et al. (2019). The estimates of Eurosystem experts are based on various modelling methods, from purely structural models to time series models.
A second hypothesis is that economic slack may still be larger than conventional indicators suggest.
Estimates by international organisations suggest that slack in the euro area has diminished measurably over the past few years and that, by and large, the output gap in the euro area has closed.
Uncertainty over the remaining degree of economic slack…
Euro area output gap
(in percent of potential output)
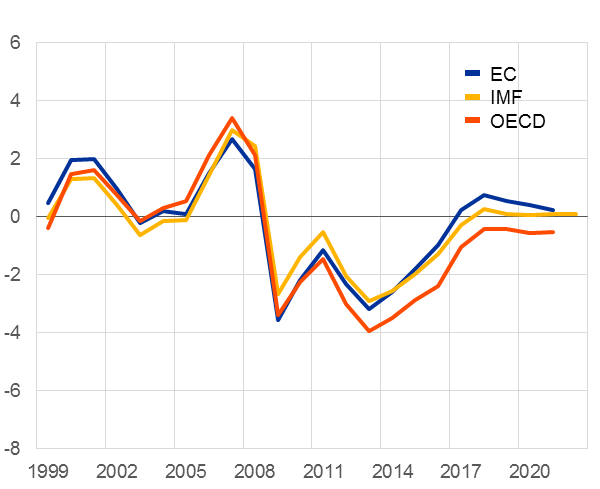
Sources: European Commission, IMF, OECDLast observations: 2022 (IMF); 2021 (EC, OECD).
Alternative measures of the output gap paint a different picture, however.
Uncertainty over the remaining degree of economic slack…
Euro area output gap
(in percent of potential output)

Source: Jarocinski, M. and M. Lenza (2018), “An inflation-predicting measure of the output gap in the euro area”, Journal of Money, Credit and Banking, vol. 50(6), pp. 1189-1224.
ECB staff, for example, have developed an indicator, based on a large set of economic variables, that outperforms other measures in its ability to forecast underlying inflation out of sample. Clearly, this measure would point to continued substantial slack in the euro area economy.
But such indicators come with two caveats.
The first is that they “reverse engineer” – that is, inflation, or the lack thereof, is always and everywhere attributed to economic slack.
And the second caveat is that they are difficult to reconcile with both survey-based and hard data-based indicators of slack in the labour market, which even point to growing signs of labour shortages.
…but growing signs of shortages in labour markets
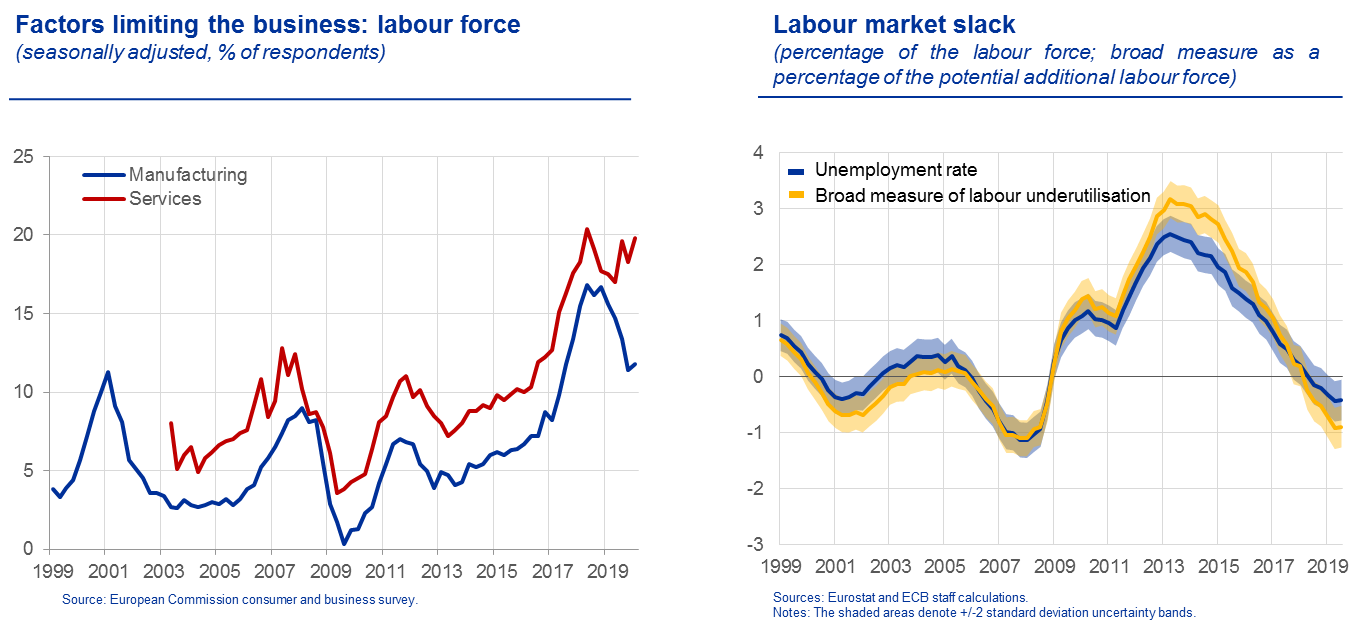
Importantly, improvements in the labour market have not been confined to headline unemployment. Over the past few years we have observed a marked decline in the number of discouraged workers and underemployed part-time workers (Slide 3, left panel). ECB estimates suggest that current broad labour market conditions do not differ much from those observed just before the outbreak of the global financial crisis.
The question, then, is why inflation remains so muted, which brings me to the third hypothesis: the view that other, mostly supply-side factors may currently be weighing on inflation.
Phillips curve estimates by ECB staff visualise this idea.
Reduction of slack putting upward pressure on wages and prices
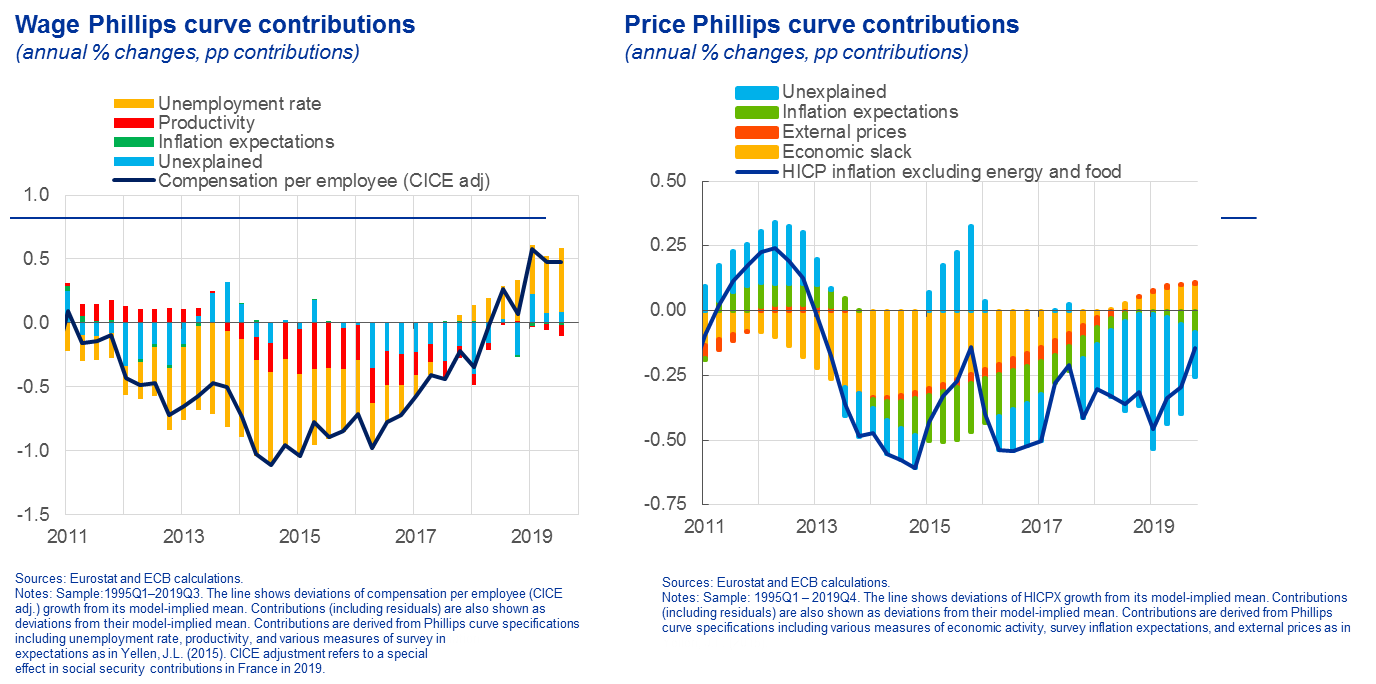
These estimates, which are based on a large number of economic activity indicators, suggest that the erosion of economic slack – the yellow bars – has progressively contributed to pushing up both wages and prices.
At the same time, however, these estimates currently leave a large part of underlying inflation unexplained.
It is possible that these residuals reflect measurement errors, for example regarding economic slack. But they may also reflect, at least in part, other structural factors that are more difficult to identify and quantify.
One way to gauge the potential role of these factors is to analyse the wealth of available financial market data, focusing on inflation expectations rather than actual inflation.
Supply shocks likely contributed to decline in market-based inflation expectations
Drivers of developments in the 10-year euro area inflation-linked swap
(% p.a., cumulative changes)

Sources: ECB calculations.Notes: The model is a four variable BVAR containing the 10-year real OIS rate, the 10-year ILS rate, equity prices, and the nominal effective exchange rate. It is identified using sign restrictions at impact and is estimated using daily data over the period 2005-2019. The chart shows the cumulative changes in the 10-year ILS since July 2005, and the contributions of the four underlying factors. Latest observation: 18 February 2020.
The exercise shown here imposes sign restrictions on cross-asset price correlations of bonds, equities, exchange rates and inflation swaps to extract signals about the potential drivers of the cumulative changes in ten-year inflation-linked swaps since 2005.
Clearly, according to this methodology, a significant part of the decline in long-term inflation expectations has been due to the weakening in aggregate demand – the yellow area – at the time of the sovereign debt crisis, and again in 2018 on the back of the deterioration in the global growth outlook.
But you can also see that a substantial part of the cumulative decline in inflation expectations may be due to supply-side factors. Indeed, in the hypothetical absence of these supply-side shocks, ten-year inflation-linked swaps could currently be trading at levels much closer to 2%.
Supply shocks likely contributed to decline in market-based inflation expectations
Counterfactual path of the 10-year euro area inflation-linked swap in the absence of supply-side drivers
(percentages per annum)
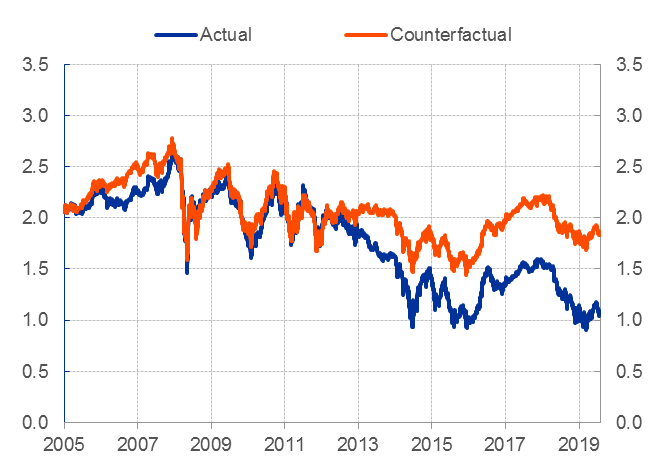
Sources: ECB calculations.Notes: The model is a four variable BVAR containing the 10-year real OIS rate, the EA 10-year ILS rate, EA equity prices, and the nominal effective exchange rate. It is identified using sign restrictions at impact. Latest observation: 18 February 2020.
In other words, their effects are potentially meaningful in quantitative terms.
These shocks are likely to reflect a variety of structural factors which may differ as to how, and to what extent, they affect inflation over time. Collectively, however, they are likely to explain part of the protracted weakness in inflation.
I would like to discuss two such structural factors and their potential implications for the ECB’s medium-term horizon.
The first factor relates to changes in the energy sector, in particular the pervasive effects of the shale oil revolution and changes to the transmission of oil price shocks. And the second factor relates to the pricing behaviour of firms and their ability to buffer cost-push shocks through changes in their profit margins.
The changing role of energy in inflation dynamics
The rise in energy prices was a prime contributor to euro area HICP inflation before the outbreak of the global financial crisis.
Marked fall in the contribution of energy to headline inflation
Shares of the main HICP aggregates in average HICP inflation
(percentage)
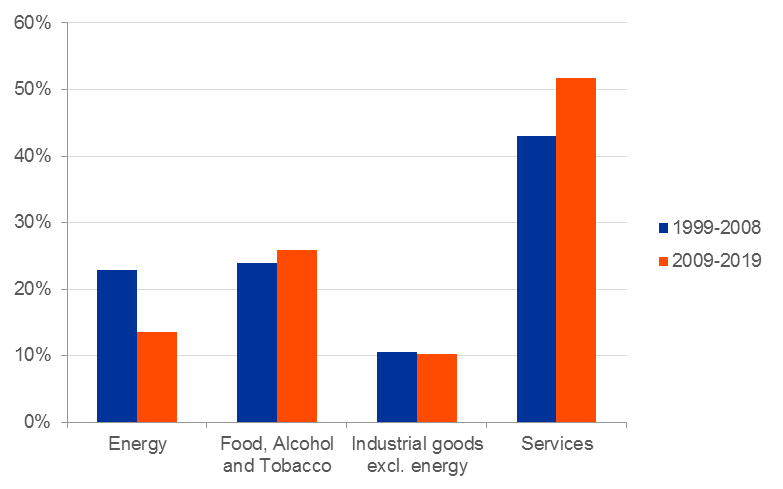
Source: Eurostat and ECB calculations
It accounted, on average, for 23% of headline inflation in the ten years from 1999 to 2008.
Since then, the contribution of energy has fallen to 14%, on average. And over the past five years, the average contribution has dropped to zero. So the measurable and persistent decline in the contribution of energy prices to inflation has been one major source of low inflation in recent years.
What is less clear, however, are the causes of the fall in the contribution of energy price inflation and whether the effects can be expected to persist in the future.
Energy inflation has so far been predominantly driven by the price of oil, which fluctuates in line with supply and demand.
For monetary policy, the distinction between supply and demand matters much along the same lines I described before. Falling oil prices, for example, are often a symptom of a broader weakness in global aggregate demand, in which case they send important signals for monetary policy in real time.
Since about 2014, however, model-based analysis has suggested that the predominant source of the decline in oil prices is likely to reflect supply-side factors.
Overhang in oil inventories weighing on oil prices
Oil price decomposition
(cumulative contributions to changes in oil price since January 2010; oil price in USD per barrel)

Source: Bloomberg, Haver Analytics, IEA and ECB staff calculations.Notes: The decomposition is derived from a monthly structural BVAR model with sign restrictions. The model decomposes the average Brent spot oil price, global oil production and global economic activity and identifies three shocks: i) aggregate demand shocks are identified by an increase in prices, production and activity; ii) precautionary demand shocks are identified by an increase in prices and production and a decrease in activity; iii) supply shocks are identified by an increase in prices and a decrease in production and activity.
Another way to see this is to consider the strong surge in oil inventories among OECD countries.
Overhang in oil inventories weighing on oil prices
OECD oil inventories and oil price
(lhs: billion barrels, rhs: USD per barrel, inverted)
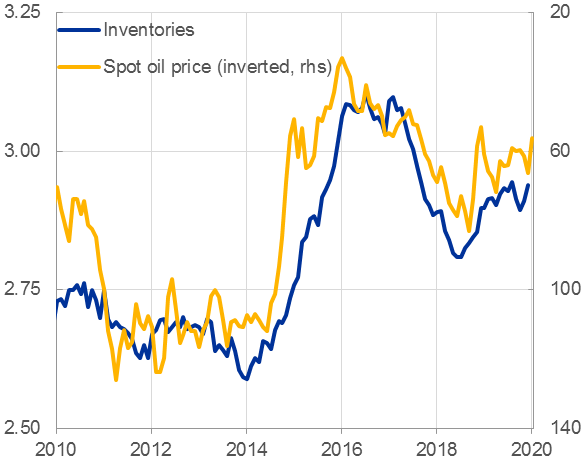
Sources: Bloomberg, IEA and ECB staff calculations.Latest observation: Jan-2020 (spot) and Dec-2019 (inventories).
Oil inventories typically correlate closely, and negatively, with oil prices.
One of the key factors behind the rise in inventories was the initial decision by traditional oil-producing economies to abandon production targets, and hence to put downward pressure on oil prices, in response to the unprecedented surge in shale oil production in the United States that took off at the beginning of the past decade.
Over this period, the United States has emerged as the largest oil producer in the world, and it now accounts for nearly one-fifth of total global oil output.[2]
Shale oil break-even prices may anchor oil price expectations
Market share of major oil producers
(percent)
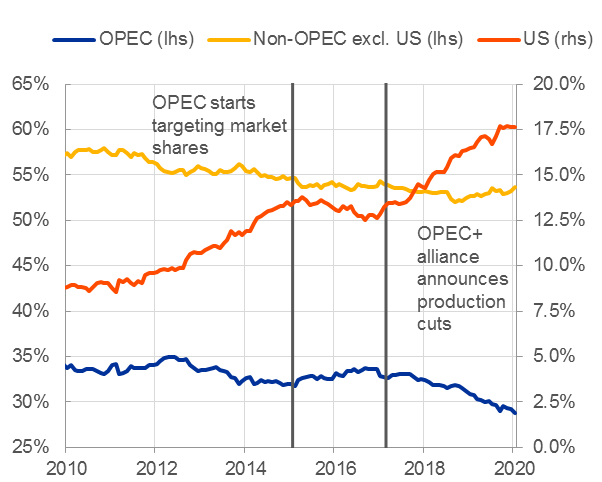
Sources: IEA and ECB staff calculations.Latest observation: January 2020.
There are signs that the rise of the United States as a major oil producer may have fundamentally changed market expectations of the long-run equilibrium price of oil.
Over recent years, we have observed an interesting correlation between future expected oil prices and the evolution of the break-even price of shale oil producers, i.e. the price above which it becomes profitable to exploit new sources of shale oil. All else being equal, market participants expect oil prices to converge towards the expected marginal cost of supply.[3]
Shale oil break-even prices may anchor oil price expectations
Oil production break-evens and long-term oil price expectations
(USD per barrel)

Sources: Dallas Fed, Kansas Fed and Bloomberg.Notes: Dallas Fed data is yearly, Kansas Fed data is bi-yearly.Latest observation: January 2020.
At face value, this anchoring role of the break-even price could suggest that investors consider the shale oil revolution to have structurally changed the elasticity of oil supply to demand fluctuations, and hence to have put an effective ceiling on oil prices.
Whether or not the oil supply has indeed become more elastic, and may therefore permanently reduce the upside contribution of energy to headline inflation, is, ultimately, an empirical question.[4]
But more fundamentally, changes in the oil market have been accompanied by equally far-reaching changes in the use of oil as a production input.
Over the past few decades, technological advances and shifts in the energy and industry composition in advanced economies have gradually reduced the sensitivity of growth and, hence, underlying inflation, to oil price increases.
For example, between 1990 and 2018, global oil intensity – total oil consumption per unit of gross domestic product – fell by 25%.
Global economy more resilient to oil price shocks
Oil intensity
(oil consumption (mbd) per GDP in constant prices)

Sources: IEA, Haver Analytics and ECB staff calculations.Latest observation: 2018.
ECB staff analysis suggests that, as a result, a supply-induced increase in oil prices today causes global industrial production to contract by only around half as much as it did during the 1990s and 2000s.
Global economy more resilient to oil price shocks
Response of global industrial production to oil supply shocks
(impulse responses to shock after 48 months; median and 15th and 85th percentiles, percentage points)
Sources: IEA, FRED and ECB staff calculations.Notes: The response is estimated using a SVAR with sign restrictions. The oil supply shock is identified assuming that it lowers oil production and industrial production but raises the price of oil. The responses are calibrated to a 10 percent shock to the price of oil.
The muted response of financial markets to the tensions in the Middle East around the turn of the year would be consistent with these findings.
These trends could even intensify in the future in the course of the ongoing energy transition.[5]
In the European Union, for example, the objective is to further reduce energy consumption by one-third by 2030, and to increase the use of renewable energy sources.[6] If successful, this would further mitigate the pass-through of potential oil price fluctuations to production and, hence, underlying inflation.[7]
Moreover, if more fundamental progress is achieved in terms of energy storage, the marginal cost of producing renewable energy may become considerably lower and more stable compared with the production of fossil fuels. This could much more fundamentally transform the role of energy in affecting overall price dynamics.[8]
Taken together, persistent supply shocks of this nature potentially pose a dilemma for monetary policy in the sense that improved energy efficiency and more stable oil prices have supported, and continue to support, consumption and investment, but risk entrenching expectations of low inflation.
In this case, central banks may no longer be able to afford to “look through” such shocks, and may be forced to shorten the horizon over which inflation should be brought back to their aim.
This trade-off is even more problematic in the vicinity of the effective lower bound, for at least two reasons.
The first, and most obvious, is because policy space is reduced. The second is that a more intense usage of non-standard policy measures, such as negative interest rates or asset purchases, may shift the balance of the costs and benefits of providing an additional unit of monetary accommodation.
The implication of this is that, today more than ever, central banks need to have a solid understanding of how inflation expectations ultimately affect the inflation outlook and which expectations are at play. This question is an integral part of the ECB’s ongoing strategy review.
If, for example, market-based inflation expectations prove to have only a marginal effect on actual inflation, then the case for central banks acting on these measures is weakened substantially, even if they signal rising discomfort about future inflationary pressures.
The role of profits in the transmission of monetary policy
The second structural factor that I would like to discuss today relates to the role of profit margins in affecting inflation outcomes and the transmission of monetary policy.
It is well-known that many firms routinely absorb short-term fluctuations in demand, exchange rates or production costs in their profit margins.
In the euro area, for example, there is substantial variation in profit margins over time.
Variations in profit margins affect inflation dynamics
GDP deflator and components
(annual percentage changes, pp contributions)
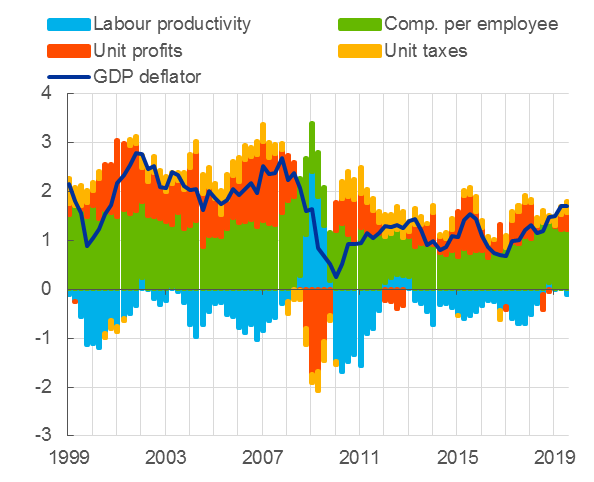
Sources: Eurostat and ECB calculations.
A model-based assessment by ECB staff shows that demand shocks – both domestic and foreign – and changes in oil prices are prime sources of fluctuations in profit margins.
Variations in profit margins affect inflation dynamics
Structural decomposition of unit profits
(deviations from mean in y-o-y terms and pp contributions)
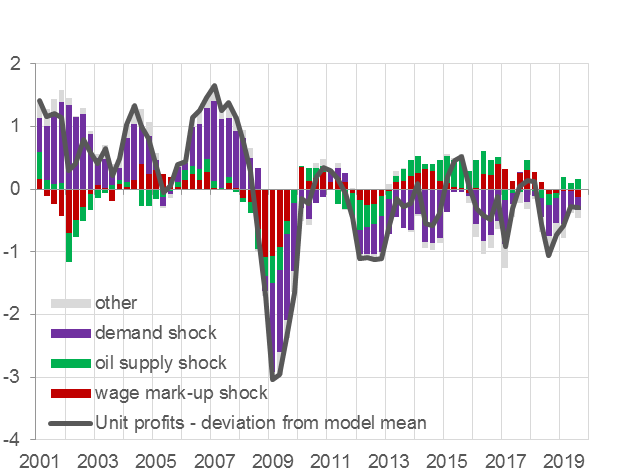
Sources: ECB staff calculations. Hahn, E (2019), “A model-based interpretation of the drivers of recent and projected euro area profit margin developments”, ECB, mimeo.Notes: Historical decomposition of unit profit growth from a BVAR model in which domestic and foreign demand shocks, wage-mark up shocks and oil supply shocks are identified via sign restrictions.
An issue that is less well understood, however, is whether this buffering role of profit margins has changed over time – that is, whether structural changes in the profitability of firms have increased or reduced the role of profits in affecting aggregate price dynamics.
My starting point for answering this question is the evolution of the profit share over time. You can see that the profit share has increased substantially, both in the euro area and the United States.[9]
Structural rise in profit share and number of highly profitable firms
Profit shares in the euro area and the United States
(percentages)

Sources: Eurostat, Area Wide Model database, OECD and ECB calculations.Notes: The profit shares are calculated as the share of gross operating surplus over gross operating surplus plus compensation of employees. Gross operating surplus is corrected for the self-employed.
In the euro area, it has increased from an average level of 25% in the 1970s to 37% today, and it has increased by even more than in the United States over this period.
This rise has not been sudden. It has rather been a gradual and persistent increase that only came to a halt with the outbreak of the global financial crisis in 2008.
Macroeconomic data are often only a very crude proxy of net entrepreneurial income. But microdata corroborate the view that aggregate profitability is likely to have increased structurally over time.[10]
Structural rise in profit share and number of highly profitable firms
Profitability of firms in the euro area
(percentage of firms)

Sources: Orbis Global – Bureau van Dijk micro-data and ECB calculations.Notes: Percentage of firms grouped by profit margin level: Very Positive(>5%), Positive(0 to 5%), Negative (-5 to 0%), Negative (<-5%). Profit margins are calculated as profits over revenue where in the calculation of profits all expenses are taken into account, including material and labour costs as well as interest, taxes and other operating expenses. The micro-data include non-financial firms with at least 10 years in the panel and aggregate economy output coverage of 50-70% on average. The between country weighting is done using GDP weights.
The share of euro area firms with very high profitability – here measured as firms displaying a ratio of profits over revenues of greater than 5% – has increased by around 10 percentage points, to 42%, since 1995. At the same time, the share of firms with very low profitability has declined.
Two broad competing hypotheses have been proposed in the literature to explain the rise in profits, mainly for the case of the United States. One is that growing profits are the result of the rise of highly productive “superstar firms”. The other hypothesis, which is less favourable, is that a gradual decline in competition and increased regulation has protected rent-seeking firms.[11]
A more detailed discussion of these hypotheses is beyond the scope of my remarks today. I will rather focus on what the rise in profits may imply for the pass-through of monetary policy to inflation.
I see two broad repercussions.
The first is rather mechanical but quantitatively important. Rising profits imply a lower labour share, so changes in labour costs have less direct impact on inflation than they did two or three decades ago.
The second, and related, implication is that higher profit margins provide a larger cushion for firms to absorb cost-push shocks, such as wage increases.
A staff analysis using the ECB’s workhorse structural model, the New Area-Wide Model, supports the view that profit margins were, and are, being used to cushion emerging price pressures.[12]
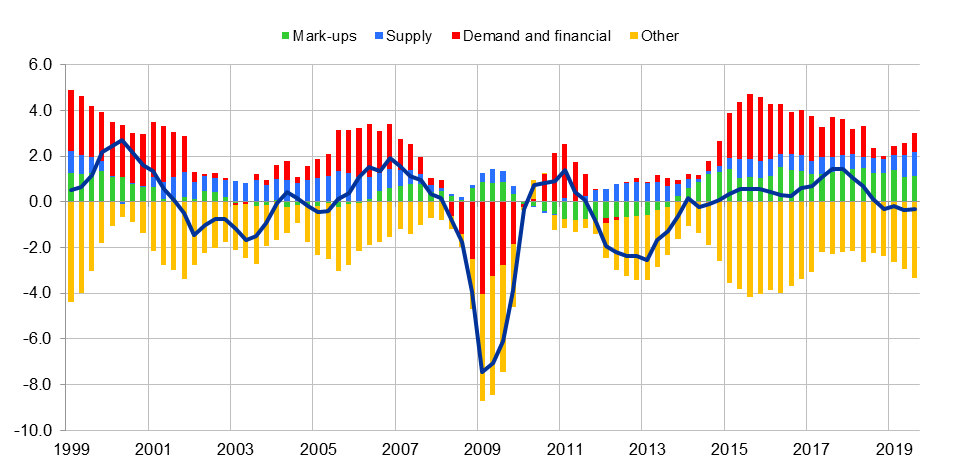
Profit margins buffer upside shocks to inflation
Decomposition of euro area HICP inflation based on the New Area-Wide Model II
(annual rates, deviations from model-implied steady state of 1.9% in pp)

Notes: The chart presents the decomposition of euro area HICP inflation into structural shocks based on the New Area-Wide Model (NAWM) II. The mark-up shock group consists of the shocks to the wage mark-up, the domestic price and export price mark-ups, as well as the import price mark-up. The supply shock group comprises the persistent and the transitory component of the model’s permanent technology shock, and the transitory technology shock. The demand and financial shock group includes the shocks to government consumption, import demand, export demand preferences, monetary policy, as well as the domestic and external risk premium shocks, the shock to the survival rate of the wholesale banks, and the shock to the mark-down parameter of the retail banks. The “Other” shock group comprises the investment-specific technology shock, shocks to foreign variables, measurement errors, and shocks in bridge equations. See Coenen, G., Karadi, P., Schmidt, S. and Warne, A. (2018), “The New Area-Wide Model II: an extended version of the ECB's micro-founded model for forecasting and policy analysis with a financial sector”, ECB Working Paper No 2200.
Since the introduction of the euro, mark-up shocks – that is, changes in profit margins – (green bars) have never played a larger and more persistent role in mitigating upward pressure on inflation than they do today.
This does not mean that the pass-through of changes in demand and production costs to final consumer prices is generally impaired. Rather, it means that the lags with which they are transmitted may be longer and more variable.
Recent ECB research has confirmed that there is a robust link between changes in labour costs and price inflation in the euro area.[13] But it also highlights that this link is state and shock-dependant. In an environment of weak demand, for example, firms tend to absorb cost-push shocks by compressing their price mark-ups.
The implication is that today, as compared with the 1970s, 1980s or 1990s, the structural rise in profit margins allows firms to buffer shocks over a longer horizon. The current resilience in underlying inflation, despite the marked increase in wage growth, may be less surprising in the light of these findings.
ECB research indeed confirms that the role of profits may have changed more fundamentally over time.[14]
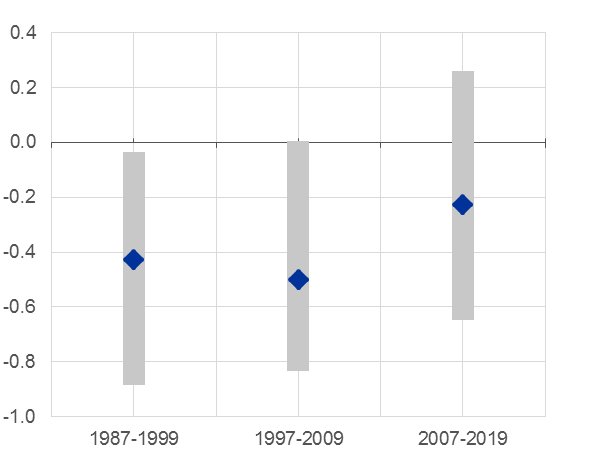
Changing the role of profits in absorbing wage shocks

Source: Hahn, E. (2019), “How are wage developments passed through to prices in the euro area? Evidence from a BVAR model”, Applied Economics, published online 1 November 2019. Notes: The x-axis refers to the quarters since the shock. The magnitude of the shock is normalised to a 1% increase in compensation per employee over the first four quarters. It is assumed that indirect taxes net of subsidies respond proportionally to real GDP such that this component does not contribute to the changes in the GDP deflator.
This research analyses the response of the GDP deflator, for three different sub-samples, to a 1% increase in compensation per employee. According to this research, profits only started to take on a measurable buffering role over the past 20 years. In the 1970s, by contrast, profits even slightly increased in the face of a labour cost-push shock.
These changes may, of course, reflect a number of factors.
One factor could relate to the level of inflation because the secular decline in inflation over time may have reduced the perceived persistence of cost-push shocks and thus have raised the willingness of firms to absorb these shocks through changes in profit margins.[15]
Another factor may relate to changes in the degree of competition.
Digitalisation and growing price transparency through the internet may be increasingly limiting the ability of firms to pass through changes in costs to final consumer prices.[16] Research shows, for example, that price levels on websites and physical stores are identical 72% of the time.[17]
The point worth noting here, however, is that the marked secular rise in profits is likely to have expanded the room for manoeuvre of the rising share of very profitable firms to cope with such structural changes. It could thus have contributed to the changing role of margins in the propagation of cost-push shocks.
For central banks, this means that the effects of monetary policy may, at times, take longer to show through in underlying inflation, in particular in periods of elevated uncertainty.
It also means that profit margins may currently operate like a benign supply-side shock: they lift output but they suppress inflation.[18]
Mark-up shocks act like benign supply-side shocks
Decomposition of euro area real GDP based on the New Area-Wide Model II
(annual rates, deviations from model-implied steady state in pp)
Notes: The figure presents the decomposition of euro area real GDP into structural shocks based on the New Area-Wide Model (NAWM) II. The mark-up shock group consists of the shocks to the wage mark-up, the domestic price and export price mark-ups, as well as the import price mark-up. The supply shock group comprises the persistent and the transitory component of the model’s permanent technology shock, and the transitory technology shock. The demand and financial shock group includes the shocks to government consumption, import demand, export demand preferences, monetary policy, as well as the domestic and external risk premium shocks, the shock to the survival rate of the wholesale banks, and the shock to the mark-down parameter of the retail banks. The “Other” shock group comprises the investment-specific technology shock, shocks to foreign variables, measurement errors, and shocks in bridge equations. See Coenen, G., Karadi, P., Schmidt, S. and Warne, A. (2018), “The New Area-Wide Model II: an extended version of the ECB's micro-founded model for forecasting and policy analysis with a financial sector”, ECB Working Paper No 2200.
And this supply-side nature of changes in profit margins implies that the policy-relevant horizon over which policymakers should steer inflation back to their aim is longer than it would have been in the absence of such structural changes, similar to the effects of the shale oil revolution.
Conclusion
Let me conclude.
The ECB aims to reach its inflation aim of below, but close to, 2% over the medium term. How long the medium term is depends on various factors, including the nature, size and persistence of economic shocks.
The current highly accommodative monetary policy stance has succeeded in materially shortening the horizon over which inflation will return to levels closer to 2%. Current and expected inflation rates, however, remain well below target.
I have argued that at least two structural factors – the changed role of energy inflation and the cushioning effect of higher profit margins – have weighed on underlying price pressures.
Such sizeable and persistent supply-side shocks pose a dilemma for central banks. On the one hand, they call for a lengthening of the horizon over which the ECB should steer inflation back to its aim. On the other hand, central banks are limited in the extent to which they can ignore such shocks without risking a destabilisation of inflation expectations.
This trade-off is particularly stark in the vicinity of the effective lower bound, where attempting to further shorten the horizon by easing financial conditions carries the risk of shifting the balance of the costs and benefits of a highly accommodative monetary policy stance by increasing risks to financial stability.
In this environment, it is imperative for central banks to have a solid understanding of the potential risks of second-round effects, which includes a thorough assessment of how, and which, inflation expectations affect actual inflation outcomes, as well as of the side effects of unconventional monetary policy measures, in particular as regards financial stability.
These efforts will be an important part of the ECB’s ongoing strategy review.
Thank you.
- [1]See, for example, Altavilla, C., Carboni, G. and Motto, R. (2015), “Asset purchase programmes and financial markets: lessons from the euro area”, Working Paper Series, No 1864, ECB, November; Andrade, P., Breckenfelder, J., De Fiore, F., Karadi, P. and Tristani, O. (2016), “The ECB’s asset purchase programme: an early assessment”, Working Paper Series, No 1956, ECB, September; and Blattner, T.S. and Joyce, M. (2020), “The Euro Area Bond Free Float and the Implications for QE”, Journal of Money, Credit and Banking, available online.
- [2]Despite an agreement among the members of the Organization of Petroleum Exporting Countries (OPEC) and non-OPEC countries, such as Russia and Mexico, to reduce excess inventories, compliance with agreed production cuts has been fragile at best, in particular in non-OPEC countries. Current oil inventories remain well above, and are even migrating further away from, the agreed target that has been defined as the average inventory level reached between 2010 and 2014.
- [3]See also Patel, K. and Plante, M.D. (2019), “Breakeven Oil Prices Underscore Shale’s Impact on the Market,” Federal Reserve Bank of Dallas Economic analysis and insights. It should be noted that actual break-even rates vary widely between regions. Moreover, the consolidation in the shale industry, which had taken place between 2011 and 2014, as well as technological advances now allow US producers to easily stop and reactivate production, meaning that US producers would likely add to supply even if current inventories were to be effectively reduced.
- [4]See, for example, Foroni, C. and Stracca, L. (2019), “Much ado about nothing? The shale oil revolution and the global supply curve”, Working Paper Series, No 2309, ECB, August.
- [5]In addition, with the United States having become a major oil producer, empirical evidence suggests that an increase in the price of oil today has broadly neutral effects on the US economy, as consumption and investment effects largely neutralise each other. This also reduces negative spillovers to the rest of the global economy. See Baumeister, C. and Kilian, L. (2016), “Lower Oil Prices and the U.S. Economy: Is This Time Different?”, Brookings Papers on Economic Activity, The Brookings Institution, Vol. 47, No 2 (Fall), pp. 287-357.
- [6]See European Commission (2015), A Framework Strategy for a Resilient Energy Union with a Forward-Looking Climate Change Policy.
- [7]The opposite effect could occur if the effect of carbon pricing on energy price inflation dominates the effects of the change in energy consumption and composition.
- [8]See, for example: Bielen, D. et al. (2017), “The Future of Power Markets in a Low Marginal Cost World”, Working Papers, No 17-26, Resources for the Future, December; and Archer, C. L. and Jacobson, M. Z. (2005), “Evaluation of global wind power”, Journal of Geophysical Research, Vol. 110, pp. 1-20.
- [9]For the United States, see also Barkai, S. (forthcoming), “Declining Labor and Capital Shares”, Journal of Finance.
- [10]Forthcoming ECB staff analysis based on microdata highlights that aggregate markups have also been increasing since at least the mid-1990s (the period for which such data are available).
- [11]See, for example: Autor, D. et al. (2017), “The Fall of the Labor Share and the Rise of Superstar Firms”, NBER Working Paper Series, National Bureau of Economic Research, No 23396, May; and Gutiérrez, G. and Philippon, T. (2017), “Declining Competition and Investment in the U.S.”, NBER Working Paper Series, No 23583, National Bureau of Economic Research, July.
- [12]See Coenen, G. et al. (2018), “The New Area-Wide Model II: an extended version of the ECB’s micro-founded model for forecasting and policy analysis with a financial sector”, Working Paper Series, No 2200, ECB, November.
- [13]See Bobeica, E., Ciccarelli, M. and Vansteenkiste, I. (2019), “The link between labor cost and price inflation in the euro area”, Working Paper Series, No 2235, ECB, February.
- [14]See Hahn, E. (2019), “How are wage developments passed through to prices in the euro area? Evidence from a BVAR model”, Applied Economics, available online.
- [15]See, for example, Taylor, J. (2000), “Low inflation, pass-through, and the pricing power of firms”, European Economic Review, Vol. 44, No 7, pp. 1389-1408.
- [16]The reality, of course, is much more complicated as digitalisation may affect competition in different ways.
- [17]See, for example, Cavallo, A. (2017), “Are Online and Offline Prices Similar? Evidence from Large Multi-channel Retailers”, American Economic Review, Vol. 107, No 1, American Economic Association, pp. 283-303.
- [18]Should increased profit margins merely reflect the outcome of lower competition, then this benign effect may be mitigated.
Europeiska centralbanken
Generaldirektorat Kommunikation och språktjänster
- Sonnemannstrasse 20
- 60314 Frankfurt am Main, Tyskland
- +49 69 1344 7455
- media@ecb.europa.eu
Texten får återges om källan anges.
Kontakt för media