





Rising bankruptcies, resilient loan books: unpacking euro area corporate credit risk
Published as part of the Financial Stability Review, May 2026.
Corporate bankruptcies in the euro area have been on the rise, but the aggregate asset quality of banks’ corporate lending has remained broadly stable. This special feature analyses this divergence and its implications for financial stability. It shows that rising bankruptcies may partly be explained by the normalisation of firm turnover since the COVID-19 pandemic, albeit with marked cross-country unevenness. At the same time, firm-level evidence suggests that balance sheet and profitability challenges are concentrated in a vulnerable tail of firms, but have remained stable for the average euro area company. Structural changes in corporate financing, including a declining reliance on bank loans and a larger role for equity, debt securities and non-bank lending, imply that a greater share of corporate risk might be outside the banking system. The analysis also shows that broadly stable aggregate asset quality reflects diverging trends in loan performance across countries and firm sizes, as well as banks’ proactive management of non-performing loans. Overall, it does not find any systematic evidence for banks delaying the recognition of non-performing loans in their loan books. Instead, the analysis indicates that weaker firm fundamentals result in a higher probability of bank exposures being reclassified from performing to non-performing.
1 Introduction
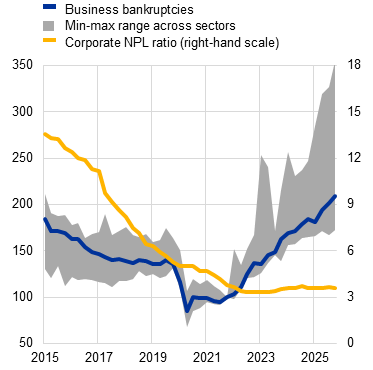
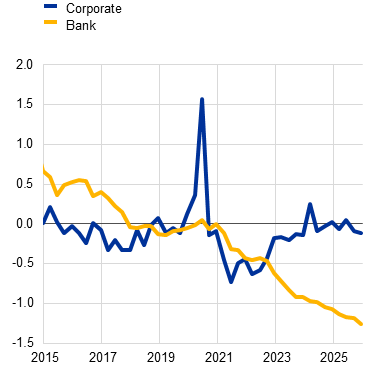
Corporate bankruptcies have been on the rise, but the aggregate asset quality of corporate loan portfolios remains remarkably strong. The number of euro area corporate bankruptcies has increased markedly since the withdrawal of pandemic-era support measures, surpassing pre-pandemic levels and broadening across sectors (Chart B.1, panel a).[1] By contrast, composite vulnerability indicators suggest that corporate vulnerabilities have increased only moderately from their trough (Chart B.1, panel b) and euro area banks’ aggregate corporate asset quality has remained robust (Chart B.1, panel a). The rising number of business failures has thus not translated into a broad-based deterioration in banks’ corporate loan books. In other words, the current insolvency cycle has, so far, not resulted in a visible deterioration in bank-facing aggregates. There could be several explanations for this. It may well be that the firms declaring bankruptcy are small or that they are mainly funding themselves using internal or market-based finance. Asset quality dynamics can diverge across countries and firm sizes, the recognition of non-performing loans (NPLs) can lag increased credit risk and the action taken by banks to deal with problem loans early can dampen net NPL dynamics. This special feature investigates the role played by some of these potential factors and their implications for financial stability.
Chart B.1
Corporate bankruptcies have surpassed pre-pandemic levels, while banks’ corporate asset quality is stable and broader vulnerabilities remain contained
a) Declarations of bankruptcy and corporate NPL ratio in the euro area | b) Composite indicators of corporate and bank vulnerabilities |
|---|---|
(Q1 2015-Q4 2025; left-hand scale: index: Q4 2021 = 100, right-hand scale: percentages) | (Q1 2015-Q4 2025, z-scores) |
 |  |
Sources: Eurostat and ECB (QSA), ECB (supervisory data), S&P Global Market Intelligence and ECB calculations.
Notes: Panel a: the blue area shows the minimum-maximum range of index values across the following sectors: construction, trade, transport, accommodation and food services, information and communication, finance and real estate and professional services, industry excluding construction, education and health care. Panel b: for details of how the corporate vulnerability index is constructed, see Gardó et al.* The composite bank vulnerability indicator is based on a set of indicators along five dimensions: capital (CET1 ratio and leverage ratio), asset quality (NPL ratio), management (cost/income ratio), earnings (return on equity and return on assets) and liquidity (loan/deposit ratio). Positive values indicate higher levels of vulnerability while negative values indicate lower levels of vulnerability.
*) Gardó, S., Klaus, B., Tujula, M. and Wendelborn, J., “Assessing corporate vulnerabilities in the euro area”, Financial Stability Review, ECB, November 2020.
2 Firm entry-exit dynamics and corporate balance sheet heterogeneity shape the insolvency cycle
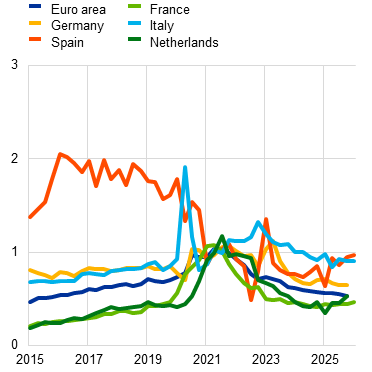
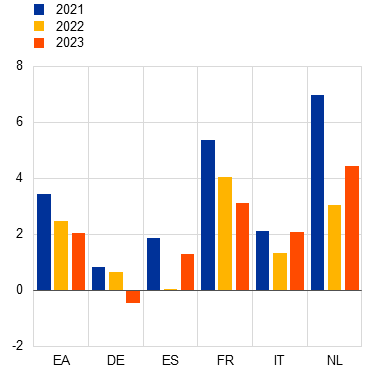
Firm entry-exit dynamics have normalised since the pandemic, which partly explains the recent rise in bankruptcies. During the pandemic, extensive government support measures – including debt moratoria, public guarantees and other schemes – distorted the usual entry-exit dynamics by suppressing insolvencies and cushioning firms’ cash flows.[2] Against this backdrop, a first step when interpreting rising bankruptcies is to look beyond failures alone and to assess broader entry and exit developments. The registrations/bankruptcies ratio spiked in around 2020-21 and then declined as bankruptcies “caught up”, pointing to a partial “return of exit” after the pandemic (Chart B.2, panel a). It would appear that this normalisation had largely played out by around 2023, when the ratio returned close to its pre-pandemic level. The subsequent gradual downward drift suggests that bankruptcies have continued to rise beyond the level implied by normalisation alone. At the same time, both business registrations and bankruptcy declarations show notably different patterns across countries. The data also highlight that firm exits persistently exceed entries in several countries, although there is no clear relationship between this phenomenon and standard measures of corporate stress or NPL dynamics. This suggests that part of the observed exit dynamics may reflect structural forces (e.g. demographic trends or changes to business models) rather than financial distress alone.[3] Moreover, start-up job creation – an additional indicator of economic health – has cooled unevenly: employment gains associated with newly established enterprises have been stronger in some countries than others such as Germany, where net employment in newly created enterprises has turned negative at the margin (Chart B.2, panel b). This cross-country unevenness matters for financial stability because countries showing a sharper rise in insolvencies may be those where banks have larger or more concentrated exposures to vulnerable firms, increasing the scope for localised credit losses.
Chart B.2
Firm creation has normalised since the pandemic, while start-up job creation has cooled unevenly across countries
a) Business registrations and bankruptcy declarations | b) Net persons employed in newly created enterprises |
|---|---|
(Q1 2015-Q1 2026, ratios) | (2021-23, percentages) |
 |  |
Sources: Eurostat and ECB calculations.
Notes: Panel a: ratio of new business registrations to declarations of bankruptcy. A value below one indicates more bankruptcy declarations then registrations. Panel b: persons employed in newly born enterprises minus persons employed in enterprise deaths divided by total persons employed.
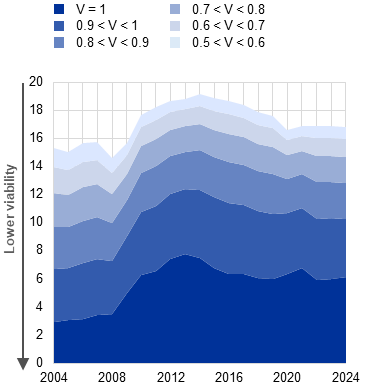
Tail vulnerabilities appear persistent, with a non-negligible share of firms close to distress. Available cross-country evidence suggests that micro and small firms account for much of the recent rise in insolvencies.[4],[5] To shed further light on whether these dynamics reflect broad-based weakening or pressures concentrated in a subset of firms, aggregate evidence is complemented with firm-level indicators of viability, debt servicing capacity and distress risk. Based on firm viability scores, the most recent share of non-viable firms (V=1) stands at around 6%. A further share of roughly 6% clustered just below the non-viability threshold (0.9<V<1), pointing to a non-negligible density of firms close to distress (Chart B.3, panel a). The incidence of weak firms increased markedly after the global financial crisis, peaked in the early 2010s, and has declined gradually since then. It has remained broadly stable in recent years, suggesting that the vulnerable tail is not merely cyclical. Patterns at the country and sector levels are consistent with differing growth trajectories across countries and the uneven impact of major shocks (most notably the global financial crisis and the COVID-19 pandemic) across sectors.[6]
Chart B.3
Firm-level fragility metrics point to a relatively small but persistent vulnerable tail, while for the average firm dynamics remain flat
a) Share of vulnerable firms in the euro area, by viability score | b) Distribution of interest coverage ratios and Altman Z-scores in euro area real sectors |
|---|---|
(2004-24, percentages) | (Q1 2016-Q4 2025; ratios, Z-scores) |
 |  |
Sources: Moody’s, S&P Global Market Intelligence and ECB calculations.
Notes: Panel a: the viability score V takes values between 0 and 1, where 1 denotes non-viable firms. Non-viable firms are defined as those firms that meet all of the following three criteria over two consecutive years: (i) negative returns on assets, (ii) low debt servicing capacity (EBITDA/financial debt of below 5%), and (iii) negative net investment (annual change in total fixed assets). Scores below 1 capture the distance between the median firm and the threshold for each of these criteria. The measure is based on the identification of “zombie” firms by Storz et al.* and the extension into a continuous score by Mingarelli et al.** Panel b: interest coverage ratio (ICR) is defined as EBIT divided by interest paid. The Altman Z-score calculation is sector specific, as set out in Altman***, Altman**** and Altman, Hartzell and Peck*****. A higher Altman Z-score corresponds to a healthier balance sheet structure. Other real sectors include firms involved in agriculture, arts and recreation, construction, information and communication, other industry, professional services, real estate, and wholesale and retail trade.
*) Storz, M., Koetter, M., Setzer, R. and Westphal, A., “Do we want these two to tango? On zombie firms and stressed banks in Europe”, Working Paper Series, No 2104, ECB, October 2017.
**) Mingarelli, L., Ravanetti, B., Shakir, T. and Wendelborn, J., “Dawn of the (half) dead: the twisted world of zombie identification”, Working Paper Series, No 2743, ECB, October 2022.
***) Altman E.I., “Financial Ratios, Discriminant Analysis and the Prediction of Corporate Bankruptcy”, The Journal of Finance, Vol. 23, No 4, September 1968, pp. 589-609.
****) Altman, E.I., Corporate Financial Distress: A Complete Guide to Predicting, Avoiding, and Dealing With Bankruptcy, Wiley Interscience, John Wiley and Sons, Hoboken, 1983.
*****) Altman, E.I., Hartzell, J. and Peck, M., “Emerging market corporate bonds − a scoring system”, in Levich, R.M. (ed.), Emerging Market Capital Flows, Vol. 2, The New York University Salomon Center Series on Financial Markets and Institutions, Springer, Boston, MA, 1998.
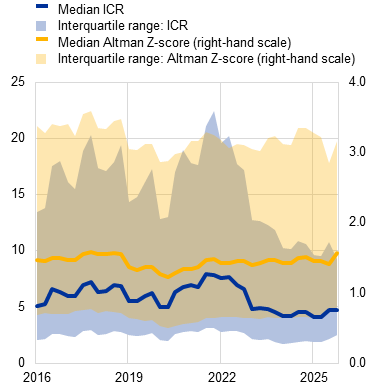
Recent indicators point to contained aggregate pressures, even though debt servicing capacity has fallen from its post-pandemic highs. Firm-level evidence based on more recent S&P Capital IQ data do not indicate any broad-based deterioration of corporate health until the end of the fourth quarter of 2025. Interest coverage ratios (ICRs) indicate that the typical firm is still covering its interest expenses by a comfortable margin, even though the median ICR has declined from its post-pandemic highs as funding costs have risen, and liabilities have repriced. Since 2022, dispersion in the ICR distribution has narrowed, largely reflecting a deterioration at the upper end as firms with previously solid interest coverage have seen their buffers decline (Chart B.3, panel b).[7] This upper-tail compression does not in itself signal any imminent risk of insolvency, given that these firms remain less leveraged and are more profitable than their peers. It does, however, reduce the buffers of firms that are otherwise resilient and could increase their sensitivity to further adverse shocks. Similarly, both the median and the interquartile range for Altman Z-scores, a more holistic measure of firm distress risk, have remained relatively stable. Nevertheless, the risk of defaults and near-term credit losses remains more closely linked to developments in the lower tail, where buffers are limited in size. In this regard, both metrics point to a persistent vulnerable tail.
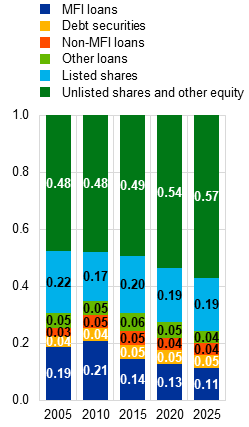
The long-running shift in corporate financing towards deprioritising bank credit forms the background to the recent disconnect between rising bankruptcies and resilient bank asset quality. Over the past two decades, euro area non-financial corporations (NFCs) have gradually become less reliant on bank loans. The share of lending by monetary financial institutions (MFIs) in total financing has trended down while equity has gained in importance, with debt securities and non-MFI loans playing an increasingly important role on the liability side (Chart B.4, panel a).[8] Nevertheless, bank lending remains the largest single component of liabilities, even if its share has declined notably since the global financial crisis. While these shifts largely pre-date the post-pandemic upswing in bankruptcies, they suggest that a non-negligible share of corporate risk may be outside the banking system.[9] Also, the marginal failure of firms seen today may involve less bank finance than in earlier cycles, dampening the pass-through from insolvencies to banks’ NPL ratios. Stable firm risk indicators, coupled with the recent erosion of debt servicing capacity for comparatively less risky firms, align with the view that banks’ exposures remain tilted towards more resilient borrowers.
3 Stable aggregate bank asset quality can be explained by cross-sectional heterogeneity and balanced NPL inflows and outflows
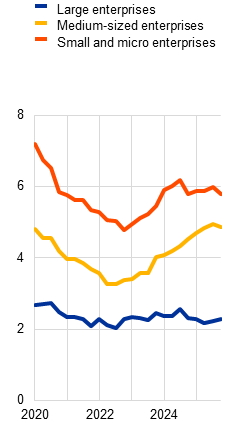
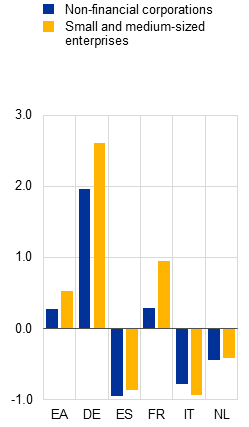
The resilient aggregate asset quality of bank corporate lending is also a reflection of heterogeneous dynamics across corporate sizes and countries. Disaggregated data point to marked divergences: while loans to large firms have maintained persistently high asset quality, NPL ratios for medium as well as those for small and micro firms have been increasing since 2023 (Chart B.4, panel b). This is consistent with the broader picture showing that the recent rise in bankruptcies has been concentrated among smaller firms. As lending to small and medium-sized enterprises (SMEs) accounts for only around 27% of total corporate lending in the euro area banking sector, the impact of deteriorating asset quality in this segment on the aggregate corporate NPL ratio has been relatively contained (Chart B.1, panel a). Diverging country patterns are also emerging. While corporate loan NPL ratios have continued to decline for banks located in countries that were more affected by the euro area sovereign debt crisis, they increased, in particular, in Germany and France (Chart B.4, panel c).[10]
Chart B.4
The aggregate corporate NPL ratio is at a historically low level, but marked divergencies in trends across corporate types and countries have emerged
a) Financing structure of NFCs in the euro area, by instrument | b) NPL ratio, by firm size | c) Changes in NPL ratio for corporate lending, by country |
|---|---|---|
(Q4 2005-Q4 2025, shares) | (Q1 2020-Q4 2025, percentages) | (Q1 2023-Q4 2025, percentage points) |
 |  |  |
Sources: ECB (supervisory data, AnaCredit, RIAD), Eurostat and ECB (QSA) and ECB calculations.
Notes: Panel b: classification of enterprises by size, in accordance with the Annex to Commission Recommendation 2003/361/EC based on number of employees, annual turnover and balance sheet size. Panels b and c: based on a full sample of significant and less significant institutions. Panel c: EA stands for euro area.
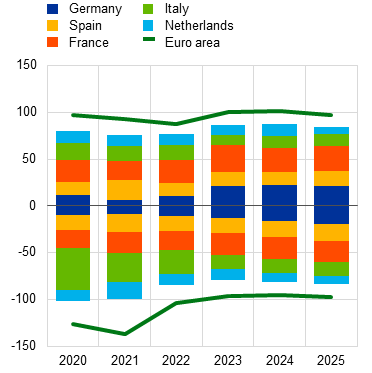
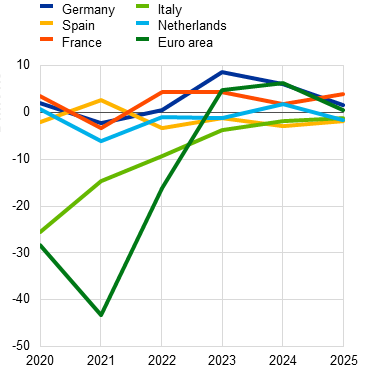
Significant NPL outflows, driven in particular by workouts and sales, have helped to keep net flows low and NPL ratios stable. The stability of NPL ratios may be partly explained by material NPL outflows (Chart B.5, panel a). Net NPL flows have remained relatively contained due to bank-internal workouts, cures, sales of non-performing and/or still-performing but risky portfolios, risk transfers for such portfolios through securitisations and forbearance on non-performing exposures.[11] These measures have contributed to lower inflows and faster NPL turnover than in the past and have reduced net NPL flows, particularly in countries that accumulated experience in managing large legacy portfolios following the euro area sovereign debt crisis (Chart B.5, panel b).[12] The introduction of ECB Banking Supervision’s NPL calendar has also incentivised NPL workouts for euro area banks.[13]
Chart B.5
NPL outflows contribute markedly to reduced NPL ratios
a) Inflows and outflows: corporate sector NPLs, by country | b) Net flows of NPLs for corporate sector portfolios, by country |
|---|---|
(2020-25, € billions) | (2020-25, € billions) |
 |  |
Source: ECB (supervisory data).
Note: Based on a full sample of significant and less significant institutions.
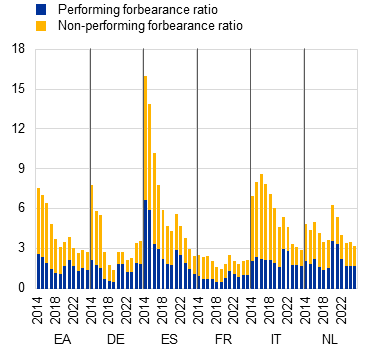
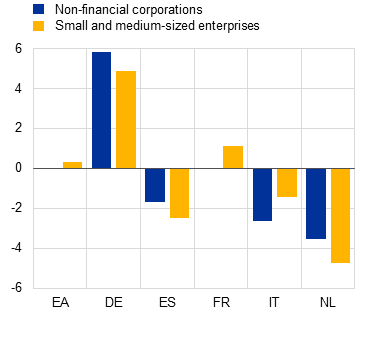
Early warning indicators show potential vulnerabilities in some countries. Some potentially problematic corporate loans for German and French significant institutions may currently be still-performing forborne loans, which have increased markedly since the pandemic (Chart B.6, panel a).[14] Persistently elevated stocks of still-performing forborne loans may point to delayed recognition of credit deterioration, warranting scrutiny of how borrower fundamentals are incorporated into asset quality classification.[15] Similarly, large differences can be observed in Stage 2 ratios across countries, with German and – to a lesser extent – French banks recording increasing ratios (only for SMEs in the case of France), which could indicate rising NPL ratios in the future (Chart B.6, panel b). At the same time, banks in these countries have recorded decreasing NPL coverage ratios for SME lending. Taken together, these vulnerabilities call for close monitoring and further analysis as the build-up of vulnerable loans could translate into higher NPL inflows. The following section investigates the relationship between borrower fundamentals and asset quality classification in bank balance sheets in greater detail.
Chart B.6
Early indicators of deteriorating asset quality are appearing in Germany and France
a) Forbearance ratios of corporate loans, by country | b) Change in Stage 2 ratios for corporate lending, by country |
|---|---|
(2014-25, percentages) | (Q1 2023-Q4 2025, percentage points) |
 |  |
Source: ECB (supervisory data).
Notes: Based on a full sample of significant and less significant institutions. EA stands for euro area.
4 Micro-level evidence shows that bank asset quality classifications reflect the fundamentals of the borrowing firms
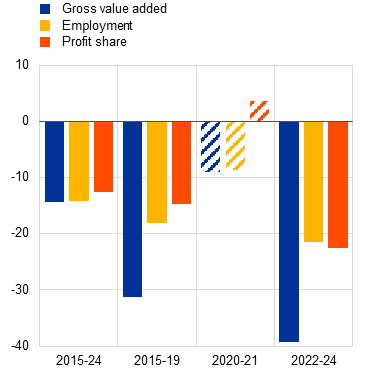
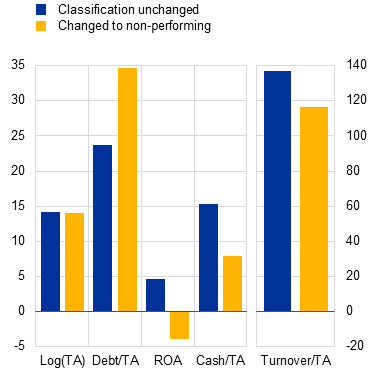
Data at the country level and at the bank-firm level confirm that NPL ratios tend to increase when firm fundamentals deteriorate. The correlations between relevant firm characteristics, such as gross value added, employment and profit share, and changes in the NPL ratio at the country level were negative and significant over the period from 2015 to 2024 (Chart B.7, panel a). However, correlations showed some variation over time. The extraordinary policy measures adopted during the pandemic, such as debt moratoria and government guarantees on lending, resulted in a temporary break in the relationships in 2020 and 2021. After this two-year period, however, the correlations once again turned negative and significant. Furthermore, granular data at the bank-firm level taken from the AnaCredit and Orbis datasets show that firms which had (part of) their bank exposure reclassified from performing to non-performing were on average smaller, more indebted and less profitable, and had lower turnover and weaker cash buffers, than firms whose bank exposures remained classified as performing (Chart B.7, panel b).[16]
Chart B.7
Weaker corporate fundamentals correlate with higher NPL ratios, except during the pandemic years
a) Correlation coefficients between firm characteristics and change in NPL ratio | b) Characteristics of borrowing firms reclassified to non-performing |
|---|---|
(2015-24; percentages, percentage points) | (2018-24, percentages) |
 |  |
Sources: ECB (supervisory data, AnaCredit), Moody’s and ECB calculations.
Notes: Panel a: data at the country-year level for 19 euro area countries. Gross value added and employment reflect percentage growth rates, while profit share reflects changes in percentage points. Hashed areas indicate insignificant relationships at the 10% significance level. The profit share of NFCs is the gross operating surplus divided by gross value added. Panel b: the average across groups is significantly different for each variable. Debt is defined as debt due in more than a year. TA stands for total assets; ROA stands for return on assets.
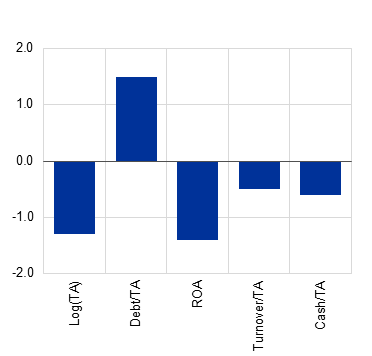
A weakening of firm fundamentals results in the reclassification of bank exposures from performing to non-performing. Even when controlling for multiple firm characteristics simultaneously, our analysis finds that smaller firm size, lower profitability, weaker cash buffers, weaker turnover and a higher debt ratio increase the probability of a firm’s exposure being reclassified from performing to non-performing (Chart B.8, panel a). Indeed, estimations at the bank-firm level show that a 1 percentage point decrease in a firm’s return on assets, cash buffers or turnover is significantly associated with an increase in the probability of bank exposures transitioning to non-performing of 140, 60 and 50 basis points respectively. Furthermore, a 1% smaller firm size is significantly associated with an increase in the probability of bank exposures transitioning to non-performing of 130 basis points, while a 1 percentage point increase in firm leverage increases the probability by 150 basis points.[17] While higher levels of turnover and profitability indicate strong revenues and earnings, firms with larger cash holdings can use this buffer to continue their debt repayments in the event of sudden shortfalls in cash flows.[18] Smaller firms are often less diversified and more financially constrained, making them more vulnerable to idiosyncratic shocks that could trigger default. Finally, a higher debt ratio signals heavier payment requirements.[19]
Chart B.8
Multiple firm characteristics have predictive power over NPL classification, especially when interest rates are high
a) Baseline model | b) Magnifying effect of above-average interest rates |
|---|---|
(2018-24; regression coefficients, percentage points) | (2018-24; regression coefficients, percentage points) |
 |
|
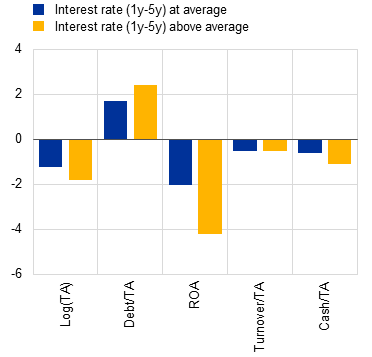
Sources: ECB (AnaCredit, MIR), Moody’s and ECB calculations.
Notes: TA stands for total assets; ROA stands for return on assets. Results from regressions at the bank-firm level with firm, bank x time and country x time fixed effects. The dependent variable is a dummy which is 1 when a bank reclassifies the exposure of the firm from performing to non-performing from year t-1 to year t while firm fundamentals are measured at the end of the year. The results are robust to using lagged firm fundamentals. The exposure magnitude at the bank-firm level is controlled for and is also positively related to the probability of being reclassified. The coefficients reflect an increase in the firm characteristic by 1% (log (TA)) or 1 percentage point (ratios). ROA is defined as profit before taxes divided by total assets. Debt is defined as debt due in more than year. Panel b: the average interest rate (1y-5y) in our sample is 2.56%. The difference between the bars is statistically significant for all variables except the turnover ratio.
The relationship between firm fundamentals and banks’ credit risk assessments is stronger when bank interest rates are higher (Chart B.8, panel b). In other words, in times of higher interest rates, firm fundamentals (with the exception of the turnover ratio) matter more for predicting a reclassification from performing to non-performing.[20] In these phases, firm fundamentals become more important as higher borrowing costs and tighter credit conditions expose underlying weaknesses. Firms with stronger fundamentals can still service their debt, while weaker firms struggle with rising interest payments and refinancing. As cheaper credit disappears, differences in financial health become more pronounced, making fundamentals more predictive of whether exposures might turn non-performing. Overall, the results suggest that banks’ credit risk assessments reflect the health of firms’ balance sheets with no time lag (i.e. in the same year), particularly during periods of higher interest rates.
5 Conclusions and outlook
Rising bankruptcies of late have mainly reflected post-pandemic normalisation and tighter financing conditions. Financially weaker firms are often smaller and are likely to be internally financed. All the same, balance sheet health indicators for the median firm have remained broadly stable. Structural features, including the gradual shift in corporate financing towards equity and market-based instruments, are weakening the direct link between firm failures and bank asset quality. Overall, headline bankruptcy rates remain an imperfect gauge of risks to financial stability, and a full assessment should take into account differences in firms, financing structures and cross-country dispersion.[21]
Aggregate bank asset quality resilience nonetheless masks important cross-sectional differences and possible risks to credit quality. Disaggregated data indicate divergent patterns across countries and firm sizes. The build-up of still-performing forborne and Stage 2 exposures in some countries suggests that a further deterioration in credit quality may be on the way. NPL inflows could therefore increase, with a lag, if − against the backdrop of heightened uncertainty − refinancing risks crystallised, growth weakened or sectoral pressures intensified to such an extent that they eroded corporate fundamentals. The analysis finds no systematic evidence that banks are delaying the recognition of NPLs. Instead, it shows that the reclassification of exposures to non-performing is tied to the deteriorating financial health of the borrowing firms. Furthermore, the asset quality of the euro area banking sector is high, with an aggregate NPL ratio close to the historical low. Banks are better equipped to handle NPLs now than they were in the past, thanks to the experience they have gained with legacy assets and the development of NPL markets following the euro area sovereign debt crisis. Furthermore, ECB Banking Supervision’s NPL calendar incentivises fast NPL turnover in euro area banks. All these factors may be contributing to structurally lower NPL accumulation, all else being equal.
Looking ahead, the war in the Middle East and higher energy prices could amplify adverse dynamics, squeezing the margins and liquidity of vulnerable firms. Energy-intensive sectors with exposed supply chains and firms with limited pricing power would be particularly at risk, the materialisation of which would raise the probability of vulnerable but still-performing exposures being reclassified. If higher energy prices were to reignite inflation and keep financing conditions tighter for longer, the sensitivity of credit risk to firm fundamentals could increase further, consistent with the stronger link observed in high-rate environments.
It is important to note that Eurostat figures for bankruptcy declarations in Spain are inaccurate – and likely biased upwards – from the third quarter of 2022 to the third quarter of 2023. As Spain has a sizeable weight in the euro area aggregate, this also affects the euro area series over the same period. For Spain, Eurostat estimates the number of business bankruptcies during that period (covering both corporations and sole proprietors) using the total number of bankruptcy filings (including individuals without entrepreneurial activity) and historical relationships.
See, for example, Nicoletti, G., Setzer, R., Tujula, M. and Welz, P., “Assessing corporate vulnerabilities in the euro area”, Economic Bulletin, Issue 2, ECB, 2022, and Metzler, J., Mosk, B., de Vette, N. and Welz, P., “Identifying the corporates most vulnerable to price shocks following the pandemic”, Financial Stability Review, ECB, May 2022.
Structural forces that can depress firm entry and alter firm turnover include demographic change and evolving market structure. See, for example, Röhe, O. and Stähler, N., “Demographics and the decline in firm entry: Lessons from a life-cycle model”, Discussion Papers, No 15/2020, Deutsche Bundesbank, 2020, or “OECD Economic Surveys: Germany 2025”, Organisation for Economic Co-operation and Development, 12 June 2025.
See, for example, the national accounts of Germany, Spain and France.
To some extent, this is surprising, as filing for bankruptcy can be more expensive than other procedures; see for example, García-Posada, M. and Mora-Sanguinetti, J.S., “Are there alternatives to bankruptcy? A study of small business distress in Spain”, SERIEs, Vol. 5, Issue 2-3, Springer, 2014, pp. 287-332.
Real estate stands out as persistently more vulnerable, while the pandemic weighed particularly on accommodation, recreation and transport. A key caveat, however, is that around half of the observations in the dataset are drawn from Spain and Italy.
It is important to note that the results are not driven by changes in the composition of the sample. Given the limited sample size, however, we did not undertake further disaggregation by sector.
Equity valuations that structurally growth faster than bank loans as well as the inclusion of NFC-to-NFC credit might overemphasise non-bank financing. However, the results are quantitatively similar to those set out in Box 2 in the report on “Financial Integration and Structure in the Euro Area”, ECB, April 2022.
That said, risk outside of the banking system can still affect banks indirectly via contagion, non-bank-to-bank linkages, etc.
In line with this analysis, changes in asset quality also differ across sectors, with NPL ratios for construction and real estate, for example, increasing since 2023, while the NPL ratio for accommodation has decreased steadily since it peaked during the pandemic.
Stable NPL ratios could also be explained by banks actively rebalancing their portfolios towards safer borrowers. For example, a study shows that during the pandemic, bank liquidity was more likely to be allocated to larger, less risky firms. See Chodorow-Reich, G. et al., “Bank liquidity provision across the firm size distribution”, Journal of Financial Economics, Vol. 144, No 3, 2022, pp. 908-932.
For more information, see Fell, J. et al., “Creditor coordination in resolving non-performing corporate loans”, Financial Stability Review, ECB, November 2021, and NPL Advisory Panel, “Further developing secondary markets for non-performing loans: The role of securitisation”, European Union, 2023.
See, for example, Budnik, K. et al., “The economic impact of the NPL coverage expectations in the euro area”, Occasional Paper Series, No 297, ECB, July 2022.
Following the persistently high NPL levels seen in the European banking sector, the newly established ECB Banking Supervision prioritised the reduction of these levels and set supervisory expectations for the recognition and management of NPLs. These expectations were further strengthened by adding calendar-based provisions for a non-performing asset, increasing with time spent in default. See the ECB’s 2017 Guidance to banks on non-performing loans, followed by an addendum in 2018 and a further communication in 2019. Since 2021 the calendar-based capital deductions have been part of the Capital Requirements Regulation (CRR).Performing forborne loans are loans that are subject to forbearance measures due to difficulties already experienced (or likely to be experienced) by the borrower in meeting its financial commitments, but that do not qualify as non-performing in accordance with Article 47a(3) of the Capital Requirements Regulation. This would apply in the case, for example, of non-defaulted loans for which the concessions (such as, for example, payment suspensions, reduced payments and interest rate reductions) result in insignificant changes to the net present value of the loan, or in the case of loans that have exited non-performing status but continue to follow the restructured conditions. Forborne loans also increased significantly during the pandemic, owing to a combination of unprecedented economic shock, proactive regulatory support and widespread lender initiatives designed to prevent massive borrower defaults. Forbearance was used to offer short-term cash-flow relief, especially to NFCs, helping them to avoid immediate default and allowing banks to avoid immediate, large-scale loan losses.
This concern is reinforced by evidence showing that the average firm with performing forborne loans is similar to the average firm with NPLs, with significantly lower cash and turnover ratios, lower profitability and a higher debt ratio than the average firm with performing loans (based on combined AnaCredit-Orbis data).
The result is in line with previous work on stage classification transitions during the pandemic set out in Grodzicki, M. and Spaggiari, M., “Bank asset quality in the COVID-19 pandemic and prior corporate vulnerabilities”, Economic Bulletin, Issue 2, ECB, 2022.
The results also reveal non-linear effects. First, at lower levels of cash buffers, turnover and profitability, a 1% decrease in these variables leads to a greater increase in the probability of bank exposures transitioning to non-performing than at higher levels. Second, the effect of a 1% increase in the debt ratio is greater as indebtedness rises.
In line with the empirical literature; see, for example, Acharya, V.V., Davydenko, S.A. and Strebulaev, I.A., “Cash Holdings and Credit Risk”, The Review of Financial Studies, Vol. 25, No 12, 2012, pp. 3572-3609, and Gupta, J. and Gregoriou, A., “Impact of market-based finance on SMEs failure”, Economic Modelling, Vol. 69, 2018, pp. 13-25.
See Cathcart, L., Dufour, A., Rossi, L. and Varotto, S., “The differential impact of leverage on the default risk of small and large firms”, Journal of Corporate Finance, Vol. 60, February 2020.
Within our sample period, the period of above-average rates largely coincides with post-pandemic years.
This is in line with good practices shared by ECB Banking Supervision. These recommend that banks rely on early warning indicators such as those based on firm fundamentals rather than on late indicators such as insolvency, bankruptcy and days past due. See McDonald, M.-T., Castro Quintas, C., Chen, F., Roldão, M., Rizza, S. and Fröhlke, T., “Extinguishing sparks before the fire: credit crisis managed well”, Supervision Newsletter, ECB, 13 August 2025.