
Survey on the Access to Finance of Enterprises in the euro area - October 2020 to March 2021
Introduction
This report presents the main results of the 24th round of the Survey on the Access to Finance of Enterprises (SAFE) in the euro area, which was conducted between 8 March and 22 April 2021. The survey covered the period from October 2020 to March 2021. The sample comprised 11,007 enterprises in the euro area, of which 10,054 (91%) had fewer than 250 employees.[1]
The report provides evidence on changes in the financial situation of enterprises and documents trends in the need for and availability of external financing. It includes results for micro, small and medium-sized enterprises (SMEs), as well as large firms, and examines developments both at the euro area level and in individual countries.
1 Overview of the results
After one year of the coronavirus (COVID-19) pandemic, euro area SMEs reported that difficulty in finding skilled labour, as well as customers, was the dominant concern for their business activity, with access to finance among the less reported obstacles. The lack of skilled labour was considered the main concern for euro area SMEs (21%), followed by the difficulty of finding customers (20%). Concerns about access to finance remained low in the euro area as a whole (9%), with the exception of SMEs in Greece (18%). Concerns about competition (10%), production costs (12%) and regulatory burdens (12%) were also relatively low in the euro area as a whole.
The turnover and profits of euro area SMEs deteriorated, albeit less so than in the first wave of the pandemic (-29% in net terms,[2] compared with -46% in the previous survey). At the same time, SMEs continued to signal declining profits (-35%, compared with -47% in the previous survey) in most countries and sectors.
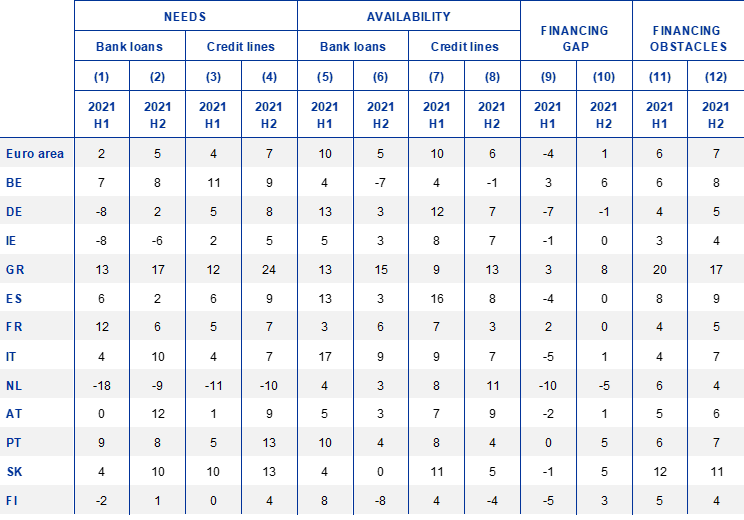
In this survey round, euro area SMEs reported, in net terms, moderate increases in demand for bank loans and credit lines. A net 12% of SMEs reported higher demand for bank loans (down from 20%), and a net 10% reported increased demand for credit lines (down from 16%) (see Table 1, columns 2 and 4). External and internal financing continued to be used primarily for fixed investment, inventories and working capital, but 16% of SMEs also used it for refinancing or paying off obligations.
Overall, the availability of bank loans continued to rise slightly, albeit to a lesser extent than in the previous six months and with some differences across countries and across firms of different sizes. The net percentage of SMEs reporting an improvement in the availability of bank loans declined to 3% (down from 6%), masking some heterogeneity across size classes and countries (see Table 1, column 6). For the first time since mid-2015, micro firms even signalled a decline in the availability of bank loans, while large companies indicated a return to pre-COVID-19 levels. The moderate increase in availability was broad-based across countries, although SMEs in some countries (notably Belgium and the Netherlands) reported reductions in the availability of bank loans. SMEs indicated that the supply of trade credit remained unchanged (0%, compared with -1% in the previous survey round), while a net 6% of euro area SMEs reported an increase in the availability of leasing and hire-purchase, up from 3% in the previous round.
The external financing gap for SMEs – i.e. the difference between the change in demand for and the change in the availability of external financing – remained positive, both at the euro area level (4%, down from 5%) and across almost all euro area countries (see Table 1, column 10).
Table 1
Latest developments in SAFE country results for SMEs
(over the preceding six months; net percentages of respondents)
Notes: For “needs”, see Chart 13; for “availability”, see Chart 18; and for the “financing gap”, see the notes on Chart 19. For “financing obstacles”, see the notes on Chart 24. “2020 H1” refers to round 23 (April-September 2020) and “2020 H2” refers to round 24 (October 2020-March 2021).
A smaller percentage of SMEs regarded the macroeconomic environment as having adversely affected the availability of external financing (-29%, compared with -41% in the previous round) (Chart 20). This percentage is comparable to that seen just before the onset of the pandemic and might signal the beneficial effect of the ongoing policy support measures. Similarly, fewer SMEs reported deteriorations in their firm-specific outlook (-15%) and capital position (-2%). At the same time, a smaller net percentage of SMEs signalled an improvement in the willingness of banks to provide credit (6%).
Fewer SMEs reported that access to public financial support represented a factor contributing to access to finance (4%, down from 14%), probably reflecting the slowdown in the use of guarantees towards the end of 2020.
Replies to ad hoc questions on the importance of government support schemes introduced in response to the pandemic show that most SMEs have had access to such schemes over the last 12 months and that these have helped firms to meet their immediate and short-term obligations (with measures aimed at alleviating wage bills, tax cuts and tax moratoria being highlighted in particular). SMEs also indicated that government measures that were currently in place or planned on account of COVID-19 would increase their ability to meet their debt obligations in the next two years. Almost 50% of SMEs reported having received government support aimed at alleviating their wage bill, 25% benefited from tax cuts and tax moratoria, and 32% received other types of government support. Most of them indicated that these measures had helped them to meet their immediate and short-term obligations, while around 50% thought that these measures would increase their ability to meet their debt obligations in the next two years.
The overall indicator[3] of the obstacles preventing SMEs from accessing bank loans remained unchanged at 8% (see Table 1, column 12). 27% of SMEs applied for a loan (down from 38%). The percentage of fully successful loan applications reached 73%, while the rejection rate declined further to stand at 4%. The percentage of SMEs that were discouraged from applying for bank loans increased marginally to stand at 5% (up from 3%).
When asked about price terms and conditions for bank financing, very few SMEs reported, on balance, that bank interest rates had increased (2%, up from -4%). At the same time, a net 28% of SMEs (up from 20%) signalled increases in other financing costs, such as charges, fees and commission. As for non-price terms and conditions, SMEs signalled increases in collateral requirements (15%) and other requirements such as covenants (19%). On the other hand, SMEs reported further improvements in the size and maturity of loans (10% and 12% respectively), albeit less so than in the previous survey round.
Looking ahead, SMEs continued to be concerned about their access to external financing, although less so than in the previous round. In particular, SMEs were concerned about future access to bank loans (-9%, up from -16%) and credit lines (-10%, up from -14%).
Large companies reported easier access to finance than SMEs. Around 42% of large firms applied for a bank loan, with a higher success rate than SMEs (83%) and a lower rejection rate (1%). According to the survey results, the average interest rate charged to large enterprises on credit lines was around 112 basis points lower than that paid by SMEs, with the spread widening slightly compared with the previous round.
Overall, the survey results indicate that the adverse economic environment is still weighing negatively on euro area SMEs, but accommodative financing conditions and public support have helped them during the COVID-19 pandemic. Looking ahead, SMEs expect an economic recovery in the coming months in terms of increased turnover, though they continue to be concerned about their access to external financing.
2 The financial situation of SMEs in the euro area
2.1 The financial situation of SMEs shows signs of recovery
Euro area SMEs continue to report a deterioration in their turnover (albeit less so than in the previous round), with the negative impact of the COVID-19 crisis persisting despite generally accommodative financing conditions (see Chart 1). In the period from October 2020 to March 2021, euro area SMEs continued to signal a decline in turnover in net terms,[4] albeit less so than in the previous survey round (-29%, compared with -46%). This was the third consecutive round in which euro area SMEs had reported declining turnover, and despite the improvement relative to the last round, the decline remained above that experienced at the peak of the euro area debt crisis (-12% in 2012), highlighting the extraordinary challenges that SMEs have faced since early 2020.
Chart 1
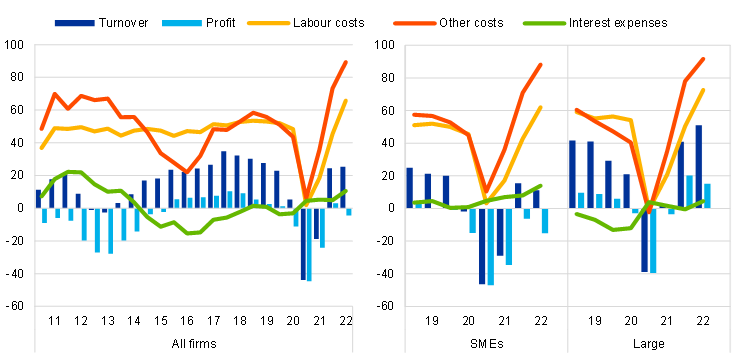
Changes in the income situation of euro area enterprises
(over the preceding six months; net percentages of respondents)
Q2. Have the following company indicators decreased, remained unchanged or increased over the past six months
Base: All enterprises. Figures refer to rounds 17 (April-September 2017) to 24 (October 2020-March 2021) of the survey.
Notes: Net percentages are the difference between the percentage of enterprises reporting an increase for a given factor and the percentage reporting a decrease. Since round 11 (April-September 2014), “net interest expenses (what you pay in interest for your debt minus what you receive in interest for your assets)” has been replaced with “interest expenses (what your company pays in interest for its debt)”.
Turnover seems to vary significantly across firms, with smaller companies continuing to be the most severely hit. Larger firms seem to be experiencing a faster recovery, and a positive net percentage of them reported turnover growth in this round (2%, up from -39%). In contrast, SMEs continued to experience a somewhat milder – but still strong – contraction in turnover (-15%, up from -42%) for medium-sized companies; -24% (up from -47%) for small firms; and -40% (up from -48%) for micro firms).
At the same time, euro area enterprises also reported increases in labour and other costs (i.e. for materials and energy). A larger net proportion of euro area SMEs reported increases in labour costs (17%, up from 3%) and other costs (36%, up from 11%), with increases being reported for all firm sizes. In contrast, while more SMEs reported increases in interest rate expenses, the percentage of larger firms reporting them declined marginally.
Consequently, a significant proportion of euro area SMEs continued to report a deterioration in profits, albeit less so than in the previous round (-35%, up from -47%). The deterioration in profits was broadly based across all firm sizes, but larger firms seem to be experiencing a stronger recovery on account of the somewhat faster rebound in turnover.
Chart 2
Changes in the income situation of euro area SMEs
(over the preceding six months; net percentages of respondents)
Q2. Have the following company indicators decreased, remained unchanged or increased over the past six months?
Base: All SMEs. Figures refer to rounds 17 (April-September 2017) to 24 (October 2020-March 2021) of the survey.
Note: See the notes on Chart 1.
Across countries, developments in SME activity have followed very similar patterns over the last six months (see Chart 2 and Chart 32 in Annex 1). SMEs in the largest euro area countries continue to suffer from falling turnover and declining profits, with the latter reflecting the higher net percentage of SMEs reporting increases in labour and other costs, as well as interest rate expenses (particularly in Spain, where that figure stands at 22%, compared with 7% for the euro area as a whole).
Chart 3
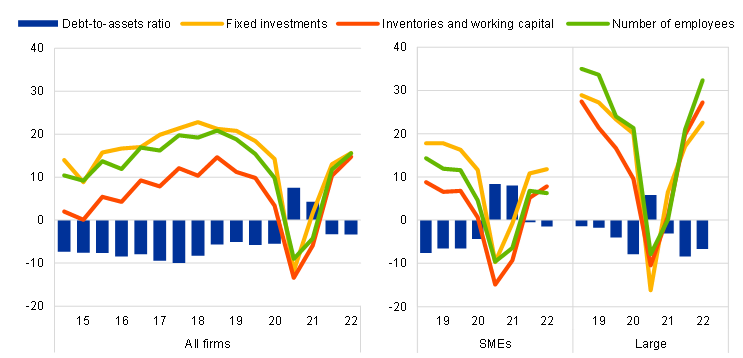
Changes in the debt situation and real decisions of euro area enterprises
(over the preceding six months; net percentages of respondents)

Q2. Have the following company indicators decreased, remained unchanged or increased over the past six months?
Base: All enterprises. Figures refer to rounds 17 (April-September 2017) to 24 (October 2020-March 2021) of the survey.
Notes: Net percentages are the difference between the percentage of enterprises reporting an increase for a given factor and the percentage reporting a decrease. Since round 11 (April-September 2014), “net interest expenses (what you pay in interest for your debt minus what you receive in interest for your assets)” has been replaced with “interest expenses (what your company pays in interest for its debt)”.
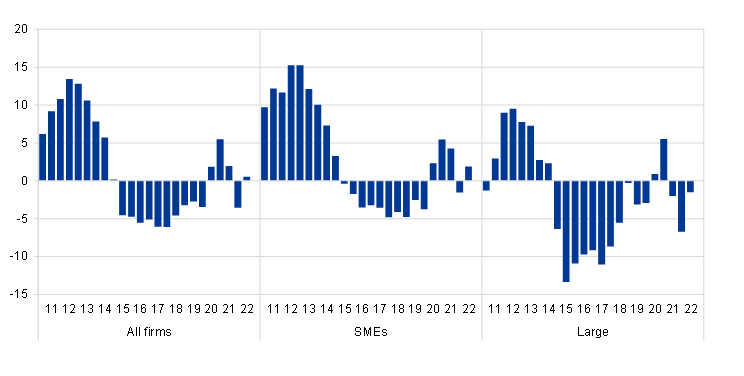
The balance sheets of euro area SMEs have continued to deteriorate over the last six months. The net percentage of SMEs indicating increases in their debt-to-assets ratios remained at 8%, reflecting the adverse economic environment seen since early 2020, which ended the protracted deleveraging trend observed since 2010. In net terms, the weakening of firms’ financial positions only affects SMEs, with large firms tending, on average, to report declines in their debt-to-asset ratios in this survey round.
Firms’ investment and hiring decisions have benefited from the attenuation in the decline in economic activity and profits. Although downward adjustments continued, euro area SMEs tended, on balance, to report smaller declines in fixed investment (-1%, up from -10%), inventories and working capital (-9%, up from -15%) and the number of employees (-6%, up from -10%), with similar dynamics for SMEs of all sizes. Large firms, in contrast, seem to have experienced a faster recovery.
Chart 4
Changes in the debt situation and real decisions of euro area SMEs
(over the preceding six months; net percentages of respondents)
Q2. Have the following company indicators decreased, remained unchanged or increased over the past six months?
Base: All SMEs. Figures refer to rounds 17 (April-September 2017) to 24 (October 2020-March 2021) of the survey.
Note: See the notes on Chart 1.
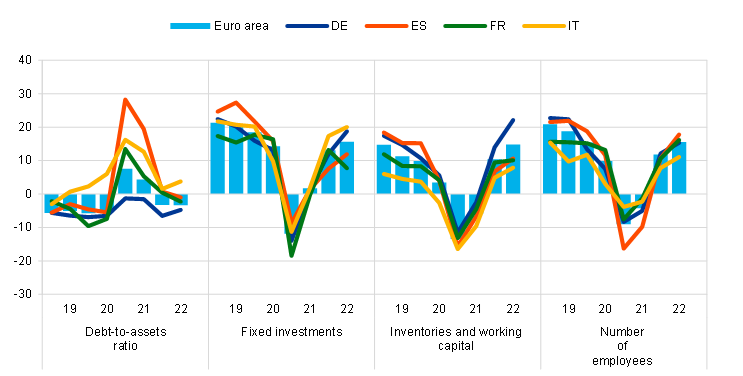
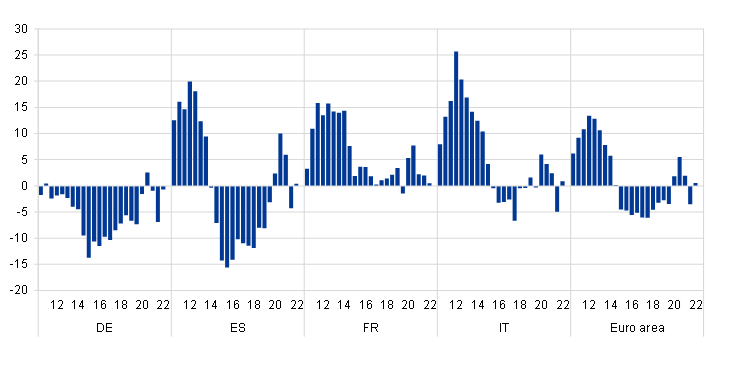
The deterioration in SME balance sheets on account of the COVID-19 crisis has continued over the last six months across most countries. SMEs’ debt-to-assets ratios rose in the four largest countries (19% in Spain, 18% in Italy, 12% in France and only 1% in Germany) (see Chart 30 in Annex 1 for other countries).
Moreover, SMEs in all countries reported, in net terms, on average, contractions in inventories and working capital expenses, as well as employment, while developments in fixed investment were somewhat more heterogeneous. In net terms, 9% of euro area SMEs reported declines in inventories and working capital expenses (with net percentages ranging from -2% to -14% across the four largest countries) and 6% reported declines in employment (with net percentages ranging from -3% to -11% across the four largest countries). However, while SMEs reported, on balance, a further decline in fixed investment (-1%, up from -10%), increases were reported in Germany (1%, up from -13%) and Spain (2%, up from -6%).
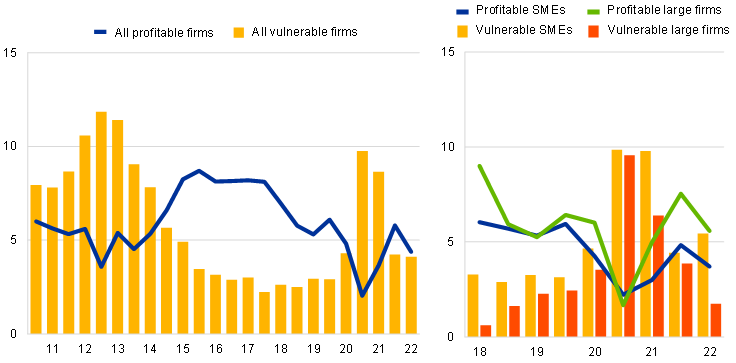
Against this background, the financial vulnerability of euro area SMEs remains high. A comprehensive indicator of firms’ financial situation[5] (the “financial vulnerability indicator”) suggests that 9.8% of euro area SMEs (marginally lower than the 9.9% seen in the previous round) encountered major difficulties in running their businesses and servicing their debts and could, therefore, face more difficulties than other firms in accessing finance in the future. Nevertheless, the financial vulnerability indicator remains lower than it was at its peak in 2012, when it reached 14.2%. At the other end of the spectrum, the percentage of profitable firms (i.e. those that are more likely to be resilient to financial shocks) has risen to 3% (up from 2.2%) (see Chart 5; Chart 35 in Annex 1 shows the results at country level).
Chart 5
Vulnerable and profitable enterprises in the euro area
(percentages of respondents)
Q2. Have the following company indicators decreased, remained unchanged or increased over the past six months?
Base: All enterprises. Figures refer to rounds 3 (March-September 2010) to 24 (October 2020-March 2021) of the survey.
Note: For definitions, see footnote 5.
Looking at firm size, smaller firms continue to be more vulnerable than larger companies. In this survey round, the percentage of vulnerable enterprises fell to 6.4% (from 9.6%) for large firms, but medium-sized SMEs (8.5%, down from 10.1%) and small SMEs (9.7%, down from 10.3%) also registered an improvement. In contrast, the percentage of vulnerable firms rose further for micro SMEs (10.5%, up from 9.4%). In contrast, no more than 5% of firms can be characterised as “profitable”,[6] with profitability remaining below pre-COVID-19 levels for all size categories.
The profitability and vulnerability indicators for SMEs reveal significant heterogeneity across countries (see Chart 6 for the euro area and the four largest countries). The percentage of vulnerable companies remains particularly high in Spain (17.1%, down from 18.9%) and Italy (13.4%, up from 11.3%), with lower levels seen in Germany (7.2%, down from 8.9%) and France (8.9%, down from 9.6%). As regards profitable firms, this survey round showed tentative signs of recovery in most large countries, with the exception of Italy. For details of the trends in other euro area countries, see Chart 35 in Annex 1.
Chart 6
Vulnerable and profitable SMEs
(percentages of respondents)
Q2. Have the following company indicators decreased, remained unchanged or increased over the past six months?
Base: All SMEs. Figures refer to rounds 3 (March-September 2010) to 24 (October 2020-March 2021) of the survey.
2.2 SMEs are more concerned about the availability of skilled staff and less concerned about their access to finance
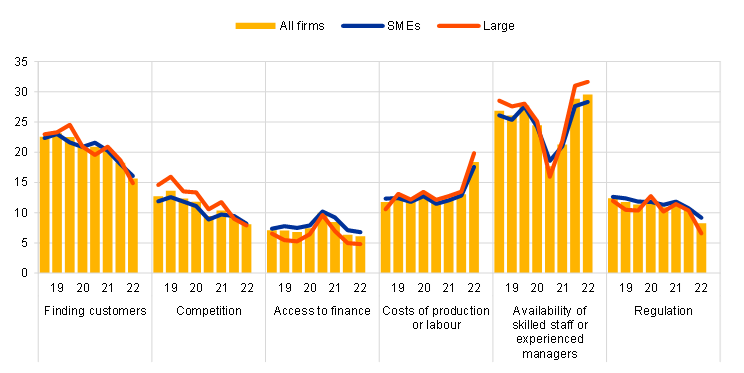
The availability of skilled labour and the difficulty of finding customers continue to be the main concerns for euro area SMEs (see Chart 7). Over the last six months, concerns about the availability of skilled labour have risen slightly again (being signalled by a net 21% of SMEs, up from 19%), while the difficulty of finding customers has declined (20%, down from 22%). In addition, concerns regarding production costs (12%, up from 11%), regulation (12%, up from 11%) and competition (10%, up from 9%) rose marginally in this survey round. In contrast, SMEs reported marginally fewer concerns about access to finance (9%, down from 10%).
Chart 7
The most important problems faced by euro area enterprises
(percentages of respondents)
Q0. How important have the following problems been for your enterprise in the past six months?
Base: All enterprises. Figures refer to rounds 17 (April-September 2017) to 24 (October 2020-March 2021) of the survey.
Notes: The formulation of the question has changed over the survey rounds. Initially, respondents were asked to select one of the categories as the most pressing problem. From round 8, all respondents were asked to indicate how pressing a specific problem was on a scale of 1 (not pressing) to 10 (extremely pressing). In round 7, the question used the initial phrasing for one half of the sample and the new phrasing for the other half. In addition, if two or more items had the highest score in question Q0B on how pressing the problems were, a follow-up question (Q0C) was asked in order to resolve this, i.e. determine which of the problems was more pressing, even if only by a small margin. This follow-up question was removed from the questionnaire in round 11. The past results from round 7 onwards were also recalculated, disregarding the replies to question Q0C. In round 12, the word “pressing” was replaced by the word “important”.
Overall, those concerns are broadly similar across euro area enterprises, regardless of their size. Large and medium-sized firms reported somewhat stronger concerns about shortages of skilled staff than smaller companies, possibly on account of their advanced recovery from the trough in economic activity (as discussed above). The concerns that were reported regarding production costs, regulation and competition showed broadly similar patterns across firm sizes.
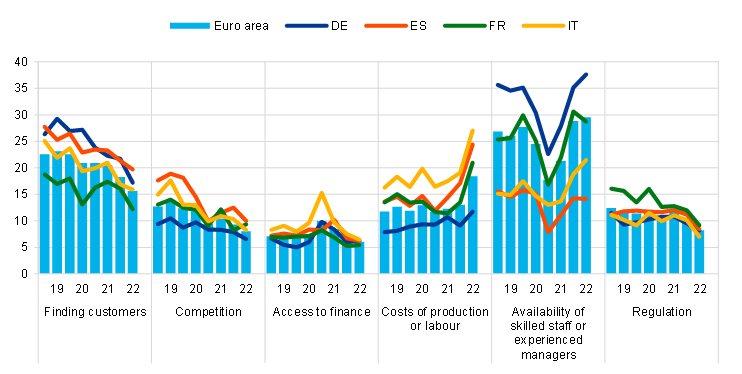
The main concerns among SMEs followed broadly similar patterns across euro area countries, albeit some cross-country heterogeneity remained (see Chart 8 and Chart 35 in Annex 1). Looking at the largest euro area countries, Spanish SMEs reported difficulty in finding customers as their main concern (25%, which was above the euro area average of 20%), but that was significantly less of a concern for French SMEs (16%). Meanwhile, the lack of skilled staff was the biggest concern for German SMEs (28%), but less of a problem for Spanish (12%) and Italian (13%) SMEs.
Concerns by SMEs about access to finance have eased in the majority of countries (being seen as the least pressing problem in most of them) and are far below their historical peaks. Greek SMEs continued to be disproportionately affected by a lack of access to finance in this survey round, with 18% of firms still citing it as their most important problem (down from 22%). This was well above the levels seen in other euro area countries, where (with the exception of Italy and Spain) net percentages were in single digits.
Chart 8
The most important problems faced by euro area SMEs
(percentages of respondents)
Q0. How important have the following problems been for your enterprise in the past six months?
Base: All SMEs. Figures refer to rounds 17 (April-September 2017) to 24 (October 2020-March 2021) of the survey.
Note: See the notes on Chart 7.
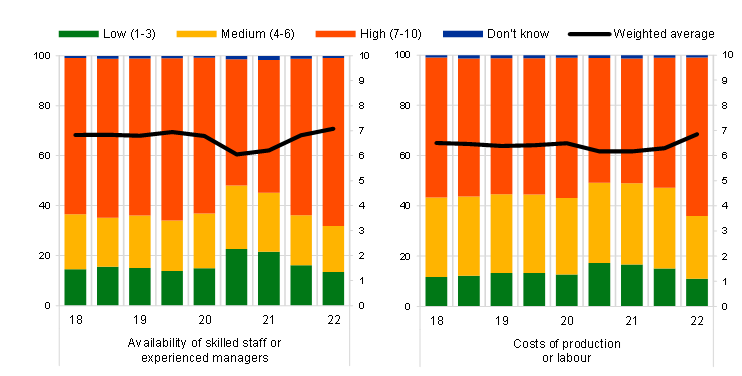
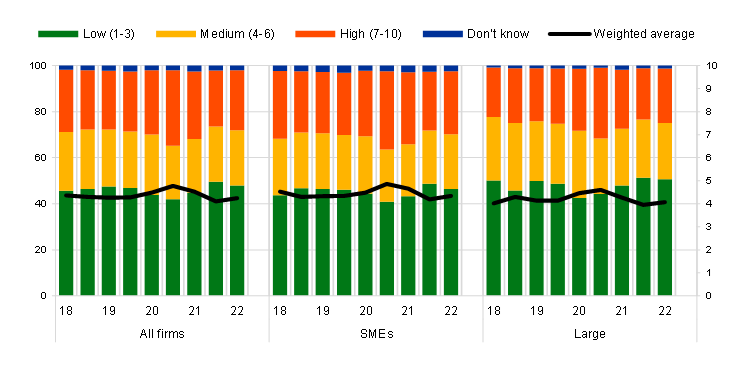
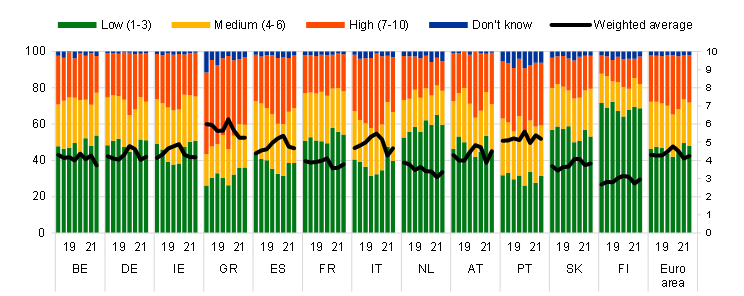
The responses by SMEs regarding the importance of access to finance as a problem on a scale of 1 to 10 (see Chart 9) confirm the overall picture of moderating concern in most countries. Scores declined in Belgium, Ireland, Greece, France, Italy, Austria and Portugal, as well as in the euro area as a whole. At the same time, in terms of magnitude, concerns among SMEs regarding access to finance remain elevated relative to recent years in several countries (Germany, Spain, Italy, Austria, Portugal and Slovakia). In Greece, it is still regarded as a very important issue (with a rating of 5.9 on average), with scores in excess of 5 also being seen in Portugal (5.2), Italy (5.2) and Spain (5.4). Finland continues to report the lowest average score (3.2).
Chart 9
Importance of access to finance as perceived by SMEs across euro area countries
(left-hand scale: percentages; right-hand scale: weighted averages)
Q0B How important have the following problems been for your enterprise in the past six months?
Base: All SMEs. Figures refer to rounds 17 (April-September 2017) to 24 (October 2020-March 2021) of the survey.
Notes: Enterprises were asked to indicate how important a specific problem was on a scale of 1 (not at all important) to 10 (extremely important). On the chart, the scale has been divided into three categories: low (1-3), medium (4-6) and high importance (7-10). The weighted average score is an average of the responses using the weighted number of respondents.
3 SME financing needs and sources
3.1 SMEs increased their use of subsidised loans
Bank-related products and subsidised loans remained the most important financing source for SMEs (see Chart 10). Half of the euro area SMEs reported that bank loans had been an important financing source over the last six months. Credit lines were also an important source of financing, with almost half of SMEs continuing to regard them as important.[7]
The use of subsidised loans has increased during the pandemic, with 47% of SMEs reporting that such loans had been important in the past six months, compared with 33% just before the pandemic started. Other instruments mentioned by SMEs as an important source of finance were leasing or hire-purchase (43%), trade credit (29%) and internal funds (24%). Lastly, 17% of SMEs pointed to other loans (for example, loans from family, friends or related companies) as a relevant source of finance. Market-based instruments, such as equity (9%), debt securities (2%) and factoring (8%), were much less likely to be regarded as a potential source of finance, with very marginal changes compared with the previous survey round.
Chart 10
Relevance of financing sources for euro area SMEs
(over the preceding six months; percentages of respondents)
Q4. Are the following sources of financing relevant to your enterprise, that is, have you used them in the past or considered using them in the future? If “yes”, have you obtained new financing of this type in the past six months?
Base: All SMEs. Figures refer to round 24 (October 2020-March 2021) of the survey.
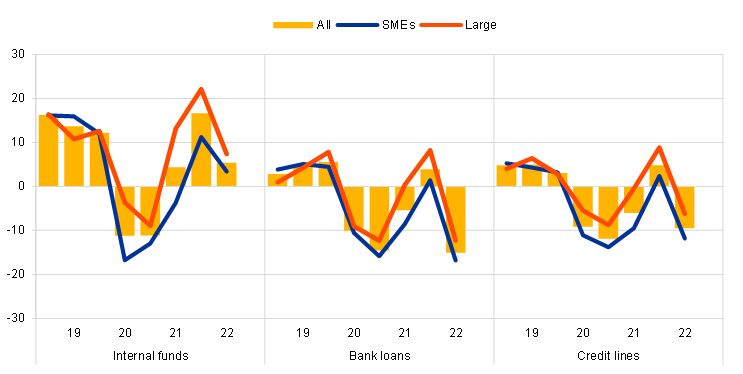
The use of all financing instruments increased with firm size. That is to say, the percentage of large firms that reported having used a given financing instrument was, in all instances, higher than the corresponding figure for SMEs (see Chart 11). While short-term bank finance (credit lines/bank overdrafts/credit cards) remained the most popular source of finance for firms of all sizes, the use of other financing instruments was more heterogeneous. For example, 38% of large firms favoured leasing or hire-purchase, compared with only 19% of SMEs. SMEs reported having used bank loans almost as often as subsidised loans (18% and 21% of SMEs respectively), while large companies used bank loans more frequently than subsidised loans (35% vs 21%). Equity and debt securities, on the other hand, remained among the least frequently used sources of finance across all firm sizes.
Chart 11
Use of internal and external funds by euro area enterprises by firm size
(percentages of respondents that used the instruments in question in the past six months)
Q4. Are the following sources of financing relevant to your enterprise, that is, have you used them in the past or considered using them in the future? If “yes”, have you obtained new financing of this type in the past six months?
Base: All enterprises. Figures refer to round 24 (October 2020-March 2021) of the survey.
Vulnerable firms were much more likely to resort to credit lines (42%) and subsidised loans (36%) as the main source of external financing than profitable firms (21% and 9% respectively) (see Chart 12). In turn, profitable firms were much more likely to opt for leasing or hire-purchase or factoring than vulnerable firms. The degree of reliance on internal funds is similar for vulnerable and profitable companies.
Chart 12
Use of internal and external funds by profitable and vulnerable SMEs in the euro area
(percentages of respondents that used the instruments in question in the past six months)
Q4. Are the following sources of financing relevant to your enterprise, that is, have you used them in the past or considered using them in the future? If “yes”, have you obtained new financing of this type in the past six months?
Base: All SMEs. Figures refer to round 24 (October 2020-March 2021) of the survey.
3.2 Demand for external financing moderated
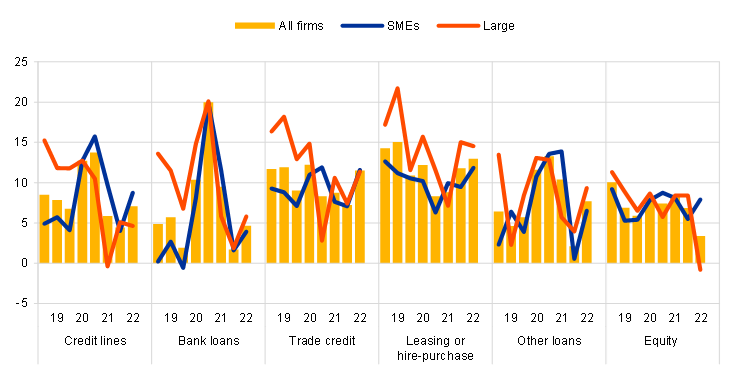
Net demand for credit lines and bank loans has remained positive in the last six months, but has weakened relative to the previous round (see Chart 13). SMEs reported a moderation in their net demand for bank loans[8] (12%, down from 20%) and credit lines (10%, down from 16%). Net demand for trade credit also moderated, albeit to a lesser extent, while demand for other loans was broadly similar to that seen in the previous round. The only source of external financing for which firms reported an increase in net demand was leasing and hire-purchase agreements (10%, up from 6%).
Chart 13
Changes in external financing needs of euro area enterprises
(over the preceding six months; net percentages of respondents)
Q5. For each of the following types of external financing, please indicate if your needs increased, remained unchanged or decreased over the past six months.
Base: Enterprises for which the instrument in question is relevant. Figures refer to rounds 17 (April-September 2017) to 24 (October 2020-March 2021) of the survey.
Notes: See the notes on Chart 1. The categories “other loans” and “leasing or hire-purchase” were introduced in round 12 (October 2014-March 2015). In rounds 1 to 10, a financing instrument was “relevant” if the enterprise had used the instrument in the past six months or had not used it but had experience of it. Since round 11, respondents have been asked whether an instrument is relevant, i.e. whether the enterprise has used it in the past or considered using it in the future. Given that the current definition of a “relevant” financing instrument differs from that used in the past, this might have an impact in terms of comparability over time. Caution should therefore be exercised when comparing recent results with those of previous rounds.
Large firms reported a slowdown in demand for external financing. Large firms reported no changes in demand for credit lines (0%, down from 11%), while net demand for bank loans stood at 6% (down from 20%). Net demand for leasing remained positive but was weaker than in the last survey round (7%, down from 12%), while large firms reported an increase in demand for trade credit (11%, up from 3%).
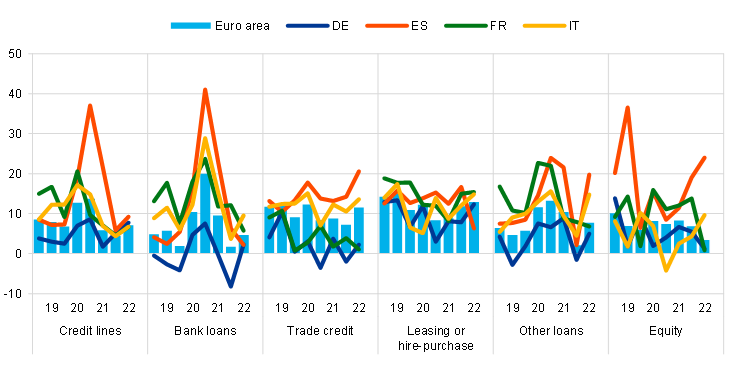
SMEs in most countries continued to report positive net demand for bank finance, albeit to a lesser extent than in the previous round. Looking at the four largest economies, SMEs reported moderating net demand for bank loans in Spain (19%, down from 34%), Italy (19%, down from 28%), France (13%, down from 25%) and Germany (3%, down from 8%) (see Chart 14). Net demand for credit lines was also weaker in those countries than it had been in the previous round. Net demand for trade credit, credit lines and bank loans remained positive in all four countries, albeit at lower levels. Compared with the previous survey round, net demand for leasing or hire-purchase rose in all large countries except France, while net demand for other types of loan (from family, friends and related enterprises or shareholders) was slightly lower in all large countries except Germany. The euro area aggregate was almost unchanged. In the other euro area countries, the strongest demand for external financing continued to be seen in Greece (see Chart 37 in Annex 1).
Chart 14
Changes in external financing needs of euro area SMEs
(over the preceding six months; net percentages of respondents)
Q5. For each of the following types of external financing, please indicate if your needs increased, remained unchanged or decreased over the past six months.
Base: SMEs for which the instrument in question is relevant. Figures refer to rounds 17 (April-September 2017) to 24 (October 2020-March 2021) of the survey.
Note: See the notes on Chart 1 and Chart 13.
3.3 SMEs used financing primarily for inventories and working capital, as well as fixed investment
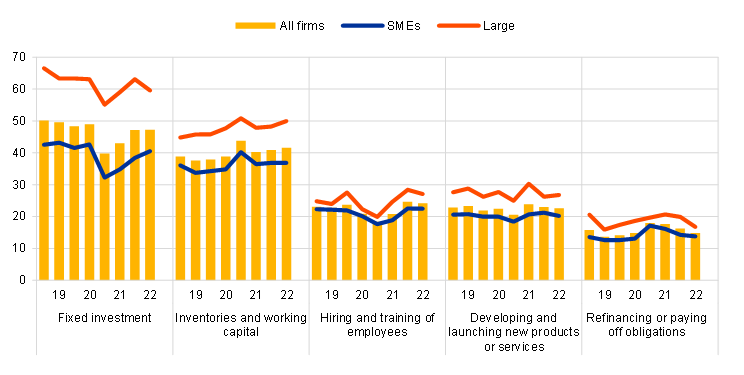
Financing from external and internal sources continued to be used mainly for inventories and working capital, as well as fixed investment (see Chart 15). Around 36% of SMEs (down from 40%) mentioned using financing for inventories and working capital, while 35% (up from 32%) reported using it for fixed investment. Fixed investment has declined overall since the onset of the pandemic but rebounded somewhat in this latest round despite uncertainty remaining elevated.
Chart 15
Purpose of financing as reported by euro area enterprises
(over the preceding six months; percentages of respondents)
Q6A. For what purpose was financing used by your enterprise during the past six months?
Base: All enterprises. Figures refer to rounds 17 (April-September 2017) to 24 (October 2020-March 2021) of the survey.
Note: These figures are based on the new question introduced in round 11 (April-September 2014).
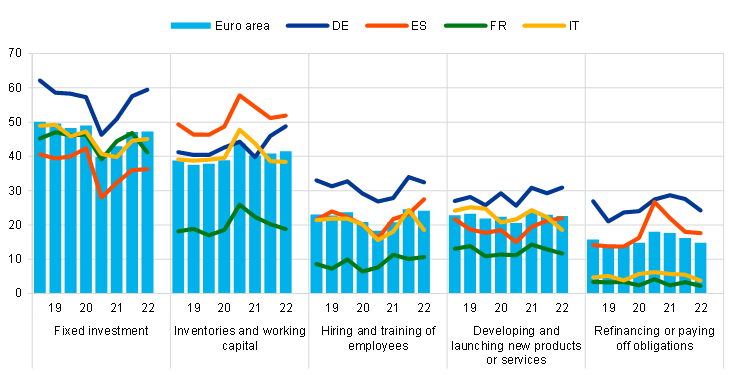
The amount of fixed investment continued to be correlated with company size. While 59% of large firms reported using funds for fixed investment, this applied to only 26% of micro firms. Firms’ use of financing for investment in working capital and inventories also differed according to their size (48% for large firms, but only 32% for micro firms). SMEs were less likely to use financing to hire and train employees (19%, up from 18%), develop new products (21%, up from 18%) or refinance obligations (16%, down from 17%). Looking at the largest euro area countries, German SMEs continued to stand out in terms of their use of funds for fixed investment (with 43% of German SMEs reporting such usage, compared with just 35% in Italy and 31% in France). Spanish SMEs, in contrast, continued to use lots of financing for inventories and working capital (50%), being more likely to use it for that purpose than for fixed investment (see Chart 16).
Chart 16
Purpose of financing as reported by SMEs across euro area countries
(over the preceding six months; percentages of respondents)
Q6A. For what purpose was financing used by your enterprise during the past six months?
Base: All SMEs. Figures refer to rounds 17 (April-September 2017) to 24 (October 2020-March 2021) of the survey.
Note: See the note on Chart 15.
4 Availability of external financing for SMEs in the euro area
4.1 No significant improvement in the availability of external financing, with a deterioration for micro companies
Very modest increases in the availability of bank loans
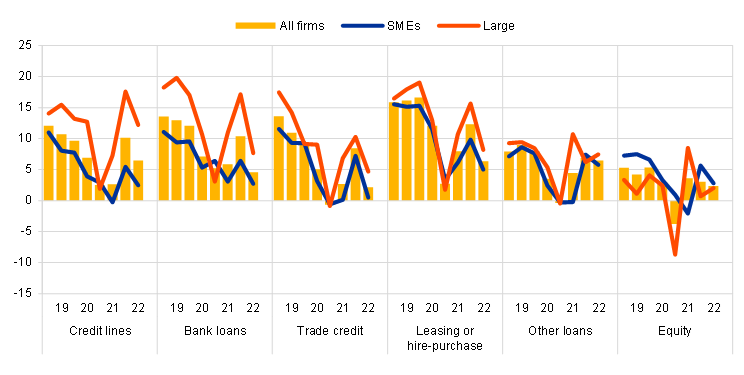
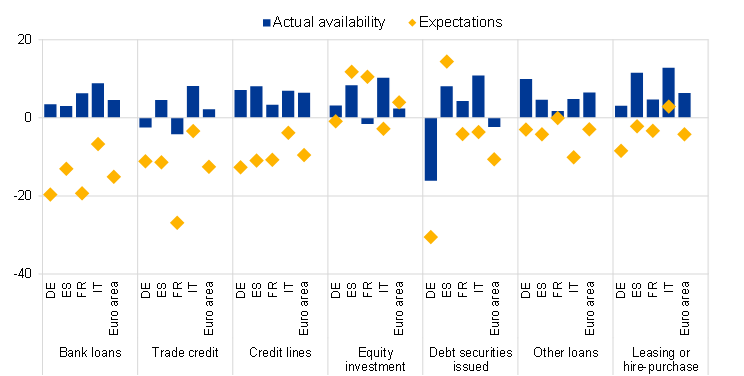
In the latest survey round, fewer SMEs reported improvements in the availability of external financing sources relevant for their business (see Chart 17).[9] For bank loans (one of the most important sources of funding for SMEs), the net percentage of respondents indicating an improvement in availability declined to 3% (down from 6%). Furthermore, SMEs signalled declines in the availability of equity (-2%) and debt securities issuance (-8%). In contrast, they reported increases in the availability of leasing or hire-purchase (6%, up from 3%), signalling their efforts to keep cash in their balance sheets.
Chart 17
Changes in the availability of external financing for euro area enterprises
(over the preceding six months; net percentages of respondents)
Q9. For each of the following types of financing, would you say that their availability has improved, remained unchanged or deteriorated for your enterprise over the past six months?
Base: Enterprises for which the instrument in question is relevant. Figures refer to rounds 17 (April-September 2017) to 24 (October 2020-March 2021) of the survey.
Note: See the notes on Chart 1 and Chart 13.
Looking at firms of different sizes, micro companies were the most pessimistic in their assessment of the accessibility of external financing. Indeed, in this survey round, micro firms reported a deterioration in the availability of bank loans (-2%), credit lines (-5%) and trade credit (-4%). In contrast, modest increases in the availability of external funds were reported by small and medium-sized companies. Meanwhile, the net percentage of large companies reporting improvements in availability increased further, returning to pre-COVID-19 levels, exacerbating the pandemic-related disparities in access to external financing across firm sizes.
The moderation in the improved availability of bank loans was broad-based across countries (see Chart 18 and Chart 37 in Annex 1). The net percentage of respondents indicating improvements in the availability of bank loans fell in all of the largest euro area countries.
Chart 18
Changes in the availability of external financing for euro area SMEs
(over the preceding six months; net percentages of respondents)
Q9. For each of the following types of financing, would you say that their availability has improved, remained unchanged or deteriorated for your enterprise over the past six months?
Base: SMEs for which the instrument in question is relevant. Figures refer to rounds 17 (April-September 2017) to 24 (October 2020-March 2021) of the survey.
Note: See the notes on Chart 1 and Chart 13.
Demand for external funds rose somewhat faster than availability
Since the onset of the COVID-19 pandemic, the external financing gap for euro area SMEs has remained positive across all euro area countries. At the level of the euro area as a whole, SMEs felt that the improvements in their access to external funds were smaller than the corresponding increases in their financing needs, resulting in a positive external financing of 4% (down from 5%) (see Chart 19). At the level of individual euro area countries, the largest financing gaps were seen in Greece (14%), Portugal (13%) and Belgium (8%) (see also Chart 38 in Annex 1).
Chart 19
Changes in the external financing gaps reported by SMEs across euro area countries
(over the preceding six months; weighted net balances)
Q5. For each of the following types of external financing, please indicate if your needs increased, remained unchanged or decreased over the past six months.
Q9. For each of the following types of financing, would you say that their availability has improved, remained unchanged or deteriorated for your enterprise over the past six months?
Base: SMEs for which the instrument in question is relevant. Respondents replying with “not applicable” or “don’t know” are excluded. Figures refer to rounds 3 (March-September 2010) to 24 (October 2020-March 2021) of the survey.
Notes: See the notes on Chart 13. The financing gap indicator combines both financing needs and the availability of bank loans, credit lines, trade credit, and equity and debt securities issuance at firm level. For each of the five financing instruments, the indicator of the perceived change in the financing gap takes a value of 1 (-1) if the need increases (decreases) and availability decreases (increases). If enterprises perceive only a one-sided increase (decrease) in the financing gap, the variable is assigned a value of 0.5 (-0.5). The composite indicator is a weighted average of the financing gaps for the five instruments. A positive value for the indicator points to an increase in the financing gap. Values are multiplied by 100 to obtain weighted net balances in percentages.
SMEs continued to signal concerns in relation to macroeconomic factors affecting their access to external finance
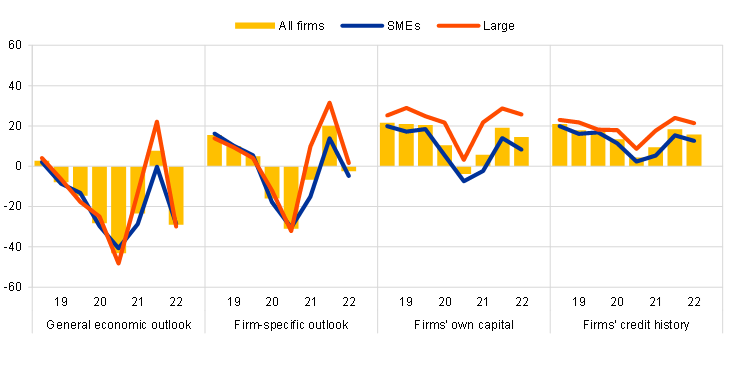
The adverse macroeconomic environment continued to weigh on the availability of external finance (see Chart 20). However, fewer SMEs felt that changes in the general economic outlook had negatively affected their access to finance (-29%, from -41% in the first wave of the pandemic). Likewise, fewer euro area SMEs reported that deterioration in their firm-specific outlooks (-15%, from -30%) and capital positions (-2%, from -7%) were negatively affecting their ability to access finance. In contrast, there was a slight increase in the number of SMEs reporting that their credit history had positively affected their access to finance (5% in net terms, up from 2%).
Chart 20
Changes in factors with an impact on the availability of external financing to euro area enterprises
(over the preceding six months; net percentages of respondents)
Q11. For each of the following factors, would you say that they have improved, remained unchanged or deteriorated over the past six months?
Base: All enterprises. Figures refer to rounds 17 (April-September 2017) to 24 (October 2020-March 2021) of the survey.
Chart 21
Changes in factors with an impact on the availability of external financing to euro area SMEs
(over the preceding six months; net percentages of respondents)
Q11. For each of the following factors, would you say that they have improved, remained unchanged or deteriorated over the past six months?
Base: All SMEs. Figures refer to rounds 17 (April-September 2017) to 24 (October 2020-March 2021) of the survey.
Note: In round 11 (April-September 2014), the category “willingness of banks to provide a loan” was changed slightly to “willingness of banks to provide credit to your enterprise”.
Micro firms felt that the business environment had the most negative impact on their access to external finance. A net 34% of micro firms reported that the general economic outlook might have impeded their access to external finance (from 41% in the previous survey), compared with a net 25% of small and medium-sized firms and a net 13% of large enterprises. Similarly, micro firms were more concerned about their firm-specific outlooks and capital positions, while larger firms started to signal improvements in net terms.
In all of the largest euro area countries, declines were seen in the net percentages of SMEs that regarded the business environment as having negatively affected their access to finance. The same was true of nearly all other factors affecting their access to external finance (see Chart 21). Fewer SMEs in Germany (-28%, from -41%), Spain (-30%, from -47%), France (-28%, from -38%) and Italy (-24%, from -31%) felt that the general economic outlook had negatively affected the availability of external financing.
Chart 22
Changes in factors with an impact on the availability of external financing to euro area enterprises
(over the preceding six months; net percentages of respondents)
Q11. For each of the following factors, would you say that they have improved, remained unchanged or deteriorated over the past six months?
Base: All enterprises. Figures refer to rounds 17 (April-September 2017) to 24 (October 2020-March 2021) of the survey.
Note: In round 11 (April-September 2014), the category “willingness of banks to provide a loan” was changed slightly to “willingness of banks to provide credit to your enterprise”.
Chart 23
Changes in factors with an impact on the availability of external financing to euro area SMEs
(over the preceding six months; net percentages of respondents)
Q11. For each of the following factors, would you say that they have improved, remained unchanged or deteriorated over the past six months?
Base: All SMEs; for the category “willingness of banks to lend”, SMEs for which at least one bank financing instrument (credit line, bank overdraft, credit card overdraft, bank loan or subsidised bank loan) is relevant. Figures refer to rounds 17 (April-September 2017) to 24 (October 2020-March 2021) of the survey.
Note: In round 11 (April-September 2014), the category “willingness of banks to provide a loan” was changed slightly to “willingness of banks to provide credit to your enterprise”.
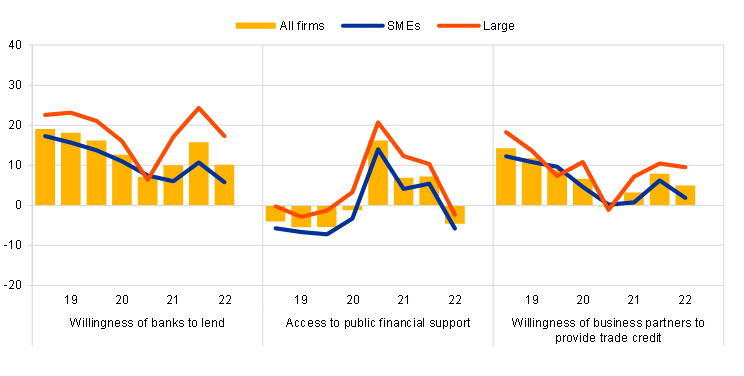
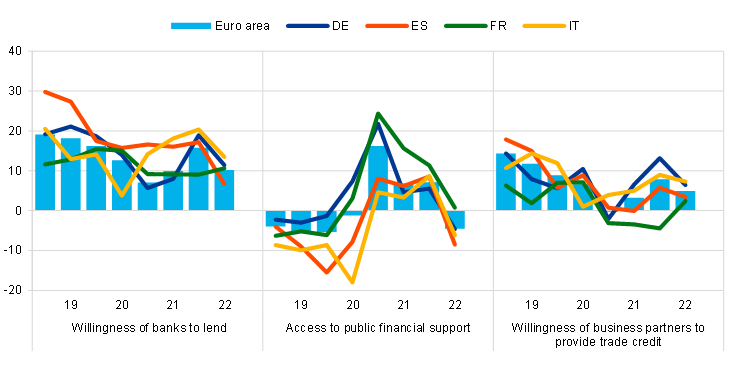
SMEs felt that banks’ willingness to provide credit had improved, albeit less so than in previous survey rounds (see Chart 22). In net terms, 6% of SMEs reported an increase in banks’ willingness to lend (down from 7%), but that masked some heterogeneity across size classes and countries. Looking at firm size, the net percentage of micro firms reporting improvements in conditions declined slightly (2%, down from 4%), as was the case for small enterprises (8%, down from 9%). In contrast, the net percentage of medium-sized enterprises reporting such improvements remained 11%, as in the previous survey round, while large enterprises signalled a strong improvement (17%, up from 6%).
At country level, the highest net percentages were seen in Spain (11%, down from 16%) and Italy (12%, down from 15%). Elsewhere, the biggest declines in banks’ perceived willingness to lend were seen in the Netherlands (-10%, albeit up from -18%) and Belgium (-6%, down from -5%) (see Chart 23 and Chart 39 in Annex 1).
Euro area SMEs continued to report improvements in access to public financial support, albeit less so than in the previous round (4%, down from 14%) (see Chart 22). Looking at firm size, micro firms reported that their access to public support remained unchanged (0%, down from 7%), whereas larger firms signalled further improvements in access (albeit less so than in previous rounds). At country level, the highest net percentages of SMEs reporting improvements in access were seen in Austria (26%, down from 38%), Greece (17%, up from 15%) and France (16%, down from 23%). In contrast, negative net percentages were seen in Portugal (-4%, down from 8%), Belgium (-4%, down from -2%) and Slovakia (-5%, down from -1%) (see Chart 23 and Chart 39 in Annex 1).
When asked specifically about government support schemes introduced in response to the pandemic, most euro area SMEs confirmed that they had had access to them over the last 12 months and that they had helped those firms to meet their immediate and short-term obligations (with measures aimed at alleviating wage bills, tax cuts and tax moratoria being highlighted in particular). Box 1 takes a detailed look at the results of those ad hoc questions, breaking them down by firm size and country.
Box 1
Special questions: Government support policies during the COVID-19 pandemic
Broad use of government support measures by euro area enterprises
In this round, the survey collected evidence on the use of different forms of government support, namely: (i) support aimed at alleviating wage bills; (ii) tax cuts and tax moratoria; and (iii) other forms of support. Firms were also asked about their assessment of the extent to which these support measures helped them to meet both short-term and medium to long-term obligations.
Many euro area enterprises reported having received government support aimed at alleviating their wage bills. This was mentioned by almost 55% of large and medium-sized companies, and by 49% and 45% of small and micro firms respectively (see Chart A). Meanwhile, tax cuts and tax moratoria were mentioned by 28% of large firms and more than 25% of small and medium-sized enterprises. Finally, other forms of government support (including loan guarantee schemes, as well as other country-specific policies) were mentioned by more than 33% of micro and small firms, compared with only 24% of large companies.
Chart A
Euro area companies that have received government support in response to the pandemic
(percentages of respondents)
QA1: Please indicate whether your enterprise has received any of the following forms of support introduced due to the pandemic.
Base: All enterprises. Figures refer to round 24 (October 2020-March 2021) of the survey.
Looking at the largest euro area countries, wage support measures appear to be the most frequently used type of support for SMEs, with the highest percentages being seen in France (67%),[10] followed by Italy (55%), Germany (45%) and Spain (31%) (see Chart B). French and Italian SMEs also made the greatest use of tax moratoria and tax cuts, while only 14% of Spanish SMEs reported receiving such support. Meanwhile, 38% of Greek SMEs reported having benefited from tax moratoria and tax cuts – the highest percentage outside of the four largest countries. Finally, 44% of French SMEs reported having received other forms of government support, followed by Italian, German and Spanish SMEs. For Greek SMEs, the percentage was even higher at 56%.
Chart B
Euro area SMEs that have received government support in response to the pandemic
(percentages of respondents)
QA1: Please indicate whether your enterprise has received any of the following forms of support introduced due to the pandemic.
Base: All SMEs. Figures refer to round 24 (October 2020-March 2021) of the survey.
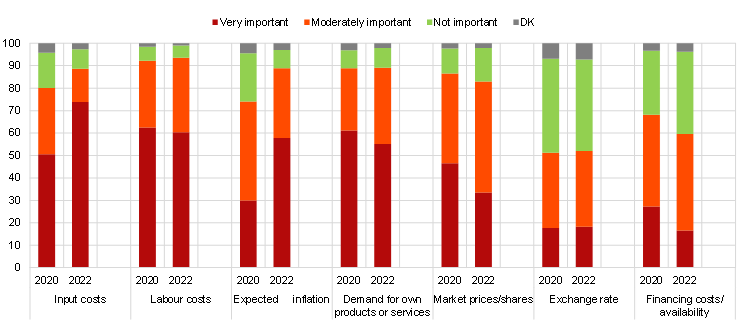
Most SMEs attached great importance to government support measures in terms of meeting short-term obligations
Of those SMEs that had made use of such government support measures, the vast majority considered them to be extremely important in terms of meeting their immediate and short-term obligations. Looking at the largest euro area countries, the highest percentages for wage support schemes were reported by German and French SMEs (more than 90%),[11] followed by Spanish and Italian SMEs (see Chart C). Tax moratoria and tax cuts were considered important by around 90% of German and Italian SMEs, with similarly high percentages being reported by Austrian, Greek, Portuguese and Irish SMEs. Across the sampled countries, Spanish SMEs reported the lowest level of importance (71%) for this type of support scheme. Other forms of government support were considered to be important by 94% of German SMEs, as well as SMEs in France, Portugal and Austria.
Chart C
Importance of government support in terms of meeting euro area SMEs’ short-term obligations
(percentages of respondents)
QA2: How important has each of the following support measures been in covering your enterprise’s immediate and short-term obligations?
Base: All SMEs that made use of the relevant government support scheme. Figures refer to round 24 (October 2020-March 2021) of the survey.
Government support measures were also important in terms of meeting medium-term debt obligations
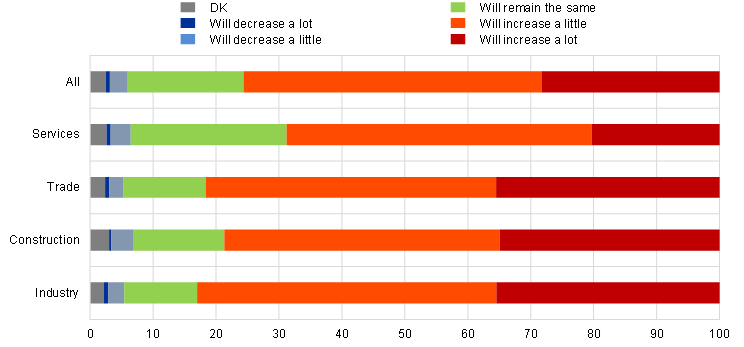
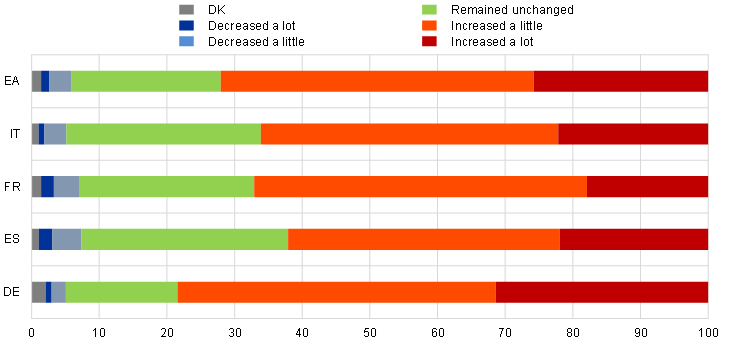
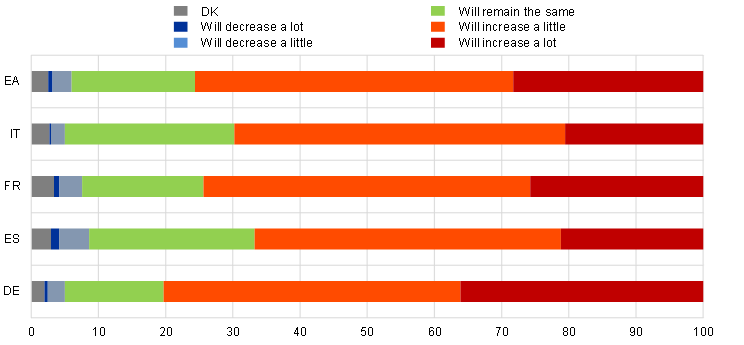
Euro area enterprises were also asked to indicate the importance of government schemes/measures that were currently in place or were planned on account of the pandemic in terms of meeting debt obligations over the next two years. At euro area level, almost two-thirds of SMEs confirmed the importance of such schemes in terms of overcoming the difficulties caused by the pandemic and avoiding bankruptcy (see left-hand panel of Chart D), as did 52% of large firms. Looking at the largest euro area countries, around 58% of French and German SMEs reported that government support had been important in reducing the risk of bankruptcy, as did 72% of Italian SMEs,[12] highlighting the challenging nature of the economic environment (see right-hand panel of Chart D). In contrast, the majority of Spanish, Dutch and Finnish SMEs (63%, 58% and 51% respectively) reported that these schemes were either not important or not relevant for future repayments. Overall, firms’ replies indicated the importance of government support measures in terms of alleviating firms’ liquidity needs in the medium term especially for SMEs, which are generally more vulnerable than large firms and may be more reliant on such support.
Chart D
Importance of government support in terms of meeting euro area enterprises’ medium-term obligations
(percentages of respondents)

QA3: How important are the government support measures currently in place or planned due to the coronavirus in increasing the ability of your enterprise to meet its debt obligations in the next two years?
Base: All enterprises. Figures refer to round 24 (October 2020-March 2021) of the survey.
4.2 No significant changes in financing obstacles for SMEs
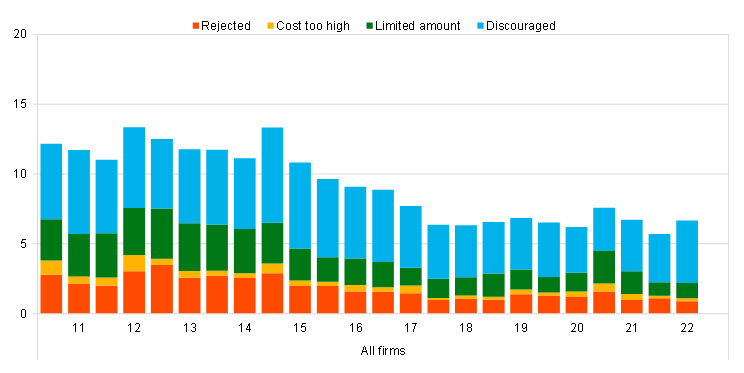
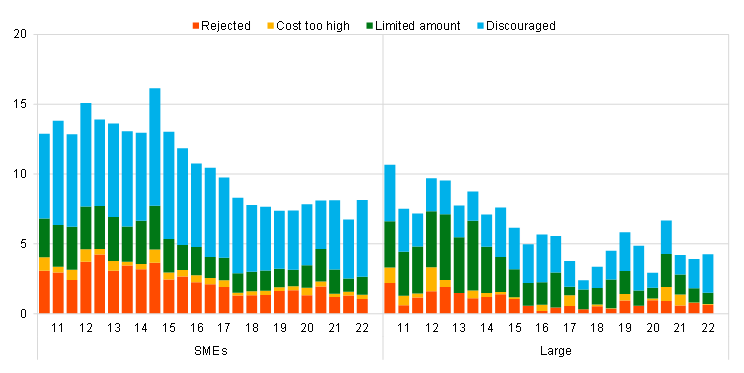
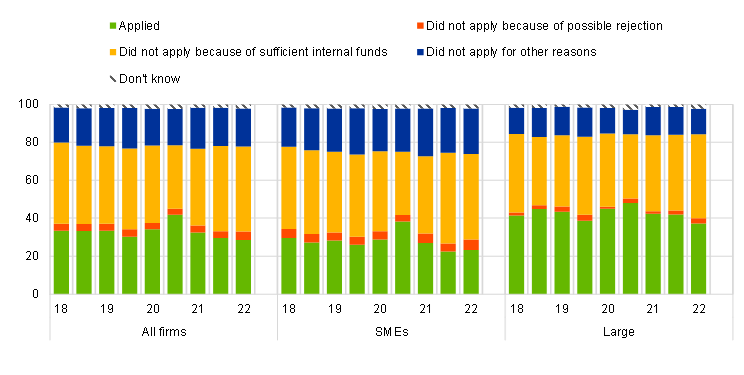
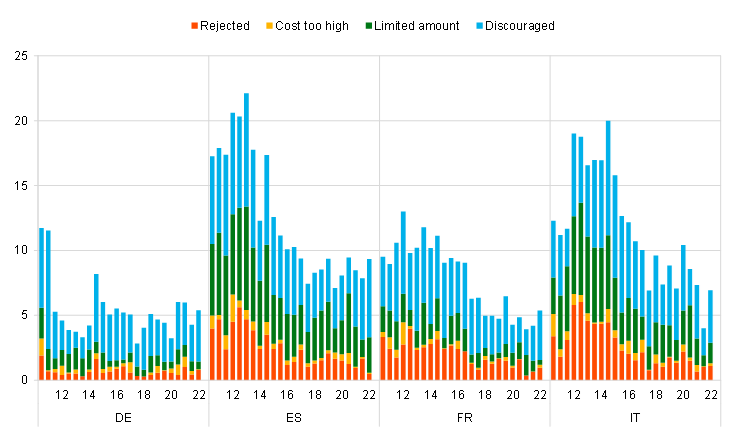
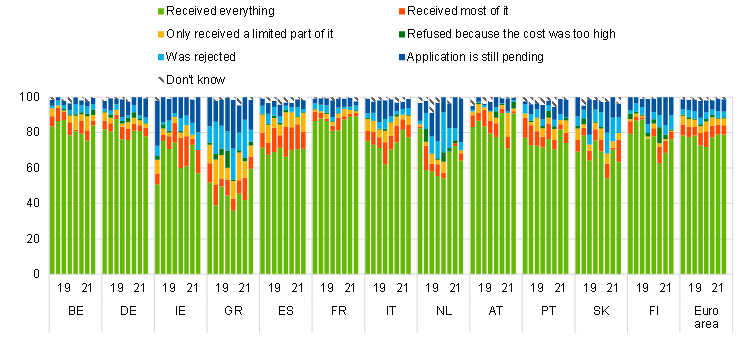
The percentage of SMEs reporting obstacles to obtaining a bank loan remained unchanged (see Chart 24, panel a). Among enterprises that judged bank loans to be relevant for their funding, 8% of SMEs faced obstacles when obtaining a loan (unchanged from the previous survey round), compared with 4% for large enterprises (down from 7%). Looking at the different components of the indicator of financing obstacles, the percentage of SMEs that were discouraged from applying for a loan increased to 5% (up from 3%), while for large enterprises it declined to 1% (down from 2%). At the same time, the percentage of loan applications that were rejected decreased slightly for SMEs (1%, down from 2%) and remained unchanged (at 1%) for large enterprises. Meanwhile, smaller percentages of SMEs and large companies reported receiving only a limited part of the loan amount requested (2% for SMEs; 1% for large firms). Almost no enterprises (neither SMEs nor large firms) considered the cost of a loan to be too high.
Chart 24
Obstacles to obtaining a bank loan
Panel a: Euro area SMEs and large enterprises(over the preceding six months; percentages of respondents)
Panel b: SMEs in large euro area countries

Base: Enterprises for which bank loans (including subsidised bank loans) are relevant. Figures refer to rounds 3 (March-September 2010) to 24 (October 2020-March 2021) of the survey.
Notes: Financing obstacles are defined here as the total of the percentages of enterprises reporting (i) loan applications which were rejected, (ii) loan applications for which only a limited amount was granted, (iii) loan applications which resulted in an offer that was declined by the enterprise because the borrowing costs were too high, and (iv) a decision not to apply for a loan for fear of rejection (discouraged borrowers). The calculation of the indicator starts in 2010, when the question on applications for credit lines was first included in the questionnaire. The components of the financing obstacles indicator were affected by the amendments to the questionnaire in round 11 (filtering based on the relevance of the financing instrument and addition of the new category “my application is still pending”), and past data have been revised accordingly. These figures include the categories “my application is still pending” and “don’t know”.
Spain was the only one of the four largest euro area countries where the percentage of SMEs reporting perceived obstacles to financing increased (see Chart 24, panel b). Increases in the percentage of SMEs facing financing constraints were reported in Spain (10%, up from 8%), with more SMEs signalling that they had not applied for fear of rejection. In Italy, meanwhile, the percentage of discouraged borrowers increased, but the overall indicator of financial constraints remained broadly unchanged (at 8%), with that increase mainly being offset by a decline in the percentage of rejected firms. In this survey round, the highest percentages of SMEs reporting difficulties in accessing bank loans were seen in Slovakia (12%, up from 7%) and Greece (22%, down from 27%) (see Chart 40 in Annex 1).
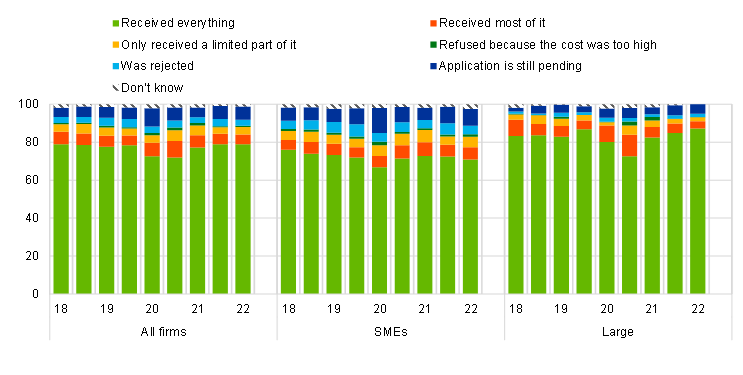
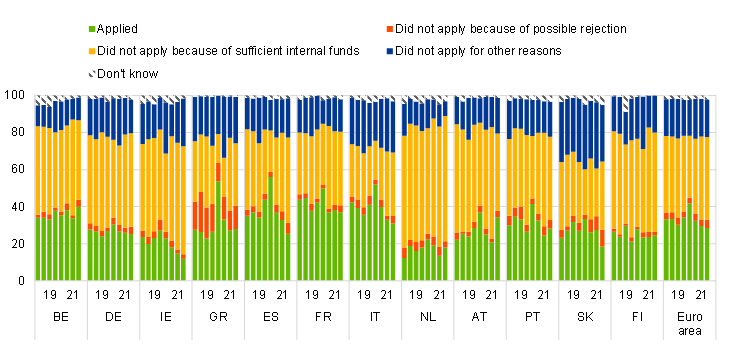
The percentage of SMEs applying for bank loans has declined, according to figures based only on firms that deemed such financing to be relevant for their business (see Chart 41 in Annex 1). At the level of the euro area as a whole, 27% of SMEs reported having applied for a loan (down from 38%), while 41% of SMEs did not apply because of sufficient availability of internal funds (up from 33%). Among firms that submitted a loan application, 73% reported being successful in obtaining the full amount requested (up from 71%) (see Chart 42 in Annex 1). Meanwhile, 42% of large enterprises reported having applied for a bank loan (down from 48%), with 83% receiving the full amount requested (up from 73%).
4.3 Other bank financing costs still more likely to rise than interest rates
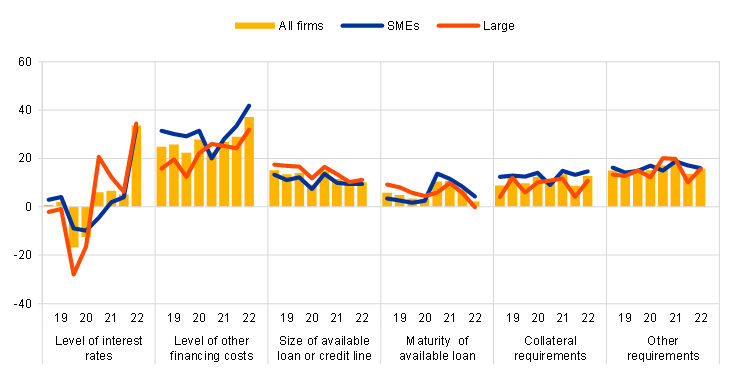
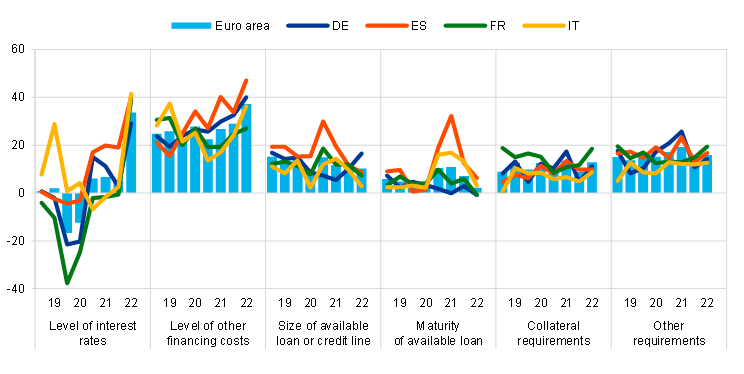
In this survey round, very few SMEs reported increases in interest rates on bank loans, with the net percentage reporting such increases standing at 2% (up from -4% in the previous round) (see Chart 25). At the same time, a net 28% of SMEs (up from 20%) signalled increases in other costs of financing, such as charges, fees and commission. Turning to non-price terms and conditions, SMEs signalled increases in collateral requirements (15%, up from 9%) and other requirements such as covenants (19%, up from 15%). On the other hand, SMEs also reported further improvements in the size and maturity of loans (10% and 12% respectively), albeit less so than in the previous survey round.
Chart 25
Changes in terms and conditions of bank financing for euro area enterprises
(over the preceding six months; net percentages of respondents)
Q10. Please indicate whether the following items increased, remained unchanged or decreased in the past six months.
Base: Enterprises that had applied for bank loans (including subsidised bank loans), credit lines, or bank or credit card overdrafts. Figures refer to rounds 17 (April-September 2017) to 24 (October 2020-March 2021) of the survey.
Note: See the notes on Chart 1.
Large enterprises reported increases in interest rates and other costs of financing. A net 12% of large enterprises reported increases in interest rates on loans granted to them (down from 21%). At the same time, net percentages remained more stable relative to the previous survey round for collateral requirements (12%), other costs of financing (25%) and other requirements (20%). Large firms reported a lengthening of the maturity of loans (10%, up from 6%) and increases in the size of available loans or credit lines (13%, down from 17%).
Developments in interest rates were mixed within the largest euro area economies (see Chart 26). The net percentage of SMEs reporting increases in interest rates rose to 14% in Spain (up from 4%) and 2% in Germany (up from -3%), while French SMEs continued to report declines (-11%, down from -7%). No changes were reported by Italian SMEs (0%, up from -12%). In contrast, the net percentage of SMEs reporting increases in other costs of financing rose in all four countries, reaching 26% in Germany, 37% in Spain, 28% in France and 22% in Italy. Similar patterns can be observed for other euro area countries (see Chart 43 and Chart 44 in Annex 1).
Chart 26
Changes in terms and conditions of bank financing for euro area SMEs
(over the preceding six months; net percentages of respondents)
Q10. Please indicate whether the following items increased, remained unchanged or decreased in the past six months.
Base: SMEs that had applied for bank loans (including subsidised bank loans), credit lines, or bank or credit card overdrafts. Figures refer to rounds 17 (April-September 2017) to 24 (October 2020-March 2021) of the survey.
Note: See the notes on Chart 1.
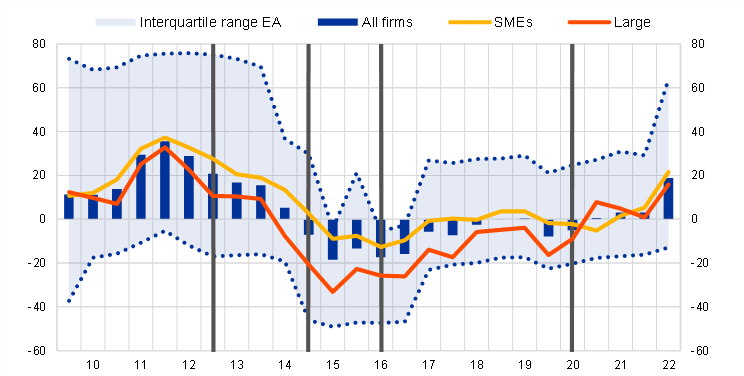
When asked about interest rates charged by banks on credit lines and overdrafts, SMEs tended, on average, to signal declines in the period from October 2020 to March 2021 (see Chart 27)[13]. The average interest rate for SMEs decreased by 20 basis points to stand at 2.5%, while the average rate for micro firms fell to 3.2% (down from 3.5%). Large firms continued to face lower borrowing costs than SMEs, with the average interest rate on credit lines and overdraft declining by 14 basis points to stand at 1.3%.
Chart 27
Interest rates charged on credit lines or bank overdrafts for euro area enterprises
(percentages)
Q8B. What interest rate was charged for the credit line or bank overdraft for which you applied?
Base: Enterprises that successfully applied for a credit line or bank overdraft or applied but didn’t accept the terms that were offered to them (e.g. because the rate was too high). Figures refer to rounds 17 (April-September 2017) to 24 (October 2020-March 2021) of the survey.
Notes: The interquartile range is defined as the difference between the 75th percentile and the 25th percentile. The figures are based on the question introduced in round 11 (April-September 2014).
In the largest euro area countries, the interest rates that SMEs were charged for bank overdrafts and credit lines increased. The highest rises were signalled in France, where the mean reported rate increased by 33 basis points to 1.4% (albeit that remained the lowest rate across those four countries), and in Germany, where SMEs reported mean interest rates of 3.1% (23 basis points higher than in the previous survey round). In Spain average interest rates reached 2.1% (18 basis points more than in the last survey round), while the average rate in Italy fell by 9 basis points to stand at 2.6% (see Chart 28).
Chart 28
Interest rates charged for credit lines or bank overdrafts for euro area SMEs
(percentages)
Q8B. What interest rate was charged for the credit line or bank overdraft for which you applied?
Base: Enterprises that successfully applied for a credit line or bank overdraft or applied but didn’t accept the terms that were offered to them (e.g. because the rate was too high). Figures refer to rounds 17 (April-September 2017) to 24 (October 2020-March 2021) of the survey.
Notes: The interquartile range is defined as the difference between the 75th percentile and the 25th percentile. The figures are based on the question introduced in round 11 (April-September 2014).
Around 47% of the SMEs surveyed indicated that bank loans were not a relevant source of finance for them. In the vast majority of these cases, SMEs had no need for financing via bank loans (76%; see Chart 29). A small percentage pointed to high interest rates or prices as the primary reason for not using bank loans (6%, down from 8%), with the highest percentages being seen in Portugal (18%, down from 20%) and Greece (21%, down from 30%).
Chart 29
Reasons why bank loans are not a relevant source of financing for euro area SMEs
(over the preceding six months; percentages of respondents)
Q32. You mentioned that bank loans are not relevant for your enterprise. What is the main reason for this?
Base: SMEs for which bank loans are not a relevant source of financing. Figures refer to rounds 17 (April-September 2017) to 24 (October 2020-March 2021) of the survey.
5 Expectations regarding access to finance
5.1 SMEs continue to be concerned about their access to external financing in the near future
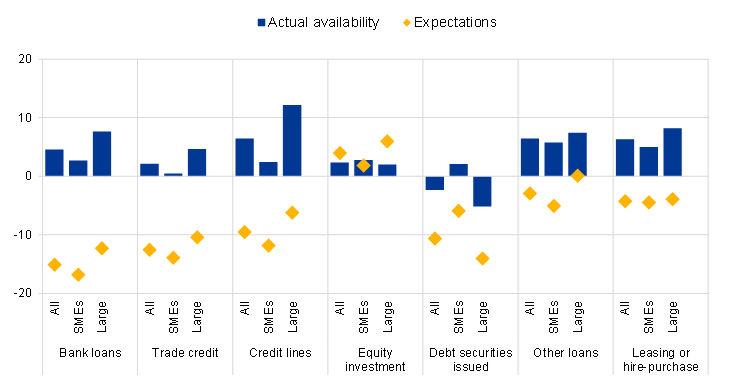
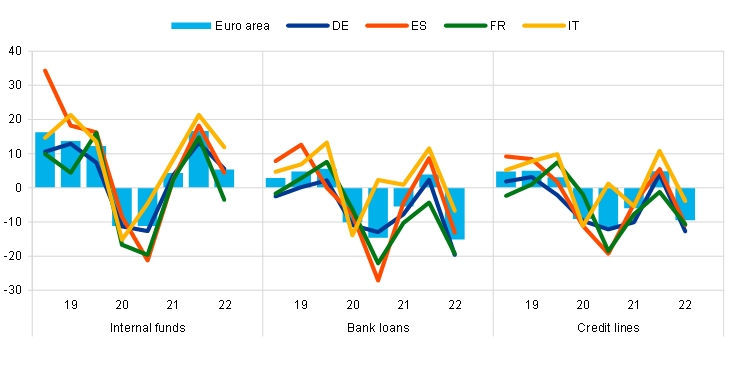
SMEs continued to expect a deterioration in the availability of most sources of external financing, albeit to a lesser extent than before (see Chart 30). In particular, SMEs continued to expect their access to bank loans to deteriorate over the next six months (-9% in net terms, up from -16% in the previous survey round). Similar expectations were expressed as regards access to credit lines (-10%, up from -14%), trade credit (-6%, up from -14%) and other loans (-3%, up from -10%). In contrast, a marginal improvement in access was expected for leasing and hire-purchase (1%, up from -2%). SMEs’ expectations regarding debt securities issuance continue to point to a deterioration (-4%, up from -15%), while equity issuance, by contrast, is expected to improve (2%, up from -3%).[14]
Chart 30
Changes in euro area enterprises’ expectations regarding the availability of financing
(over the preceding six months and over the next six months; net percentages of respondents)
Q9. For each of the following types of financing, would you say that their availability has improved, remained unchanged or deteriorated for your enterprise over the past six months?
Q23. Looking ahead, for each of the following types of financing available to your enterprise, please indicate whether you think their availability will improve, deteriorate or remain unchanged over the next six months.
Base: Enterprises for which the instrument in question is relevant. Figures refer to round 24 (October 2020-March 2021) of the survey.
Note: See the notes on Chart 1 and Chart 13.
Larger enterprises tend to be more optimistic in their expectations for most sources of external financing. For example, large firms expect, in net terms, to see an improvement in their access to most sources of external finance in the months ahead, whereas SMEs expect a further deterioration.
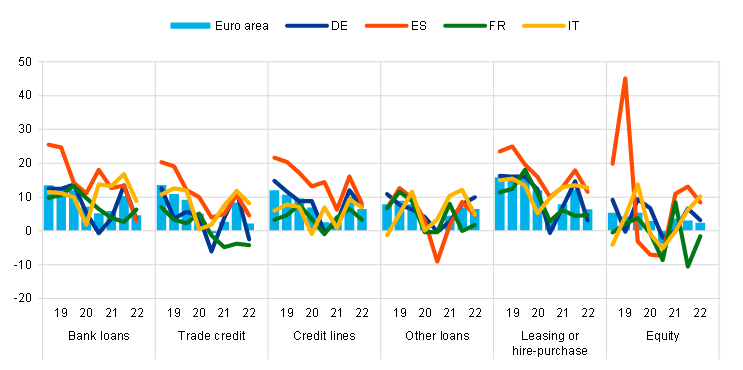
SMEs in most countries continue to expect a deterioration in access to external financing, but there are some differences across countries (see Chart 31). For example, in the four largest countries, the net percentages for access to bank loans range from -15% in France to -3% in Italy, with similar differences in expectations being seen across countries for trade credit and other loans. When it comes to the issuance of equity and debt securities, Italian SMEs expect substantial improvements, in stark contrast with firms in other countries, but for other sources of external financing, such as credit lines (significant deterioration) or leasing and hire-purchase (broadly unchanged), expectations are fairly similar across countries.
Chart 31
Changes in euro area SMEs’ expectations regarding the availability of financing
(over the preceding six months and over the next six months; net percentages of respondents)

Q9. For each of the following types of financing, would you say that their availability has improved, remained unchanged or deteriorated for your enterprise over the past six months?
Q23. Looking ahead, for each of the following types of financing available to your enterprise, please indicate whether you think their availability will improve, deteriorate or remain unchanged over the next six months.
Base: SMEs for which the instrument in question is relevant. Figures refer to round 24 (October 2020-March 2021) of the survey.
Note: See the notes on Chart 1 and Chart 13.
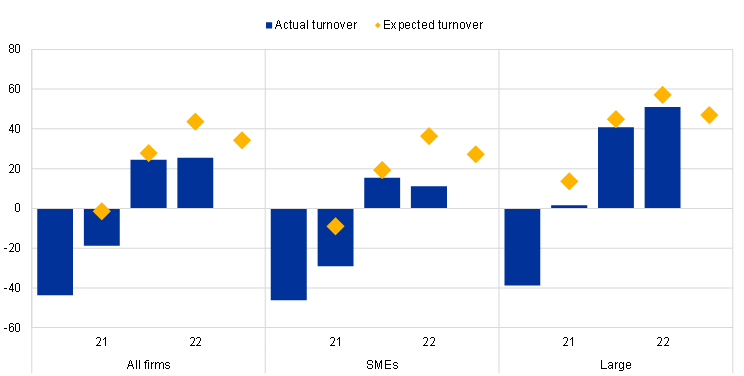
Expectations regarding turnover suggest that firms expect an economic recovery in the coming months. The relevant net percentage (19%, up from -9%) indicates that, on balance, euro area enterprises foresee an increase in turnover over the next six months, after two rounds of declining turnover since the start of the pandemic (see Chart 32). Moreover, those expectations of higher turnover can be seen in all euro area countries. In the four largest countries, there is greater optimism among Spanish SMEs (28% in net terms) and more limited confidence among their German counterparts (13%). Firms of all sizes expect, in net terms, to see advances in turnover over the next six months, suggesting a broad-based recovery in business activity. Company size is, however, a fundamental factor in such expectations: larger companies reported the highest expectations (45% in net terms), whereas micro SMEs reported more modest expectations, but still double-digit figures (12%).
Chart 32
Actual and expected turnover among euro area enterprises
(over the preceding six months and over the next six months; net percentages of respondents)
Q2. Have the following company indicators decreased, remained unchanged or increased over the past six months?
Q26. Looking ahead, please indicate whether you think your company’s turnover will increase, decrease or remain unchanged over the next six months.
Base: All enterprises. Figures refer to round 24 (October 2020-March 2021) of the survey.
Annexes
Annex 1
Overview of survey replies – selected charts
Chart 33
Changes in turnover and profits of SMEs across euro area countries
(over the preceding six months; net percentages of respondents)
Q2. Have the following company indicators decreased, remained unchanged or increased over the past six months?
Base: All SMEs. Figures refer to rounds 17 (April-September 2017) to 24 (October 2020-March 2021) of the survey.
Note: See the notes on Chart 1.
Chart 34
Changes in debt-to-assets ratios and interest expenses of SMEs across euro area countries
(over the preceding six months; net percentages of respondents)
Q2. Have the following company indicators decreased, remained unchanged or increased over the past six months?
Base: All SMEs. Figures refer to rounds 17 (April-September 2017) to 24 (October 2020-March 2021) of the survey.
Note: See the notes on Chart 1.
Chart 35
Vulnerable and profitable SMEs across euro area countries
(over the preceding six months; percentages of respondents)
Q2. Have the following company indicators decreased, remained unchanged or increased over the past six months?
Base: All SMEs. Figures refer to rounds 3 (March-September 2010) to 24 (October 2020-March 2021) of the survey.
Notes: For definitions, see footnote 5 of the report. In Slovakia, the survey was initially conducted every two years (first half of 2009, 2011 and 2013). Since 2014, Slovakia has been included in the sample in each survey round.
Chart 36
The most important problems faced by SMEs across euro area countries
(over the preceding six months; percentages of respondents)
Q0. How important have the following problems been for your enterprise in the past six months?
Base: All SMEs. Figures refer to rounds 17 (April-September 2017) to 24 (October 2020-March 2021) of the survey.
Note: See the notes on Chart 7.
Chart 37
Changes in the availability of and need for bank loans for SMEs across euro area countries
(over the preceding six months; net percentages of respondents)
Q5. For each of the following types of external financing, please indicate if your needs increased, remained unchanged or decreased over the past six months.
Q9. For each of the following types of financing, would you say that their availability has improved, remained unchanged or deteriorated for your enterprise over the past six months?
Base: SMEs for which bank loans are a relevant source of financing. Figures refer to rounds 17 (April-September 2017) to 24 (October 2020-March 2021) of the survey.
Note: See the notes on Chart 1 and Chart 13.
Chart 38
Changes in the external financing gap perceived by SMEs across euro area countries
(over the preceding six months; weighted net balances)
Q5. For each of the following types of external financing, please indicate if your needs increased, remained unchanged or decreased over the past six months.
Q9. For each of the following types of financing, would you say that their availability has improved, remained unchanged or deteriorated for your enterprise over the past six months?
Base: SMEs for which the instrument in question is relevant. Respondents replying with “not applicable” or “don’t know” are excluded. Figures refer to rounds 17 (April-September 2017) to 24 (October 2020-March 2021) of the survey.
Notes: See the notes on Chart 19. The financing gap indicator combines both financing needs and the availability of bank loans, credit lines, trade credit, and equity and debt securities issuance at firm level. For each of the five financing instruments, the indicator of the perceived change in the financing gap takes a value of 1 (-1) if the need increases (decreases) and availability decreases (increases). If enterprises perceive only a one-sided increase (decrease) in the financing gap, the variable is assigned a value of 0.5 (-0.5). The composite indicator is a weighted average of the financing gaps for the five instruments. A positive value for the indicator points to an increase in the financing gap. Values are multiplied by 100 to obtain weighted net balances in percentages.
Chart 39
Changes in factors with an impact on the availability of external financing for SMEs across euro area countries
(over the preceding six months; net percentages of respondents)

Q11. For each of the following factors, would you say that they have improved, remained unchanged or deteriorated over the past six months?
Base: All SMEs; for the category “willingness of banks to lend”, SMEs for which at least one bank financing instrument (credit line, bank overdraft, credit card overdraft, bank loan or subsidised bank loan) is relevant. Figures refer to rounds 17 (April-September 2017) to 24 (October 2020-March 2021) of the survey.
Notes: See the notes on Chart 1 and Chart 22. In round 11 (April-September 2014), the category “willingness of banks to provide a loan” was changed slightly to “willingness of banks to provide credit to your enterprise”.
Chart 40
Obstacles to obtaining a bank loan for SMEs across euro area countries
(over the preceding six months; percentages of respondents)
Base: Enterprises for which bank loans (including subsidised bank loans) are relevant. Figures refer to rounds 17 (April-September 2017) to 24 (October 2020-March 2021) of the survey.
Notes: Financing obstacles are defined here as the total of the percentages of enterprises reporting (i) loan applications which were rejected, (ii) loan applications for which only a limited amount was granted, (iii) loan applications which resulted in an offer that was declined by the enterprise because the borrowing costs were too high, and (iv) a decision not to apply for a loan for fear of rejection (discouraged borrowers). The calculation of the indicator starts in 2010, when the question on applications for credit lines was first included in the questionnaire. The components of the financing obstacles indicator were affected by the amendments to the questionnaire in round 11 (filtering based on the relevance of the financing instrument and addition of the new category “my application is still pending”), and past data have been revised accordingly. These figures include the categories “my application is still pending” and “don’t know”.
Chart 41
Applications for bank loans by SMEs across euro area countries
(over the preceding six months; percentages of respondents)
Q7A. Have you applied for the following types of financing in the past six months?
Base: SMEs for which bank loans (including subsidised bank loans) are relevant. Figures refer to rounds 17 (April-September 2017) to 24 (October 2020-March 2021) of the survey.
Note: See the notes on Chart 13.
Chart 42
Outcome of applications for bank loans by SMEs across euro area countries
(over the preceding six months; percentages of respondents)
Q7B. If you applied and tried to negotiate this type of financing over the past six months, what was the outcome?
Base: SMEs that had applied for bank loans (including subsidised bank loans). Figures refer to rounds 17 (April-September 2017) to 24 (October 2020-March 2021) of the survey.
Note: See the notes on Chart 13.
Chart 43
Changes in the cost of bank financing for SMEs across euro area countries
(over the preceding six months; net percentages of respondents)

Q10. Please indicate whether the following items increased, remained unchanged or decreased in the past six months.
Base: SMEs that had applied for bank loans (including subsidised bank loans), credit lines, or bank or credit card overdrafts. Figures refer to rounds 17 (April-September 2017) to 24 (October 2020-March 2021) of the survey.
Note: See the notes on Chart 1.
Chart 44
Changes in non-price terms and conditions of bank financing for SMEs across euro area countries
(over the preceding six months; net percentages of respondents)
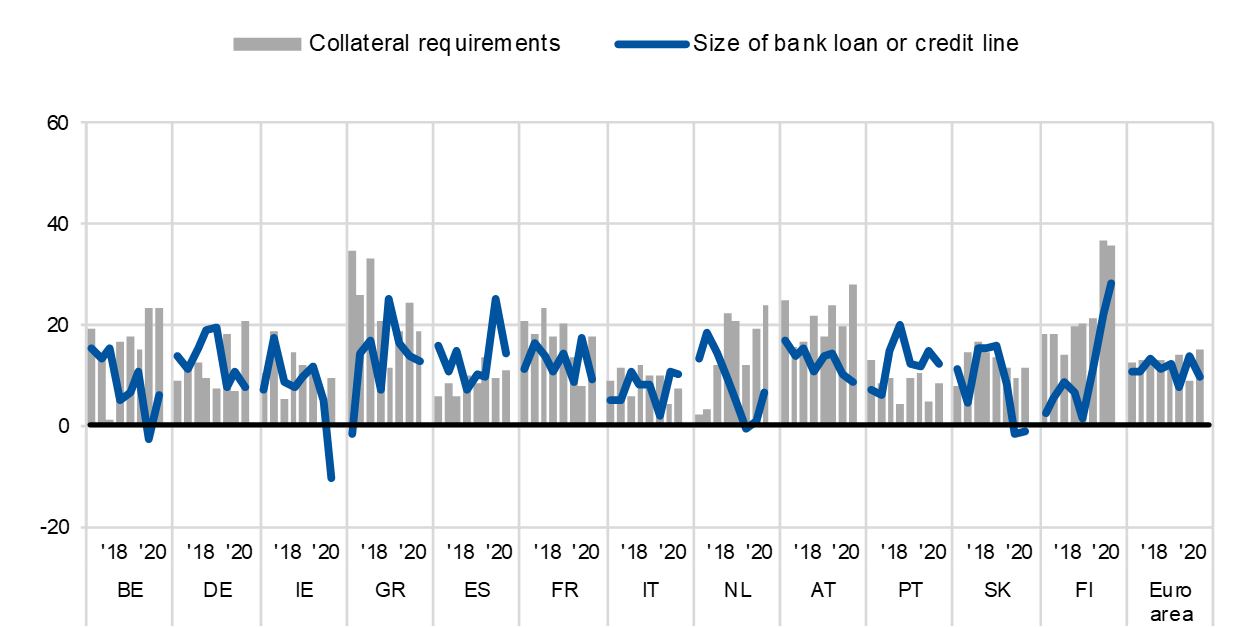
Q10. Please indicate whether the following items increased, remained unchanged or decreased in the past six months.
Base: SMEs that had applied for bank loans (including subsidised bank loans), credit lines, or bank or credit card overdrafts. Figures refer to rounds 17 (April-September 2017) to 24 (October 2020-March 2021) of the survey.
Note: See the notes on Chart 1
Annex 2
Descriptive statistics for the sample of enterprises
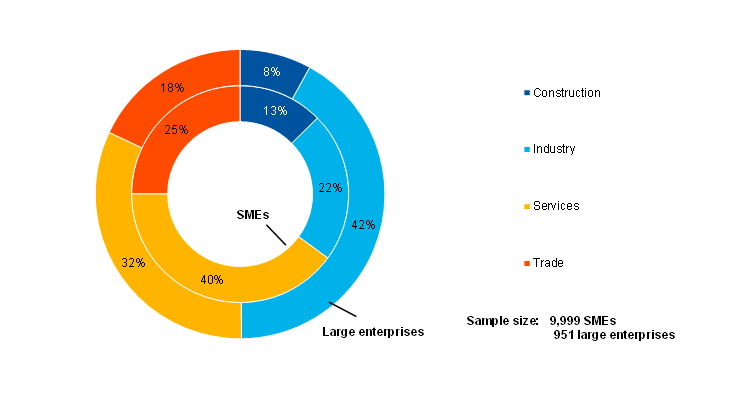
Chart 45
Breakdown of enterprises by economic activity
(unweighted percentages)
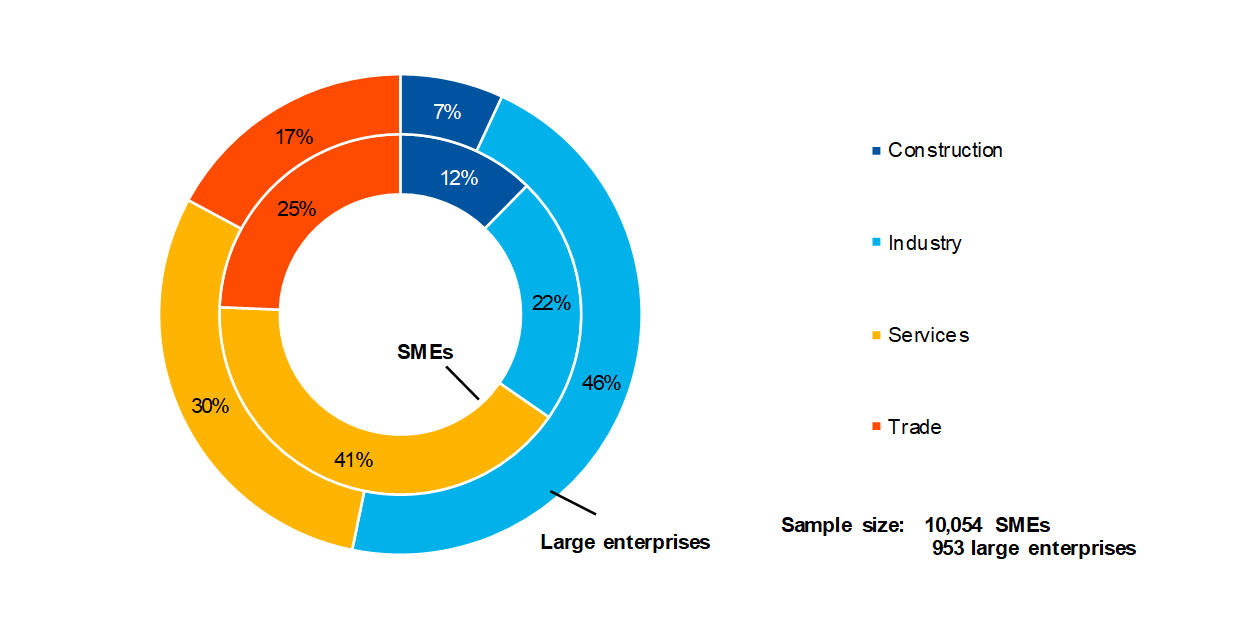
Base: Figures refer to round 24 (October 2020-March 2021) of the survey.
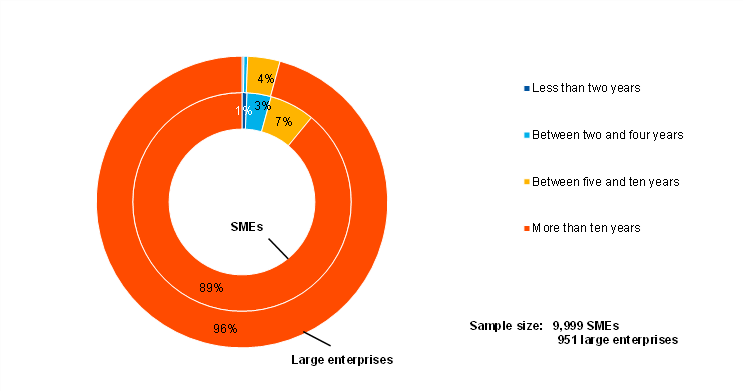
Chart 46
Breakdown of enterprises by age
(unweighted percentages)
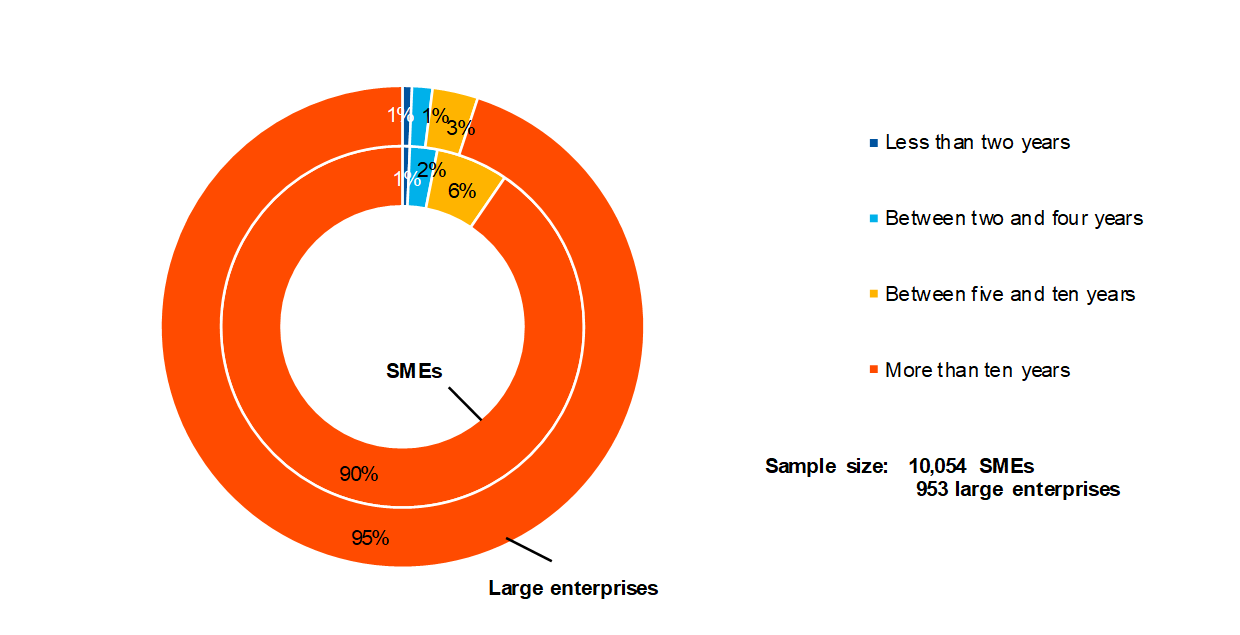
Base: Figures refer to round 24 (October 2020-March 2021) of the survey.
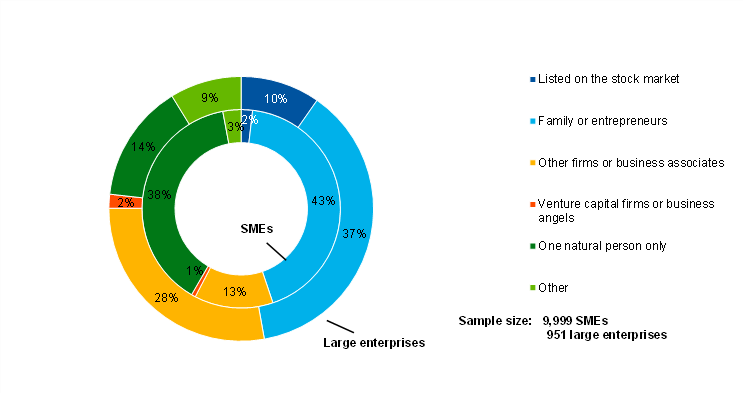
Chart 47
Breakdown of enterprises by ownership
(unweighted percentages)
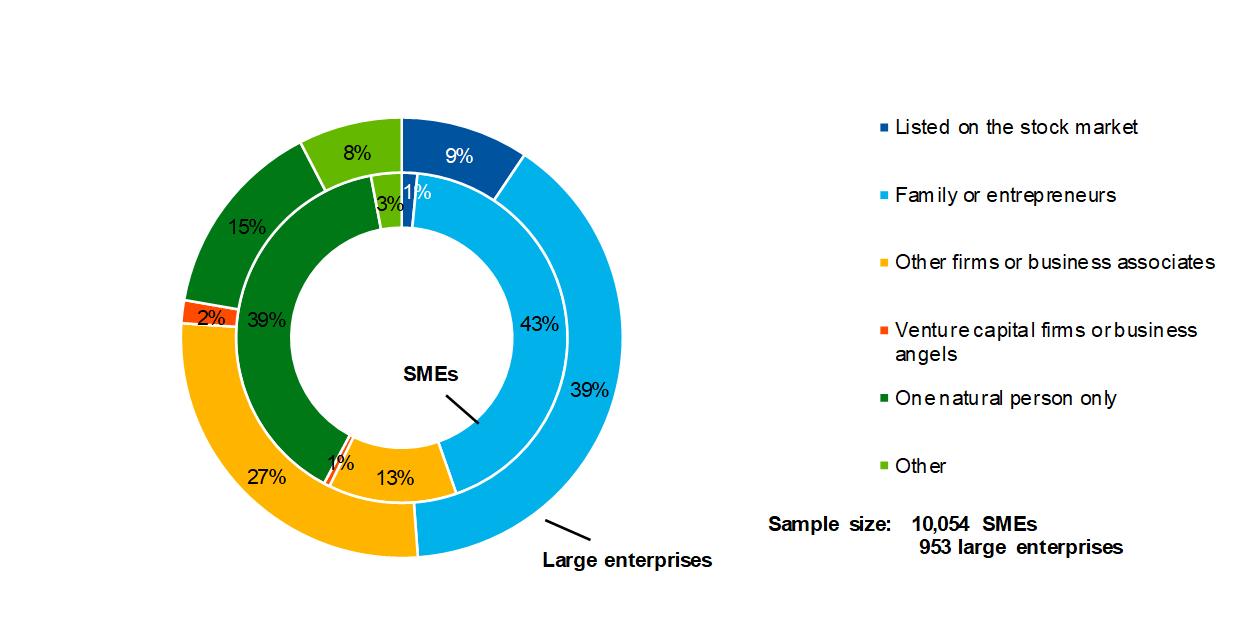
Base: Figures refer to round 24 (October 2020-March 2021) of the survey.
Chart 48
Breakdown of enterprises by exports
(unweighted percentages)
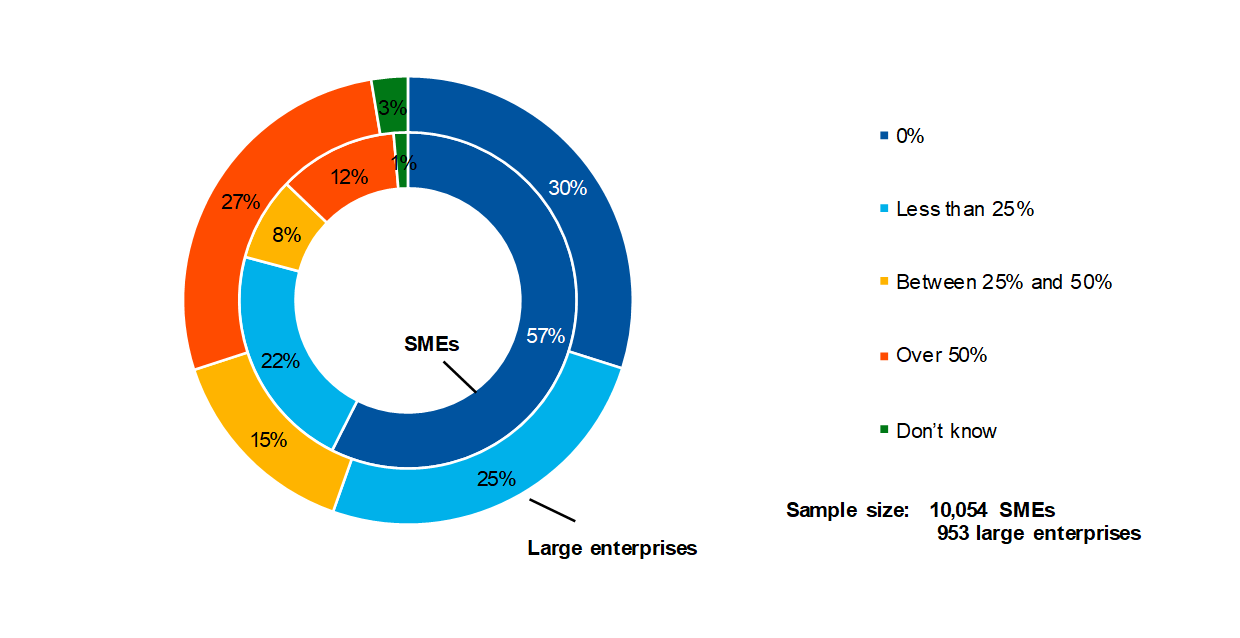
Base: Figures refer to round 24 (October 2020-March 2021) of the survey.
Annex 3
Methodological information on the survey
This annex presents the main changes introduced in the latest round of the Survey on the Access to Finance of Enterprises (SAFE). For an overview of how the survey was set up, the general characteristics of the euro area enterprises that participate in the survey and the changes introduced to the methodology and the questionnaire over time, see the “Methodological information on the survey and user guide for the anonymised micro dataset”, which is available on the ECB’s website.[15]
Since September 2014 the survey has been carried out by Panteia b.v., in cooperation with the fieldwork provider GDCC. To the best of our knowledge, no breaks in the series are attributable to any change of provider over the life cycle of the survey.
However, some changes in the questionnaire may have caused a break between the round covering the second half of 2013 and that covering the first half of 2014. This stems from the review of various components of the survey after ten survey rounds, covering the questionnaire, sample allocation, the survey mode and the weighting scheme (see Annex 4 to the corresponding report on the ECB’s website for details[16]).
With regard to the weighting scheme, up to the survey round covering the first half of 2015, the calibration targets were updated with each survey round on the basis of the latest available figures from Eurostat’s structural business statistics (SBS). Since then, with all the euro area countries participating in the survey, the weighting scheme has been updated once a year.[17]
In this survey round, no major changes were made to the existing questions in the questionnaire.[18]
© European Central Bank, 2021
Postal address 60640 Frankfurt am Main, Germany
Telephone +49 69 1344 0
Website www.ecb.europa.eu
All rights reserved. Reproduction for educational and non-commercial purposes is permitted provided that the source is acknowledged.
The cut-off date for data included in this report was 30 May 2021.
PDF ISSN 1831-9998, QB-AP-20-002-EN-N
HTML ISSN 1831-9998, QB-AP-20-002-EN-Q
- See Annex 3 for details of methodological issues relating to the survey.
- The net percentages indicated in this report are defined as the difference between the percentage of enterprises reporting that something has increased and the percentage reporting that it has declined.
- The financing obstacles indicator is the sum of the percentages of SMEs reporting the rejection of loan applications, loan applications for which only a limited amount was granted, and loan applications which resulted in an offer that was declined by the SME because the borrowing costs were too high, as well as the percentage of SMEs that did not apply for a loan for fear of rejection.
- Net percentages (or net terms) are defined as the difference between the percentage of enterprises reporting that something has increased and the percentage reporting that it has declined.
- Vulnerable firms are defined as firms that simultaneously report lower turnover, decreasing profits, higher interest expenses and a higher or unchanged debt-to-assets ratio, while profitable firms are those that simultaneously report higher turnover and profits, lower or no interest expenses and a lower or no debt-to-assets ratio. The third (and typically largest) group consists of firms that satisfy some, but not all, conditions of the vulnerable and profitable categories. See the box entitled “Distressed and profitable firms: two new indicators on the financial position of enterprises”, Survey on the Access to Finance of Enterprises in the euro area, October 2017 to March 2018, ECB.
- See footnote 5 for details.
- The formulation of this question allows the relevance of a specific financial instrument to be disentangled from its usage. See the SAFE questionnaire.
- See the note on Chart 13. Only survey respondents who report that a particular financing instrument is relevant for their enterprise are asked about their need for that source of financing.
- See the notes on Chart 13. Only survey respondents which report that a particular financing instrument (i.e. bank loans, credit lines, trade credit, leasing or hire-purchase, or other loans) is relevant for their enterprise are asked about the availability of that source of financing.
- High percentages were also reported by Irish and Austrian SMEs (67% and 63% respectively).
- For Irish and Portuguese SMEs, the percentage was even higher at around 97%.
- This was also reported by 67% and 65% of Irish and Portuguese SMEs respectively.
- The question about the interest rates charged on credit lines or bank overdrafts was added to the questionnaire in round 11 (April-September 2014). The weighted mean reported by euro area enterprises (1.87%) is 4 basis points lower than the official MFI interest rate statistics on bank overdrafts (average for the period from October 2020 to March 2021), while the median value (1.47%) is 36 basis points lower. Two caveats apply when comparing the figures quoted in this report with official bank interest rate statistics: (i) the bank statistics are weighted by loan volumes, whereas the survey responses are weighted by the number of employees; and (ii) the bank statistics refer to all financing granted in the review period, whereas the survey responses only include enterprises that successfully applied for a credit line or bank overdraft or applied, but didn’t accept the terms that were offered to them (e.g. because the rate was too high).
- As usual, the figures relating to market-based finance need to be treated with some caution, as the percentage of firms answering this survey question remains extremely low (with only 14% of all SMEs regarding market-based financing as potentially relevant).
- Survey on the access to finance of enterprises – Methodological information on the survey and user guide for the anonymised micro dataset.
- Survey on the Access to Finance of Enterprises in the euro area – April 2014 to September 2014.
- For more details, see the section on weighting in Survey on the access to finance of enterprises – Methodological information on the survey and user guide for the anonymised micro dataset.
- The questionnaire is available on the ECB’s website. It has been translated into various languages for the purposes of the survey.
-
1 June 2021