

- THE ECB BLOG
Inflation Diagnostics
Frankfurt am Main, 25 November 2022
Identifying the medium-term inflation path in the current environment of high inflation, ongoing energy and pandemic-related shocks and the Russian invasion of Ukraine is a diagnostic challenge. In his ECB Blog post Philip R. Lane, Member of the ECB’s Executive Board, describes some of the key analytical issues involved.
Summary
This blog post describes the diagnostic challenges in identifying the medium-term inflation path in the current environment of high inflation, ongoing energy and pandemic-related shocks and the Russian invasion of Ukraine.[1] It interprets the surge in inflation since the middle of 2021 as the result of extraordinary relative price shocks that, in the presence of downward nominal price and wage rigidities, initially translate into an increase in the inflation rate. These relative price shocks reflect the scale and breadth of the energy shock and the pandemic- and war-related shocks. Under such circumstances, standard measures of contemporaneous underlying inflation may not accurately signal the persistent component of inflation, while forward-looking wage growth trackers may play a useful supplementary role in identifying the medium-term inflation dynamics. Long-term inflation expectations currently appear well anchored at the two per cent target, but a prolonged phase of above-target inflation poses a de-anchoring risk that is addressed by raising interest rates to the levels required to make sure that inflation returns to target in a timely manner.
Introduction
The aim of this blog post is to describe some of the analytical issues involved in diagnosing the sources and dynamics of inflation in the euro area.
The left panel of Chart 1 plots the annual headline inflation rate since 1999, while the right panel of Chart 1 plots the cumulative change in the price level. Inflation has increased very quickly since the middle of 2021, resulting in a large cumulative increase in the cost of living.
Chart 1
HICP inflation and the HICP price level
(left: annual percentage changes, right: index: Dec-1998 = 100)
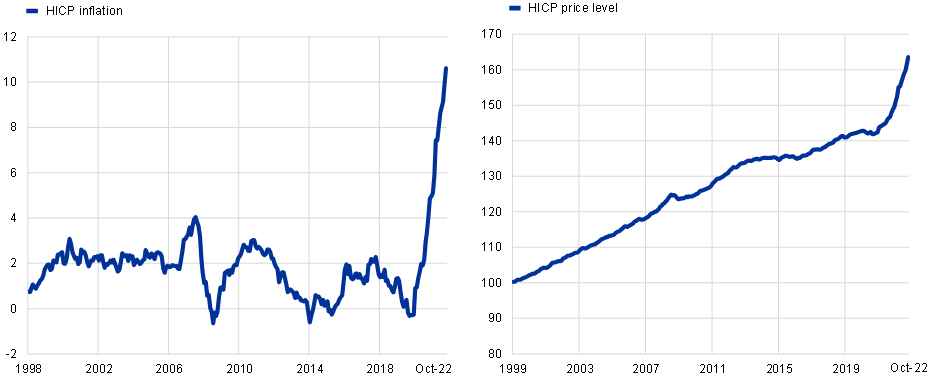
Sources: Eurostat.
Notes: The right panel is based on seasonally adjusted data.
The latest observations are for October 2022.
Having ended net purchases under the pandemic emergency purchase programme (PEPP) in March and under the asset purchase programme (APP) in June and raised the key policy rates by a cumulative two hundred basis points since July, the Governing Council is committed to bringing interest rates to the levels needed to ensure the timely return of inflation to our two per cent medium-term inflation target.[2]
It follows that the identification of the medium-term inflation outlook takes centre stage in determining the future interest rate path. While there is always a role for high-level frameworks that seek to predict medium-term inflation on the basis of a very small set of conditioning variables, it is also wise to conduct comprehensive assessments that recognise the interaction among myriad forces in determining inflation dynamics.
The high current inflation rate makes it especially challenging to assess the likely medium-term path of inflation, since it requires a careful diagnosis of the sources of inflation along several dimensions: the relative contributions of supply factors and demand factors (including the impact of monetary policy); the relative split between temporary and persistent components; the role of relative price shocks; the balance between external and domestic forces; the formation of inflation expectations. Moreover, each of these dimensions interact with two over-riding forces: the Russian invasion of Ukraine and the pandemic cycle.
In this blog post, my aim is to examine some of the main challenges in diagnosing inflation. I begin by examining the role played by sectoral relative prices in near-term inflation, including an analysis of the underlying forces driving these relative prices since 2020; I next turn to the assessment of measures of underlying inflation; I then examine the inter-connections between wage inflation and price inflation before turning to the formation of inflation expectations; I conclude with a discussion of some primary open questions in the identification of medium-term inflation dynamics.
Price level components: 1999-2022
The simplest form of inflation is an increase in the overall price level that consists of a uniform increase in the prices of all items, with relative prices unaffected. However, shifts in sectoral relative prices are relevant for inflation dynamics for two reasons. First, although a large shock to sectoral relative prices could in principle be accommodated with no change in the overall inflation rate, the prevalence of downward nominal price and wage stickiness means that a large upward shift in the relative prices of some categories (at unchanged prices of the other categories) will translate into an increase in the overall inflation rate in the near term, since the maintenance of a constant inflation rate would otherwise require a substantial and rapid monetary tightening and a large drop in output.[3] In addition to the intrinsic time lags in the transmission of monetary policy, this is a basic reason why central banks focus on medium-term inflation, rather than aiming to deliver the inflation target on a continuous basis.
Second, the longer-term patterns in relative prices are also relevant in monitoring inflation dynamics. In particular, if there are systematic positive or negative trends for some sectoral relative price levels, the distance to the underlying trend is relevant in gauging the likely persistence of a shock to sectoral relative price levels.
I begin by describing the evolution of the relative price levels of the four main components of the overall Harmonised Index of Consumer Prices (HICP): energy; food; goods; and services. The current weights of these components in the euro area overall HICP are: energy (11 per cent); food (21 per cent); goods (26 per cent); services (42 per cent).
The energy, food and goods categories have a larger share of internationally-tradable inputs and products than the services category.[4] It follows that global factors play a larger role in determining prices in the energy, food and goods categories, while domestic factors play a larger role in determining prices in the services category.[5] These are matters of degree: domestic factors are important for all categories; while international trade in services is considerable, especially in sectors such as tourism. Still, the relative importance of international versus domestic factors play a fundamental role in determining pricing pressures in different sectors.
A second basic analytical distinction relates to the scope for technological progress. In particular, measuring and explaining the differences in productivity growth rates between the manufacturing and services sectors is a long-standing topic in economics research. The faster productivity growth rate in manufacturing relative to services drives up relative unit labour costs in services compared to manufacturing, thereby putting upward trend pressure on the relative price of services compared to manufacturing: the upward wage pressure in sectors that have not experienced commensurate productivity gains is familiar from Baumol’s cost disease hypothesis.[6]
In turn, in an open-economy setting in which the prices of tradable goods are pinned down by global competition, the income gains generated by productivity growth translate into greater pressure on the relative prices of services compared to goods since higher domestic demand for goods can be partly absorbed by higher imports whereas higher domestic demand for services requires the transfer of workers into the lower-productivity and higher-cost non-tradables sector: this is the basic mechanism underpinning the Balassa-Samuelson hypothesis.[7]
In Chart 2, I divide the 1999-2022 period into two phases. The left panel shows the evolution of relative price levels between the end of 1998 and the end of 2019. The right panel shows the evolution of relative price levels from the end of 2019 to October 2022. I express each sectoral price level relative to the overall HICP price level: this combines pure relative price effects with the differential weights of each category in the overall price level, which serves to focus attention on the degree of alignment of each category with overall price level dynamics.
Chart 2
Price developments relative to HICP for different subcomponents
(left: index: 1998 Q4 =100, right: index: December 2019 = 100)

Sources: Eurostat.
Note: Seasonally adjusted data for HICP, food, goods and services. Seasonally adjusted series for energy are not available. The goods category here only includes non-energy industrial goods (NEIG).
The latest observations are for October 2022.
The left panel shows some striking patterns. First, there was a strong cumulative increase in the relative price of energy over 1999-2012 which partly reversed over 2013-2019; there were sizeable cyclical fluctuations around these trend patterns. Second, there was a negative trend in the relative price of non-energy industrial goods. This can be understood as connected to the combined contributions of the superior productivity performance and increasing tradability of the manufacturing sector over this period, with technological progress and globalisation fostering a trend decline in the relative prices of many goods. Third, there was a mild upward trend in the relative price of food – trend productivity growth in agriculture tends to be lower than in other sectors, while rising global incomes have put upward pressure on the relative price of global agricultural commodities.
Fourth, there was very little cumulative difference between the services price level and the overall price level. Mechanically, this reflects two factors: (a) at 42 per cent, the services category has the largest weight in the overall price level; (b) the rising relative prices of energy and food and the declining relative price of goods largely cancelled out over this period, such that the trend in the overall price level closely matched the trend in the services price level.
These patterns help to explain the traditional focus on services inflation as a proxy for the medium-term dynamics of overall inflation: its high weight in the overall price index means that services inflation is inevitably a dominant factor over the medium term, while the opposing trends for energy inflation and food inflation in one direction and goods inflation in the other direction offset each other in the pre-pandemic period. While the underlying trend in headline inflation has been closely connected to the trend in services inflation, the large fluctuations in energy inflation have translated into significant volatility in headline inflation.
Turning to the right panel of Chart 2, the shifts in relative price levels since the end of 2019 have been dramatic. The price level of energy relative to the overall price level has increased by 40 per cent since the end of 2019: in this short period, the scale of the relative price increase is approximately the same as the cumulative increase over the previous twenty years.
The price level of food has also increased relative to the overall price level by 2.1 per cent, while the price levels of goods and services have lagged the overall price level by 5.9 per cent and 6.8 per cent, respectively: a faster increase in the price of goods relative to services is highly unusual. As is clear from the left panel of Chart 2 (and indeed even more so over longer time spans), surges in the relative price of energy (and food) have occurred repeatedly (even if the nature of the current shock is special along several dimensions) but a simultaneous surge in the price of goods relative to services is atypical. The role of the pandemic in these relative price shifts has been much discussed, while the Russian invasion of Ukraine has further added to these relative price pressures, especially in relation to energy and food.
Chart 3 makes the same point by plotting the overall inflation rate together with the sectoral inflation rates. Over 1999-2019, the fluctuations in overall inflation were largely driven by the swings in energy prices (especially) and food prices, whereas the inflation rates for goods and services were much more stable (with the inflation rate for goods typically well below the inflation rate for services). In 2020, all sectoral inflation rates were low, with the energy inflation rate substantially negative. Over 2021-2022, the rise in the overall inflation rate was a combination of a very steep increase in energy inflation and sizeable increases also in the other categories.
Chart 3
HICP inflation and inflation across HICP components
(annual percentage changes)
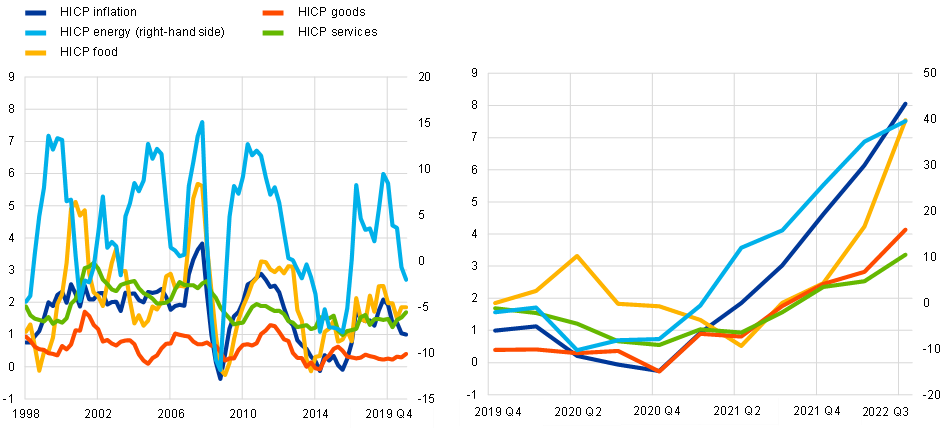
Sources: Eurostat and ECB staff calculations.
Note: HICP goods here only includes non-energy industrial goods (NEIG).
The latest observations are for Q3 2022.
Next, I review some of the characteristics of price dynamics in each of these categories. The left panel of Chart 4 shows that oil prices were the main driver of composite energy commodity prices over 1999-2019. The right panel shows that gas prices, electricity prices and the energy commodity price index have increased far more than oil prices since the middle of 2021: the composition of the current energy shock is quite different compared to the traditional oil-driven energy shock.
Chart 4
Developments in energy commodity prices
(left side: index – Jan-2006=100; right side: index – Dec-2019=100)
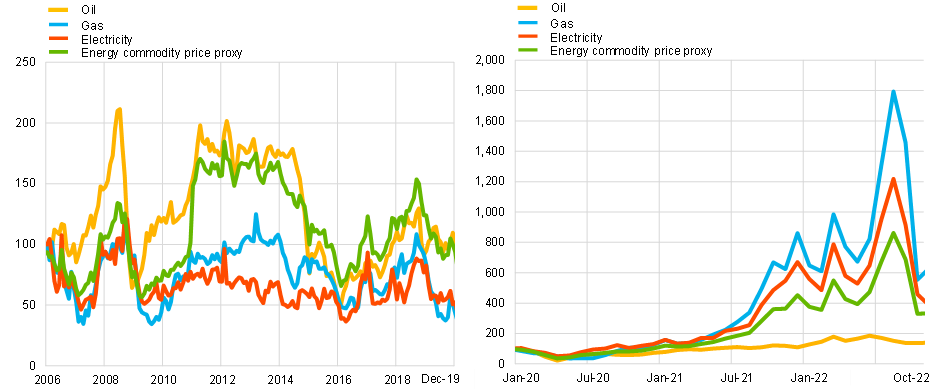
Sources: Refinitiv, Eurostat and ECB staff calculations.
Notes: The “energy commodity price proxy” represents a weighted average of oil, gas and electricity prices indexed to Jan-2006 (left panel) and Dec 2019=100 (right panel), using weights based on the respective shares of oil, gas and electricity in euro area final energy consumption (2006-2020 data). Electricity prices are calculated as a weighted average of wholesale electricity prices in the five largest euro area economies.
The latest observations are for October 2022.
Chart 5 shows the overall food price level together with the food import price level and food export price level. The left panel highlights the role of global factors in determining the evolution of food prices: these global factors operate not only through their direct impact on consumer food prices but also through their indirect impact via the food commodities and intermediate inputs used in food production. These global forces were especially strong during 2020-2022, with both export and import prices for food rising far more quickly than domestic food prices.[8]
Chart 5
(left: index: Jan-2005 = 100, right: index: Dec-2019 = 100)
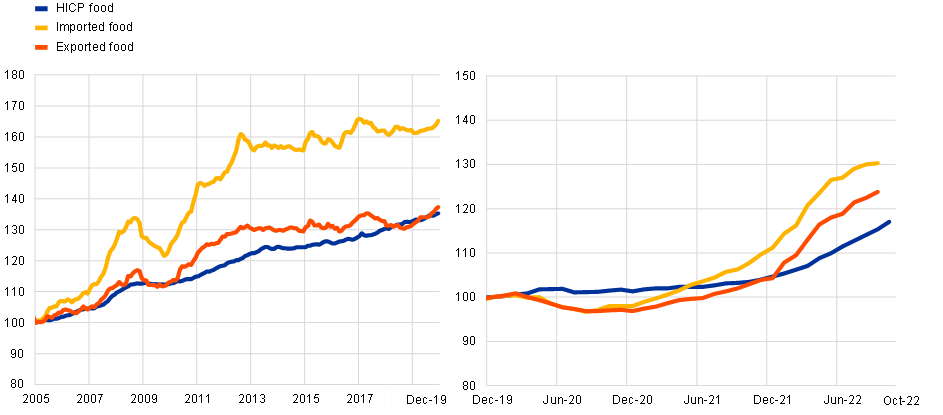
Sources: Eurostat.
Note: Extra euro area food import prices only available from January 2005. Seasonally adjusted data for HICP food. Seasonally adjusted data for imported goods prices and exported goods prices not available.
The latest observations are for October 2022 for HICP food, September 2022 for the rest.
Chart 6 provides greater insight by plotting food commodity prices, food fertiliser prices, euro area farm gate prices, the food producer price index and the food price level over 2021-2022. There were surges in food commodity prices and fertiliser prices during 2021 that have levelled out at high levels or partially reversed this year but that continue to pass through the food production chain with ongoing rises in farm gate prices, producer prices and consumer prices.[9]
Chart 6
Prices of food and food commodities
(index – Jan-2021 = 100)
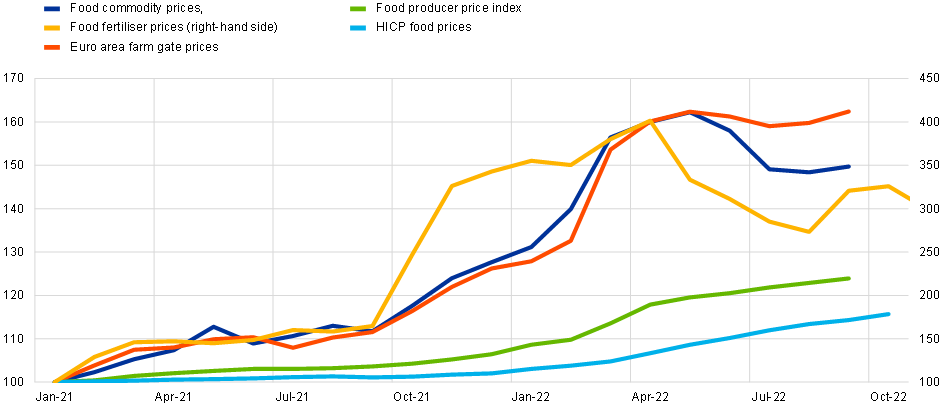
Sources: Eurostat, European Commission, HWWI, Bloomberg.
The latest observations are for November 2022 for fertiliser prices, October 2022 for HICP and fertiliser prices, food prices; September 2022 for the rest.
Chart 7 shows the euro area goods price level, the exported goods price level and the imported goods price level. The high correlations across export prices, import prices and domestic consumer prices for goods powerfully illustrates the central role played by global factors in determining the relative price of goods, both through the tradability of consumer goods but also through the tradability of the many commodities and intermediate products that are used in the production of consumer goods. The goods price index and the exported goods price index broadly track each other, which is consistent with even the prices of domestically-produced goods that are sold at home being influenced by global forces. The imported goods price index shows larger fluctuations, in part driven by swings in the exchange rates (see Chart 8). During 2020-2022, the prices of both imported and exported goods rose more quickly than the overall goods price index, suggesting that global price pressures were stronger than domestic price pressures.
Chart 7
(left: index: Dec-2004 = 100, right: index: Dec-2019 = 100)
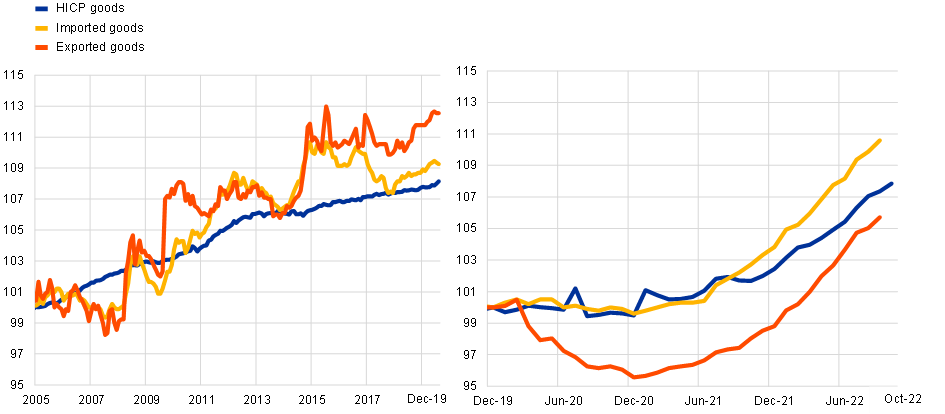
Sources: Eurostat.
Note: Seasonally adjusted data for HICP goods. HICP goods here only includes non-energy industrial goods (NEIG). Import and export prices refer to extra euro area trade and for non-food consumer goods. Seasonally adjusted data for imported goods prices and exported goods prices not available.
The latest observations are for October 2022 for HICP goods, September 2022 for the rest.
Chart 8
Exchange rates: EUR/USD and EUR nominal effective exchange rate
(left side: index – 1 January 1999=100 (left scale), USD per EUR (right scale); right side: index – 1 January 2020=100 (left scale), USD per EUR (right scale))

Sources: ECB and ECB staff calculations.
Notes: Nominal effective exchange rate (NEER) for the 42 largest trading partners.
The latest observations are for 8 November 2022.
Chart 9 shows unit labour costs and the price level for the services sector. The left panel underscores the dominant role of unit labour costs (wages relative to productivity) in determining cumulative price dynamics in the services sector.[10] Conceptually, this can be interpreted as supporting simple back-of-the-envelope models that, under typical conditions, set services prices as a stable markup over unit labour costs. However, the right panel shows that services inflation lagged somewhat unit labour cost inflation from 2020 until the second quarter of 2022. Services inflation subsequently accelerated during the third quarter of 2022: the evidence suggests that the services sectors that are more labour intensive still show subdued inflation rates that are broadly in line with the subdued pace of nominal wage increases. It follows that overall services inflation has been concentrated in those services sectors that are more intensive in non-labour inputs such as energy and food.
Chart 9
(left: index: 1998 Q4 = 100, right: 2019 Q4 = 100)
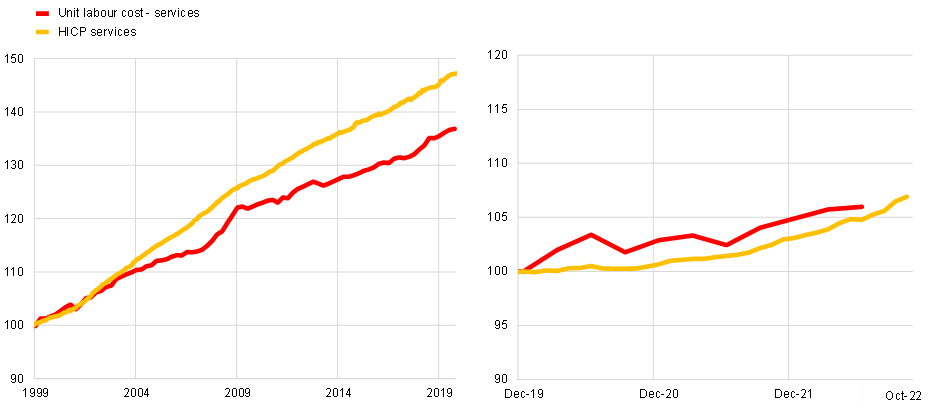
Sources: Eurostat.
Note: Seasonally adjusted data. Unit labour cost for services is calculated as the ratio of compensation per employee to labour productivity (per person).
The latest observations are for 2022 Q2 for unit labour costs and October 2022 for HICP services.
Taken together, Chart 2 to Chart 9 suggest that a combination of rising non-labour input costs and higher markups has been especially strong in generating inflation in food, goods and services sectors over 2021-2022. It seems clear that both the energy shock and the pandemic cycle (at both domestic and global levels) have exerted upward pressure on input costs and, in some categories, also facilitated an increase in markups.
Energy directly accounts for 5-10 per cent of total inputs in many sectors, with further indirect exposure via energy-intensive intermediate inputs. The dramatic increase in energy costs has required many firms to pass on these cost increases to consumers: the 60 per cent increase in the energy price level since the end of 2019 suggests a direct increase in overall costs of 3-6 per cent for many sectors, with additional cost increases operating through the rising prices of energy-intensive intermediate inputs.
In the goods sector, demand-supply mismatches were especially strong in 2020-2021 on account of the adverse impact of the pandemic on production and supply chains and the pandemic-related rotation of consumer expenditure towards the goods sector, which was facilitated by the growing role of ecommerce. In relation to markups, it is plausible that the net effect of the rapid recovery in the demand for services since March this year and the still-constrained supply capacity has provided an opportunity to raise markups.
Chart 10
Cumulative prices changes at inflation-category level since December 2019
(percentage change)

Sources: Eurostat and ECB staff calculations.
Notes: The chart shows the inflation rates of items in HICPX. Energy sensitive items are those with an above average share of energy costs in total costs (direct and indirect). These items account for 25% of overall HICPX.
The latest observations are for October 2022.
The following charts report a range of approaches in examining the roles of the energy sector and the pandemic cycle in driving the surge in inflation, even if each individual exercise necessarily can offer only a partial insight.
Chart 10 divides the goods and services categories into higher-intensity and lower-intensity users of energy inputs and shows the cumulative price increases since the end of 2019 for individual items in the two groups of higher- and lower-intensity users of energy inputs. The distribution of price increases for the higher-intensity group ranges from -14.9 per cent to 31.3 per cent and has median and mean values of 9.9 per cent and 9.7 per cent respectively.[11] The lower-intensity group ranges from minus 14.1 per cent to 21.6 per cent (excluding the outlier of repair of other personal effects at 45.6 per cent), with median and mean values of 6.0 per cent and 6.7 per cent. These differences across higher- and lower-intensity groups in the inflation distribution for goods and services powerfully illustrate the indirect impact of the surge in energy costs on the components of core inflation.
Chart 11 and Chart 12 extend this analysis by showing the overall contributions of higher-intensity and lower-intensity groups to the sectoral inflation rates for the goods and services sectors respectively: the overall contributions depend on the expenditure weight of each item as well as the scale of the individual price movements. Despite only accounting for 21 and 29 per cent of the goods and services sectors respectively, the high-intensity subsectors currently account for 47 and 52 per cent of inflation in the goods and services sectors respectively. Put another way, a full calculation of the impact of the energy shock on the overall inflation rate should include the indirect impact of higher energy input costs on the consumer prices of goods and services, including via the impact of higher energy costs on food inflation, since food is an important component in hospitality and related services categories.
All else equal, to the extent that the energy shock eventually levels off or even reverses, Chart 11 and Chart 12 suggest that contribution of energy cost shocks to goods and services inflation will diminish and, unless there are further waves of adverse energy shocks, should not constitute an open-ended source of higher inflation in the goods and services categories.
Chart 11
Goods inflation — decomposition into energy sensitive items
(annual percentage change and percentage point contributions)

Sources: Eurostat and ECB staff calculations.
Note: Goods here only includes non-energy industrial goods (NEIG). Energy sensitive component based on items with a share of energy in total (direct and indirect) costs above the average energy share across all NEIG items.
The latest observations are for October 2022.
Chart 12
Services inflation — decomposition into energy sensitive items
(annual percentage change and percentage point contributions)

Sources: Eurostat and ECB staff calculations.
Note: Energy sensitive component based on items with a share of energy in total (direct and indirect) costs above the average energy share across all services items.
The latest observations are for October 2022.
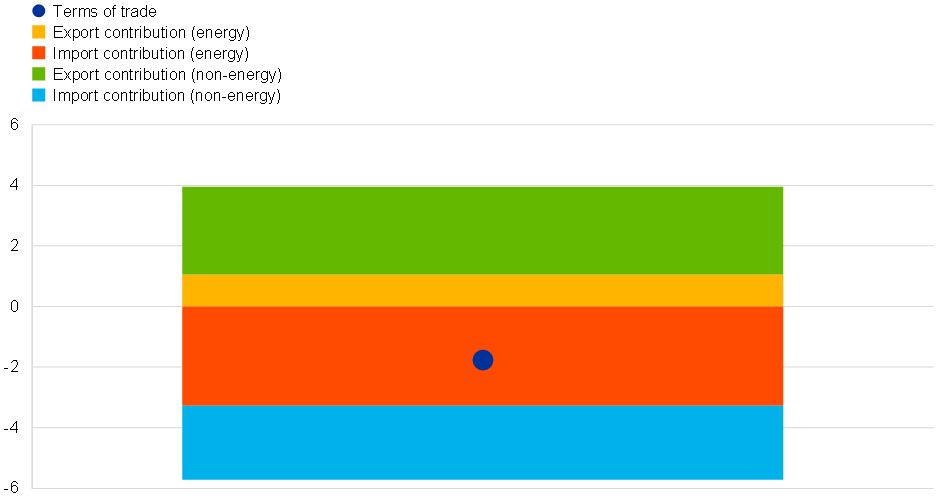
In addition to the direct and indirect impact of a surge in energy prices on inflation, it is also necessary to recognise the adverse income and wealth effects of rising energy import prices on aggregate demand, which is a primary driver of medium-term inflation dynamics. Since the euro area is a large-scale net energy importer, an increase in the relative price of energy does not just operate via domestic channels but also means a net outward income transfer to the countries supplying energy to the euro area. Such an adverse terms of trade movement affects inflation dynamics through a decline in real incomes. The larger and more persistent the terms of trade deterioration, the greater the decline in wealth via the reduced present value of future real incomes, with knock-on effects for asset pricing and consumption behaviour. The energy-related terms of trade sharply differentiates the current euro area and US situations, since the US is broadly balanced in its energy trade due to its large-scale domestic production of energy.
Chart 13 plots the cumulative shift in the terms of trade since the end of 2019 and Chart 14 shows the associated impact on real incomes. The income effect of rising energy import prices corresponds to about 3.3 per cent of GDP but the overall terms of trade net income effect is smaller at 1.8 per cent of GDP, since the euro area has also benefited from rising export prices and its strong net export position in goods and services. Still, a net income loss of 1.8 per cent of GDP is considerable compared to typical business fluctuations. Moreover, if the decline in the terms of trade were to be permanent, the present value of future net income losses would correspond to a substantial decline in the wealth of euro area residents. Furthermore, if energy prices in the euro area were to remain high relative to other regions, a competitiveness channel would also operate by which energy-intensive activities would relocate to cheaper external locations.
Chart 13
Terms of trade and price level deflators relative to GDP
(ratio)
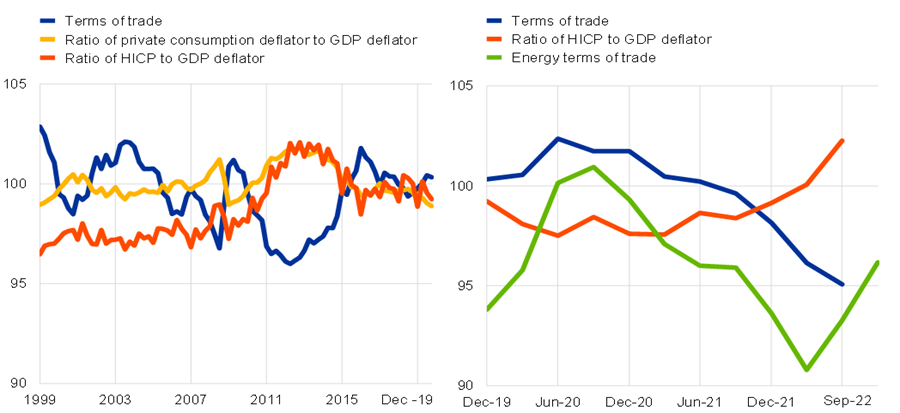
Sources: Eurostat and ECB calculations.
Notes: The terms of trade are expressed as the ratio between export and import deflators.
The latest observations are for September 2022.
Chart 14
Income effects of euro area terms of trade from Q4 2019 to Q2 2022
(ratio)
Source: ECB, Eurostat and ECB staff calculations.
Notes: The income effect of terms of trade is calculated by weighing export and import price changes by their respective value in the fourth quarter of 2019 and considered as a percentage share of GDP in the fourth quarter of 2019. The weights are computed based on extra-euro area trade flows and prices as obtained from the Eurostat national accounts. Due to data availability, Slovenia and Spain are not included in the euro area aggregate.
The ECB also monitors a domestic inflation indicator (HICP with low import contents only) (Chart 15). It excludes those items that have an import content higher than 18 per cent.[12] It comprises predominantly HICP services items, with some exceptions that are more exposed to external factors such as transport-related services, package holidays, postal services and cultural services. This indicator is useful in tracking domestic price pressures that might be obscured in the headline inflation data at times of large swings in globally-determined price components.[13]
The left panel of Chart 15 shows the negative drift in the domestic inflation index during the 2013-2019 period and the further decline during the initial phase of the pandemic in 2020. The right panel shows the steady upward movement in the domestic inflation rate index since the middle of 2021, which has accelerated during 2022 and now stands at 4.5 per cent. The increase in the domestic inflation rate index is disproportionately due to energy-intensive domestic sectors, which account for 55 per cent of the expenditure weights but 66 per cent of the current domestic inflation rate. Still, the increase in the domestic inflation index during the course of 2022 is also surely influenced by the surge in demand (relative to still-constrained supply) associated with the easing of pandemic restrictions and the re-opening of many services activities.
Chart 15
(annual percentage change and percentage point contributions)
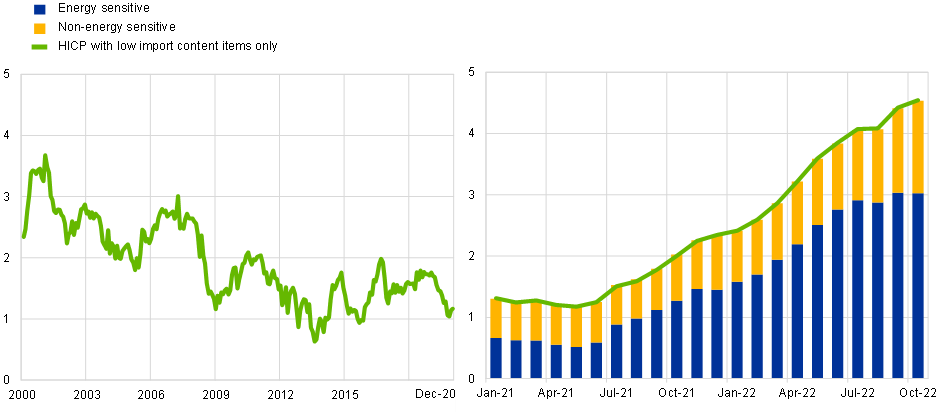
Sources: Eurostat and ECB staff calculations.
Note: Energy sensitive component based on items with a share of energy in total (direct and indirect) costs above the average energy share across all low import content items.
The latest observations are for October 2022.
Turning more generally to the supply and demand effects of the pandemic, the pandemic cycle has shaped inflation dynamics through several channels. Chart 16 shows the Oxford Stringency Index (OSI) since the start of the pandemic for the euro area. Chart 16 also includes the projected values of the OSI in the baseline, mild and severe scenarios in the initial ECB staff projections at the start of the pandemic.[14] Compared to these initial expectations, the pandemic ultimately generated a much longer high-stringency phase that lasted until early 2022, due to the repeated waves of high-infection periods and the limited contribution of vaccinations to reducing the infection rate.[15] The high-stringency phase both limited production capacity and inhibited aggregate consumption and investment. In addition to domestic supply interruptions, the public health policies to address the pandemic around the world (especially in China) restricted international mobility and generated similar problems in relation to global production capacity and the operation of global supply chains. The high-stringency phase was also especially devastating for international tourism.
Chart 16
Oxford stringency index: realised compared to May 2020 expectations
(max stringency = 100)
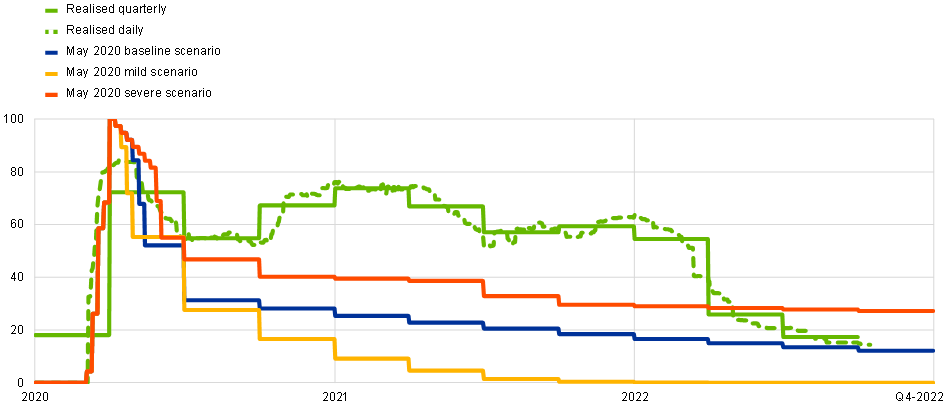
Sources: Oxford university, ECB calculations.
The euro area Oxford Stringency Index is a population-weighted average of the same index available for 18 euro area countries. See Battistini, N. and Stoevsky, G., “Alternative scenarios for the impact of the COVID-19 pandemic on economic activity in the euro area”, ECB Economic Bulletin Issue 3, 2020.
The latest observations are for Q4 2022. Realised daily stops on 15 October 2022, realised quarterly in Q3 2022.
Chart 17 shows indicators of supply bottlenecks. These can be understood to reflect a combination of supply interruptions and a faster-than-expected recovery in global demand for tradable goods and commodities. The left panel identifies the short-lived spike in supply bottlenecks at the very start of the pandemic, the sustained deterioration in bottlenecks between summer 2020 and late 2021 and the sustained easing during 2022, albeit with bottleneck measures still remaining at elevated levels compared to pre-pandemic values. The decomposition in the right panel underlines that both supply and demand factors contributed to the worsening in bottlenecks during 2020-2021, whereas the improvement during 2022 has been largely due to the easing of supply constraints. While the improvement in supply bottlenecks can be expected to remove one source of upward pressure on prices, it is not yet clear whether the upward impact of earlier supply chain problems on final consumer prices has fully played out. The role of container shipping in generating the pandemic-bottlenecks remains an open analytical issue.
Chart 17
(left: standard deviations; right: diffusion index in deviation from trend)

Sources: Federal Reserve Bank of New York (NYFED), S&P Global, Harper Petersen (HARPEX) shipping cost index, European Commission, Eurostat and ECB calculations.
Notes: The common component in the left-hand side panel is computed using a dynamic factor model analysis on a range of supply bottlenecks indicators (see “Supply chain bottlenecks in the euro area and the United States: where do we stand?”, Economic Bulletin, Issue 2/2022). The SVAR model in the right-hand side panel shows the contribution of aggregate demand (due to demand and interest rate shocks) and aggregate supply (due to supply-chain disruption, energy and other cost-push shocks) forces (see also De Santis, Economic Bulletin, Issue 8/2021). The model is identified using sign and narrative restrictions as in Antolín‑Díaz, J. and Rubio-Ramírez, J.F., “Narrative Sign Restrictions for SVARs”, American Economic Review, Vol. 108, No 10, 2018, pp. 2802‑2829.
The latest observations are for October 2022.
On the demand side, both in the euro area and globally, there was also a strong rotation from services (due to the limited capacity to consume contact-intensive services) towards goods (that could be consumed at home and also that facilitated working from home) during the high-stringency phase. Although earlier waves of re-opening temporarily raised services consumption, it was only with the wide-ranging re-opening of the euro area economy in early 2022 that there was a larger-scale recovery in overall consumption and in the normalisation of the composition of consumption between services and goods.
Chart 18 shows the dynamics of OECD (excluding the euro area) and euro area consumption and output. Driven by the more rapid recovery and pandemic reopening (together with exceptionally high fiscal support) in the United States, OECD output and consumption had already recovered to pre-pandemic levels by the middle of 2021, with the speed of recovery in consumption outstripping output. In contrast, while euro area output also recovered to pre-pandemic levels in autumn 2021, there was a pause in the recovery at the end of 2021 and in early 2022 due to the spread of the Omicron variant and the associated set of restrictions. Moreover, the recovery in euro area consumption lagged behind the recovery in output and remains below the pre-pandemic level. The middle and right panels show the expenditure rotation towards durables during 2020 and the early part of 2021 in both the US and the euro area: however, the scale of the increase in durables expenditure was far higher in the US and has remained well above the pre-pandemic level, whereas durables expenditure in the euro area fell back below the pre-pandemic level from the beginning of 2021 onwards.
Chart 18
Real GDP and consumption: OECD, US and euro area
(index: 2019Q4 = 100)
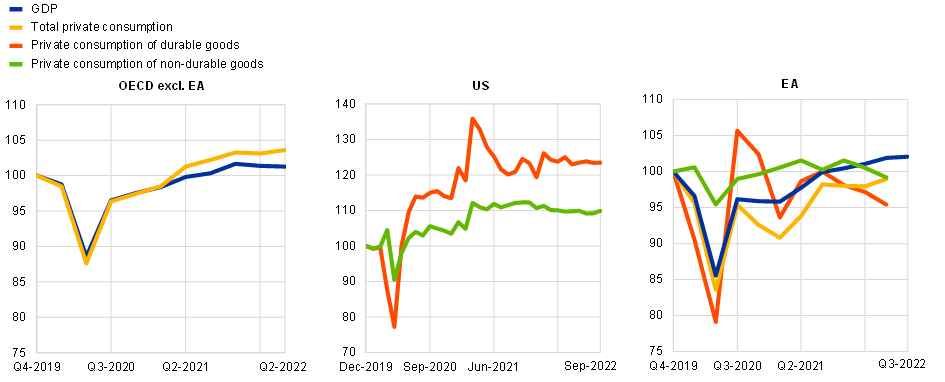
Sources: Eurostat, OECD and ECB staff calculations.
The latest observations are for September 2022 for US durable and non-durable goods, Q3 2022 for EA GDP, Q2 2022 for the other series.
The interaction of strong global recovery in goods demand in 2021 and pandemic-related global supply interruptions combined to generate an ongoing increase in goods inflation, with earlier cost increases and supply shortages in intermediate stages of production still contributing to increases in final goods prices today. A qualitatively similar narrative holds for services but the higher domestic share in services and the smaller role played by globally-tradable intermediate inputs has meant that the increase in inflation in the services sector has been less pronounced and later than in the goods sector.
In Chart 19 to Chart 23, I report a series of analytical decompositions that attribute the shifts in sectoral price levels to underlying supply and demand factors.
In terms of the underlying drivers of energy prices, Chart 19 shows the decomposition between supply, demand and risk factors for the oil price: it shows that the oil price in the early stages of the pandemic was largely driven by the drop in demand, whereas supply restrictions account for most of the rise in oil prices since the middle of 2021. The left panel of Chart 20 shows the drastic movements in gas prices since the beginning of 2021. Although spot gas prices have declined since the August peak, forward prices indicate that gas prices are expected to remain far above pre-2021 levels at least for the next couple of years. The right panel of Chart 20 documents the role of supply restrictions in the re-pricing of gas: it shows the overall decline in gas supplies to the EU, even if there has been partial compensation of lower Russian supplies with a higher contribution from other producers and from global LNG supplies. The elevated level of forward prices in the left panel is in part due to concerns that the supply of gas in 2023 will decline further, due to the full rollout of sanctions on Russian gas and the limited global capacity to offer alternative supply sources.
Chart 19
Oil price decomposition: supply, demand and risk factors
(Daily cumulated percentage change since 31/12/2019)
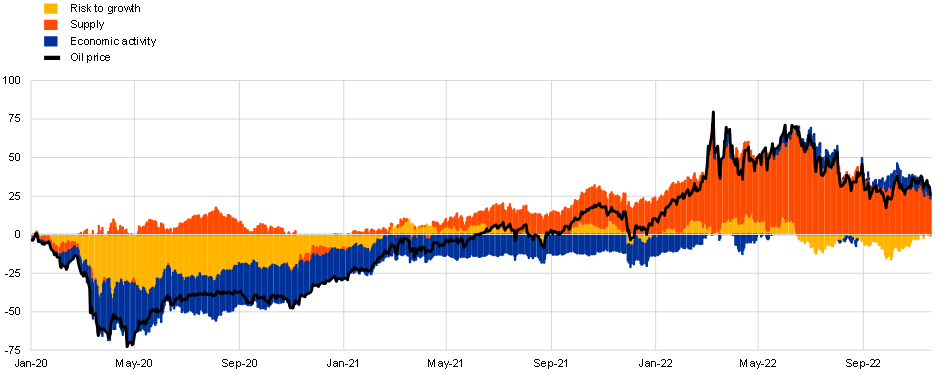
Sources: Refinitiv and ECB staff calculations.
Notes: Structural shocks are estimated using the spot price, futures to spot spread, markets expectations on oil price volatility and a stock price index.
The latest observations are for 18 November 2022.
Chart 20
(left panel: EUR per MWh, right panel: million cubic meters per day)
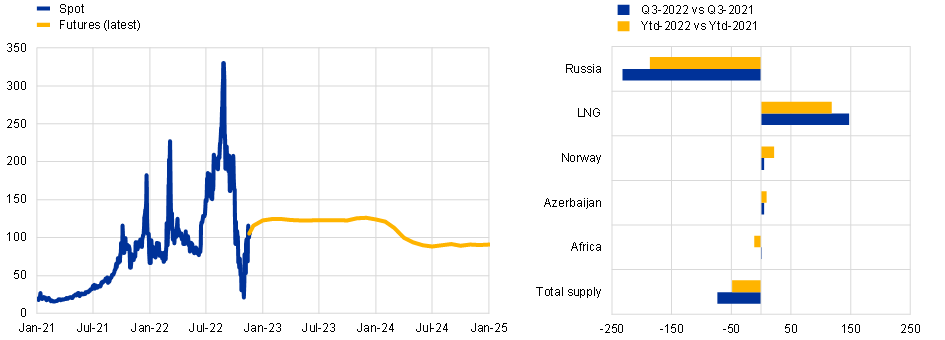
Sources: Refinitiv, Bloomberg and ECB staff calculations.
Notes: Ytd stands for year to date. Quarterly gas flows are computed by taking the average over all daily flows in a given quarter. LNG including from Russia.
Drawing on the granular method developed by Shapiro (2022), Chart 21 and Chart 22 show supply-demand decompositions for goods inflation and services inflation respectively.[16] In the goods sector, the supply factor has continued to increase throughout 2022 – reflecting both ongoing supply-side constraints but also the lagged impact of previous cost increases at earlier stages in the production process. However, the demand factor has also steadily increased since mid-2021.
Allocating the “ambiguous” component on a pro-rated basis, the 5.1 per cent non-energy industrial goods inflation rate in August 2022 could be attributed 60-40 to supply and demand factors, respectively. In the services sector, the 3.8 per cent services inflation rate in August 2022 could be attributed to 30-70 to supply and demand factors respectively. In this decomposition, the gap in inflation rates between goods and services sectors in August 2022 was entirely driven by the different exposures to supply shocks: the demand component was essentially similar in both sectors. The demand-side contribution to inflation during summer 2022 can be linked to the re-opening of contact-intensive services sectors, including a surge in tourism that outstripped industry expectations.
To the extent that sectoral demand-supply mismatches and the associated sectoral price increases induce resource reallocations over time, maintaining the same level of demand on an ongoing basis should be associated with less pricing pressure. This is the kernel of the pandemic re-opening effect: after a long period of low activity levels, firms in contact-intensive sectors faced an array of supply interruptions, while there was considerable pent-up demand in these sectors. With post-pandemic normalisation, supply conditions should improve and demand levels fall back, easing pricing pressures. The working through of the accumulated backlog of queued orders in the goods sector constitutes another dimension of post-pandemic normalisation: once completed, firms in this sector will be more reliant on current demand, rather than past demand, to maintain activity levels.
Chart 21
Goods inflation — decomposition into supply and demand-driven contributions
(annual percentage change and percentage point contributions)
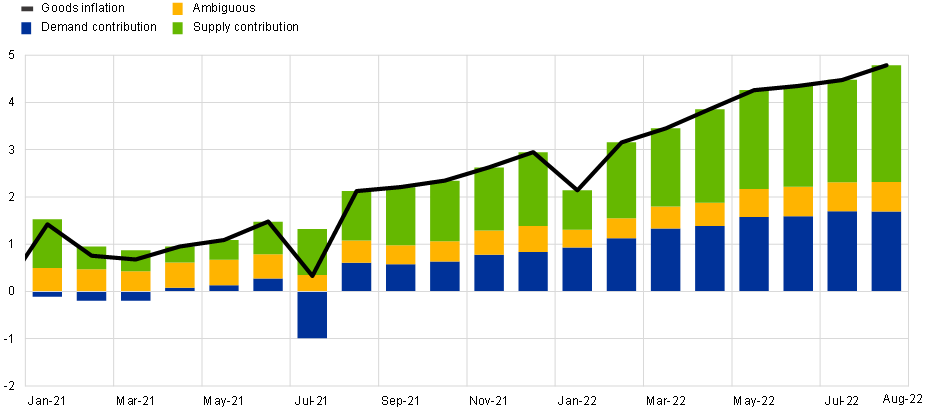
Sources: Eurostat and ECB staff calculations.
Notes: Goods inflation here only includes non-energy industrial goods (NEIG). Seasonally adjusted data. Based on Shapiro, A.H. (2022). Goods inflation is the sum of demand-driven, supply-driven and ambiguous components, calculated as the trailing sum of the last 12 monthly contributions. While price data are available for October 2022, the latest observation is for August 2022 as the turnover series used as a proxy for activity are published with some delay.
Chart 22
Services inflation — decomposition into supply and demand-driven contributions
(annual percentage change and percentage point contributions)
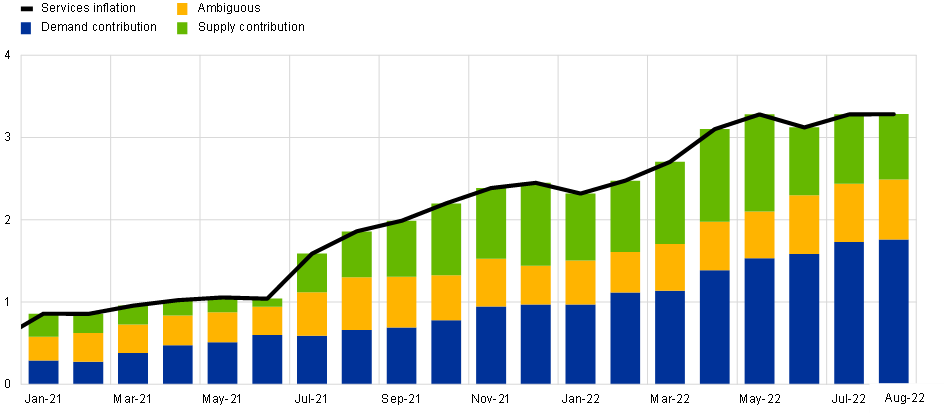
Sources: Eurostat and ECB staff calculations.
Notes: Seasonally adjusted data. Based on Shapiro, A.H. (2022). Services inflation is the sum of demand-driven, supply-driven and ambiguous components, calculated as the trailing sum of the last 12 monthly contributions. While price data are available for October 2022, the latest observation is for August 2022 as the turnover series used as a proxy for activity are published with some delay.
An alternative decomposition for the services sector is shown in Chart 23. This decomposition divides the services sector into four sub-categories: (a) sectors that are both contact-intensive and energy-intensive (26.8 per cent of total services expenditure); (b) sectors that are contact-intensive but not energy-intensive (12.6 per cent of total services expenditure); (c) sectors that energy-intensive but not contact-intensive (9.1 per cent of total services expenditure); and (d) sectors that are neither contact-intensive nor energy intensive (51.5 per cent of total services expenditure). We should expect the combined impact of the pandemic cycle and the energy shock to be strongest in category (a) and weakest in category (d).
Indeed, we see that the contribution from category (d) has been broadly constant, while the contribution from category (a) has gone from about zero in the middle of 2021 to about two percentage points of services inflation in September 2022. That is, about half of services inflation is being generated by a category that accounts for 30 per cent of services expenditure.
Chart 23
Services inflation — decomposition into contact intensive and energy sensitive items
(annual percentage change and percentage point contributions)
Sources: Eurostat and ECB staff calculations.
Note: Energy sensitive component based on items with a share of energy in total (direct and indirect) costs above the average energy share across all services items. The latest observations are for October 2022.
This section has highlighted that the current high inflation rate has been largely driven by the direct and indirect effects of the energy shock, together with the impact of the pandemic cycle on supply and demand dynamics. In relation to core inflation, the supply element of the pandemic cycle has had a larger impact on the goods sector while the recovery in demand is contributing to rising prices of both goods and services.
To the extent that the energy cost shock and the pandemic cycle shocks are ultimately price level shocks, these can be expected to fade out of the inflation data. In terms of the medium-term inflation outlook, it is essential to focus on the persistent component of inflation, together with the evolution of inflation expectations. In the next section, I analyse the information content of measures of underlying inflation in relation to the persistence of inflation over the near term and medium term.
Underlying inflation
Central banks monitor measures of underlying inflation in order to distinguish signal from noise in the data. Headline inflation is noisy since it is affected by the short-term volatility induced by temporary idiosyncratic shocks, thereby blurring the signal about medium-term inflationary pressure that is relevant for monetary policy.
Underlying inflation measures help to look through this noise. In general, the purpose of an underlying inflation measure is to obtain an estimate of where headline inflation will settle in the medium term after temporary factors have vanished. This is conceptually akin to estimating the evolution of the (unobservable) persistent component of headline inflation. Operationally, this estimation can be performed at various levels of statistical complexity. This ranges from a priori exclusions of some components of headline inflation on account of their volatility to the running of complex statistical models that exploit the cross-sectional variation of inflation components.
The ECB tracks several indicators of underlying inflation. Each indicator has its advantages and disadvantages and monitoring a range of indicators helps to guard against uncertainty from any specific approach. Our experience has been that the accuracy of individual indicators can be episodic and none of them is superior in all situations: there is no short cut by which a single indicator can be relied upon to deliver a simple narrative about the behaviour of underlying inflation.[17]
Chart 24 plots headline inflation, the range of underlying inflation indicators and also the projected inflation rate over 2023-2024 from a range of sources (including the September staff projections exercise). The current large increase in HICP inflation has been accompanied by a surge in all measures of underlying inflation. The range of underlying inflation indicators was between zero and four per cent between the start of the monetary union and 2020; since 2021, all indicators have increased strongly to a range of four per cent to eight and half per cent in October 2022. In terms of current projections of the future path of inflation (across a range of sources), the range of underlying inflation measures broadly leads the range of projected inflation rates over the next two or three quarters. Accordingly, the underlying inflation measures seem to capture the near-term persistent component of inflation dynamics.
However, it is striking that the projected inflation rates further out in the projection horizon in late 2023 and all of 2024 fall below the range of underlying inflation measures: it seems that there is a disconnect between the headline inflation measures and the medium-term persistent component of inflation dynamics.
Chart 24
Headline inflation, measures of underlying inflation, and inflation projections and expectations
(annual percentage changes)

Sources: Eurostat and ECB calculations.
The latest observations are for October 2022 for HICP the range of measures of underlying inflation. The latest observations for market-based indicators of inflation compensation are for 14 November 2022. The SPF data shows expected annual percentage changes for the year 2022, 2023 and 2024. The Survey of Monetary Analysts and the September 2022 ECB staff projections show quarterly forecasts. The cut-off date for data included in the ECB staff macroeconomic projections was 25 August 2022.
Chart 25 underlines that the current situation is quite atypical. There is usually broad alignment between current measures of underlying inflation and the medium-term inflation projection (as proxied by the end-of-horizon projected inflation rate): the 2022 values are outliers compared to this typical profile, with high readings for underlying inflation that are not matched by similarly-high readings for end-of-horizon projected inflation.
Chart 25
Mean of underlying inflation measures and end-of-horizon inflation projection
(annual percentage changes)

Sources: Eurostat and ECB staff calculations.
The latest observations are for 2022Q3.
These patterns can be reconciled by allowing for the impact of the energy shock and the pandemic cycle on the various measures of underlying inflation. The measures of underlying inflation can be divided into three broad categories: permanent exclusion measures; temporary exclusion measures; and model-based measures.
Permanent exclusion-based measures are based on the permanent removal of certain volatile sub-components. The most prominent indicator in this category is the core inflation indicator defined as the HICP excluding energy and food (HICPX) (Chart 26). Energy and food inflation items are excluded, since these are more volatile and more frequently influenced by idiosyncratic shocks (for example, due to swings in the oil price or the impact of unusual weather conditions on food commodity prices). We also monitor an indicator which additionally excludes travel-related items and clothing (HICPXX). These categories are highly volatile due to factors such as the timing of holidays or sales periods that can change from year to year.
Chart 26
(annual percentage changes)
Sources: Eurostat and ECB staff calculations.
The latest observations are for October 2022.
The left panel of Chart 26 shows that core inflation averaged 1.3 per cent between 1999 and 2019, declining from an average of 1.4 per cent over the period 1999-2013 to 0.8 per cent over the period 2014-2019. As is shown in the right panel, core inflation has climbed steadily since early 2021 and now stands at 5.0 per cent, while the narrower HICPXX measure stands at 4.7 per cent.
As documented in the previous section, it is important to take into account that the HICPX and HICPXX measures include the indirect effects of energy inflation and food inflation on the cost structures of other sectors, while pandemic re-opening effects may have caused inflation to increase temporarily in contact-intensive sectors. For example, energy is a major input into the production of transport services (4 per cent of overall services), while both energy and food are major inputs into hotel services (4 per cent) and restaurant services (14 per cent). More generally, the retail prices of goods include the costs of distributing goods from the production location (whether domestic or overseas) to the shop floor or to the final consumer and these distribution activities are highly energy intensive.
In general, the advantage of permanent exclusion-based measures is that these are easy to replicate and communicate to the public. However, these are imperfect measures of the persistent and common component of inflation because, despite the exclusions, these may still be influenced by substantial transitory effects. The idea behind permanent exclusion-based indicators is that the categories which are both highly volatile and less persistent are excluded, while the categories that are less volatile and more persistent are retained. However, two problems arise.[18] First, highly-volatile sectors may also be subject to persistent shocks: recall that Chart 2 showed that there has been a positive trend in the relative price of energy, in addition to its high volatility. Second, some categories may exhibit low volatility and high persistence under typical conditions but can be hit by high-volatility and low-persistence shocks under atypical circumstances. The impact of pandemic-related supply-demand mismatches on the relative prices of goods and contact-intensive sectors constitutes a prime example of such atypical conditions.
Temporary exclusion-based measures are based on the removal of certain items that are not considered relevant at a certain point in time for the permanent and common component of inflation. The set of excluded items is adjusted over time according to a set of criteria.
Two such indicators of underlying inflation are the 10% and the 30% trimmed means (Chart 27). The 10% trimmed mean removes 5% of the annual rates of change from each tail of the distribution of 93 price changes in the HICP each month and aggregates the annual rates of change using rescaled weights; the 30% trimmed mean removes 15% from each tail. A 10% trimmed mean may not always be sufficiently robust to outliers, while a 30% trimmed mean may be too crude during less volatile periods, possibly omitting rates of change that are relatively high or low but nonetheless persistent. In most cases these indicators exclude many of the energy and food items since their prices are more volatile than those of goods and services and are often at the outer ends of the distribution. Such measures can be useful when the price developments of some items constitute strong outliers. By abstracting from large one-off price changes in items that are typically non-volatile, these measures can give an indication of how broad-based is the inflation dynamic. However, these may exclude items that turn out to be more persistent and are less straightforward to interpret than the indicators in the previous group.
Chart 27 shows the 10% and 30% trimmed mean indicators give readings of about 7 per cent and 8 per cent respectively in September 2022. These are the highest values within the range of underlying inflation measures and demonstrate that inflation is currently very broad based, with inflation rising in many sectors. This reflects the widespread impact of the energy shock: the extraordinary scale of the energy price level increase is pushing up costs across many food, goods and services sectors such that it constitutes a common factor that is exerting inflationary pressure across the economy. It also reflects the broad contribution of the pandemic-related shock in generating supply-related inflation, especially in the goods sector, and demand-related inflation across the economy.
It is important to distinguish the broad nature of these shocks from their likely persistence. It follows that it is not obvious that the strong signal from the trimmed measures that inflation pressures are currently broad in scope translates into a similar signal that inflation pressures are necessarily persistent to the same degree. In particular, the scale of the cost shocks may have caused many firms to deviate from standard re-pricing calendars and look to pass through the cost shocks into prices more quickly. This could translate into a more intense but shorter-lived inflation surge.[19]
Chart 27
(annual percentage changes)
Sources: Eurostat and ECB staff calculations.
The latest observations are for October 2022.
The third group of underlying inflation measures that is monitored at the ECB is the set of model-based measures. The general idea behind these measures is that each sub-item of consumer prices may be driven by both transitory and persistent shocks. Therefore, rather than excluding some items a priori, it may be more appropriate to filter out the transitory component using econometric techniques and retain the persistent component(s) of all items. Measures in this group are the PCCI (Persistent and Common Component of Inflation) indices and the Supercore index (Chart 28).
Chart 28
Supercore, PCCI and PCCI excluding energy
(annual percentage changes)
Sources: Eurostat and ECB staff calculations.
The latest observations are for October 2022.
The PCCI is derived from a dynamic factor model based on the full 93 HICP items from each of 12 countries. It filters out and averages the medium-term component of the HICP components of individual euro area countries. The main advantage of the PCCI compared to exclusion measures, such as HICPX, is that the PCCI also includes the impact of medium-term shocks affecting food and energy, to the extent that these have common effects, while it excludes short-term fluctuations in prices that are considered as core elements in the traditional exclusion measures (such as services prices). The main disadvantage of the PCCI is that it presents challenges in interpretation, being based on a rather complex econometric model with many layers of filtering and averaging. The ECB also calculates an alternative PCCI that excludes energy: the full dynamic factor model that is run to calculate the persistent and common components of the other items includes the information from energy items, but the energy items are not included in the aggregated index.[20]
Based on the conjecture that the domestic business cycle is the main macroeconomic driver of the medium-term inflation path, the Supercore measure picks out those items of HICPX that are estimated to co-move with the business cycle, as measured by the sensitivity of the item to the output gap. An item is assessed as being sensitive to the output gap if the inclusion of the output gap improves the out-of-sample forecast performance for that item relative to an AR(1) model.
Overall, the main property of these model-based measures is that these have a solid conceptual basis in economic theory. Their flexibility allows for revisions over time. For example, in case of the Supercore measure, the revision of the output gap can lead to revisions of the items included.[21] However, there is a degree of measurement risk associated with real-time measures of the output-gap, and there are communication challenges, as explained above.[22]
The left panel of Chart 28 shows that these measures were persistently well below two per cent during the 2013-2019 period and that the Supercore measure further declined during the first year of the pandemic cycle in 2020. The right panel shows that each of these measures has shifted upwards, surpassing two per cent in the course of 2021(although remaining below the levels of the trimmed mean measures), even if the PCCI and PCCI excluding energy measures have levelled out in recent months.
However, these model-based measures are subject to the same caveats as the other measures of underlying inflation: recent price increases may include level adjustments in response to the scale of the energy shock and the one-off nature of the pandemic cycle, even for those items that typically exhibit persistence in inflation dynamics and those items that are sensitive to the domestic business cycle.
Overall, the impact of price level adjustments driven by the energy shock and the pandemic cycle suggests that, under current conditions, the set of measures of underlying inflation might not be fully informative about the medium-term persistent component in inflation dynamics. However, this critique may not hold to the same degree in relation to nominal wage growth, which is a very important driver of medium-term inflation. We turn to the inter-connections between wage inflation and price inflation in the next section.
Wage inflation and price inflation
The importance of labour costs in total costs in many sectors (especially in the services category) means that wage inflation is deeply inter-connected with price inflation. Furthermore, the staggered, infrequent and decentralised nature of wage setting means that it is likely to take several years for wages to adjust fully to the terms of trade shock and to the surprise price inflation that has already occurred. In this way, the wage adjustment process may put upward pressure on price inflation over the next two or three years, even if the long-term behaviour of wages were ultimately unaffected by the current inflation shock (with the stability of long-term inflation expectations and aligned long-term wage dynamics reinforcing each other). That is to say, once the equilibrium level of real wages has been attained after the wage catch up phase, we might expect nominal wages to grow at the rate corresponding to the sum of labour productivity growth and the two per cent inflation target.
Two basic indicators for the assessment of wage growth in the euro area are the growth rates of compensation per employee and compensation per hour. The former reflects the labour costs payable by employers – including wages, salaries and social contributions – expressed as an average per employee, while the latter takes the average per hour worked by employees. These backward-looking quarterly indicators are published with a considerable lag of more than two months: the most recent data are for the second quarter of 2022.
Chart 29 shows the drop in real wages that has occurred over the period 2021-2022 according to these indicators. At a mechanical level, this reflects lower nominal wage increases compared to the scale of price inflation over this period. In turn, this can largely be attributed to the unexpected and sudden nature of the increase in inflation. At the same time, the adverse decline in terms of trade means that aggregate real incomes have decreased (in the sense that the same level of production can no longer finance the same expenditure basket, in view of the rising relative price of imports compared to exports).
This real income loss has its counterpart in some combination of declining labour income and declining profits. It follows that the appropriate speed and scale of the catch up adjustment process that is needed to improve real wage levels must strike a delicate balance between improving the living standards of workers (and thereby also raising aggregate demand in the economy) and ensuring that the sustainable level of employment is not threatened by a failure to adjust to the terms of trade shock (especially if the terms of trade shock turns out to be permanent in nature).
Chart 29
Nominal and real wage growth (consumer wages)
(index: Q4 2020 = 100)
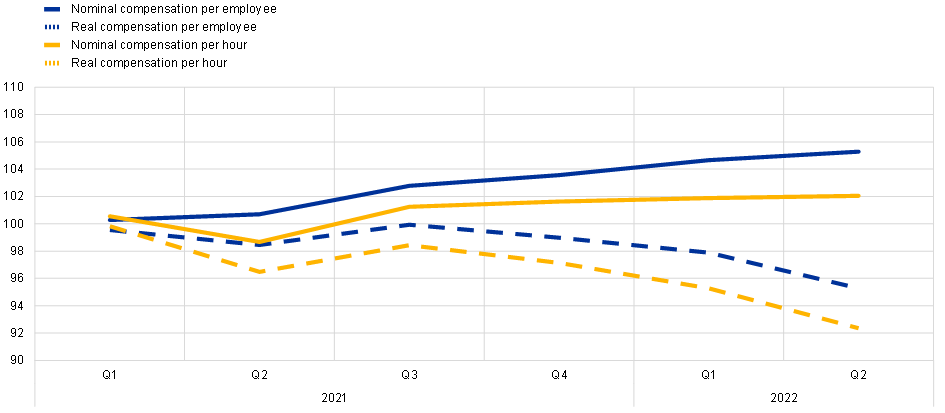
Sources: Eurostat and ECB staff calculations.
Notes: Real compensation per employee and per hour are calculated using HICP (consumer wages).
The latest observations are for the second quarter of 2022.
These wage growth indicators are based on the quarterly national accounts and their broad, representative nature comes at the cost of only being available with a considerable lag. We now turn to a set of ancillary wage measures. The ECB tracks an indicator of the growth rate of negotiated wage rates, which captures the outcome of collective bargaining processes. The advantage of this indicator is that it is published around one month earlier than the wage indicators that are based on quarterly national accounts. In addition, during the pandemic crisis, it was not affected by statistical distortions due to the introduction of the job retention schemes.
However, there are some caveats. First, the indicator does not cover all euro area countries, and the methodology is not fully harmonised across the countries for which negotiated wage series are available. Second, negotiated wage growth tends to react to changes in labour market conditions with a lag of several quarters and, in a crisis, generally more slowly than compensation per employee, for example, as agreements are signed for a year or more. Finally, the negotiated wage growth measure is also a backward-looking indicator, since it reflects the actual wages paid in a given period rather than taking into account information on scheduled future pay increases.[23]
Headline wage growth, as measured by compensation per employee, can be broken down into negotiated wage growth, wage drift and the contribution of changes in social security contributions. Wage drift is calculated as the difference between the growth rates of gross wages and salaries per employee and the growth rates of negotiated wages.[24] Aggregate wage drift is closely linked to cyclical developments in the labour market. For example, in a tightening labour market, employers might be compelled to offer pay scales that are higher than those under collective agreements, to promote employees to higher bands within collectively-agreed pay scales, or simply to pay bonuses on top of agreed wages as a way to reward and retain employees. When the unemployment rate is high, however, paid overtime and bonuses are cut back and wage drift declines. When calculated in this way, wage drift also picks up shifts in an economy’s employment structure, to the extent to which companies are bound by collective agreements and in average hours worked per person. It follows that wage drift reflects a combination of factors rather than being a pure index of pay premia.[25]
Finally, unit labour costs are a measure of total labour costs per unit of output calculated as the ratio of compensation per employee to labour productivity. It is a useful indicator of the pressure on firms to change prices as a result of developments in the labour market. If changes in the cost of labour are accompanied by similar changes in productivity, unit labour costs remain constant. However, if wage costs outpace productivity, unit labour costs rise and put upward pressure on pricing decisions.
Chart 30 shows the behaviour of negotiated wages since the beginning of 2021. There was a steady but quite contained increase in this series through the second quarter of 2022, with the latest values of annual growth rate around two and a half per cent. Allowing for typical labour productivity growth of about one per cent per year, a nominal wage growth of three per cent per year would be broadly aligned with delivering our two per cent medium-term inflation target.
Chart 30
Negotiated wage growth and nominal wage growth in job postings
(annual percentage changes)
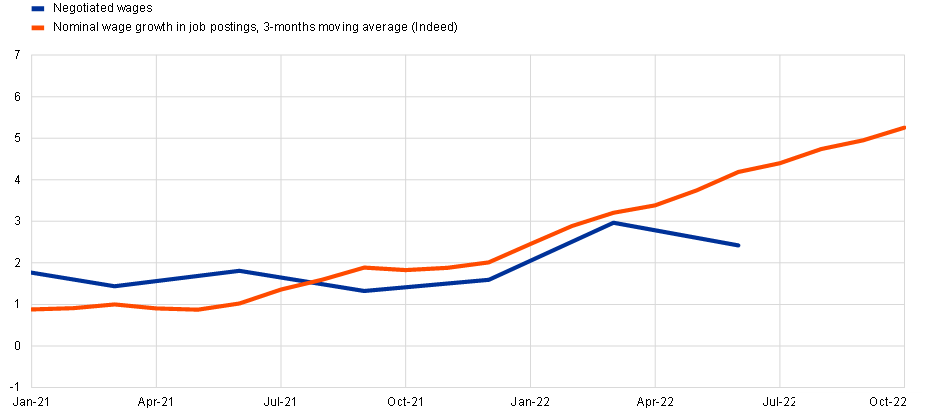
Sources: ECB, Indeed and ECB calculations.
Notes: Data on nominal wage growth in job postings (Indeed – 3 months MA) is presented at monthly frequency and covers six euro area countries (DE, ES, FR, IE, IT and NL) and is based on “Wage growth in euro area countries: evidence from job ads” – P. Adrjan & R. Lydon, Economic Letter, Central Bank of Ireland, Vol 2022, No. 7. Indeed data are shown at monthly, negotiated wages at quarterly frequency.
The latest observations are for 2022 Q2 for negotiated wages, and October 2022 for Indeed data (reflecting data up to mid-October).
However, there are two indicators that suggest that the negotiated wage indicator understates the current degree of nominal wage momentum. First, Chart 30 also includes the wage growth tracker based on Indeed job postings data that has been developed by Adrjan and Lydon (2022).[26] These data are more timely (extending until October) and reflect the pay offered to the marginal worker (a new hire). At the same time, it should be recognised that, in a tight labour market, hiring wages are likely to outpace the wages offered to existing workers such that the level of the wage growth tracker is not necessarily an indicator of the expected future level of aggregate growth in negotiated wages. Rather, it is more likely to serve as a leading indicator of the momentum in wage dynamics. For instance, the earlier pickup in the wage growth tracker since summer 2021 foreshadowed the subsequent pickup in the negotiated wage growth measure and the strong increases in the wage tracker indicator during 2022 suggest that there will be further increases in the growth rate of overall negotiated wages.
Chart 31
Experimental forward-looking tracker of negotiated wage growth in the euro area
(annual percentage changes)
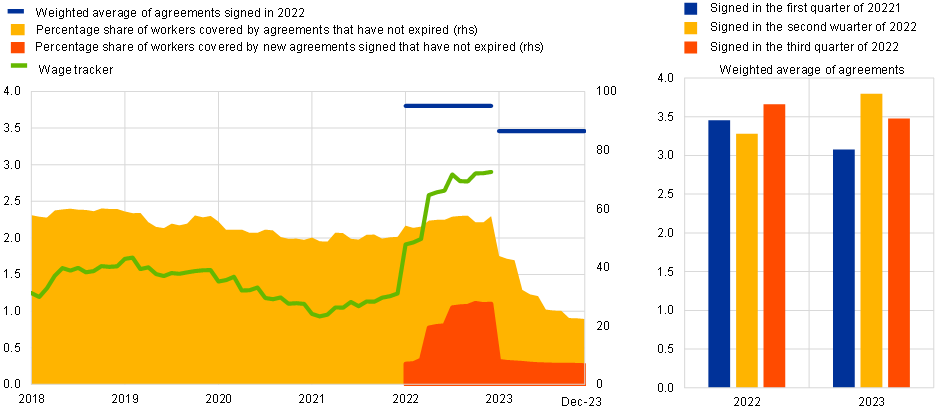
Sources: Bundesbank, Banco de España, the Dutch employer association AWVN, Banca d’Italia, Banque de France, Bank of Greece, Oesterreichische Nationalbank and ECB calculations.
Note: The euro area aggregate is based on data from Germany, France, Italy, Spain, the Netherland, Austria and Greece. Weighted average of agreements signed in 2022 is without FR for 2023.
The latest observations are for October 2022 for DE, ES, NL and September 2022 for IT, AT, GR, FR. .
A broader forward-looking experimental tracker of negotiated wage growth is developed by the ECB in cooperation with national central banks.[27] This wage tracker aggregates information from collective bargaining agreements across euro area countries and includes information on latest wage increases that have been agreed for 2022 and, for multi-year contracts, for 2023.[28] Chart 31 shows that contract negotiations during 2022 have typically delivered a 3.8 per cent wage increase for 2022 and a 3.5 per cent increase for 2023. During the course of the year, the wage increases agreed for 2023 have shifted upwards and stood at higher levels in Q2 and Q3 than in Q1. This suggests that nominal negotiated wage growth is set to be higher next year compared to the level that would in the medium term be consistent with the two per cent overall inflation target.
In view of these developments, the September 2022 ECB staff projections were based on an assessment that compensation per employee will grow by 4.0 per cent in 2022, 4.8 per cent in 2023 and 4.0 per cent in 2024 and unit labour costs by 2.8, 4.1 and 2.2 per cent, respectively.[29] These higher-than-normal nominal wage increases largely reflect the catch up process following the drop in real wages that has occurred since the middle of 2021.
These wage projections are also influenced by the cyclically-tight condition of the euro area labour market. The Beveridge Curve plotted in Chart 32 shows that unemployment is currently low and vacancies high compared to historical norms. Under these labour market conditions, stronger wage increases can be expected. In view of the close (albeit lagged) connection between aggregate labour demand and the overall level of economic activity, whether these tight labour market conditions will persist will be heavily influenced by the evolution of the economic outlook. It is plausible that the relatively-high vacancy rate is connected to re-allocation churn across sectors (with contact-intensive sectors looking to rebuild its workforce): as the economy normalises, churn-related vacancies may ease back. Finally, the recent uptick in net immigration is now adding to labour supply, especially in relation to those sectors that have traditionally relied on an international workforce.
Chart 32
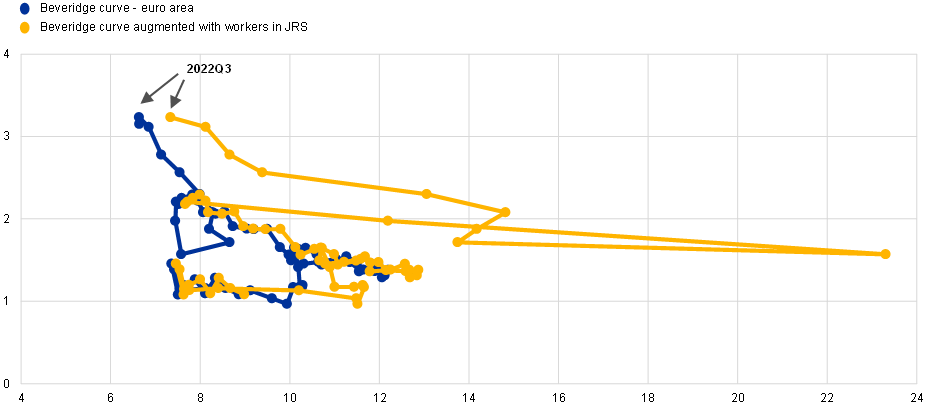
Sources: Eurostat, and ECB staff calculations based on data from Institute for Employment Research (Institut für Arbeitsmarkt- und Berufsforschung - IAB), Ministère du Travail, de l’Emploi et de l’Insertion, Istituto Nazionale Previdenza Sociale (INPS), and Ministerio de Inclusión, Seguridad Social y Migraciones..
Notes: JRS stands for job retention schemes.
Latest observations are for 2022 Q3 for the unemployment rate and vacancy rate and 2022 Q3 for the JRS, based on August 2022 for Germany, June 2022 for France, September 2022 for Spain and April 20222 for Italy.
Inflation expectations
So far, I have reviewed recent inflation developments and argued that the adjustment process is still ongoing in relation to the surprise inflation that has already occurred, with more to come in terms of the pass through of cost increases to consumer prices (especially in relation to energy) and a second round of price increases that will be generated by the catchup process for nominal wages. At the same time, the considerable easing in supply bottlenecks, the post-pandemic normalisation of the economy, the adverse real income impact of the deterioration in the terms of trade and the demand-reducing impact of the normalisation of monetary policy (compared to the accommodative monetary policy that was in place until the end of 2021) will all put downward pressure on near-term and medium-term inflation.
However, even after the economy has adjusted to all of these forces and counter-forces, the legacy of the current high inflation episode would be the risk of permanently higher inflation, if longer-term inflation expectations were to drift away from our two per cent target.
In particular, there is a clear risk that an extended period of above-target inflation may induce consumers, workers, firms and financial market participants to re-consider their beliefs about the future path of inflation, especially if the behavioural norm for many economic agents is to follow adaptive belief-formation processes by which high current inflation generates a persistent increase in the expected future inflation rate. It is rational for near-term inflation expectations to increase in response to a surge in inflation that is understood to dissipate only over a two- or three-year horizon due to the staggered nature of price and wage adjustment and the inevitable time lags in the response of inflation to monetary policy. Longer-term inflation expectations are most likely to be reset if it is feared that the central bank might be unwilling to take the monetary policy measures needed to make sure that inflation returns to the two per cent target in a timely manner.[30] In turn, if such de-anchoring were to occur and inflation were to be persistently high, a very costly monetary policy tightening strategy would be required in order to bring inflation back to target and thereby re-anchor longer-term inflation expectations. Accordingly, it is essential for the ECB to make sure that its monetary policy actions firmly anchor longer-term inflation expectations by returning inflation to the target in a timely manner.
Rather than tolerate an excessively-slow convergence rate back to the target, the importance of a timely return to the target is reinforced by the feedback loop by which the behaviour of near-term and medium-term inflation expectations matters for inflation dynamics. In particular, firms will seek higher price increases and workers will look for higher wage increases if it is believed that the overall price level and the overall cost of living will rise more quickly in the near term and the medium term, even if there is complete confidence that the inflation rate will eventually fall back to the two per cent target rate.[31] While monetary policy can do little to influence inflation in the very near term, it is essential that the central bank takes the policy measures needed to ensure the stability of medium-term inflation expectations to the two per cent target: this is why the ECB emphasises that it will set monetary policy to ensure the timely return of inflation to the target.
Inflation expectations in surveys of experts
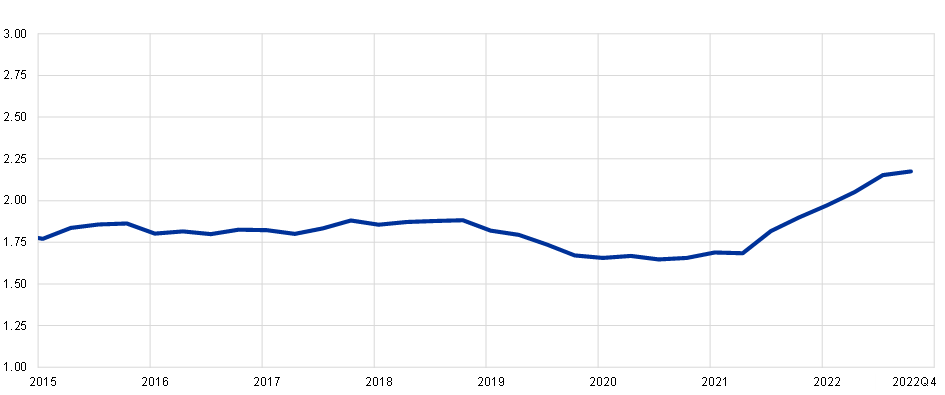
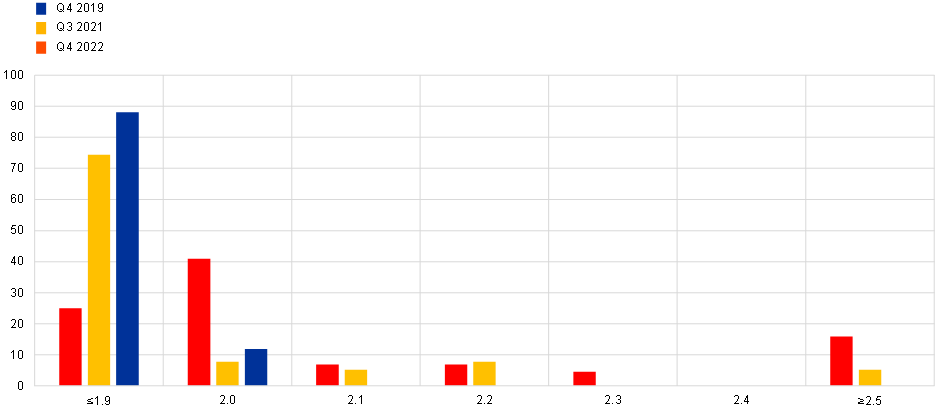
Since 1999, the ECB has conducted a quarterly survey of professional forecasters (the SPF).[32] Chart 33 shows that the mean long-term inflation expectation among this group was fairly stable during 2015-2019 at around 1.8-1.9 per cent but dipped in the first year of the pandemic to below 1.7 per cent. Since the beginning of 2021, the mean has climbed reaching the target level of 2 per cent at the start of 2022 and now standing at 2.2 per cent. Chart 34 shows that the model view among the experts is that inflation will be at the two per cent target in the longer term but that there is a cluster of respondents in the right tail that predict that inflation will remain above 2.5 per cent in the longer term.[33]
In relation to near-term inflation expectations, professional macroeconomists have been surprised by the persistence and extent of the increase in inflation during 2022, particularly after the invasion of Ukraine by Russia. On average, one year ahead inflation expectations were revised up by a cumulative 2.9 percentage points (1.0, 0.7 and 1.2 percentage points respectively) in the 2022Q2, 2022Q3 and 2022Q4 rounds. To put this into context, the largest revision to one-year ahead inflation expectations in the previous 92 rounds (23 years) of the ECB SPF was 0.3 percentage points (in 1999Q2 and also in 2008Q3).
In relation to the medium term, two-year ahead inflation expectations have risen to a historical high of 2.4 per cent. This suggests that although professional forecasters expect inflation to moderate strongly from the current elevated levels, they expect this decline to be drawn out over a relatively prolonged time period – particularly when compared with expectations over the previous two decades.
Chart 33
Survey of Professional forecasters: time series of mean long-term inflation expectations
Sources: ECB Survey of Professional Forecasters (SPF).
Note: Long-term inflation expectations refers to expectations five calendar years ahead in Q3 and Q4 rounds and four calendar years ahead in Q1 and Q2 rounds. For example, longer-term expectations refer to 2027 in the third and fourth quarter of 2022 rounds and to 2026 in the first and second quarter of 2022 rounds. Last observation: 2022Q4 round conducted in October 2022.
Chart 34
Survey of Professional forecasters: distribution of longer-term expectations
(percentage of respondents)
Sources: ECB Survey of Professional Forecasters (SPF).
Notes: The SPF asks respondents to report their point forecasts and to separately assign probabilities to different ranges of outcomes. This chart shows the spread of point forecast responses. Longer-term expectations refer to calendar year five years ahead in the third and fourth quarter rounds (and four calendar years ahead in the first and second quarter rounds).
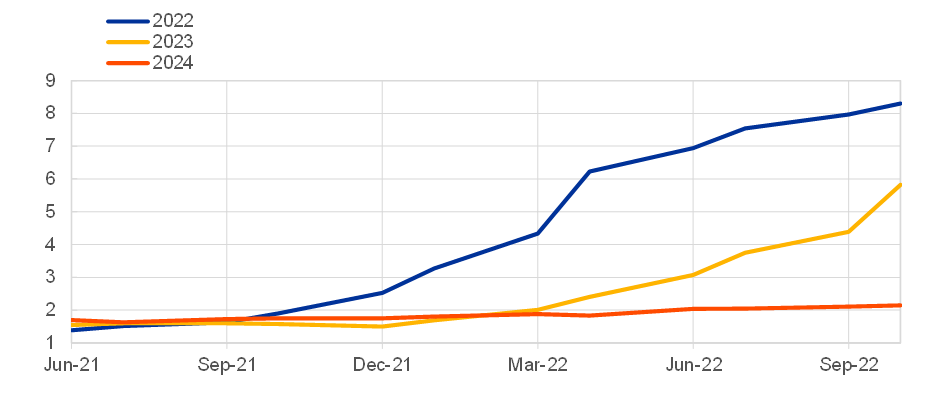
Since 2019, changes in inflation expectations are also collected in the ECB’s Survey of Monetary Analysts (SMA).[34] The SMA consist of a panel with 29 participants from bank and buy-side institutions and brings together information on financial sector expectations of monetary policy and macroeconomic developments, including their outlook for inflation. As shown in Chart 35, HICP inflation expectations for the year 2022 increased by five percentage points from 3.3 per cent in February 2022 to 8.3 per cent in October 2022, the most recent SMA survey. In a similar way, expectations for inflation in 2023 increased by 4.1 percentage points from 1.7 per cent in February 2022 to 5.8 per cent in October 2022.
By contrast, inflation expectations for 2024 moved only slightly from 1.8 per cent in February 2022 to 2.1 per cent in the October survey, staying close to the ECB’s inflation target of 2 per cent. Expectations for longer-run inflation remained anchored at 2 per cent since March 2022 as shown in Chart 36. Chart 37 displays the probability distribution for expected inflation in the long run in the SMA survey of October 2022, which is fully symmetrical around the target.
Chart 35
Survey of Monetary Analysts: inflation expectations over survey rounds for 2022, 2023 and 2024
(annual percentage changes)
Source: ECB Survey of Monetary Analysts (SMA).
Note: Chart includes survey vintages from June 2021 until October 2022 as SMA data is only published as of June 2021.
Chart 36
Survey of Monetary Analysts: long-term inflation expectations over survey rounds
(percentage changes)
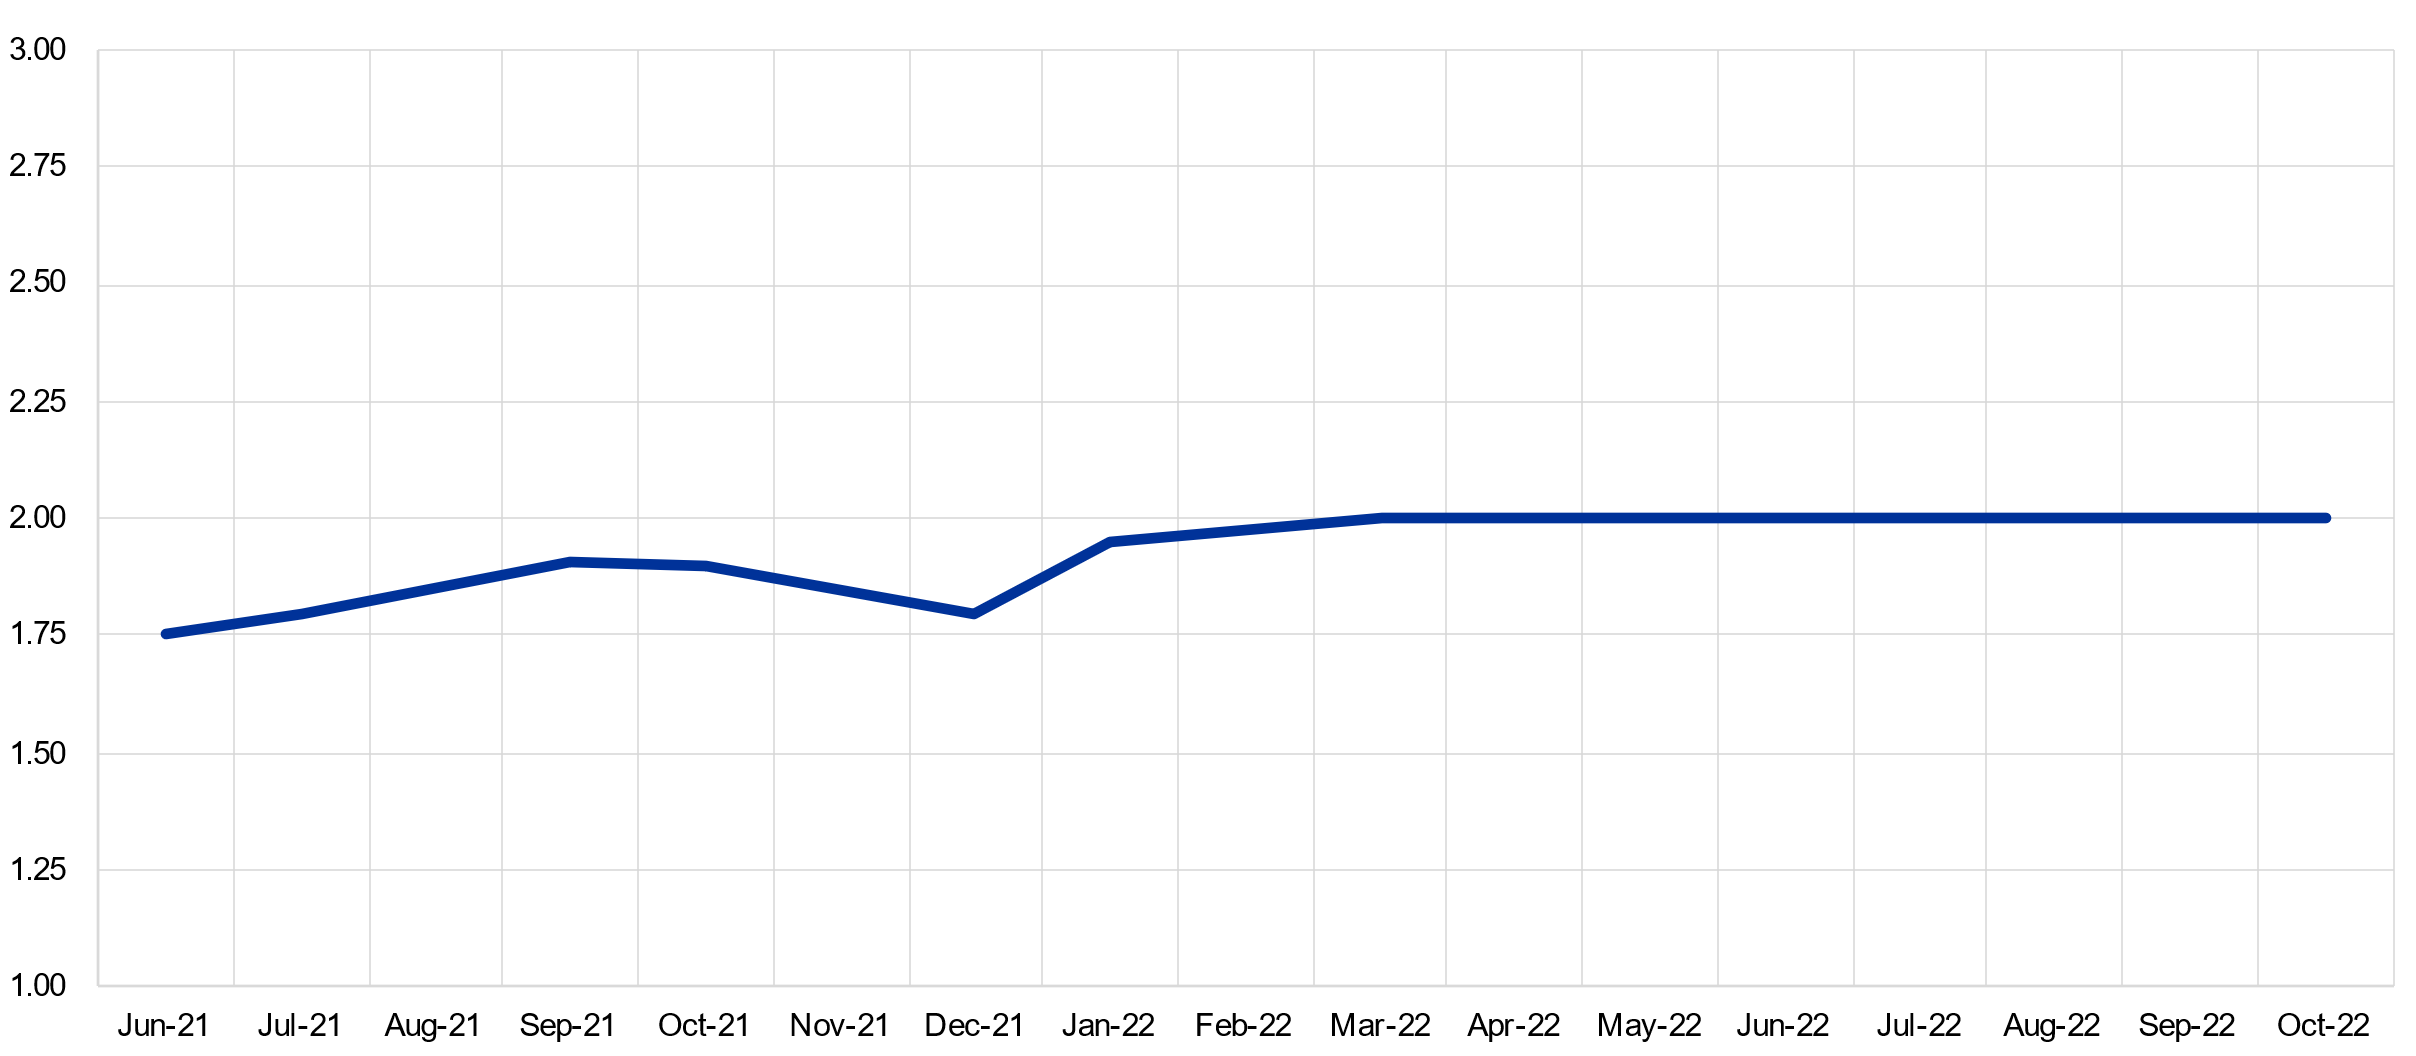
Source: ECB Survey of Monetary Analysts (SMA).
Note: Chart includes survey vintages from June 2021 until October 2022.
Chart 37
Survey of Monetary Analysts: distribution of long-term inflation expectations in October 2022 survey
(percentages)
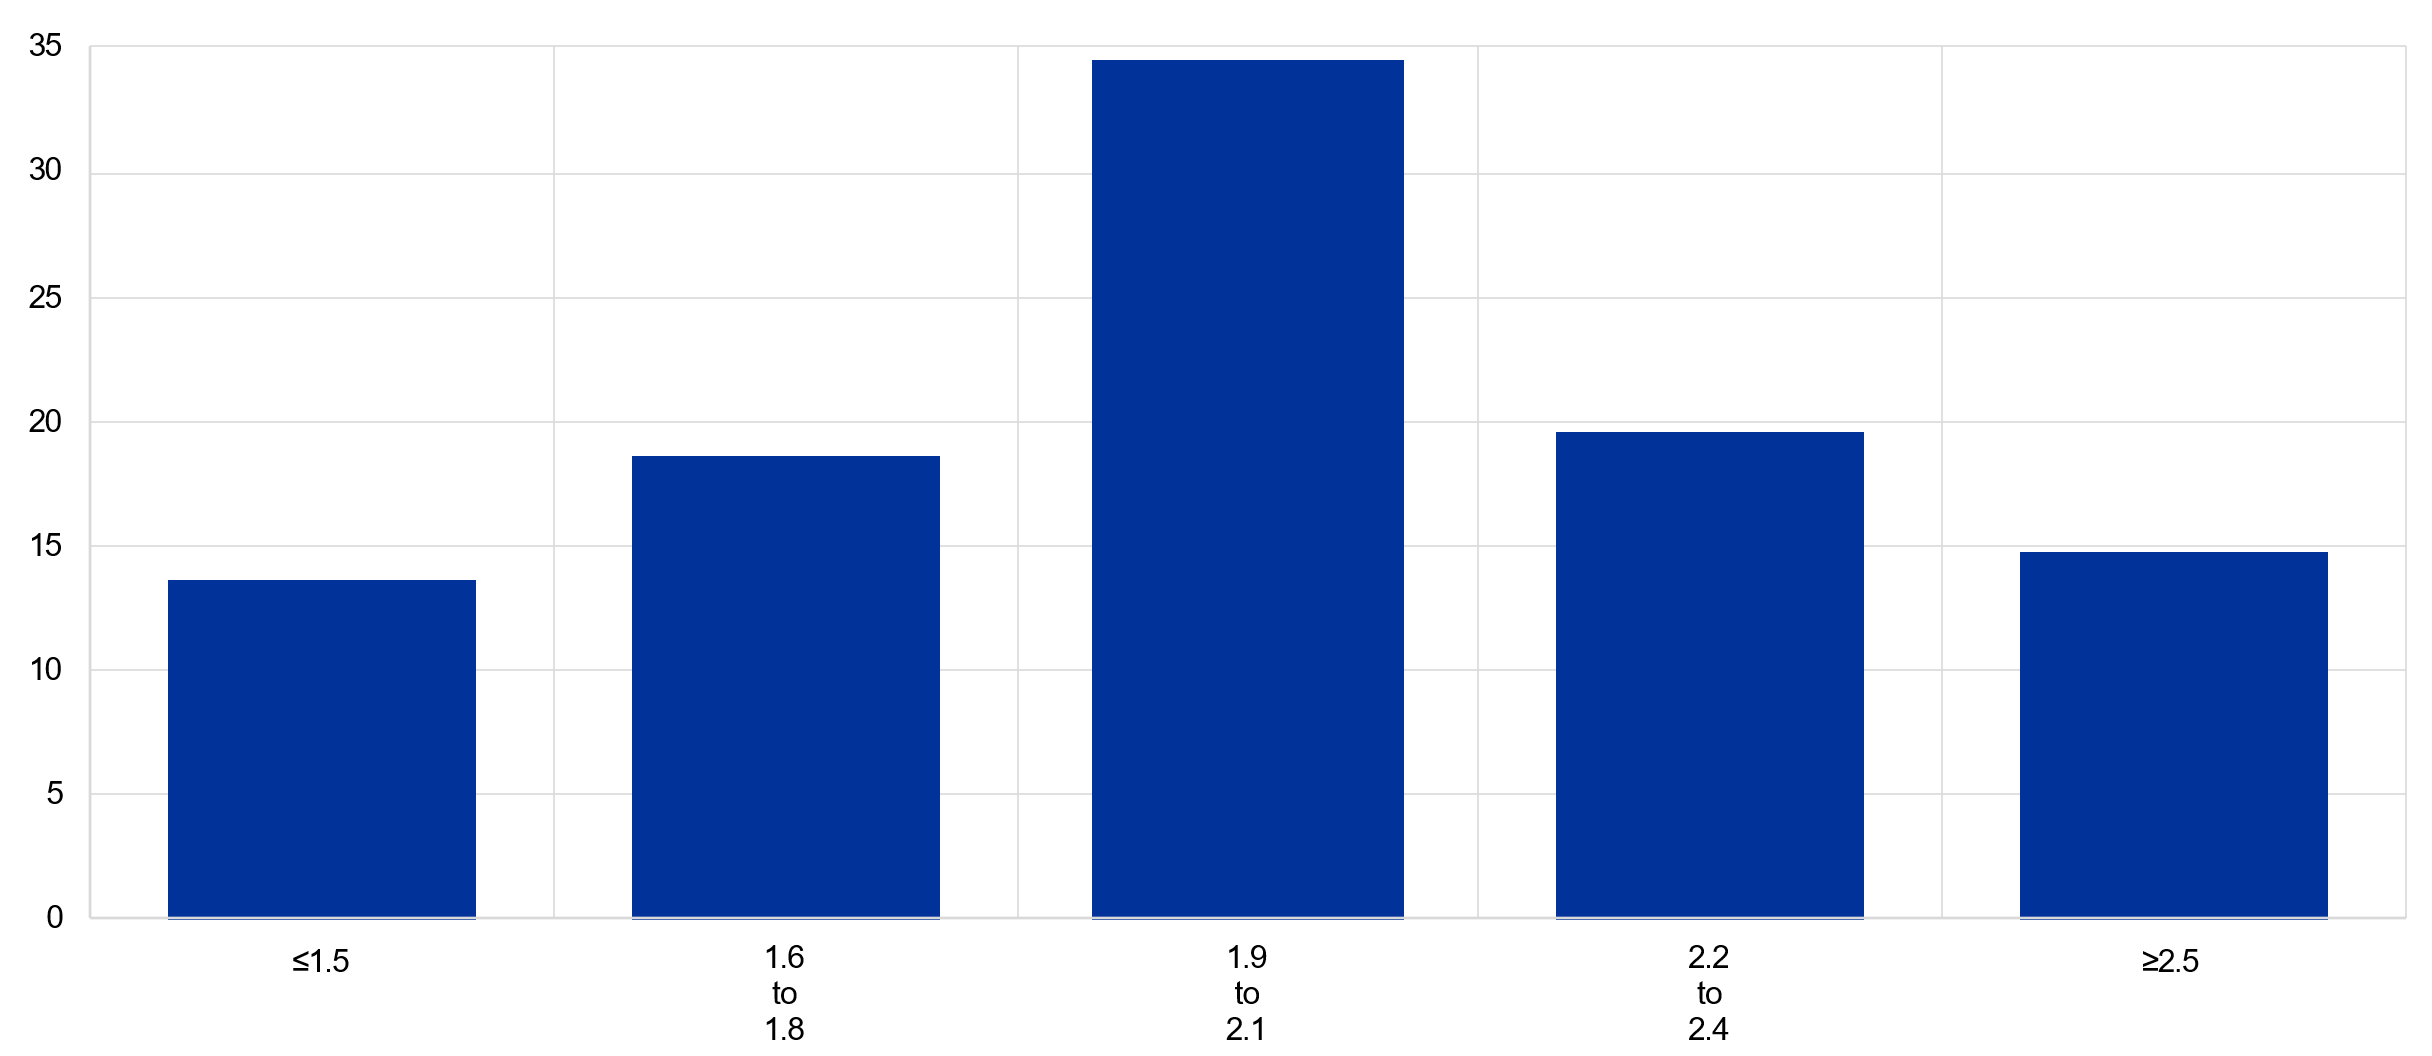
Source: October 2022 ECB Survey of Monetary Analysts (SMA).
Market-based measures of inflation compensation
Inflation-linked swap (ILS) rates are widely used as a benchmark for market-based measures of inflation compensation in the euro area.[35] ILS contracts exchange at maturity the fixed swap rate agreed in advance against the average inflation rate realised over the life of the swap, with both rates applied to a notional amount. The ILS rates are closely monitored by central banks, since these are a gauge of the views of market participants concerning future inflation. Such market-based measures are also more timely and more frequent than survey-based measures. However, ILS rates and other market-based measures of inflation compensation require careful interpretation since these combine market expectations of the most likely path for future inflation with inflation risk premia.
Chart 38 plots three ILS rates: the five-year rate; the ten-year rate; and the “five years in five years” rate (5y5y). The 5y5y rate is the compensation for inflation over years six to ten (the five years following the upcoming five years). These measures were all well below the two per cent level in the years before the pandemic (2015 to 2019) and declined further at the start of the pandemic in early 2020. However, these have moved upwards since mid-2020 and have exceeded the two per cent level throughout 2022. The five-year and ten-year rates are well above the 5y5y rate since these include compensation for near term inflation which is expected by market participants to be elevated for the next year before returning to about two per cent from 2024 onwards. In contrast, the 5y5y rate is not affected by the prospect of high near-term inflation.
Chart 38
Inflation linked swap (ILS) rates
(annual percentage points)
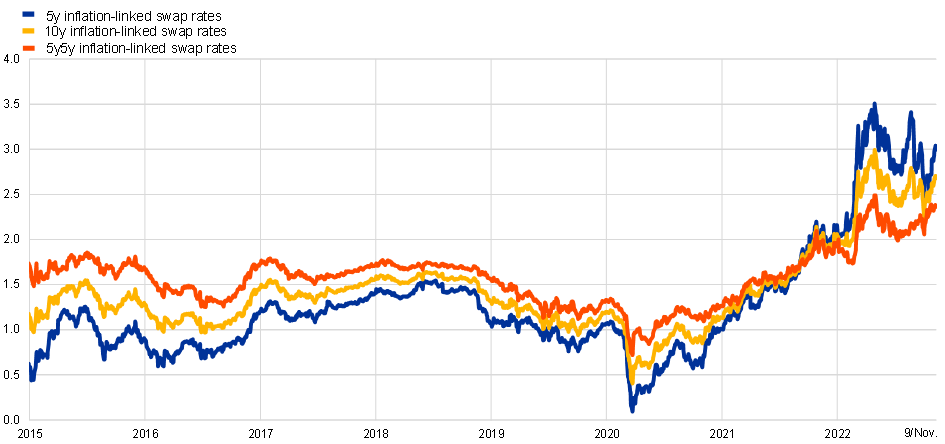
Sources: Refinitiv and ECB calculations.
The latest observations are for 9 November 2022.
The interpretation of the raw ILS rates in Chart 38 is necessarily limited by the joint pricing of expected inflation and inflation risk premia. Econometric models of the term structure of ILS rates can be used to decompose ILS rates into inflation expectations and inflation risk premia. Estimated models typically incorporate the key economic drivers of the short-term inflation rate (“pricing factors”) and a mechanism for the dynamics of these pricing factors (the “law of motion”). These constituents allow forecasts of the short-term inflation rate and averages of these forecasts to be generated for any maturity. Inflation expectations can then be estimated as the average short-term inflation rate over a given horizon, and inflation risk premia can be proxied as the difference between ILS rates and these inflation expectations. Estimated decompositions suggest that inflation expectations are in general more stable than ILS rates and that the latest estimated levels of model-implied inflation expectations are close to two per cent and thus more in line with information from surveys than plain ILS rates.
As an example, Chart 39 shows the relative contributions of the expectations component and the risk premium component to the evolution of the fitted ILS rate for “one year inflation, four years ahead” (1y4y). This ILS rate was around one per cent in late 2019 (before the pandemic) and dipped to 0.65 per cent in March 2020 at the start of the pandemic before rising to its current value of 2.31 per cent. Chart 39 shows that much of the volatility in the ILS rate can be attributed to swings in the inflation risk premium but that the inflation risk premium has also shifted from negative values from 2015 to 2021 to positive values in 2022.
As of 2021, there has also been a sustained shift in the expectations component, which rose from a pre-pandemic norm of about 1.5 per cent to about 2 per cent throughout 2022. This shift in the expectations component can be classified as a “re-anchoring” of expectations at our two per cent inflation target after a long period of below-target expectations. At the same time, the shift of the risk premium component into positive territory underlines that market participants also demand compensation for the risk that inflation over this horizon might exceed the target rate. This fear was most intense around April 2022 but has receded somewhat since then.
Chart 39
Decomposition of the 1y4y inflation linked swap (ILS) rate
(Annual percentage points)
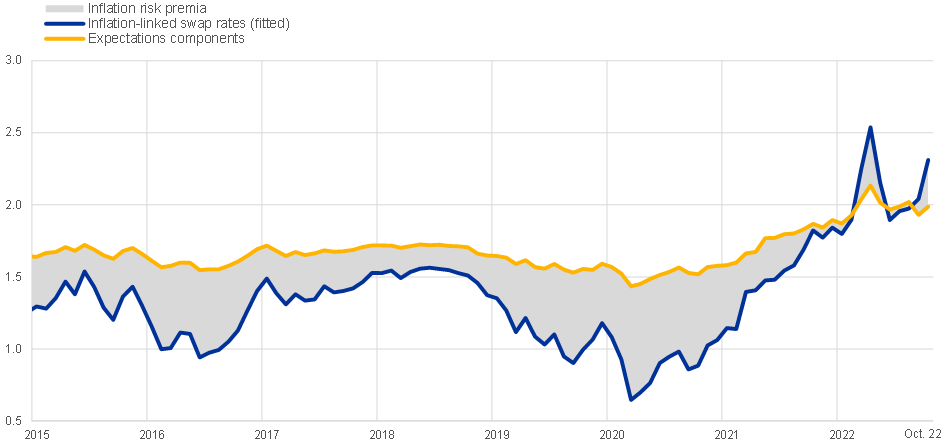
Sources: Refinitiv and ECB calculations.
Note: Average estimates based on two affine term structure models following Joslin, Singleton and Zhu (2011) applied to ILS rates adjusted for the indexation lag, as in Camba-Mendez and Werner (2017).
The latest observations are for October 2022.
As a cross check, Chart 40 shows the current cross-section/forward profile of ILS rates together with model-implied expectations and the latest SMA inflation expectations. In broad terms, market participants take a similar view to the expert participants in the surveys: inflation is set to remain high in the near term but will decline throughout the course of 2023 and hover around the two per cent target from 2024 onwards.
Chart 40
Inflation rates implied by market-based measures of inflation compensation and surveys
(Annual percentage points)
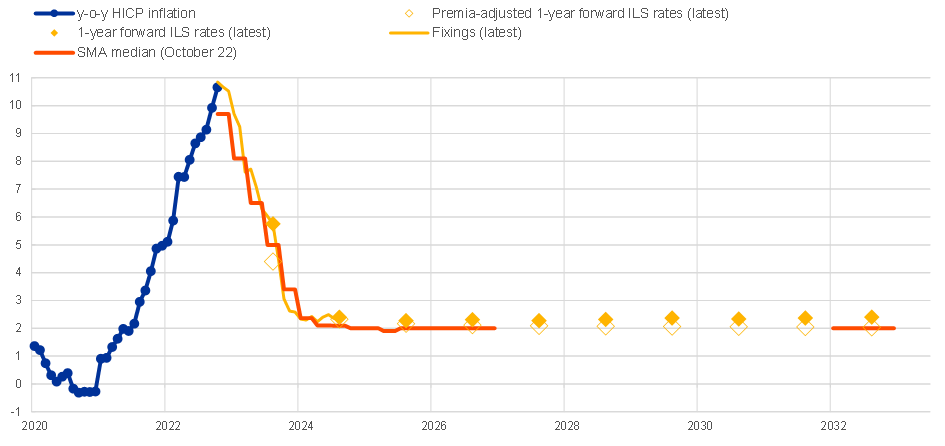
Sources: Bloomberg, Refinitiv, SMA and ECB calculations.
Notes: Premia-adjusted forward ILS rates are average estimates from two affine term structure models as in Joslin, Singleton and Zhu (2011) applied to ILS rates non-adjusted for the indexation lag; see Burban, V. et al. (2022), ECB Economic Bulletin Issue 8, 2021, Box 4.
The latest observations are 9 November 2022.
Inflation expectations in surveys of consumers and firms
Since 2020, the ECB has run a multi-country Consumer Expectations Survey (CES), in order to improve the understanding of the expectations formed by individual consumers. This has proved to be a valuable source of information for monitoring consumers expectations as well as understanding the economic effects of policy interventions. In its initial phase, the CES surveyed representative samples of private households across the six largest euro area economies (Belgium, Germany, Spain, France, Italy and the Netherlands). Each month, around 14,000 households are surveyed online. The survey is currently being expanded to include five other economies (Ireland, Greece, Austria, Portugal and Finland). This survey covers a range of important topical areas including consumption and income, inflation and output growth, the labour market, housing market activity and house prices, and consumer finance and credit access. The CES also collects information on the public’s overall trust in the ECB, their knowledge about its objectives and the channels through which they learn about its monetary policy and other central bank-related topics.
Chart 41 reports the evolution of household inflation expectations since early 2020. The CES examines inflation expectations at three horizons: perceptions of past inflation; expectations of inflation for the next year (the short term); and expectations of inflation three years ahead (the medium term). Until the middle of 2021, the median values of each of these indicators were stable at around two per cent. This level was well above the actual inflation rate until around May 2021 and above the near-term and medium-term expectations from expert surveys and market indicators. In any event, the CES shows that households quickly revised their perceptions of past inflation and near-term inflation expectations in response to the pickup in inflation from the middle of 2021. Although the perceptions by households of past inflation have risen broadly in line with actual inflation developments, their near-term inflation expectations have increased to a lesser degree.
Chart 41
Median consumer inflation expectations over time
(annual percentage changes)

Sources: ECB’s Consumer Expectations Survey and Eurostat.
The latest observations are for October 2022 for HICP inflation and September 2022 wave for CES expectations.
In relation to the medium-term horizon, there was a significant increase in median inflation expectations from about two per cent to about three per cent in March 2022 and the median value has remained broadly stable since then. At the same time, it is relevant that, although short-term inflation expectations have risen, the term structure of household inflation expectations has remained strongly downward sloping: consumers in the euro area continue to foresee that the current surge in inflation will not persist and that inflation three years from now will be considerably lower.[36]
The clear break in March 2022 presumably reflects some mix of the cumulative scale of the inflation surge and the onset of the war at that time. This one percentage point increase in medium-term inflation expectations warrants close monitoring, even if the interpretation of the exact level remains uncertain in view of the well-known reasons why household expectations are unlikely to correspond to the central bank’s inflation target even under strong anchoring.[37]
Chart 42 examines the distribution of medium-term inflation expectations. As can be expected in a survey of consumers, there is considerable cross-sectional dispersion in views about inflation: the increase in the median from 2 per cent to 3 per cent in March 2022 does not reflect a general switching from a 2 per cent prediction to a 3 per cent prediction – rather there has been a shift rightwards in the distribution, with a substantial increase in the fraction fearing that inflation would remain above 3 per cent in the medium term.
The interpretation of right-tail indicators (whether in the SPF, the SMA, the CES or in market-based pricing of right-tail outcomes) remains open and therefore it requires ongoing monitoring. As I outlined in a recent speech, two conjectures are especially relevant.[38] In one direction, more attentive traders, experts and individuals may identify more quickly a persistent shift in inflation dynamics, while inattentive participants adjust more slowly. Under such scenarios, right-tail measures might be leading indicators for a generalised revision in long-term inflation expectations.[39]
However, under other scenarios, the right tail might be populated by those who over-react to high spot inflation readings and mis-perceive as permanent what turns out to be a temporary increase in the inflation rate.[40] In these scenarios, the right-tail will not serve as an accurate leading indicator of generalised long-term inflation expectations. Accordingly, the interpretation of right-tail measures is closely connected to the overall dissection of the relative contributions of temporary and persistent forces in inflation dynamics.[41]
Chart 42
Distribution of consumer inflation expectations 3-year ahead
(annual percentage changes)

Source: ECB’s Consumer Expectations Survey.
An additional source of information are the ECB’s regular contacts with non-financial corporations, which provide important insights for understanding sectoral drivers of price and wage pressures. While inflation expectations per se are not part of these conversations, the discussion of sector-specific price and costs developments is both backward and forward looking and helps gather expectations on where both producer prices and wages may be heading, and what this might mean for consumer price inflation. It also helps us track how and why businesses’ price expectations are evolving.
If we consider the period since the outbreak of the Coronavirus pandemic, initially firms were concerned about the potential for falling prices, but this quickly shifted as demand for manufactured goods rebounded quickly and strongly, while even in sectors acutely affected by the pandemic, consumers spending decisions were driven by regulatory and safety considerations more than by prices. Already in March 2020 our business contacts were quick to tell us how disruption to container shipping would quickly spread around the globe and take several months to be corrected. In late 2020 and through much of 2021, our corporate contacts explained how industrial prices were being pushed higher as demand for manufactured goods outstripped supply in view of changes to consumption habits, on the one hand, and supply bottlenecks, on the other hand, especially for electronic components and in transport and logistics. They also started describing how easy it was to pass costs through to prices, even increasing margins, as customers focused on securing supply rather than negotiating on price. But at this stage, contacts generally expected demand and supply to rebalance after a few quarters and for pandemic-induced cost pressures to be transitory. The pass through to final consumer prices was expected to be limited and the wage outlook was stable.
It was towards the end of 2021 that these perceptions began to change. Our corporate contacts started expressing more concern about the persistence of input cost pressures, raising their price expectations for 2022 (also in view of rising energy prices). They also started to flag increasing labour shortages in many sectors, to anticipate a pick-up in wage growth and pointed to much higher wages needed to recruit staff in some sectors. Since the beginning of this year, many contacts also told us that prices would be increased more frequently. Generally, with each survey round, and in particular following the outbreak of war in Ukraine, contacts have emphasised the amount of accumulated cost increases still to be passed-through to selling prices, as well as building wage pressures, and hence heightened risks of more inflation persistence.
In addition, since 2009 the ECB collects timely information about financing conditions for all size classes of enterprises, including SMEs, through the Survey on the Access to Finance of Enterprises (SAFE). Although so far the survey does not include in a regular fashion information on inflation expectations as perceived by firms, a set of ad-hoc questions has been introduced in the last two years on recent (over the past 12 months) and expected (over the next 12 months) price changes at firm level.[42] Back in March 2022, family-run companies and firms reporting increases in the prices of production inputs and in their overall debt burden were among those that considered expected inflation to be a very important factor for the setting of future selling prices.[43]
At the current juncture, the information on firm-level expectations from the CTS and the SAFE plays an important role in assessing near-term inflation dynamics. However, these sources do not directly contribute to our understanding of medium-term or longer-term inflation expectations. Looking ahead, the ECB plans a revision of the SAFE aiming at the inclusion of new questions on HICP inflation expectations and expectations of future selling prices and labour cost at a quarterly frequency.
Conclusions
This blog post has argued that identifying medium-term inflation dynamics in an environment of high current inflation is a diagnostic challenge that necessarily involves a series of inter-linked analytical steps.
First, it is essential to interpret sectoral inflation patterns in the context of longer-run trends in relative price levels, especially during episodes in which the sectoral inflation differentials diverge from well-established trend patterns. In particular, a challenge is to work out the extent to which some proportion of these sectoral inflation differentials will reverse, thereby re-connecting to the pre-existing trend in relative sector price levels — and the extent to which there might be a trend break (or even a trend shift) in these relative sectoral price levels.[44] In meeting this challenge, there is no substitute for a detailed dissection of the likely persistence of the pandemic-related and war-related shocks, especially the direct and indirect effects of the energy shock, that have generated these atypical sectoral inflation differentials.
Second, the terms of trade channel is a first-order issue in understanding the impact of the surge in energy prices on medium-term inflation dynamics. The associated collective decline in real incomes and wealth will weigh on aggregate demand even after the surge in energy prices has faded out from inflation rate calculations; the more persistent the increase in the relative price of energy, the larger will be the scale of this demand decline.
Third, the current atypical situation means that it is unlikely that the standard measures of underlying inflation are sending the same signals about the likely persistence of inflation dynamics than under more standard macroeconomic conditions. This calls for a nuanced interpretation that takes into account the impact of energy and pandemic factors, in recognition that the current values of these measures may overstate the medium-term persistent component of inflation in this highly atypical environment.
Fourth, the staggered nature of wage setting means that the adjustment of nominal wages to the cumulative increase in the cost of living will play out over several years. In turn, this means that, even after energy and pandemic factors fade out of inflation measures, wage inflation will be a primary driver of price inflation over the next several years. More than ever, this elevates the importance of closely monitoring wage developments in a timely manner, both through the high-frequency wage trackers that have been developed in the Eurosystem and the evidence available from high-frequency private-sector indicators.
At the same time, it is also important to recognise that the catch-up phase by which the adverse impact of surprise inflation on real wages is unwound through a phase of faster-than-normal nominal wage increases will eventually be completed: this type of time-limited catch-up phase should not be mis-interpreted as indicating a permanent shift in nominal wage dynamics. In assessing the likely scale of the catch up, the implications of the adverse energy-related terms of trade shift for the equilibrium level of real wages that is consistent with full employment should be fully incorporated. At the same time, the currently-tight state of the labour market should be supportive of faster-than-normal wage growth: given the close (albeit lagged) connection between aggregate labour demand and the overall level of economic activity, the extent of wage pressure will be connected to the overall economic outlook.
Fifth, while long-term inflation expectations currently appear well anchored at the two per cent target, the risk of de-anchoring can be mitigated by bringing interest rates to the levels required to make sure that inflation returns to target in a timely manner. In calibrating this interest rate path, there is no short cut: the medium-term inflation path (and thereby the required scale of the monetary policy adjustment) is best evaluated through comprehensive assessments that incorporate the full range of economic, monetary and financial variables that shape inflation dynamics.
Sixth, a proper assessment of the likely future path of inflation is best conducted in the context of a comprehensive macroeconomic projections exercise (jointly assessed with a full review of monetary and financial conditions), in view of the inter-connections between economic activity levels, financial conditions (including the interest rate path) and inflation dynamics. Accordingly, while partial-equilibrium approaches (including the inspection of underlying inflation measures and the analytical decomposition of the latest inflation readings) certainly play a useful role in updating inflation priors on a week-by-week basis, the richest inflation assessment is produced through the integrated joint analysis of nominal indicators, economic activity measures and monetary and financial conditions.
Such a comprehensive assessment also includes a complete analysis of the impact of fiscal policy on medium-term inflation dynamics. In the current situation, the inflation impact of fiscal policy operates through several channels. All else equal, a persistent widening of fiscal deficits implies extra demand pressures on the economy over the medium term.[45] However, two additional considerations are relevant in determining the net inflation impact of fiscal policies. First, an array of fiscal interventions are alleviating current inflation pressures by subsidising retail energy prices but are scheduled to push up inflation once these measures expire: the net impact of such smoothing measures on medium-term inflation will depend on how these affect second-round wage dynamics and inflation expectations. Second, many of the new fiscal measures constitute transfers to households and firms. Since transfers may be saved rather than spent (especially if these are untargeted and received by high-saving households and firms), the aggregate demand multiplier will be lower compared to an expansion in government consumption or government investment.
Finally, the conditional nature of inflation projections should always be fully appreciated. Shocks can generate ex-post inflation deviations even if the ex-ante modelling of the likely future inflation path were “best in class”.[46] For policymakers, this intrinsic uncertainty can be addressed through a full range of scenario analyses that probes the sensitivity of projected inflation to alternative assumptions or model specifications. Conducting such robustness exercises is especially important when the degree of intrinsic uncertainty is particularly high in relation to post-pandemic normalisation, the course of the war, the potential strength of second-round effects via wage growth and the stability of inflation expectations. Furthermore, under such uncertainty, following a meeting-by-meeting approach to setting monetary policy will help ensure that our decisions are responsive to the evolving forward-looking assessments of the medium-term inflation outlook.
I am grateful to Niccoló Battistini, Matthias Bing, Elena Bobeica, Katalin Bodnár, Costanza Bosone, Francesca Colombo, Roberto de Santis, Claudia di Stefano, Annalisa Ferrando, Jenny Franke, Sara Gamito Albuquerque, Eduardo Gonçalves, Lucyna Górnicka, Vanessa Gunnella, Hannah, Hägele, Elke Hahn, Felix Hammermann, Hannah-Maria Hildenbrand, Gerrit Koester, Friderike Kuik, Marie-Sophie Lappe, Aidan Meyler, Jente Mork, Richard Morris, Pedro Neves, Sara Romaniega Sancho, Ieva Rubene, Fabian Schupp, Martin Strukat for their contributions to this blog post.
The prospective ending of full reinvestment of the APP in 2023 and the October revision to the terms of the TLTRO III programme will further contribute to the required shift in financial conditions.
On the connections between relative price movements and overall inflation, see, amongst others, L. Ball and N.G. Mankiw (1995), “Relative-Price Changes as Aggregate Supply Shocks,” Quarterly Journal of Economics 110(1), 161-193; R. Reis and M.W. Watson (2010), “Relative Goods' Prices, Pure Inflation, and the Phillips Correlation,” American Economic Journal: Macroeconomics 2(3), 128-157.
In this decomposition, the goods category corresponds to the non-energy industrial goods (NEIG) sector.
See for example Fröhling, A., O’Brien, D. and Schaefer, S. (2022) “A new indicator of domestic inflation for the euro area,” ECB Economic Bulletin, Issue 4/2022.
For an overview, see Baumol, W.J. (2013), The Cost Disease, Yale University Press. While productivity in many services sectors has been improved by the information and communications technology (ICT) revolution and digitalisation, the scope for labour substitution in contact-intensive services is intrinsically more limited.
See Balassa, B. (1964), “The Purchasing Power Parity Doctrine: A Reappraisal”, Journal of Political Economy, Vol. 72, No. 6, 584-596 and Samuelson, P.A. (1964), “Theoretical Notes on Trade Problems”, Review of Economics and Statistics, Vol. 46, No.2, pp. 145-154.
Of course, domestic food prices embed a high import content via intermediate inputs, including energy.
On the impact of the war on food inflation, see Bodnár, K. and T. Schuler (2022): “The surge in euro area food inflation and the impact of the Russia-Ukraine war”, ECB Economic Bulletin Box, Issue 4.
Rent is another important component of the services category. Rent inflation has been quite limited so far but can be expected to increase over time, with the re-setting of rental contracts taking into account the overall inflation environment. Since the current approach to constructing the HICP does not give a high weight to owner-occupied housing costs, alternative measures would show yet stronger increases in the services inflation rate.
The outlier is package holidays with an inflation rate of -14.9 per cent. If this is excluded, the minimum value is 5.6 per cent.
This threshold was selected based on the accuracy of the indicator to predict developments in headline inflation over the medium term.
Fröhling, A., D. O’Brien and S. Schaefer (2022). “” new indicator of domestic inflation for the euro area”, ECB Economic Bulletin, Issue 4/2022.
See Battistini, N. and Stoevsky, G. (2020), “Alternative scenarios for the impact of the COVID-19 pandemic on economic activity in the euro area”, ECB Economic Bulletin, Issue 3/2020.
The baseline ECB staff projections in May 2020 assumed a vaccine would be rolled out in mid-2021 but that the vaccine would lead to much lower stringency conditions than proved to be the case.
See Gonçalves, E. and Koester, G. (2022): The role of demand and supply in underlying inflation – decomposing HICPX inflation into components, Economic Bulletin Issue 7, 2022.
See also Ehrmann, M., G. Ferrucci, M. Lenza and D. O’Brien (2018): Measures of underlying inflation for the euro area, ECB Economic Bulletin, Issue 4/2018; and ECB (2021): Inflation measurement and its assessment in the ECB’s monetary policy strategy review, ECB Occasional Paper No. 265 / September 2021.
In addition, such measures may react to shocks with a lag and thus these may not capture developments in medium-term inflation in a timely manner.
On the differences between time-dependent and state-dependent pricing, see, for example, P.J. Klenow and O. Kryvtsov (2008), “State-Dependent or Time-Dependent Pricing: Does It Matter for Recent U.S. Inflation?”, Quarterly Journal of Economics, Vol. 123, No. 3, 863-904.
See also Banbura, M. and E. Bobeica (2020): PCCI – a data-rich measure of underlying inflation in the euro area, ECB Statistical Paper Series, No 38 / October 2020.
Of course, the flip side is that the Supercore will be misleading if the model is fed with mis-measured variables. The mis-reading of the true output gap in the 1970s results in excessively accommodating macroeconomic policies. See, for example, A. Orphanides (2002), “Monetary Policy Rules and the Great Inflation,” American Economic Review 92(2), 115-120.
On the real-time measurement of the output gap, see Orphanides, A. and van Norden, S. (2002), “The Unreliability of Output-Gap Estimates in Real time”, Review of Economics and Statistics, Vol. LXXXIV, No. 4.
See also Koester, G, Benatti, N. and A. Vlad (2020): "Assessing wage dynamics during the COVID-19 pandemic: can data on negotiated wages help?" ECB Economic Bulletin Box, Issue 8.
Changes in social security contributions is defined as the difference between the annual rate of growth in compensation per employee and the annual rate of growth in gross wages and salaries per employee, and is partly driven by legislative changes in social security contribution rates.
See also Koester, G. and J. Guillochon (2018): Recent developments in the wage drift in the euro area, ECB Economic Bulletin, Issue 8/2018.
See Adrjan, P. and Lydon, R. (2022), “Wage Growth in Europe: Evidence From Job Ads”, Economic Letters, Vol. 2022, No. 7, Central Bank of Ireland, November.
See also Philip R. Lane (2022:) The euro area outlook: some analytical considerations, Bruegel, Brussels, 5 May 2022
One important caveat is that contracts can be re-negotiated in response to unexpected inflation shocks: the ex-ante agreement does not fully describe ex-post outcomes in these circumstances. A second important caveat is that wage negotiations in some countries are highly concentrated at the turn of the year, such that there is limited representativeness from current negotiations that do not represent a significant mass in the overall labour market.
Such concerns are often expressed in terms of conjectures that the central bank might be fiscally dominated or financially dominated. Precisely to provide insulation against these concerns, the ECB has been granted policymaking independence with a clear primary mandate of price stability.
In terms of the feedback loop from inflation expectations to nominal and real dynamics, it is important to appreciate that, for any given nominal yield curve, if high near-time inflation expectations are accompanied by expectations of a deteriorated macroeconomic outlook and significant uncertainty then the inflation cycle is less likely to be amplified through an endogenous increase in consumption, investment and credit compared to an alternative scenario in which high near-term inflation expectations are accompanied by macroeconomic optimism. Put differently, cost-push inflation shocks are less likely to give rise to a pro-cyclical real interest rate channel compared to demand-driven inflation shocks.
The ECB Survey of Professional Forecasters (SPF) is a quarterly survey (conducted since 1999) of a panel of approximately 75 professional macroeconomic forecasters located in Europe. The panel comprises of financial sector (approximately 2/3s) and non-financial sector panelists (such as research institutions). For more information and data see the ECB SPF webpage: https://www.ecb.europa.eu/stats/ecb_surveys/survey_of_professional_forecasters/html/index.en.html.
See also Górnicka, L. and A. Meyler (2022): Does the tail wag the dog? A closer look at recent movements in the distributions of inflation expectations, ECB Economic Bulletin, Issue 6/2022.
See “The ECB Survey of Monetary Analysts: an introduction”, ECB Economic Bulletin, Issue 8/2021.
Unlike the break-even inflation rate measures that are derived from inflation-linked and nominal sovereign bonds issued by specific euro area member states, ILS rates are less affected by market liquidity issues.
Górnicka, L., J. Meyer, and A. Meyler (2022): A closer look at consumers’ inflation expectations – evidence from the ECB’s Consumer Expectations Survey, ECB Economic Bulletin, Issue 7/2022.
For recent discussions of the role and measurement of households expectations in macroeconomics, see Gorodnichenko, Y., Coibion, O. and Weber, M. (2022), “Monetary policy communications and their effects on household inflation expectations”, Journal of Political Economy, Vol. 130, No. 6, pp.1537-1582; Weber, M., D’Acunto, F. Gorodnichenko, Y. and Coibion, O. (2022), “The Subjective Inflation Expectations of Households and Firms: Measurement, Determinants, and Implications”, Journal of Economic Perspectives, Vol. 36, No. 3, pp. 157-184; Coibion, O., Gorodnichenko, Y, Knotek, E.S., Schoenle, R. (2022), “Average Inflation Targeting and Household Expectations”, Journal of Political Economy – Macroeconomics, forthcoming.
See Lane, P. R. (2022), “Monetary policy in the euro area: the next phase,” Speech to 2022 Annual Meeting of the Central Bank Research Association (CEBRA), Barcelona.
See Reis., R. (2022), “Inflation and Expectations: Rises and Responses,” Speech at the ECB Forum on Central Banking, Sintra.
On the temptation to over-react, see Bordalo, P., Gennaioli, N., Shleifer, A. (2022), “Overreaction and Diagnostic Expectations in Macroeconomics,” NBER Working Paper No. 30356.
In relation to the right-tail in the SPF, Górnicka, L. and Meyler, A. (2022), “Does the tail wag the dog? A closer look at recent movements in the distributions of inflation expectations,” ECB Bulletin Issue 6/2022 find that the respondents in the right tail are more sensitive to current developments than other forecasters and might extrapolate short-term inflation dynamics more strongly and persistently into the longer term.
In the euro area, the Bank of Italy, and more recently the Banque de France, regularly conduct surveys asking firms in their own countries about inflation expectations. See for Italy (https://www.bancaditalia.it/pubblicazioni/indagine-inflazione/2022-indagine-inflazione/09/index.html) and for France (https://www.banque-france.fr/en/statistics/inflation/inflation-expectations ).
See Box “Selling price expectations among euro area enterprises”, ECB Economic Bulletin, Issue 5/2022.
The list of possible structural changes include geopolitical re-configurations, de-globalisation, the green transition, digitalisation and automation. On the potential role of structural changes, see Lagarde, C. (2022), “Monetary Policy in a New Environment,” Speech at European Banking Congress, 18 November.
Of course, if an increase in public debt ratios were to trigger an increase in risk premia, there are additional implications for aggregate demand and inflation dynamics.
The ECB staff regularly conducts ex-post reviews of its forecasting performance and is committed to being transparent about the origins of forecast errors. See Chahad, M., Hofmann-Drahonsky, A.-C., Meunier, B., Page, A. and Tirpák,, M. (2022), “What explains recent errors in the inflation projections of Eurosystem and ECB staff?”, ECB Economic Bulletin, Issue 3/2022.