
Supply chain disruptions and the effects on the global economy
Published as part of the ECB Economic Bulletin, Issue 8/2021.
Strains in global production networks, which started to emerge in late 2020, are a reflection of imbalances between the supply and demand of certain goods and are creating headwinds for the ongoing global economic recovery. Strains in global production networks, also commonly referred to as supply bottlenecks, are a multifaceted phenomenon. The decline and subsequent recovery in economic activity during the COVID-19 pandemic have been unprecedented, reflecting the massive shifts in demand and supply triggered by the closing and reopening of economies, and amid considerable monetary and fiscal stimulus and high levels of accumulated savings, especially in advanced economies. Moreover, as pandemic-related containment measures severely restricted consumption opportunities in the services sector (in particular travel, tourism and recreational activities), there was a rotation in demand towards merchandise goods, which compounded the already strong cyclical recovery in the goods sector. Faced with that strong surge in demand, suppliers of goods worldwide have been struggling to meet the increase in orders. In addition, idiosyncratic supply chain disruptions (owing to the waves of the pandemic and adverse weather events, for instance) have also played a role, capping activity and trade growth and ultimately pushing up prices. This box reviews the main features of the ongoing supply bottlenecks. First, it aims to disentangle supply chain disruptions from demand-side factors, claiming that while the latter are a manifestation of the current phase of the business cycle, the former may indeed curb the pace of the recovery and therefore warrant close monitoring. Second, it provides an empirical assessment of the impact of supply chain disruptions on global economic activity and prices, and the assumptions about how they will evolve going forward.[1]
Supply chain disruptions are putting a drag on activity and trade at the global level. The most relevant elements are i) difficulties in the logistics and transportation sector, ii) semiconductor shortages, iii) pandemic-related restrictions on economic activity, and iv) labour shortages. Global shipping of merchandise goods has been severely disrupted owing to container misplacement and congestion on the back of not only the rapid recovery in the global economy, the rotation of consumption demand from services to goods, and the associated high import volumes, but also port closures because of localised and asynchronous outbreaks of COVID-19.[2] As a result, shipping costs, especially from the main Asian ports to the United States and Europe, have skyrocketed since the end of 2020. Semiconductor shortages started to materialise in the second half of 2020 and are especially pronounced in the automotive sector. During the great lockdown, car producers reduced their chip orders, while demand for chips used in other electronic equipment rose significantly (mostly on account of the work from home instruction). Producers were surprised by the sharp increase in new car orders in the second half of 2020, and with little spare capacity left in the semiconductor industry, chip production was unable to keep up with the high demand – possibly also as a result of underinvestment in the years prior to the pandemic.[3] Labour shortages appear to be less widespread and more concentrated in certain economies, such as the United States and the United Kingdom. In both countries, indicators of labour market tightness are already above their pre-crisis levels, in contrast to the slow recovery after the global financial crisis. Declines in both matching efficiency and labour force participation partly reflect increases in unemployment benefits, early retirements and the need to care for children and other family members during the pandemic, as well as a reluctance to work in contact-intensive sectors.[4] Finally, the impact of the aforementioned factors in terms of clogging up supply chains might be exacerbated by the “bullwhip-effect”, a standard amplification channel phenomenon whereby firms build up their inventories because they are expecting robust demand amid a shortage of key inputs in the production process, such as raw materials and intermediates.
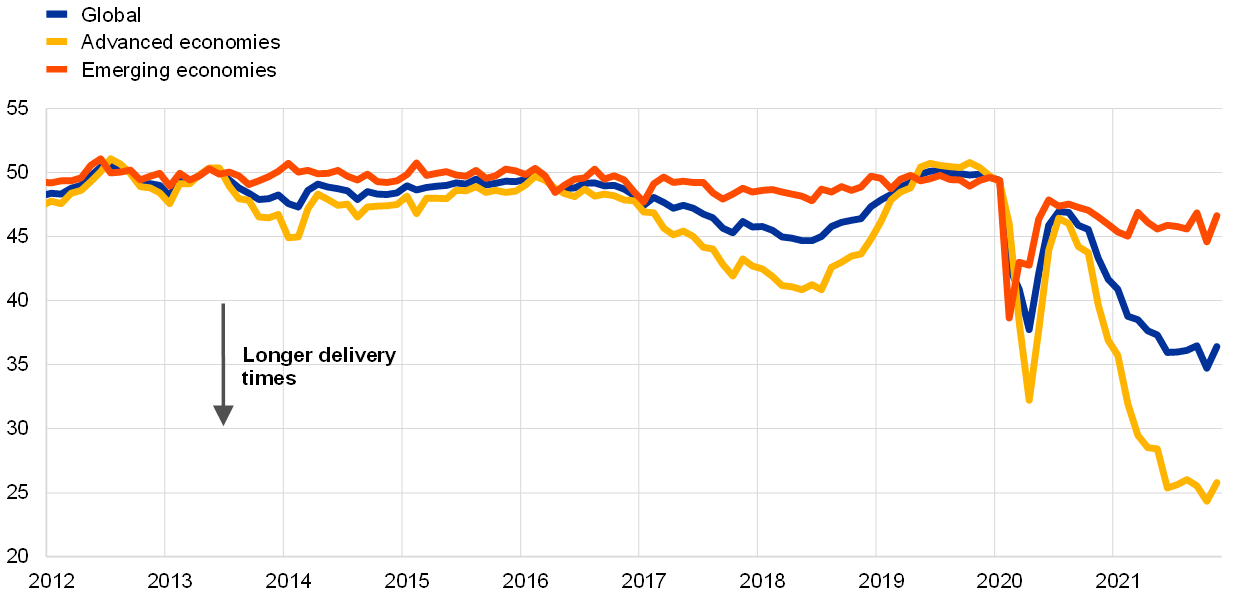
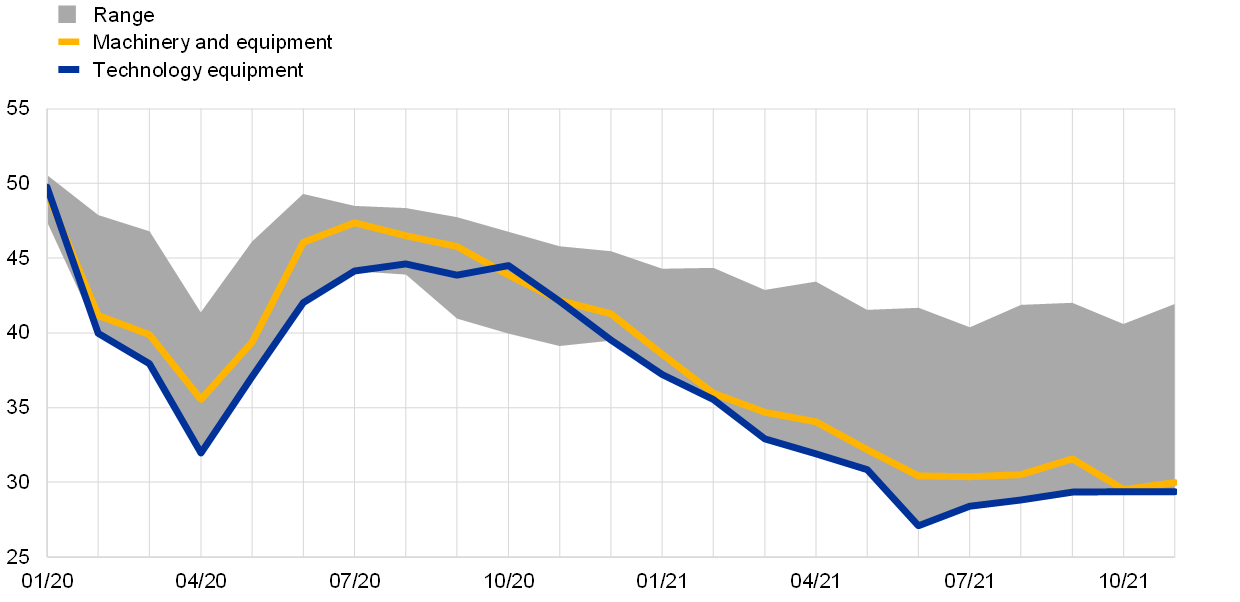
The lengthening of suppliers’ delivery times across advanced economies since the end of 2020 is the most evident manifestation of widespread strains in global production networks. One of the indicators most commonly used as a proxy for such strains is the global Purchasing Managers Index suppliers’ delivery times (hereinafter referred to as the “PMI SDT”), which quantifies developments in the time required for the delivery of inputs to firms. One key advantage of the PMI SDT is that it is able to capture capacity constraints of a different nature (e.g. intermediate goods shortages, transportation delays or labour supply shortages), making it an all-encompassing indicator of strains in global production networks.[5] This indicator suggests that suppliers’ delivery times have lengthened massively in recent months (Chart A, panel a) and that the lengthening is proving to be more protracted than during the initial COVID-19 shock. The chart also suggests that there is a significant amount of heterogeneity between advanced economies and emerging economies, with economies like the United States, the euro area and the United Kingdom being much more affected than key emerging economies. Finally, while the increase in the PMI SDT is common to most sectors, it is particularly pronounced for certain types of product, such as technology equipment and machinery (Chart A, panel b), suggesting that the shortage of intermediate products is more severe in those sectors.
Chart A
Suppliers’ delivery times
a) PMI SDT across regions
(diffusion indices)
b) Global PMI SDT across sectors
(diffusion indices)
Sources: Markit and ECB calculations.
Notes: The shaded area in panel b) indicates the range between the minimum and the maximum PMI SDT level across 15 sectors (basic materials, chemicals, resources, forestry and paper products, metals and mining, consumer goods, automobiles and auto parts, beverages and food, beverages, food, house/personal use products, industrial goods, construction materials, machinery and equipment, technology equipment). The latest observations are for November 2021.
Suppliers’ delivery times reflect strains in production networks and display some procyclicality vis-à-vis output fluctuations. The PMI SDT tends to co-move closely with the global PMI manufacturing output, which is a proxy for the business cycle, suggesting that as output increases, delivery times tend to lengthen. In order to purge movements in the PMI SDT from the normal lengthening associated with cyclical fluctuations, we use a monthly bivariate vector autoregression (VAR) model for the global (excluding euro area) PMI manufacturing output and the global PMI SDT, in which shocks stemming from the recovery in demand and supply chain disruptions are identified using sign restrictions.[6] More specifically, we assume that disruptions to supply chains lengthen delivery times and reduce output, while the rise in demand induced by the economic recovery increases both delivery times and output. This approach enables us to recover the structural shocks underlying movements in the PMI SDT, and in particular the supply-side shock, which we take as our measure of supply chain shocks.
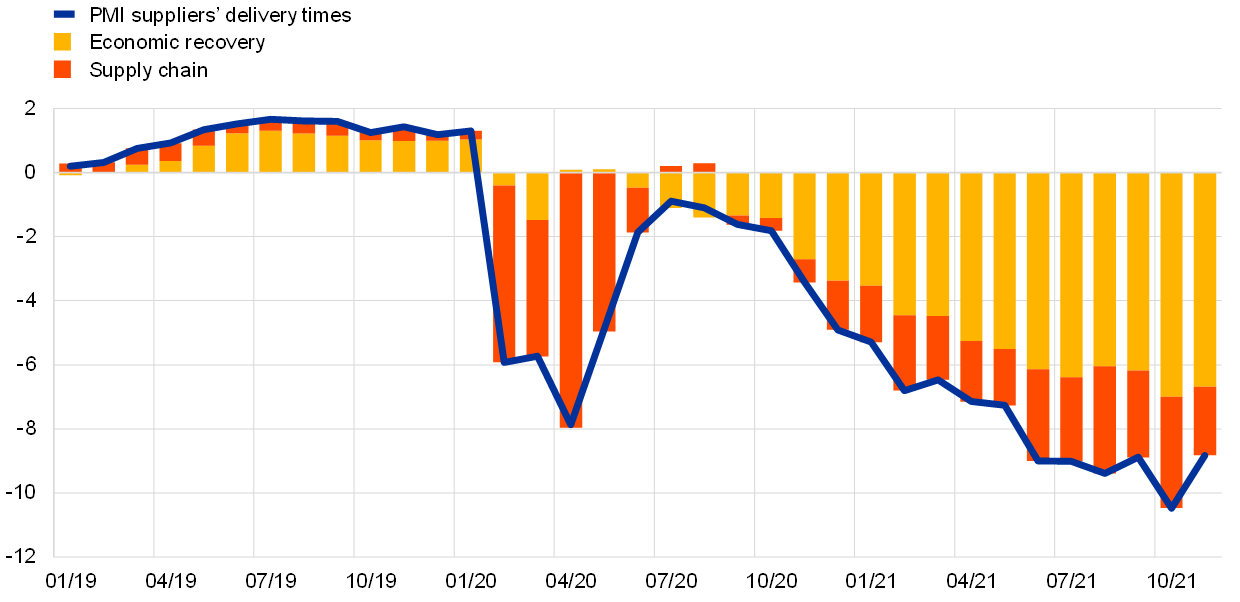
Our empirical analysis suggests that supply chain shocks account for around one-third of the strains in global production networks. The historical decomposition shows that, even though demand factors played a primary role in driving the overall level of the PMI SDT, supply chain disruptions accounted for one-third of the lengthening in delivery times over the last six months, and their contribution has been growing (Chart B). By contrast, the greater contribution of demand factors is not surprising given the procyclicality of delivery times in periods of economic recovery and the unprecedented economic recovery that has followed the initial COVID-19 shock.[7]
Chart B
A model decomposition of PMI suppliers’ delivery times
(deviations from the mean; percentage point contributions)
Source: ECB calculations based on Markit data.
Notes: Historical decomposition of global (excluding euro area) PMI suppliers’ delivery times, which was obtained via a two variable Bayesian VAR with PMI output and PMI suppliers’ delivery times, identified through sign restrictions and estimated over the period from May 2007 to November 2021. The latest observations are for November 2021.
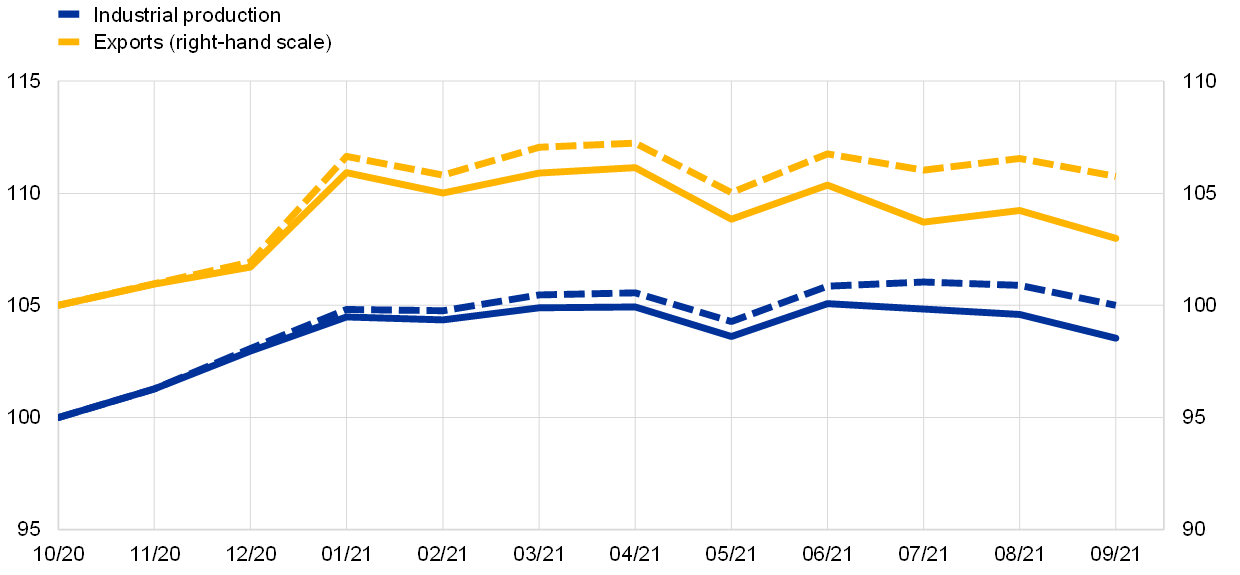
Supply chain disruptions have a negative impact on global industrial production and trade, and a positive impact on inflation. Our analysis aims to quantify the impact of the aforementioned supply chain shock on activity, trade and prices, and, in turn, the headwinds it creates for the economic recovery. To achieve this, we estimate a companion VAR, with five endogenous variables (exports, imports and industrial production, together with the inflation rates for the consumer price index and the producer price index). The estimated supply chain shock is plugged into the model as an exogenous variable. In order to quantify the headwinds for activity, trade and prices, we then generate a counterfactual scenario by running a conditional forecasting exercise for the period from November 2020 to September 2021, which assumes that there are no supply chain disruptions (i.e. the supply chain shock is set at zero throughout). For that period, we find that world trade would have been around 2.7% higher cumulatively in the absence of supply chain shocks, while global industrial production would have been around 1.4% higher (Chart C, panel a). The effects are greater on trade than on industrial production because the weakness in the logistics sector disproportionately affected trade. Moreover, the shift towards domestic suppliers and domestic goods might have mitigated the repercussions on industrial production. Our findings also suggest that supply chain disruptions have a significant – and increasing over time – effect on prices, which is much more prominent in the producer price index than in the consumer price index (Chart C, panel b).[8] This could be attributed to the fact that producers are more directly exposed to supply chain disruptions than consumers. Moreover, rising producer prices are passed on to consumers only partially and/or with a lag. Finally, it is worth noting that the aforementioned aggregate results mask significant heterogeneity across countries given that not all countries are affected by supply bottlenecks to the same degree. For instance, we find that the effects are greater in the United States, where trade and industrial production stand at 4.3% and 2.0% below the disruption-free counterfactual scenario respectively.
Chart C
Impact estimates
a) World (excluding euro area) trade and industrial production
(October 2020 = 100)
b) World (excluding euro area) consumer price index and producer price index
(percentage point deviations from year-on-year monthly inflation)

Source: ECB calculations based on Markit, CPB and OECD data.
Notes: The effects of supply chain disruptions on quantities and prices are obtained by means of a VAR in which a structural supply shock (recovered from a sign restricted structural VAR with PMI output and PMI delivery times) is plugged in as an exogenous variable. The effects are computed as the difference between the path of the variables obtained under the realisation of the shock and under a counterfactual scenario in which the shock between November 2020 and September 2021 is set at zero (i.e. no supply chain disruptions). In panel a) the dashed lines show the estimated evolution of exports and industrial production in the absence of supply bottlenecks. In panel b) the bars show the estimated effects of supply bottlenecks on the consumer price index and the producer price index. All global aggregates exclude the euro area. The latest observations are for September 2021.
Supply chain disruptions are expected to improve gradually in the second half of 2022, although there is still a high level of uncertainty about their evolution. Given their multifaceted nature, some disruptions might need more time to be resolved than others. For example, a significant boost to semiconductor production requires a large amount of investment to increase foundry capacity, and given the lead time that this requires, fundamental improvements can only be expected later in 2022 or in 2023. Any easing in labour shortages in the coming months will depend on the evolution of government support, as well as pandemic containment measures and the number of new COVID-19 cases. Shipping costs have fallen recently, mainly on account of temporary factors (e.g. the reopening of ports in South Asia as the number of COVID-19 infections had declined), but they are still close to their historical highs. Available survey-based information summarising the views of the corporate sector suggests that the situation is expected to remain difficult throughout most, if not all, of 2022.[9]
Looking ahead, risks of further supply-side disruptions cannot be ruled out, especially if the pandemic situation intensifies. The new Omicron variant has reignited concerns about an intensification of the pandemic on a global scale. Outbreaks may result in localised closures at ports or firms, which would induce further disruptions in production and shipping, and hence act as a drag on activity while putting upward pressures on prices. In addition, new containment measures to limit its spread (e.g. restrictions on mobility and international flights), as well as voluntary limitations, may again trigger a shift in consumer demand from services to goods, thereby exacerbating supply bottlenecks. However, if overall consumer demand declines, there could be some easing in the global supply constraints which, as shown above, seem to be mostly the result of strong demand. Finally, a faster than expected increase in semiconductor production and transportation capacity in the shipping industry may lead to a quicker resolution of the supply-side disruptions.
- For an analysis of the impact of supply chain disruptions on euro area industrial production, see the box entitled “Sources of supply chain disruptions and their impact on euro area manufacturing” in this issue of the Economic Bulletin.
- See also the box entitled “What is driving the recent surge in shipping costs”, Economic Bulletin, Issue 3, ECB, 2021.
- See also the box entitled “The semiconductor shortage and its implication for euro area trade, production and prices”, Economic Bulletin, Issue 4, ECB, 2021.
- See also the box entitled “The US and UK labour markets in the post-pandemic recovery” in this issue of the Economic Bulletin.
- An alternative indicator of supply bottlenecks is shipping prices, but these provide only a partial picture of the phenomenon, as they only cover the logistics sector, whereas the PMI SDT is broader and co-moves more with economic activity.
- This identification strategy was inspired by Bhushan, S. and Struyven, D., “Supply Chains, Global Growth, and Inflation”, Global Economics Analyst, Goldman Sachs Research, 20 September 2021. The use of global PMI manufacturing output measure in this VAR model enables a timely estimation of the supply chain shock. This would not be possible using hard data on economic activity, which are published with a longer lag.
- At the peak of the COVID-19 shock in April 2020, supply chain disruptions were the main reason for the longer delivery times.
- The impulse response functions of the VAR suggest that, after a one period shock, the effects on inflation dissipate in six to nine months, while those on real variables take around four months.
- See the box entitled “Main findings from the ECB’s recent contacts with non-financial companies”, ECB Economic Bulletin, Issue 7, ECB, 2021; Oxford Economics, Research Briefing Global, “Supply chain problems peaking, but risks remain” by Tim Hunter, 18 November 2021; The Beige Book, Federal Reserve System, 20 October 2021; The CFO Survey, Duke University, Federal Reserve Bank of Richmond and Federal Reserve Bank of Atlanta, 14 October 2021; Business Outlook Survey of Industrial and Service Firms, Banca d’ Italia, 8 November 2021.