
1 Introduction
Cash is currently the only form of public money in the euro area. The Eurosystem’s cash strategy ensures that cash remains widely available and accepted as a means of payment and store of value.
In this context, in 2021 the ECB launched its first survey on the usage of cash among companies, referred to as Companies’ Survey on Cash in this document. The purpose of this survey was to understand companies’ strategic view on the current and future use and acceptance of cash. More specifically, the objectives of the report on cash were:
- to understand companies’ acceptance of and satisfaction with cash and cash services, acceptance of cash compared with other means of payment and the perceived advantages of the former, satisfaction with the cash services of banks and cash-in-transit companies, and offers of additional cash services such as cashback and cash-in-shop;
- to understand companies’ views on the future of cash, their plans to automate cash operations/tills and their plans to accept cash in the future;
- to understand cash withdrawals and deposits behaviour.
The sample comprised companies employing one or more persons in the retail, accommodation, food, arts, entertainment and recreation and other sectors excluding the financial sector (banks, insurance, etc.) and companies working within the cash cycle[1] across the euro area. However, the analysis in this paper only focuses on four key sectors of interest – the retail trade, hotels, restaurants and cafes, as well as the arts, entertainment and recreation sectors – as these are the sectors which have the most private customers.[2]
The key findings of the Companies’ Survey on Cash can be summarised as follows.
- Companies have differing preferences. 24% of companies prefer consumers to pay with cash, followed by contactless cards with 20% of preferences, debit PIN cards with 17% and credit PIN cards with 16%. Overall, cards as a whole (including contactless cards) account for 53% of preferences.
- Almost all companies accept cash (96%) and a variety of other means of payment are also accepted. Of the companies that accept cash, 5% expect to stop accepting cash in the future.
- When firms are deciding whether to accept a means of payment, security of payment (94%) and reliability of payment methods (92%) are the most important criteria. Companies generally consider cash to be better in terms of overall costs, transaction speed and reliability compared with other payment methods.
- A large majority of companies deposit cash (85%), while withdrawals are used by around a quarter of companies. Over-the-counter is the most common used method (64%) for cash withdrawals, followed by ATM (45%).
- Very few companies offer cashback or cash-in-shop[3] services at the present time. Likewise, when asked, few companies said they were planning to introduce these services in the future.
2 Cash preference and acceptance
This chapter focuses on firms’ preference for and acceptance of cash compared with other means of payment, as well as their expectations of future cash acceptance.[4] Cash and contactless cards are the preferred means of payment, followed by debit PIN cards. Almost all firms accept cash and a variety of alternative means of payment are also accepted. Security and reliability are the most important criteria for acceptance of a means of payment. Firms consider cash to be better in terms of overall costs, transaction speed and reliability compared with other payment methods.
2.1 Preferred means of payment
Firms were asked which means of payment they preferred to be paid with. About a quarter (24%) of firms indicated a preference for cash (Chart 1, panel a). A fifth (20%) of firms indicated contactless cards, with slightly fewer opting for debit or credit PIN cards (17% and 16% respectively). Although debit and credit cards might be considered by the general public to be a single payment instrument, for consumers and companies they differ, for example, in terms of cost, ease of use and speed of transaction. They are therefore treated separately in the survey.[5] Nonetheless, cards – with or without contactless technology – are preferred by 53% of firms. Very few firms preferred other payment methods, with only 2% opting for direct debit or other means such as mobile payments. There is significant variation at the country level. Chart 1, panel b shows that Slovakia stands out with over four in ten (45%) firms preferring cash, followed by over a third (36%) in Germany. In nine euro area countries fewer than a fifth (20%) of firms prefer their customers to pay in cash, with only 4% in Finland. Comparing the four sectors of interest (Chart 1, panel c), i.e. the retail trade, hotels, restaurants and cafes, and the arts, entertainment and recreation sectors, the restaurants and cafes sector has the largest percentage of firms preferring cash (38%), followed by arts, entertainment and recreation (23%) and hotels (21%).
Chart 1
Which means of payment do companies prefer to be paid with?
a) Distribution of preferences, euro area

b) Share of companies preferring cash by country

c) Share of companies preferring cash by sector

Source: Companies’ Survey on Cash.
Notes: Preferences across means of payment for the four sectors of interest: retail trade, hotels, restaurants and cafes, and arts, entertainment and recreation. The euro area-level share of firms that prefer cash (24%) is reported in panel a). DK stands for “Don’t know”, while NA stands for “No answer”.
2.2 Accepted means of payment
Firms were also asked which means of payment they accept. Chart 2 (panel a) shows that most euro area firms surveyed in the sectors of interest accept cash (96%). Following cash, just under nine out of ten firms (87%) accept credit cards and around eight out of ten firms accept contactless cards (82%) or debit cards (80%). The survey shows relatively little variation at the country level in respect of the proportion of firms accepting cash, and in almost all cases at least nine out of ten firms accept this means of payment (Chart 2, panel b). In Cyprus all firms accept cash, followed by Germany (98%) and Austria (97%), while Malta reports the lowest acceptance rate (87%). Across the sectors of interest (Chart 2, panel c), restaurants and cafes (99%), hotels (97%) and retail trade firms (97%) accept cash significantly more than arts, recreation and entertainment firms (79%).
Chart 2
Which means of payment do companies accept?
a) Acceptance of various payment instruments, euro area

b) Share of companies accepting cash by country

c) Share of companies accepting cash by sector

Source: Companies’ Survey on Cash.
Notes: Acceptance across means of payments for the four sectors of interest: retail trade, hotels, restaurants and cafes, and arts, entertainment and recreation. The euro area-level share of firms accepting cash (96%) is reported in panel a). DK stands for “Don’t know”, while NA stands for “No answer”.
2.3 Criteria for acceptance
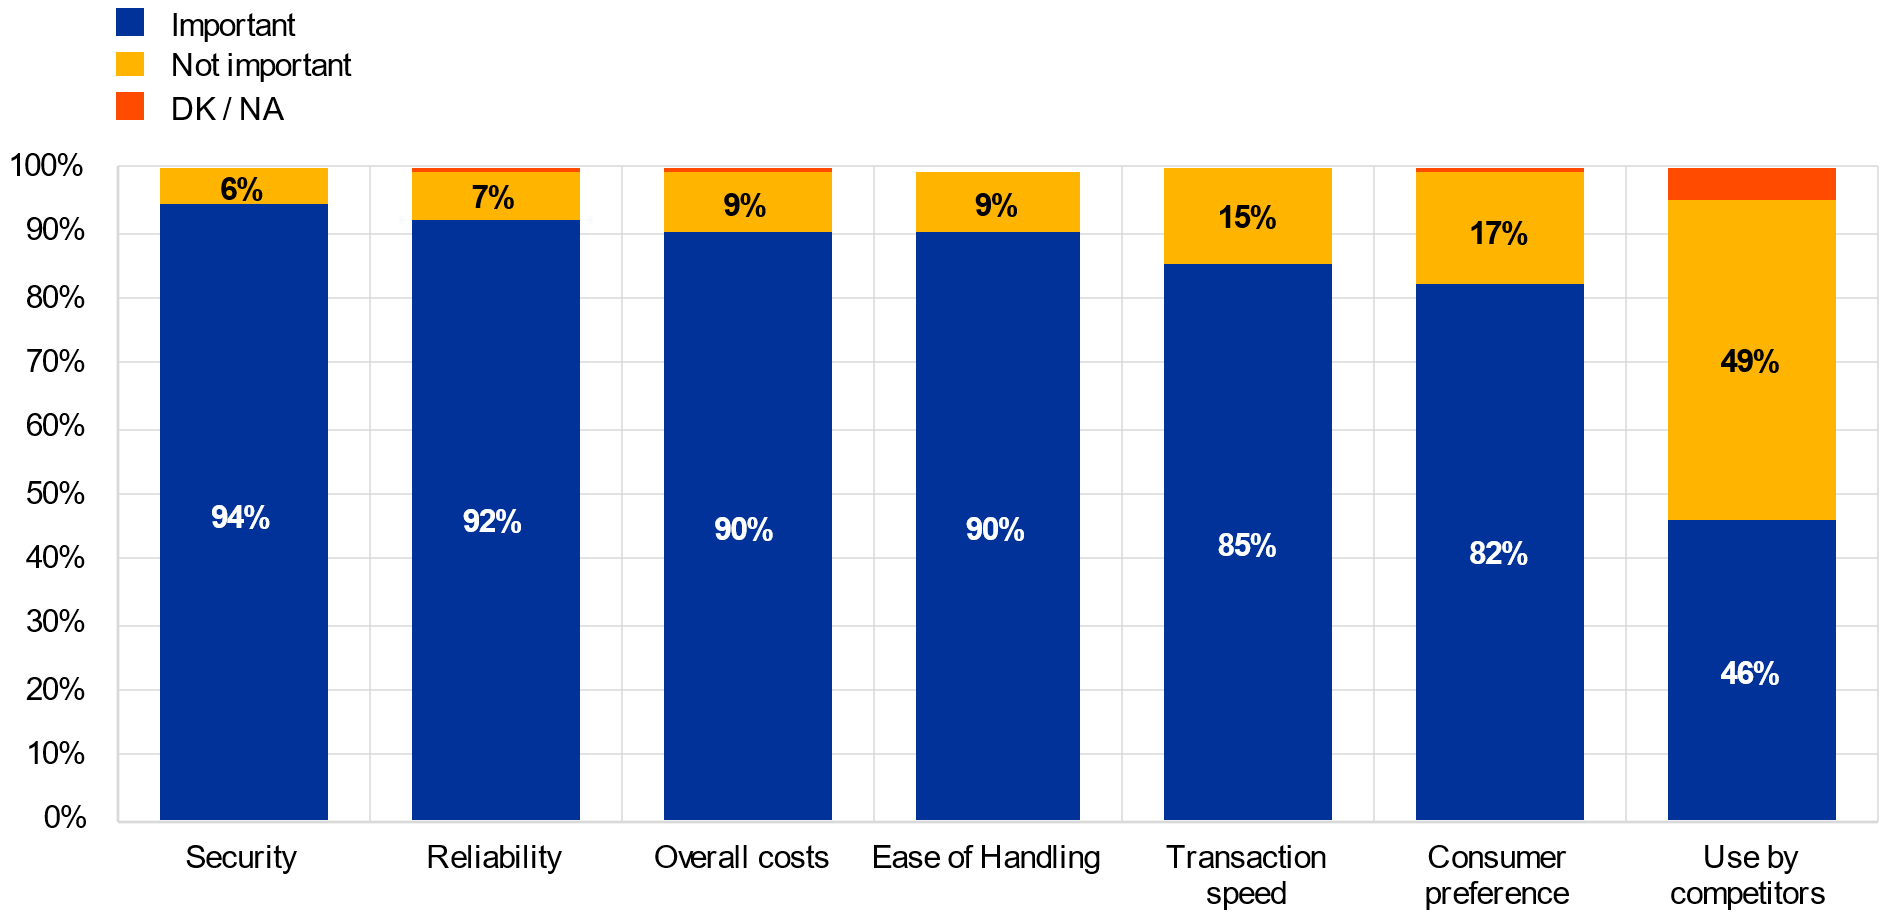
Firms were asked to assess how important certain criteria are when deciding whether to accept a means of payment. Apart from “use by competitors” (46%), the overwhelming majority of firms in the euro area find each of the criteria important at least to some extent (Chart 3, panel a). However, the extent of that importance varies. Security of payment (e.g. against hacking or robbery) is a particularly important criterion, with over nine out of ten (94%) firms seeing it as important. Nearly as many (92%) see reliability and sensitivity to the malfunctioning of payment methods as important. Nine out of ten firms see overall costs (90%) and ease of handling (90%) as important, followed by transaction speed (85%) and consumer preference (82%). By contrast, most firms think that use by competitors is not an important criterion. At the country level (Chart 3, panel b), in all euro area countries most firms see security as an important criterion when deciding whether to accept a means of payment. In fourteen countries at least nine out of ten firms (90%) gave this response. For firms in Latvia, at only two-thirds (66%), security is considered relatively less important. In Malta all firms see this criterion as important, as do nearly all those polled in Greece and Cyprus (97%).
Specifically, security is an important criterion across all sectors of interest (Chart 3, panel c), with over nine-tenths (95%) of firms in the retail trade seeing it as important, falling to nine-tenths (90%) of firms in the arts, entertainment and recreation sector.
Chart 3
Criteria for acceptance of a means of payment.
a) Importance of various criteria, euro area
b) Importance of security by country

c) Importance of security by sector

Source: Companies’ Survey on Cash.
Notes: Criteria for acceptance of means of payments for the four sectors of interest: retail trade, hotels, restaurants and cafes, and arts, entertainment and recreation. Importance of security at the euro-area level (94%) is reported in panel a. DK stands for “Don’t know”, while NA stands for “No answer”.
2.4 Cash versus other means of payment
Another important series of questions focused on how cash compares with a number of alternative means of payment as far as transaction speed, reliability/sensitivity to malfunctioning, security, overall costs and ease of handling are concerned. In the data below, the focus is on debit and credit cards and mobile payments.
Cash is generally perceived as a means of payment which is more reliable and less sensitive to malfunctioning and which incurs fewer costs[6] than debit cards used with contactless technology (Chart 4, panel a). However, debit cards used with contactless technology are considered to be more secure. Similarly, as Chart 4, panel b shows, cash compares favourably with credit cards used with contactless technology in terms of overall costs, followed by transaction speed. Once again, credit cards are considered to be more secure.
Finally, cash compares favourably with mobile payments for all features including transaction speed. It is important to note that the Companies’ Survey on Cash collects companies’ perceptions rather than the actual transaction speed of payments. The clear perception of better reliability and lower sensitivity to malfunctioning of cash versus mobile payments may be one reason for the better perceived transaction speed of cash payments.
Chart 4
Cash versus other means of payment: how does cash compare with .. in terms of ..?
a) Debit cards

b) Credit cards

c) Mobile payments

Source: Companies’ Survey on Cash.
Notes: Comparison of cash versus other selected means of payment, such as debit and credit cards (using contactless technologies) and mobile payments. The sample base is composed of companies that accept both cash and the payment instrument the comparison is being made with. The figures reported are euro area aggregates for the four sectors of interest: retail trade, hotels, restaurants and cafes, and arts, entertainment and recreation. Yellow means “cash is better than..”, red means “cash is worse than..” and blue means “cash is identical to..”. DK stands for “Don’t know”, while NA stands for “No answer”.
2.5 Future cash acceptance and reasons
Firms that accept cash were asked whether they will continue to do so in the future. Over nine out of ten (94%) firms that currently accept cash said they will continue to do so, while 5% said they will not (Chart 5, panel a). The country breakdown (Chart 6) shows little variation across countries, with a few exceptions. Those firms who said they will stop accepting cash were asked when they might decide to do so (Chart 5, panel b). The most common response – from over a third (36%) of firms – was “in three to five years”. Slightly fewer (31%) said that they might stop accepting cash after more than five years, while fewer than a fifth said they might do so in one to two years or in less than one year.
Firms that said that they will not accept cash in the future were also asked for their reasons (Chart 5, panel c). Nearly a third of firms said they might stop accepting cash because it is time consuming (32%) or because it is not used often enough by their clients (31%). Slightly fewer said it is inconvenient or difficult to deposit or withdraw (29%) or that it poses a security risk (29%), while a quarter (25%) see it as risky in terms of internal fraud. Just over one in ten mentioned the high risk of counterfeiting (13%) or the risk of coronavirus (COVID-19) infection (12%). Fewer than one in ten firms said they are likely to stop accepting cash because it is expensive (6%) or because it requires specialist knowledge or equipment (2%).
Chart 5
Future cash acceptance, and timing and reasons for non-acceptance.
a) Future cash acceptance

b) Timing of cash non-acceptance

c) Reasons for non-acceptance

Source: Companies’ Survey on Cash.
Notes: Future cash acceptance and the timing and reasons for non-acceptance of companies that currently accept cash. The figures reported are euro area aggregates for the four sectors of interest: retail trade, hotels, restaurants and cafes, and arts, entertainment and recreation. DK stands for “Don’t know”, while NA stands for “No answer”.
Chart 6
Future cash acceptance by country

Source: Companies’ Survey on Cash.
Notes: Future cash acceptance of companies that currently accept cash by country. The figures reported are country-level aggregates for the four sectors of interest: retail trade, hotels, restaurants and cafes, and arts, entertainment and recreation. The euro area-level share of firms accepting cash in the future (94%) is reported in Chart 5 (panel a). DK stands for “Don’t know”, while NA stands for “No answer”.
3 Cash withdrawal and deposit behaviour
This section analyses firms’ cash withdrawal and deposit behaviour. A large majority of companies deposit cash, but only a minority withdraw it. In particular, with regard to withdrawal behaviour there are significant variations across countries (Chart 7, panel b).
Chart 7
Share of companies that withdraw cash and deposit cash
a) Deposits and withdrawals – euro area

b) Deposits and withdrawals by country

Source: Companies’ Survey on Cash.
Notes: The figures reported are euro area aggregates for the four sectors of interest: retail trade, hotels, restaurants and cafes, and arts, entertainment and recreation
3.1 Cash withdrawals
Just over a quarter (28%) of companies withdraw cash. The most common method – withdrawal over-the-counter[7] at the bank – is used by 64% of those respondents who withdraw cash (Chart 8, panel a). Withdrawals via an ATM were mentioned in 45% of cases and withdrawals via a cash-in-transit company[8] in 20% of cases.
Chart 8
How companies withdraw cash
a) Euro area

b) Most frequent method used to withdraw cash by country and share of companies using the method

Source: Companies’ Survey on Cash.
Notes: The figures reported are euro area aggregates for the four sectors of interest: retail trade, hotels, restaurants and cafes, and arts, entertainment and recreation. Respondents were asked to report all cases that apply.
There is considerable variation in withdrawal methods across countries (Chart 8, panel b). In six countries the most common response was that cash is withdrawn via an ATM, and in three countries cash-in-transit companies are the most frequently used withdrawal method.
Chart 9
Why companies withdraw cash
a) Euro area

b) Share of companies withdrawing cash to pay suppliers by country

Source: Companies’ Survey on Cash.
Notes: The figures reported are euro area aggregates for the four sectors of interest: retail trade, hotels, restaurants and cafes, and arts, entertainment and recreation. Respondents were asked to report all cases that apply.
Most companies (80%) that withdraw cash do so to ensure they have change available (Chart 9, panel a). A fifth of firms (20%) said they withdraw cash to pay suppliers, while fewer than one in ten do so to pay taxes or other bills (9%), to pay salaries (7%) or for other, unspecified reasons (9%). The share of companies withdrawing cash to pay suppliers varies significantly across countries (see Chart 9, panel b).
3.2 Cash deposits
Over eight out of ten (85%) companies deposit cash.
Chart 10
Cash deposits
a) How companies deposit cash, euro area

b) Most frequent method used to deposit cash by country and share of companies using the method

Source: Companies’ survey on cash.
Notes: The figures reported are euro area aggregates for the four sectors of interest: retail trade, hotels, restaurants and cafes, and arts, entertainment and recreation. Respondents were asked to report all cases that apply. CIT stands for cash-in-transit.
The most common methods used to deposit cash are via a cash-in machine[9] (53%) and over-the-counter (49%) at the bank (Chart 10, panel a). A fifth of companies (20%) use bank night vaults[10], while just under a fifth (17%) use the services of a cash-in-transit company to deposit cash.
The use of different deposit methods varies significantly across countries. Both cash-in machines and over-the-counter at the bank are the most common methods used to deposit cash in eight countries (Chart 10, panel b). In Slovenia and Finland the most frequently used method is a cash-in-transit company while in Malta it is bank night vaults. Differences across sectors are much less pronounced.
4 Cash services
There now follows an overview of the share of firms providing different cash services and the current and future status of the automation of cash operations is also addressed. Only a third of companies in the sectors analysed have automated their cash operations, and of those which have not, the majority have no plans to do so.
Services such as cashback and cash-in-shop are not widely offered across the euro area, the main reason for this being the companies’ lack of familiarity with these services.
4.1 Automation of cash operations
It is important to reach a better understanding of how firms handle cash as part of their professional activities. For this reason, firms were asked whether they had already automated their cash operations and, if not, whether they had plans to do so in the future.
On average, 63% of firms said they do not automate their cash operations, with 23% saying that they have cashier desks with smart cash tills[11] (Chart 11, panel a)
Chart 11
Cash automation
a) Have you automated your cash operations?(euro area)

b) Do you plan to automate your cash operations in the future?(euro area)

Source: Companies’ Survey on Cash.
Notes: The figures reported are euro area aggregates for the four sectors of interest: retail trade, hotels, restaurants and cafes, and arts, entertainment and recreation. Respondents were asked to report all cases that apply. DK stands for “Don’t know”, while NA stands for “No answer”. Self-checkouts are self-service stations, located in a shop, at which customers pay for their purchases themselves. This solution significantly reduces staff interaction with cash.
Those firms that had replied “no” when asked whether they had automated their cash operations were asked whether they had any plans to do so. Most of these firms (80%) said they had no such plans (Chart 11, panel b). Just 5% are planning to introduce cashier desks with smart tills and 4% are planning to introduce another type of automatisation system.
4.2 Cashback and cash-in-shop services
Cashback and cash-in-shop services provided by merchants might increase the number of points of access that make cash available to consumers. Cashback is the provisioning of cash by a merchant. It is only available in conjunction with a purchase of goods or services and is only offered on the explicit request of the customer. On the other hand, cash-in-shop permits a consumer to withdraw cash at a merchant but, as the operation is not linked to the purchase of goods, it can be performed separately. Although it is not unheard of for hotels and restaurants to provide cashback and cash-in-shop, the practice is more common in the retail trade sector and, therefore, all the charts in Section 4.2 show data for retailers only.
Overall, cashback has not taken off, with only 11% of retailers saying they provide the service. Looking at individual countries and acknowledging potential data limitations given the novelty of these services, the greatest availability of cashback services is in Belgium, Finland and Ireland which all have a provision of over 40% (Chart 12, panel b).
Chart 12
Cashback services
a) Provision of cashback services, euro area

b) Share of companies that provide cashback services by country

Source: Companies’ Survey on Cash.
Notes: The figures reported are euro area aggregates for the retail trade only. The concepts of cashback and cash-in-shop were explained to the respondent during the survey. However, as these relatively new concepts may have been misunderstood by some respondents, the results for these particular questions should be treated with caution.
Cash-in-shop is offered by very few firms (6%) at the euro area level. 94% of enterprises in the retail trade sector replied that they do not offer cash-in-shop services (Chart 13, panel a), while the share of companies that provide cash-in-shop services in Finland and Belgium stands out at 36% and 35% respectively (Chart 13, panel b).
Chart 13
Cash-in-shop services
a) Provision of cash-in-shop services, euro area

b) Share of companies that provide cash-in-shop services by country

Source: Companies’ Survey on Cash.
Notes: The figures reported are euro area aggregates for retail trade only. The concepts of cashback and cash-in-shop were explained to the respondent during the survey. However, as these relatively new concepts may have been misunderstood by some respondents, the results for these particular questions should be treated with caution. DK stands for “Don’t know”, NA stands for “No answer”.
The companies that replied that they do not provide cashback were asked whether they had any plans to introduce it in the future. The overwhelming majority (82%) said they did not (Chart 14).
Chart 14
Future plans to offer cashback and cash-in-shop over a five-year horizon
Euro area

Source: Companies’ Survey on Cash.
Notes: The figures reported are euro area aggregates for retail trade only. The concepts of cashback and cash-in-shop were explained to the respondent during the survey. However, as these relatively new concepts may have been misunderstood by some respondents, the results for these particular questions should be treated with caution.
It is important to understand what drives companies when they are deciding whether to provide these services or not.
Chart 15 displays the major drivers which cause firms not to offer cashback services. These are, specifically, a lack of knowledge of the services and an expectation of low demand from customers (around 57% of respondents for both drivers combined). By contrast, the fees charged for this kind of service do not seem to represent an obstacle to adoption, accounting for only 10% of respondents.
Chart 15
Why are you not offering cashback services to your customers?

Source: Companies’ Survey on Cash.
Notes: The figures reported are euro area aggregates for retail trade sector only. The concepts of cashback and cash-in-shop were explained to the respondent during the survey. However, as these relatively new concepts may have been misunderstood by some respondents, the results for these particular questions should be treated with caution.
5 Conclusions
The report shows that cash is very widely accepted by companies in the retail trade sector, as well as in the hotels, restaurants and cafes and arts, entertainment and recreation sectors. In these sectors 96% of the companies accept cash. These results provide further support for the Eurosystem’s cash strategy which is to continue to ensure that cash remains widely available and accepted as a means of payment and store of value.
On the other hand, card payments (credit cards, debit cards and contactless cards) are also accepted by a large majority of companies. Mobile payments are accepted by a significantly lower share (around 30%) of companies.
When deciding to accept a means of payment, security of payment (94%) and reliability of payment methods (92%) are the most important criteria for firms, while overall costs and ease of handling are mentioned by 90% of firms. Companies consider cash to be better in terms of overall costs, transaction speed and reliability than other payment methods.
As regards preferences, one in four of companies prefer their customers to use cash, but firms also have a preference for a variety of different means of payment. For instance, card payments in general are preferred by more than half of companies.
Deposit services are widely used (85%), while relatively few enterprises withdraw cash (28%) or use cash-in-transit services (25%). Cash-in machines (53%) and over-the-counter (49%) are the most frequent ways to deposit cash, while over-the-counter is the most commonly used method (64%) for cash withdrawals, followed by ATM (45%).
Very few companies offer cashback or cash-in-shop services, and a majority of those not offering such services have no plans to do so in the future. The main reasons for this are a lack of knowledge about the services and an expectation of low demand from customers.
Annexes
See more.
List of references
Bagnall, J., Bounie, D., Huynh, K., Kosse, A., Schmidt, T., Schuh, S. and Stix, H. (2016), “Consumer Cash Usage: A Cross-Country Comparison with Payment Diary Survey Data”, International Journal of Central Banking, Vol. 12, pp. 1-62.
Esselink, H. and Hernandez, L. (2017), “The use of cash by households in the euro area”, Occasional Paper Series, No 201, ECB, Frankfurt am Main, November.
European Central Bank (2020), Study on the payment attitudes of consumers in the euro area (SPACE), December.
© European Central Bank, 2022
Postal address 60640 Frankfurt am Main, Germany
Telephone +49 69 1344 0
Website www.ecb.europa.eu
All rights reserved. Reproduction for educational and non-commercial purposes is permitted provided that the source is acknowledged.
For specific terminology please refer to the ECB glossary (available in English only).
HTML ISBN 978-92-899-5406-8, doi:10.2866/60233, QB-04-22-029-EN-Q
See Annex B.
See Annex C. For some countries the smaller sample size implies that country-level comparisons should be treated with caution, although some differences can, nevertheless, be analysed across the reports. When it is deemed necessary, only euro area aggregates are shown.
Cashback is the provisioning of cash by a merchant. It is only available in conjunction with a purchase of goods or services and is only offered on the explicit request of the customer. On the other hand, cash-in-shop is a service offered by a merchant, on behalf of payment service providers, to withdraw cash, which is not linked to a purchase of goods or services.
Some results may not add up to 100% as percentages are rounded to ease readability.
Bagnall et al. (2016) point out that the regulation of credit card and debit card interchange fees and the composition of non-cash payments vary significantly across countries. Their findings show that consumers perceive that credit and debit cards have different costs, acceptance and ease of use compared with cash.
The cost of cash across countries depends on the share of cash usage within single countries, as fixed costs are higher. The higher the volume of cash usage in a country, the lower the unit cost. Therefore, only euro area results are shown.
Over-the-counter refers to a cash deposit in or cash withdrawal from a bank account at a bank branch.
Cash-in-transit company refers to a logistics company which transfers banknotes, coins and other items of value from one location to another. Such locations include the premises of national central banks, cash centres, ATMs and retailers.
A cash-in machine is a device that allows a consumer or a merchant to deposit cash.
A bank night vault is a secured box exterior to a bank in which account holders can deposit cash and cheques outside normal banking hours.
These tills look and operate like standard cash tills but they use smart technology to count cash as it enters and leaves the till.
-
6 October 2022