
Emerging markets’ vulnerability to a reassessment of risk
Published as part of the Financial Stability Review, May 2021.
Financial conditions in emerging market economies (EMEs) have weathered the COVID-19 crisis well so far, despite an intense but short-lived stress episode at the onset of the pandemic. Financial conditions in EMEs have rebounded strongly since March 2020; they currently stand at levels similar to before the pandemic thanks to lower bond spreads and higher equity prices. Capital flows have also recovered, with market segments typically judged to be riskier by foreign investors, such as equity and local currency debt, recording strong inflows in the second half of last year. This rebound helped to relieve pressures on financial systems and support activity in EMEs. Nevertheless, recent concerns about rising bond yields and higher than expected inflation in advanced economies have translated in a tightening of financial conditions and slowdown of capital flows to EMEs. In this context, this box assesses potential vulnerabilities facing large EMEs and the risks posed to euro area financial stability.
Many EMEs are benefiting from more solid fundamentals than in past crises, although high debt burdens and exposures to the US dollar and foreign investors may pose challenges for some countries. EMEs, with some notable exceptions, generally entered the pandemic on a sounder footing compared to past major crises (see Chart A, left panel). In recent years, EMEs have reduced their current account deficits, accumulated reserves, strengthened their banking systems and improved their institutions and policy frameworks.[2] At the same time, the fiscal support provided during the pandemic, which follows a recent trend in rising sovereign indebtedness, resulted in increasing fiscal vulnerabilities. Additionally, EME corporates have increasingly tapped international markets over the past decade, with the share of corporate USD-denominated debt to GDP more than doubling in a number of major EMEs. Larger debt levels may, to some extent, reflect the view of investors that greater market depth and improved policy institutions have increased many EME’s capacity to carry debt. Yet, rolling over the debt crucially depends on maintaining market access at favourable financing conditions.
Global factors have been the most important driver of the recovery in EME capital flows over the past year, suggesting there is a risk of reversal. A structural decomposition of capital flows to EMEs shows that the main drivers of these flows are global risk sentiment and the US monetary policy stance (see Chart A, right panel).[3] While capital outflows during the March 2020 turmoil were larger in those EMEs with higher shares of USD-denominated debt, this differentiation became blurred during the recovery phase, when capital flows to these countries recovered quickly and recorded large inflows, consistent with a search for yield behaviour (see Chart B, left panel). Nevertheless, this distinction returned in the first months of this year, when the slowdown of capital inflows appeared to be more substantial in more USD-exposed economies. The same picture emerges when countries are differentiated according to their external debt burden instead (i.e. debt held by foreign investors).
Chart A
EMEs entered the pandemic with better fundamentals, but capital flows are mainly driven by the global risk appetite and monetary policy stance in the United States
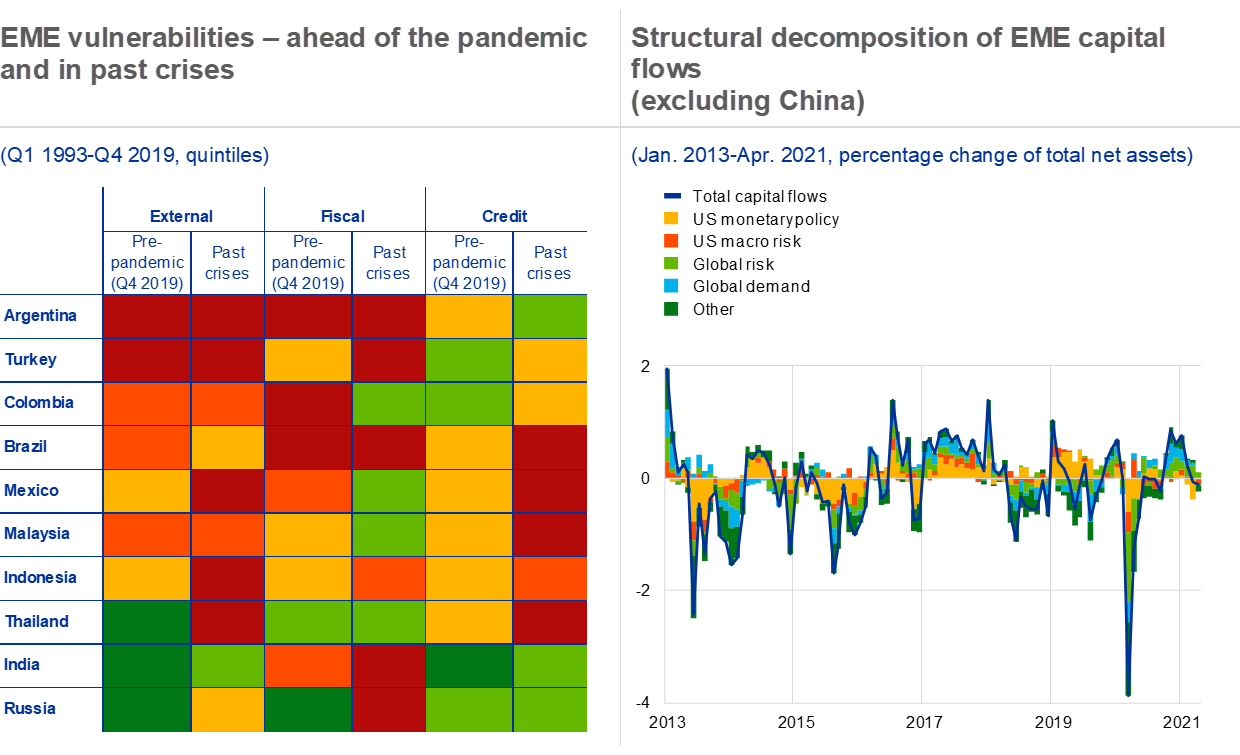
Sources: International Monetary Fund, Bank for International Settlements, World Bank, Institute of International Finance, Haver Analytics, EPFR Global and ECB calculations.
Notes: Left panel: country-specific vulnerability indices in each category (external, fiscal and credit) are colour-coded according to the quintile to which they belong in their respective distributions, where dark green denotes the 1st quintile (lowest risk) and dark red the 5th quintile (largest risk). Vulnerability indices in each category are constructed by averaging across the following variables: (1) two-year average of the current account/GDP, three-year average of external debt/GDP, three-year growth rate of short-term external debt in total external debt, and reserve adequacy (IMF-ARA metric); (2) three-year average of government debt/GDP, two-year average of fiscal deficit, three-year average of the share of non-resident holdings of government debt in total debt; (3) three-year growth of total credit to the private sector/GDP and two-year average of credit gap. Variables are first normalised by subtracting the respective mean and dividing by the standard deviation of the whole sample. Data are quarterly, Q1 1993-Q4 2019. Dates for past crises are: Q2 1993 for India; Q4 1994 for Mexico and Brazil; Q3 1997 for the Southeast Asian countries, Q2 1998 for Colombia, Q3 1998 for Russia; Q4 2000 for Turkey; Q4 2001 for Argentina. Right panel: total net assets are the total dollar amounts invested in EME-dedicated funds. The decomposition is derived from a structural Bayesian vector autoregression (BVAR) with sign and magnitude restrictions using the BEAR toolbox by Dieppe, A., Legrand, R. and van Roye, B., “The BEAR toolbox”, Working Paper Series, No 1934, ECB, July 2016. The model decomposes capital flows into four shocks: i) US monetary policy (tightening) shocks are identified by a decline in equity prices as well as a rise in risk-free bond yields, EMBI spreads and the dollar; ii) US macroeconomic risk shocks are identified by a decline in equity prices, risk-free bond yields and the dollar, and an increase in the EMBI spread; iii) global risk shocks are identified by a decline in equity prices and risk-free bond yields as well as a strong rise in EME spreads and the dollar; iv) global demand shocks are identified by a decrease in risk-free bond yields and equity prices as well as an increase in the dollar and a weak increase in EMBI spreads. EME-specific shocks are captured in the residual “other” category.
Looking ahead, risks to EME financial stability could arise from a reversal in global risk sentiment, as well as from rising yields in the United States and other advanced economies and an appreciating US dollar. Risks may re-emerge as bond yields and inflation expectations in advanced economies increase. The net impact of such increases is uncertain, depending on the nature of the underlying driver. Nevertheless, even in a positive scenario of yield increases due to an improving global outlook, more indebted EMEs could come under pressure, especially those that are more exposed to US dollar and foreign investors. In a negative scenario, an abrupt risk reversal driven by a reassessment of the global outlook or the monetary policy stance in major advanced economies might trigger a sharp tightening in financial conditions, renewed capital outflows and pressures on domestic currencies, as vividly illustrated by past experiences, such as the taper tantrum episode back in 2013. Moreover, a prolongation of the pandemic caused by slower vaccination progress could put strains on the policy space available to governments in EMEs to support activity and financial systems.
Chart B
Risk reversals rapidly translate into EME capital flow slowdowns. A shock affecting China could weigh on financial stability in the euro area, but other individual EME shocks appear less relevant

Sources: EPFR Global, Institute of International Finance, Haver Analytics, Bloomberg Finance L.P. and ECB calculations.
Notes: Left panel: bars show capital flows to/from EME-dedicated funds for 14 countries. The “high USD debt” group contains countries whose three-year average ratio of non-financial sector debt denominated in USD to GDP stands in the 4th and 5th quantiles of the distribution for this variable across the whole sample since 2005. These countries are Argentina, Brazil, Chile, Colombia, Indonesia, Mexico, South Africa and Turkey. The “low US debt” group contains India, Malaysia, Russia, South Korea, Taiwan and Thailand. The latest observation is for 5 May 2021 for capital flows (weekly data). The three periods over which capital flows are computed are: 19 February-25 March 2020, corresponding to the start of the financial market turmoil and its trough; 1 April 2020-3 February 2021, corresponding to post-crisis recovery; and 11 February 2021-latest (5 May 2021). The week of 11 February is the week in which concerns about rising yields in the United States started to show in capital flows to EMEs. Right panel: the chart depicts the peak/trough impulse response of the euro area bank CDS (average of nine euro area bank CDS) to a 1 basis point country-specific shock using local projections (Jordà, O., “Estimation and Inference of Impulse Responses by Local Projections”, American Economic Review, Vol. 95, No 1, March 2005, pp. 161-182). Upper and lower bands depict 90% confidence intervals. The EME country shock is defined as the residual from a reduced-from regression model where the monthly country-specific EMBI sovereign spread is regressed on EMBI global sovereign spread and the US shadow rate (by Wu, J. and Xia, F., “Measuring the Macroeconomic Impact of Monetary Policy at the Zero Lower Bound”, Journal of Money, Credit and Banking, Vol. 48, No 2-3, March-April 2016, pp. 253-291), all in first differences. The impulse response functions of the average euro area banks’ CDS to individual EME shock are estimated on a country-by-country basis taking a horizon of six months and controlling for the lagged dependent variable and the lagged values of the following variables: euro area industrial production, a measure of global risk appetite (the VIX), a measure of euro area and US monetary policy (the shadow rates of the euro area and the United States) and a measure of economic news (the Citigroup Economic Surprise Index for the euro area).
Euro area financial stability could be vulnerable to wider turbulence affecting a number of EMEs, although country-specific shocks would be unlikely to have a sizeable impact. The euro area’s financial and trade links with most individual EMEs are typically small, despite large cross-country heterogeneity. The reaction of euro area bank CDS prices to country-specific shocks in EMEs suggests that, with the exception of China, such idiosyncratic shocks would not have a sizeable impact on financial stability in the euro area (see Chart B, right panel). Yet stress simultaneously affecting several EMEs or a crisis in a large EME could act as a catalyst for a wider reassessment of global risk via a loss of investor confidence, with broader consequences for the euro area and global financial stability.
- With contributions from Pablo Andrés Anaya Longaric, Sungyup Chung, Johannes Gräb and Elena Vollmer.
- For a more detailed comparison with past crises episodes, see the box entitled “Emerging market vulnerabilities – a comparison with previous crises”, Economic Bulletin, Issue 8, ECB, 2018.
- This confirms the findings of the report by the Committee of the Global Financial System (CGFS) on “Changing patterns of capital flows” which shows that sudden stops in EME can be triggered by changes in global liquidity and risk appetite, and that the role of global factors has become larger since the global financial crisis (CGFS, 2021)