


A closer look at consumers’ inflation expectations – evidence from the ECB’s Consumer Expectations Survey
Published as part of the ECB Economic Bulletin, Issue 7/2022.
With the strong increase in euro area HICP inflation over the past 18 months, monitoring and understanding the behaviour of consumers’ inflation expectations have become increasingly important. In this box, we analyse developments in consumers’ inflation expectations[1] using data from the ECB’s Consumer Expectations Survey (CES), which was launched in 2020.[2] We look at changes in the entire distribution of inflation expectations, focusing on both mean and median inflation expectations, as the two measures can differ owing to skew in survey responses. We present the findings for consumers’ inflation expectations for one year ahead and three years ahead. Expectations for one year ahead measure shorter-term inflation expectations and are found to be more responsive to current inflation developments than those for longer horizons. Expectations for three years ahead measure more medium-term inflation expectations and, as such, better capture the potential risks of the de-anchoring of inflation expectations from a central bank’s inflation target.
After HICP inflation rose above 2% in July 2021, consumers’ inflation perceptions and expectations started to move upwards too. Between April 2020 – when the CES started – and July 2021, inflation was relatively low and consumers’ inflation perceptions and expectations were relatively stable at around 2% (Chart A).[3] As HICP inflation rose above 2% in the summer of 2021, shorter-term inflation expectations also gradually rose.[4] More medium-term inflation expectations remained broadly unchanged until March 2022, when median inflation expectations for three years ahead increased to 3% following the Russian invasion of Ukraine. They have, however, remained relatively stable since then, despite further substantial increases in headline inflation. Mean inflation expectations, which are more susceptible to outliers, have shown somewhat more movement.
Chart A
Consumers’ mean and median inflation expectations and HICP inflation
(percentages; annual percentage changes)

Sources: ECB’s Consumer Expectations Survey and Eurostat.
Notes: Weighted estimates. The median is computed on the basis of a symmetric linear interpolation that accounts for rounding of responses. Mean values are winsorised at the 2nd and 98th percentiles of each survey round and country.
The distributions of consumers’ inflation expectations have moved to the right, but the tails have not become substantially fatter. Chart B shows the histograms of consumers’ shorter-term and more medium-term inflation expectations, both on average over the period from April 2020 to February 2022 and in September 2022. While zero remains the most frequent response, the number of respondents expecting higher inflation has increased over time. Between April 2020 and February 2022, 2% and 3% were the second and third most frequent responses for both shorter-term and more medium-term expectations. However, in September 2022 these rose to 5% and 10% for shorter-term expectations and 3% and 5% for medium-term expectations.[5] At the same time, the higher moments of the distribution of expectations that capture movements of its tails – such as kurtosis and skewness – have not gone up substantially since inflation started rising in July 2021. This suggests that the upward movements of the distributions of expectations have not been driven by a fattening of the tails.
Chart B
Histogram of consumers’ inflation expectations
(percentages)
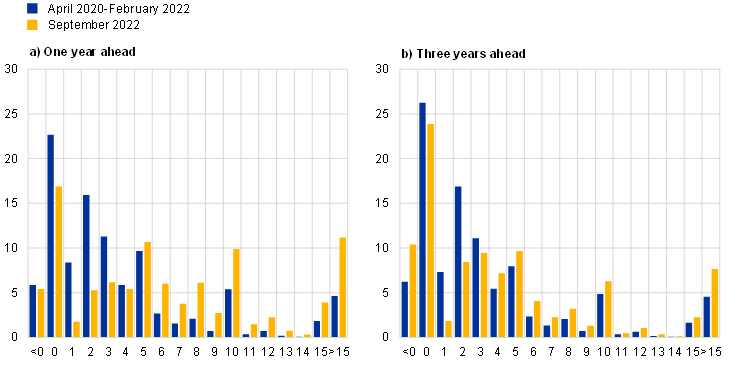
Source: ECB’s Consumer Expectations Survey.
Notes: The chart shows histograms of inflation expectations one year ahead (left-hand chart) and three years ahead (right-hand chart) in the period from April 2020 to February 2022 (i.e. before the Russian invasion of Ukraine) on average (blue bars) and in September 2022 (orange bars).
Although perceptions of actual inflation and short-term inflation expectations have risen, the term structure of consumers’ inflation expectations has remained strongly downward sloping. By combining information on inflation expectations at different horizons, a term structure of consumers’ inflation expectations can be constructed. Chart C shows that the term structure remains strongly downward sloping. In other words, consumers in the euro area continue to see that the current spike in perceived inflation has a significant transitory component and expect inflation to return closer to the levels seen in the past over the medium term, albeit above 2%.
Chart C
Term structure of median inflation expectations
(percentages; annual percentage changes)
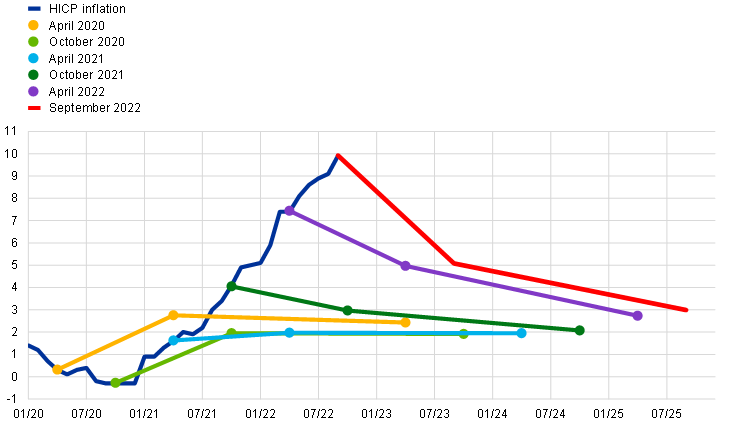
Sources: ECB’s Consumer Expectations Survey and Eurostat.
Notes: The chart shows median consumers’ inflation expectations at different horizons, over time. The lines are constructed by combining information about inflation expectations one year ahead and three years ahead for selected monthly waves of the CES.
The responsiveness of inflation expectations to inflation perceptions has increased slightly, but it remains noticeably lower for medium-term inflation expectations. A high sensitivity of longer-term inflation expectations to changes in current inflation (or inflation perceptions) could indicate potential risks of the de-anchoring of expectations, as it implies that shocks to current inflation could move expectations far away from a central bank’s target.[6] Chart D shows the estimated responsiveness of consumers’ inflation expectations to revisions in inflation perceptions, both one year and three years ahead.[7] The sensitivity of expectations to revisions in inflation perceptions has increased slightly since July 2020 and the upward shift has been of a broadly similar order of magnitude for both shorter-term and more medium-term expectations. In line with past evidence, the responsiveness of more medium-term expectations remains noticeably below that of short-term expectations.[8]
Chart D
Inflation perceptions in the regressions of short-term and medium-term inflation expectations
(coefficient on revisions to inflation perceptions)

Source: ECB’s Consumer Expectations Survey.
Notes: This chart plots estimates of the coefficients on the revisions to inflation perceptions from regressions of revisions to consumer inflation expectations one year ahead (blue line) and three years ahead (orange line). The respondent-level regressions are conducted on a rolling window of three CES waves while controlling for country-fixed effects. In all regressions, the coefficient on the revisions to inflation perceptions is statistically significant at a level of 1%.
Consumers’ uncertainty surrounding their inflation expectations has increased. One important feature of the ECB’s CES is that it contains a direct (probabilistic) question aimed at ascertaining how uncertain consumers are about their inflation expectations.[9] Specifically, consumers are asked to attribute probabilities to the likelihood of inflation being in specific ranges.[10] An indirect measure of consumer uncertainty is the frequency at which consumers report perceptions and expectations in multiples of five.[11] Chart E illustrates that the direct and indirect measures have co-moved very closely and show a similar U-shaped profile over the period from April 2020 to September 2022. Uncertainty was relatively high in April 2020 at the outset of the pandemic and lockdown measures. It then gradually eased back during 2020 and remained relatively low until around July 2021 when it started to increase again. A further rise in uncertainty occurred in the immediate aftermath of the Russian invasion of Ukraine. Uncertainty has remained at relatively elevated levels since then.
Chart E
Indicators of consumers’ uncertainty about their inflation expectations one year ahead
(left-hand scale: percentage points; right-hand scale: percentage of respondents)

Source: ECB’s Consumer Expectations Survey.
Notes: This chart plots: (i) the probabilistic-based indicator of uncertainty about inflation expectations reported by respondents on average (blue line); and (ii) the share of round responses (i.e. multiples of five) in total answers/responses (orange line) by CES wave (x-axis).
Overall, although consumers’ inflation expectations have reacted to higher inflation and heightened uncertainty, the term structure of inflation expectations remains strongly downward sloping. The movements in inflation expectations have not been driven by a fattening of the tails as such, but a shift in the main part of distribution, as well as an increased tendency to report rounded expectations of multiples of five, which reflects heightened uncertainty about the inflation outlook. The upward movement in expectations, the increase in uncertainty surrounding them and the increased sensitivity of medium-term expectations to perceived current inflation all call for continued close monitoring and analysis of consumers’ inflation expectations.
Available measures of inflation expectations vary across many dimensions, including agents (households/consumers, firms, professional macroeconomic forecasters and financial markets); type (survey-based or financial market prices); and horizon (short, medium and long-term). The inflation expectations of forecasters and financial markets represent those of professional macroeconomists. Household expectations are likely to be more varied depending on their knowledge of macroeconomic developments. In this context, relatively small movements should not be over interpreted, but clearer shifts do provide important information.
The CES started in April 2020 and is an ongoing monthly panel survey of more than 10,000 respondents from the six largest euro area countries (Belgium, Germany, Spain, France, Italy and the Netherlands). The survey is administered by the ECB and collects fully harmonised data on consumer expectations from a representative sample of the underlying population via the internet. For further methodological information, a user’s guide and recent updates on the ECB’s CES, see the dedicated web page. A more detailed account is provided in “ECB Consumer Expectations Survey: an overview and first evaluation”, Occasional Paper Series, No 287, ECB, Frankfurt am Main, December 2021, as well as in Georgarakos, D. and G. Kenny, “Household spending and fiscal support during the COVID-19 pandemic: Insights from a new consumer survey”, Journal of Monetary Economics, Vol. 129, 2022, pp. 1-14.
Inflation expectations in April 2020 were slightly elevated owing to the heightened uncertainty caused by the pandemic and initial lockdowns. It is a known stylised fact that consumers’ inflation expectations tend to be higher than those of professional macroeconomists. This owes in part to the tendency of some consumers to report inflation expectations as rounded figures (frequently to multiples of five), especially when they are more uncertain. For a more detailed discussion, see the article entitled “Making sense of consumers’ inflation perceptions and expectations – the role of (un)certainty”, Economic Bulletin, Issue 2, ECB, 2021.
In this box, we do not discuss differences across countries or by sociodemographic groupings. Further information can be found on the dedicated CES web page. Overall, while there are some specific differences, the broad profile of movement in aggregate perceptions and expectations is largely similar along different subgroups of the population. For a recent discussion of gender differences in inflation expectations, see Di Nino, V., Kolndrekaj, A. and Meyler, A., “What drives inflation expectations of women and men?”, The ECB Blog, 14 September 2022.
One feature of consumers’ quantitative inflation perceptions and expectations is heaping at certain values, most notably at multiples of 1, 5 and 10. This feature has been observed for US, euro area, Japanese and Australian data. For a recent discussion, see Y. Haidari and G. Nolan, “Sentiment, Uncertainty and Households' Inflation Expectations”, Bulletin September 2022, Reserve Bank of Australia, 2022.
For a more detailed discussion, see Stanislawska, E. and M. Paloviita, “Responsiveness of consumers’ medium-term inflation expectations: evidence from a new euro area survey”, Bank of Finland Research Discussion Paper 10/2021, Bank of Finland, 2021.
For a discussion of US data, see Armantier, O., Goldman, L., Koşar, G., Topa, G., van der Klaauw, W. and Williams, J.C., “What Are Consumers’ Inflation Expectations Telling Us Today?”, Liberty Street Economics, Federal Reserve Bank of New York, 2022.
Qualitatively similar results are found in the regressions of one-year ahead and three-years ahead inflation expectations on actual inflation outcomes.
For a discussion and comparison of point expectations and probabilistic expectations of professional forecasters, see Engelberg, J., Manski, C.F. and Williams, J., “Comparing the Point Predictions and Subjective Probability Distributions of Professional Forecasters”, Journal of Business & Economic Statistics, Vol. 27, No 1, 2009, pp. 30-41.
From April 2020 to June 2022, these ranges were bins of 2 percentage points from -8% to +8% (e.g. 0-2%; 2-4%, etc.). In July 2022, the ranges were widened to -12% to +12%.
Rounding to multiples of five is one of the reasons why mean perceptions and expectations tend to be above median perceptions and expectations and can also help explain why the gap between the mean and median may increase as inflation uncertainty increases. For a more detailed discussion of the use of rounding as an indicator of uncertainty in the context of US and euro area consumers’ inflation expectations, see Reiche and Meyler (2022, op. cit.) and Binder, C., “Measuring uncertainty based on rounding: New method and application to inflation expectations”, Journal of Monetary Economics, Vol. 90, 2017, pp. 1-12.