- SPEECH
- Frankfurt am Main, 12 November 2019
A tale of two money markets: fragmentation or concentration
Speech by Benoît Cœuré, Member of the Executive Board of the ECB, at the ECB workshop on money markets, monetary policy implementation and central bank balance sheets
Since the outbreak of the global financial crisis, central banks have injected a huge amount of liquidity into the financial system.[1] The monetary policy assets on the Eurosystem’s consolidated balance sheet, for example, have expanded from around €0.5 trillion on the eve of the crisis in July 2008 to nearly €3.3 trillion at the end of September this year.
Not all of the expansion in central bank balance sheets reflects direct monetary policy actions, however. Part of it relates to regulatory factors, as I will explain shortly in more detail. And part of it relates to autonomous factors, such as the steady increase in the demand for banknotes.[2]
Yet, changes in the way we operate and implement monetary policy – in our case, the fixed-rate full allotment at our main refinancing operations, (targeted) long-term refinancing operations and our asset purchase programme – have resulted in considerably more liquidity being injected into the financial system than is required by banks to meet their immediate liquidity needs.
These excess liquidity holdings were first a sign of uncertainty and mistrust, and then of a dysfunctional money market. As a result, central bank operations substituted for market-based intermediation in times of crisis.
Today, large excess reserve holdings are, by and large, a reflection of the accommodative monetary policy that central banks have conducted in recent years, and that many, including the ECB, are still conducting today in view of stubbornly low inflation rates. You can see this on my first slide. Excess liquidity increased as we rolled out our unconventional policy measures.

In this environment, an important – albeit by no means the only – role of excess liquidity is to firmly anchor short-term interest rates at the levels judged appropriate by policymakers. In the case of the euro area, this is currently the level of our deposit facility rate.
And yet, recent events in the euro area and the United States have highlighted that the current ample excess liquidity levels may not guarantee that short-term interest rates will reflect policymakers’ desired levels at all times.
In the United States, short-term funding rates experienced severe upward pressure towards the end of September, which required the Federal Reserve to conduct additional liquidity-providing operations. In the euro area, the introduction of a two-tiered reserve remuneration system triggered expectations among market participants of some, albeit limited, upward pressure on overnight rates.
In my remarks this morning I would like to use these two episodes as examples for explaining why managing liquidity conditions in the post-crisis environment has become more complex. In the United States, a prime reason behind the increased complexity relates to the highly uneven distribution of excess liquidity across individual banks. In the euro area, it relates to an uneven distribution across jurisdictions. And in both cases, it also relates to the growing role of intermediaries without access to central bank balance sheets.
I will argue that this concentration of excess liquidity may ultimately require policymakers to tolerate central bank balance sheets that are larger than would be required to control short-term interest rates if liquidity was more evenly distributed. And I will argue that if there would be a need for policymakers to increase their control of short-term rates in an environment of excess liquidity, providing non-banks with access to central bank balance sheets is a powerful option.[3]
The distribution of excess liquidity across banks
Demand for central bank liquidity has increased considerably since the financial crisis. A number of liquidity regulations affecting banks, such as the net stable funding ratio and the liquidity coverage ratio (LCR), require banks to hold a sufficient quantity of high-quality liquid assets. Central bank reserves count as such high-quality liquid assets.
Naturally, the role of central bank reserves in meeting regulatory requirements depends on the availability of other high-quality liquid assets, such as government bills and bonds. In the euro area, the supply of such alternatives has declined notably over recent years, reflecting both crisis-related downgrades of sovereign issuer credit ratings and fiscal surpluses in some jurisdictions, including Germany.
As a result, ECB staff estimate that the introduction of the LCR increased demand for reserves in the euro area by up to €200 billion in a sample of systemically important euro area banks from mid-2015 to the end of 2016. On my next slide you can see that banks, especially those with low LCRs, are estimated to have significantly increased their demand for central bank reserves.
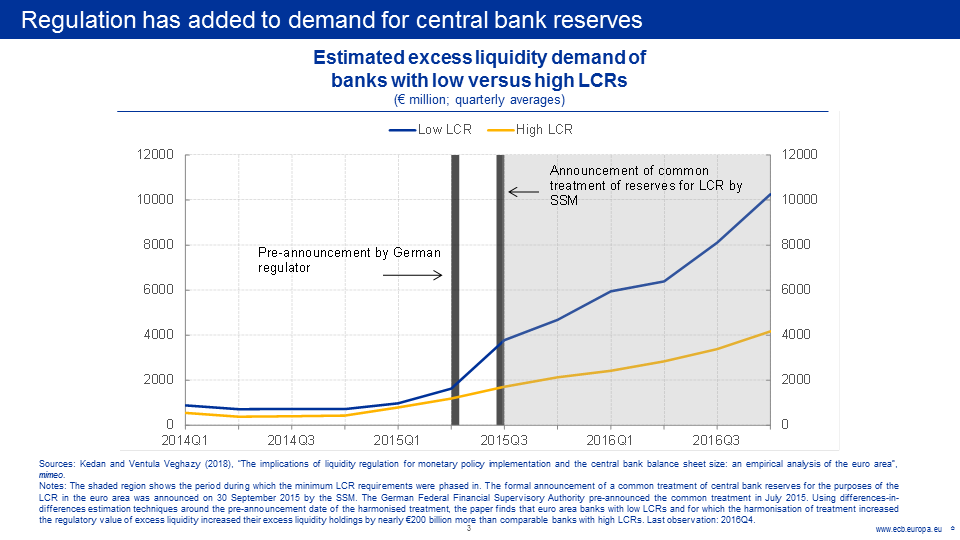
It is certainly not the responsibility of central banks to help commercial banks meet their regulatory requirements. Banks should stand on their own feet when it comes to capital and liquidity. But the hoarding of central bank reserves for regulatory reasons becomes a matter of attention for policymakers insofar as it has the potential to adversely affect the transmission of monetary policy.[4]
This provides the background to understand the recent events in the US money market.
As you can see on my next slide, excess reserves – the grey shaded area – currently stand well above $1 trillion – an extraordinary amount from a historical perspective and a level that, according to survey evidence, market participants had expected to be sufficient to keep market rates tied to policy rates, even when accounting for regulatory demand.
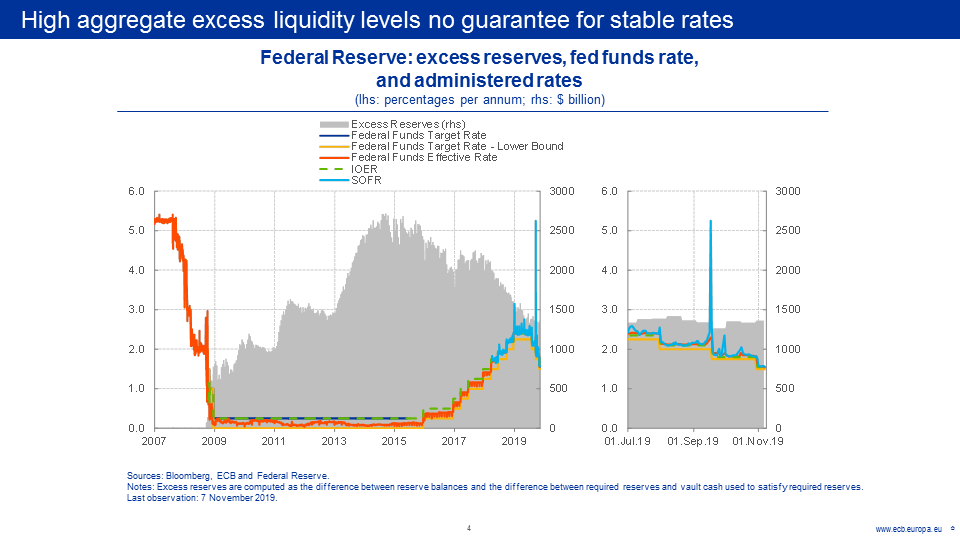
Nevertheless, and you can see this on the right-hand side more clearly, the secured overnight financing rate surged markedly towards the end of September, well above the Federal Reserve’s policy rates. Even the effective federal funds rate briefly exceeded its target range.
Such volatility is clearly undesirable from a monetary policy perspective. Short-term rates – and the relevant swap curves that are linked to them – are the key benchmark rates for the pricing of credit.
The Federal Reserve therefore added more than $200 billion in additional overnight and 14-day repo operations and announced additional purchases of US Treasury bills at a pace of approximately $60 billion per month at least into the second quarter of 2020.
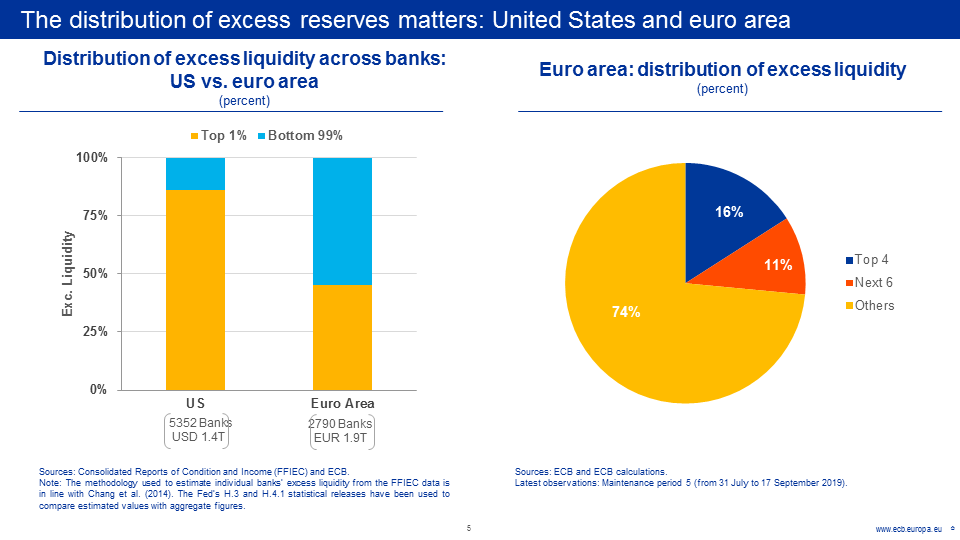
These operations became necessary for a simple reason: because holdings of excess reserves in the US financial system are highly concentrated. You can see this on my next slide. According to data from the US Federal Deposit Insurance Corporation (FDIC), 86% of excess reserves are held by just 1% of US banks. Four banks alone account for 40% of aggregate excess reserve holdings in the United States.
Whenever these intermediaries are reluctant, for regulatory or other reasons, to react to a shortage of liquidity elsewhere in the system – even in response to short-term shocks to the supply of and demand for liquidity – upward pressure on short-term rates becomes unavoidable.
In addition, liquidity may be increasingly supplied by intermediaries which do not have access to central bank refinancing – a point to which I will return to later in my remarks. All in all, it is fair to say that the supply of liquidity has become less elastic in recent years.
Excess reserves are, however, much more concentrated in the United States compared with the euro area, despite the fact that there are almost twice as many banks in the United States than monetary financial institutions in the euro area. On this side of the Atlantic, the top 1% of banks hold less than 50% of excess liquidity.
And on the right-hand side you can see that the ten largest banks in the euro area hold just a little more than a quarter of excess liquidity, compared with almost 70% in the United States.
At face value, the euro area’s more even distribution of liquidity suggests that it may be less likely to experience an episode of high interest rate volatility.
But there are two features – one of them specific to the euro area – that warrant caution.
The distribution of excess liquidity and the two-tier system
The first feature relates to the distribution of excess liquidity within and across euro area jurisdictions.
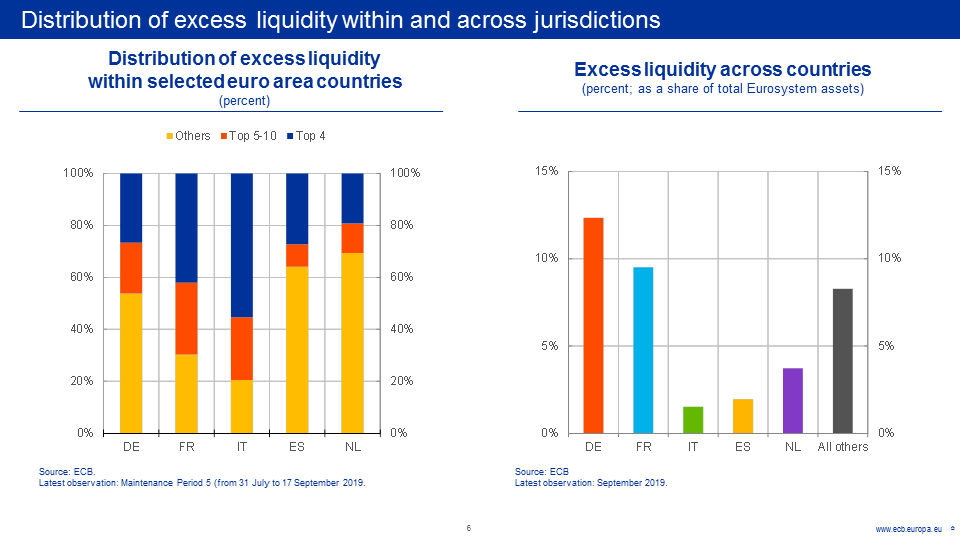
On the left-hand side of my next slide you can see that banks’ excess liquidity is often much less evenly distributed than at the country level. In Italy, for example, the top ten banks together hold 80% of excess reserves – a concentration level that is, in fact, higher than in the United States. In France, the top 10 banks hold 70%.
On the right-hand side you can see that excess liquidity holdings in the euro area are also highly concentrated in just a few countries.
Such concentration levels are, in principle, of little concern to policymakers in the presence of a deep and active money market across the euro area – that is, as long as banks with excess liquidity holdings are willing and able to smooth liquidity shortages elsewhere in the system.
If there is fragmentation, however, then temporary spikes in interest rates are also possible in the euro area, despite the remarkable excess liquidity levels we are currently seeing.
In other words, in the euro area, compared to the United States, it is fragmentation rather than concentration that may make liquidity supply less elastic.
The recent introduction of a two-tier reserve remuneration scheme for the excess reserves of euro area banks provides an interesting showcase for just how fragmented our money markets remain today. The scheme allows banks to deposit a pre-determined quantity of excess liquidity – their exemption allowances – at a rate higher than the deposit facility rate.
To see the effect of the scheme on money markets, it is important to recall that exemption allowances are allocated as a multiple of banks’ reserve requirements.[5] This allocation scheme has led to some banks receiving allowances that are higher than their excess liquidity holdings.
Specifically, ECB staff calculations suggest that around one-third of exempt excess liquidity would need to be traded across banks for the system as a whole to benefit fully from the two-tier scheme. Most of this trading can take place within euro area jurisdictions, and often even within banking groups.
But because of the uneven distribution of excess liquidity, ECB staff estimates that around 4% of exemption allowances, or around €30 billion, could only be filled if banks trade across borders.
Such volumes are potentially large. For example, they are about the same size as the volumes currently underpinning the daily computation of the €STR, and they amount to about 30% of the size of the current daily turnover in the secured money market.
Yet, the impact on the €STR, as you know, has been very limited. You can see this on the left-hand side of my next slide. Our analysis shows that this stability is not primarily the result of the statistical trimming procedure that is applied to the €STR and that could potentially treat transactions at higher rates as outliers.
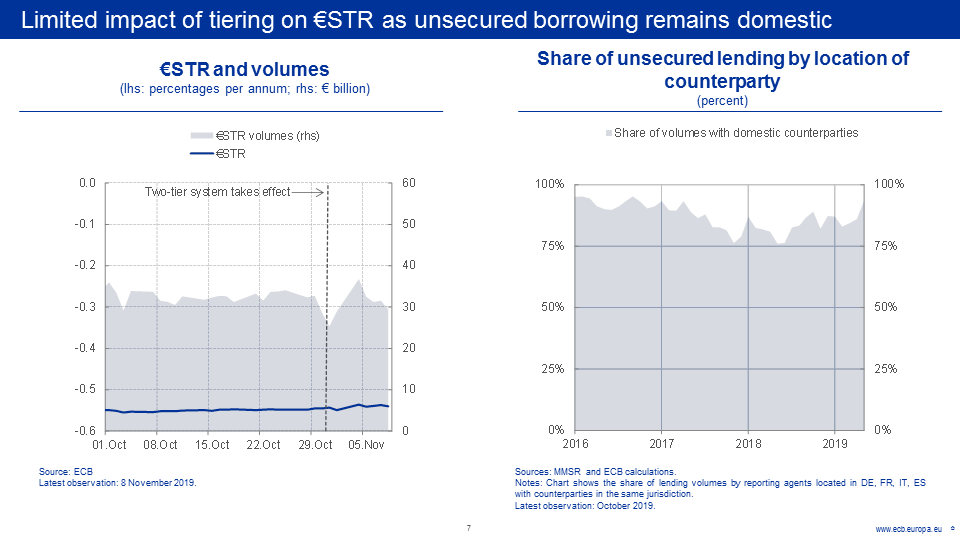
It is rather a reflection of the remaining impediments to cross-border trading in the unsecured segment. You can see from the chart that trading volumes for the €STR have hardly changed in response to the introduction of the two-tier system.
Unsecured cross-border trading appears to remain limited to core countries even a decade after the outbreak of the global financial crisis. Indeed, on the right-hand side you can see that unsecured borrowing remains, by and large, domestic, particularly in countries where excess liquidity is high.
Of course, current elevated excess liquidity levels remove incentives to money market trading more generally. But the muted response of unsecured market trading volumes to the introduction of the two-tier system suggests that we may still be facing a situation in which banks in some parts of the euro area may hold on to excess liquidity while those in other parts of the currency union may face a liquidity shortage.
Where we have initially seen a more pronounced reaction of rates to the introduction of the two-tier system, however, is in the secured market, in which the use of collateral and central clearing can mitigate counterparty risks. You can see this on the left-hand side of my next slide, which shows repo rates for banks located in different countries.
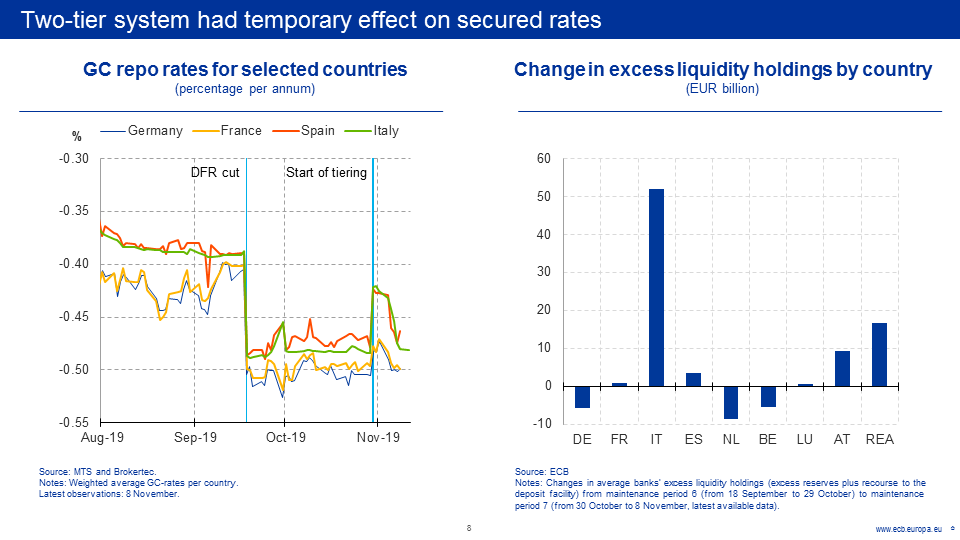
The chart suggests, for example, that Italian banks with unused allowances increased their demand for cash in the Italian repo market, which has led to a notable – albeit temporary – increase in repo rates. Arbitrage opportunities caused other banks to increase their lending, however, which gradually mitigated this upward pressure.
The observed movements in rates are broadly consistent with recent changes in cross-border flows in excess liquidity. You can see this on the right-hand side. On the first day of operation of the two-tier system we observed a considerable redistribution of excess liquidity, often away from liquidity-flush countries such as Belgium, Germany and the Netherlands and towards countries with unused allowances, such as Italy.[6]
On my next slide you can see banks’ progress in making full use of the exempt tier. For comparison, the blue bars show the theoretical allocation of allowances before the start of the scheme. The chart shows that the Italian banking system as a whole is almost fully benefiting from the allocated allowances, also in response to the re-distribution of excess liquidity towards the Italian banking system.
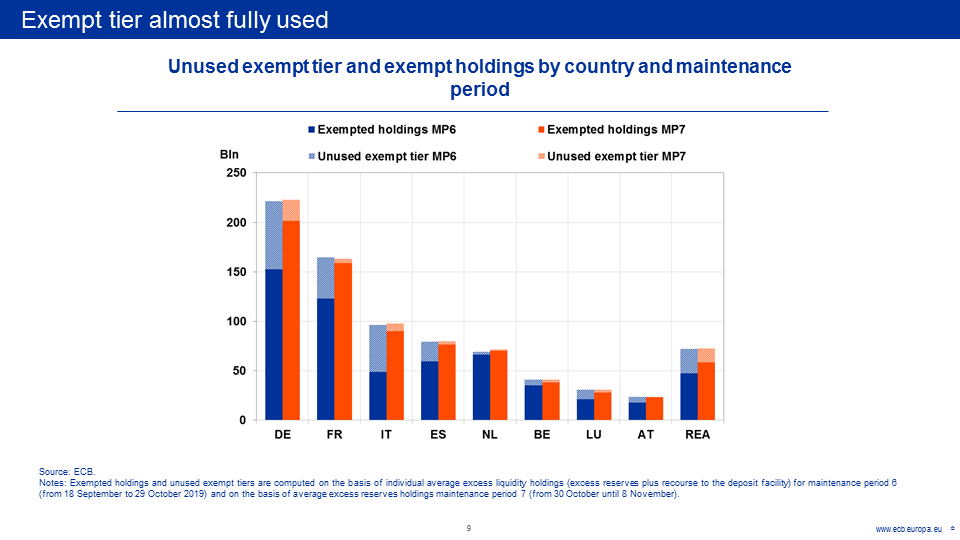
But in some countries, particularly in smaller peripheral jurisdictions, which I have grouped together here, but also in Germany, there still seem to be some remaining impediments that stop banks from making full use of the scheme.
The distribution of excess liquidity across sectors
So, provided banks have sufficient collateral, secured interbank lending has been able to at least partly offset the remaining constraints in unsecured cross-border lending. This was the first feature I alluded to.
The second feature that warrants caution relates to the distribution of liquidity across sectors, including holdings outside the euro area.
The implications of this feature can be best appreciated when looking more closely at the trades underlying the €STR. You can see this on the left-hand side of my next slide.
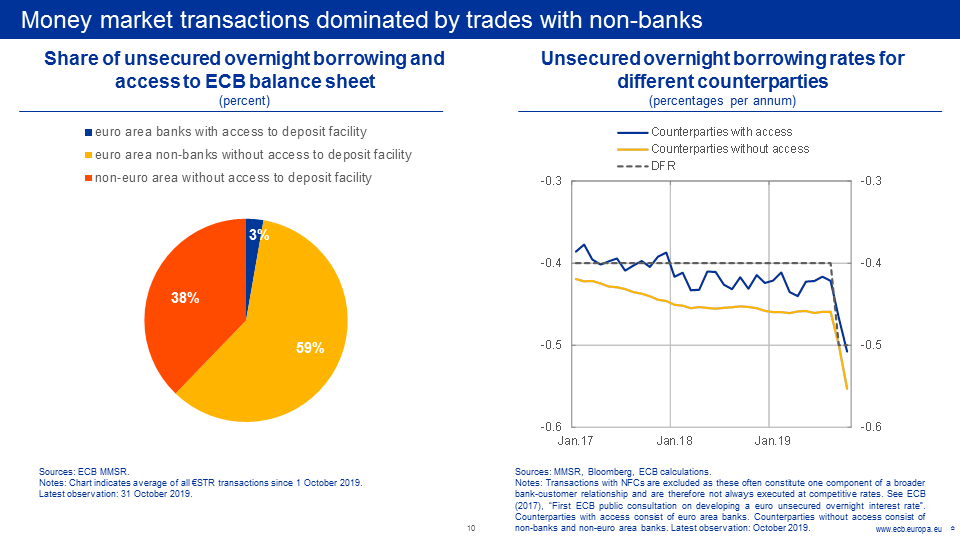
Today, almost 60% of €STR transactions are with euro area non-banks – typically, asset managers, pension funds, insurance companies or corporate treasurers – and most of the remainder is accounted for by non-euro area entities. Just 3% of trades are currently between euro area banks.
In other words, the significant accumulation of excess liquidity in the euro area banking sector in response to the non-standard monetary policy measures implies that the overwhelming share of money market transactions currently take place between entities that have access to the deposit facility and those that do not.
As a result, €STR borrowing rates often reflect the rates charged by euro area banks on deposits by entities without access to the ECB deposit facility. You can see this on the right-hand side.
Non-bank and non-euro area entities are prepared to pay rates below the deposit facility rate, and below the rates offered by those with access to the facility, for two main reasons. First, because internal risk management rules restrict their choice of counterparties to those with the lowest credit risk. And, second, because alternative safe investments, such as short-term government bonds, are often even more costly.
The changeover from EONIA to the €STR made visible the pricing impact of differences in who can hold central bank reserves. This also means that the €STR is a better and more transparent indicator of prevailing market conditions than EONIA, as it helps deliver a more comprehensive picture of the interactive effects of our actions and policy framework.
But it also implies a possible risk that the €STR might be less under our control than EONIA was. Changes in the €STR are essentially a function of three main factors: the level of ECB policy rates, the level of excess liquidity and the distribution of this excess liquidity across sectors.
All else being equal, a decline in the demand for liquidity services by non-banks – for example, due to a sudden increase in risk aversion – might lead to upward pressure on the €STR at the same level of excess liquidity. Also, a decline in excess liquidity can be expected to lead to faster upward pressure for €STR, even in the absence of changes in policy rates.
It is these factors that may be a cause of concern in the current context of interest rate volatility. But I would not be overly worried today for three main reasons.
First, we are a long way from expecting any reductions in excess liquidity in the euro area. In fact, as of November, the ECB’s renewed net asset purchases of €20 billion per month will further increase excess liquidity.
The Governing Council is committed to continue net purchases for as long as necessary to reinforce the accommodative impact of our policy rates, and to end shortly before we start raising the key ECB interest rates, which in turn will depend on inflation robustly converging towards our aim. Even beyond the end our net purchases, we will continue reinvesting the principal payments from maturing securities for an extended period of time, which will keep excess liquidity abundant.
Second, the experience of the Federal Reserve has highlighted that policymakers have the tools to respond quickly and efficiently to signs of market volatility. In particular, central banks always have the option to broaden access to the liability side of their balance sheet to a wider set of financial intermediaries, which would automatically make it easier to control rates.[7]
And, third, the remarkable stability of the EONIA-€STR spread over the past two years or so suggests that regulatory costs related to the leverage ratio, and competition between banks to offer liquidity storage services to entities without access to the deposit facility, are strong inertial forces that help mitigate large and abrupt swings in the €STR, in both directions.
Conclusion
All this means, and with this I would like to conclude, that large aggregate excess liquidity levels are no insurance that central banks will always find it easy to steer short-term interest rates.
Liquidity supply may have become less elastic in both the euro area and the United States, for different reasons though: in the United States because of concentration among banks, in the euro area because of fragmentation across countries, and in both cases because of the growing role of intermediaries without access to central bank balance sheets. This calls for central banks to err on the side of caution and leave a sufficient buffer in the financial system with a view to forestalling risks of unwarranted upward pressure on short-term interest rates.
The launch of the €STR has been a welcome step in providing a more complete picture of the actual borrowing conditions facing euro area banks. If policymakers in the future consider the impact of changes in excess liquidity on the level of the €STR to be less desirable, they could consider expanding access to the liability side of central bank balance sheets to other actors in financial markets.
Thank you.
- [1]I would like to thank Julian Schumacher and Annette Kamps for their contributions to this speech. I remain solely responsible for the opinions contained herein.
- [2]As the economy grows, and the demand for banknotes increases, it is normal to see central bank balance sheets expand. In the five years before the crisis, the ECB’s balance sheet expanded by more than 50%.
- [3]See also Cœuré, B. (2016), “The ECB's operational framework in post-crisis times”, speech at the Federal Reserve Bank of Kansas City’s 40th Economic Policy Symposium, Jackson Hole, 27 August.
- [4]See Cœuré, B. (2013), “Liquidity regulation and monetary policy implementation: from theory to practice”, speech given at the Toulouse School of Economics, Toulouse, 3 October.
- [5]See the press release “ECB introduces two-tier system for remunerating excess liquidity holdings”, 12 September 2019.
- [6]The chart focuses on the first day of operation as excess liquidity subsequently increased during the course of November in response to a decline in autonomous factors. The message remains unchanged, however.
- [7]See Cœuré, B. (2018), “The future of central bank money”, speech at the International Center for Monetary and Banking Studies, Geneva, 14 May.
Europska središnja banka
glavna uprava Odnosi s javnošću
- Sonnemannstrasse 20
- 60314 Frankfurt na Majni, Njemačka
- +49 69 1344 7455
- media@ecb.europa.eu
Reprodukcija se dopušta uz navođenje izvora.
Kontaktni podatci za medije

