
Reserve accumulation: the other side of the coin
Speech by Lorenzo Bini Smaghi, Member of the Executive Board of the ECB, 5th High-level EMEAP-Eurosystem Seminar, Sydney, 10 February 2010
1. Introduction [1]
The accumulation of foreign exchange reserves by the monetary authorities of emerging and developing economies is back on the international policy agenda. Over the past year, this process has experienced a new acceleration, following a short-lived episode of reserve depletion between end-2008 and the beginning of 2009. The overall level of reserves in this country grouping has now reached over USD 6 trillion, 1 trillion more than at the peak of the crisis.
And yet, in many cases, this important development seems to be more the outcome of other policy choices than an objective in itself. The process of accumulation is indeed driven not only by the need of self-insurance against possible crises, but also by the pursuit of a persistently undervalued exchange rate. As a result, the build-up of reserves tends to be associated with distortions, costs and risks that over the medium run outweigh the benefits – both domestically and globally.
In making this point, I will present some evidence in order to assess i) the current level of reserves against some optimality benchmarks, ii) the episode of reserve depletion during the financial crisis, and iii) the recent resuming of reserve build-up strategies. I will then analyse some of the domestic and global inefficiencies of reserve accumulation, mainly focusing on when it is associated with undervalued exchange rates. I will conclude with some policy considerations.
2. Evidence
The level of reserves goes beyond optimality
Looking at data, it appears that in many emerging economies the holding of foreign exchange reserves now exceeds any measures of optimality which could be defined as self-insurance against possible shocks [2] (precautionary motive).
A rough idea of the reserves held in excess of precautionary reasons can be obtained by comparing the actual level of reserves with various benchmarks of accumulation for self-insurance purposes.
I will initially focus on all emerging and developing economies taken as a group (Figure 1). The black and red lines track the traditional benchmarks – the three-months-of-imports rule and the Greenspan-Guidotti rule that requires foreign exchange reserves to cover the stock of short-term debt – and indicate that the need for global reserves would be less than one-third of the present stock of foreign exchange reserves. These rules of thumb, however, are too simple to provide a reliable estimate of the optimal level of holdings of foreign exchange reserves – all the more against the backdrop of the recent global financial crisis.
And yet the current level of reserves looks exceptionally high even when considering much more ambitious benchmarks of reserve adequacy. [3] For example, the current level of reserves would still be twice the benchmark of six months of imports, which was the average ratio of imports to reserves across all emerging economies when global reserves peaked prior to the crisis (green line in Figure 1). [4] The same conclusion holds if the Greenspan-Guidotti rule was modified to require the ratio of reserves to short-term debt to be 330% in each country – as it was on average across all countries prior to the crisis – rather than 100% (orange line in Figure 3). And even if one regards the ratio of reserves to domestic money supply as another yardstick for assessing the adequacy of reserves, [5] this ratio increased steadily during the past decade: while the ratio of reserves to broad money supply in emerging economies was only 15% in 2000, currently it is around 40%.
While the benchmarks for precautionary accumulation of reserves look insufficient to explain the acceleration in global official holdings of foreign assets, it would not be appropriate to assess all reserve-accumulating countries in the same way. Interestingly, if one deducts from Figure 1 those economies which the IMF judges to have an undervalued currency, the difference between actual reserve accumulation and the non-traditional benchmarks narrows considerably (Figure 2). Also, when looking at the recent experience with reserve re-accumulation, there seems to be some link with exchange rate regimes and dynamics. Out of the top-three post-crisis reserve accumulators, one has currently a currency board (Hong Kong S.A.R.), another one a quasi-fixed peg to the US dollar (China), and the third one (Thailand) is the managed floater whose currency appreciated the least against the US dollar when the latter underwent a sharp decline in the March-December 2009 period.
Limited reserve depletion during the crisis
It has been recently argued, in the light of the recent experience with the financial crisis, that the unilateral accumulation of reserves provided a fundamental buffer without which several emerging economies would not have endured the sudden stop in capital inflows and the seizing-up of local markets in foreign currency. While I share this assessment, I also believe that it needs to be qualified with two equally important remarks.
First, on the whole – and also thanks to the availability of other buffers, as I will discuss – the level of reserves proved to be sufficient to withstand the Post-Lehman flight to dollar-denominated safety and liquidity. This is illustrated in Figure 3, which focuses on the 18 most important emerging market reserve accumulators in the world (excluding Saudi Arabia). All of them experienced some decline in their reserves starting, depending on the country, between March and August 2008 (when reserves peaked) and ending between end-October 2008 and August 2009 (when reserves reached a trough). It is striking that their reserves dropped by only 14% on average from the pre-crisis highs, which does not seem to be much if one considers that this was the first truly global crisis since WW2 (though, admittedly, not a crisis originating from emerging economies). During the Asian crisis, for instance, reserves dropped by around 25% on average, while of course starting from much lower levels. Also, the decrease was mainly concentrated in a few countries – first of all Russia, with a record depletion of 37% from the pre-crisis high (13% of GDP) and Malaysia, with a drop of 31% (17% of GDP). The decumulation was instead negligible in several reserve-accumulating countries, especially in China, where it amounted to just 0.2% of the pre-crisis peak and occurred only in the immediate post-Lehman phase.
Second, there is no doubt that the depletion was contained also thanks to the availability of multilateral, regional and bilateral buffers besides the unilateral ones. This includes the allocation of Special Drawing Rights (SDR) by the International Monetary Fund (IMF), as well as its new Flexible Credit Line and High-Access Precautionary Arrangements; the Chiang Mai Initiative in East Asia; and bilateral central bank swaps and repos with major central banks such as the Federal Reserve, the European Central Bank, the Bank of Japan and even the People’s Bank of China. It is worth noting that Russia did not use any of these tools, whereas South Korea successfully stopped the dramatic running- down of its reserves thanks to foreign currency swaps with three of the aforementioned central banks.
In conclusion, if there is any lesson one should draw from the financial crisis, it is that, starting from usually much stronger fundamentals than one decade earlier, the emerging economies turned out to be much better equipped than in the past to withstand – not just in the form of self-insurance – the major shocks they were confronted with. This is not to deny the usefulness of current G20 and IMF efforts to assess the appropriateness of the present global financial safety net, but it seems to me that the further improvements that will be required should be relatively marginal in nature and not imply any major overhaul.
Reserve accumulation is back
The stock of foreign exchange reserves in all emerging and developing economies is projected by the IMF to reach USD 7 trillion by early 2011. In all countries, the current level of foreign reserves is above – usually well above – the trough reached during the crisis. In many reserve-accumulating countries, the level is even above – sometimes considerably above – the historical peak reached before the crisis. In particular, at the end of January the level of reserves exceeded the pre-crisis peak by already 50% in the case of Hong Kong S.A.R., and by more than one-quarter in the cases of China and Thailand, as illustrated in Figure 4 (which focuses on the same group of 18 economies as Figure 3).
Moreover, it is remarkable that, since the phase of reserve depletion during the financial crisis was mainly in the last quarter of 2008 and the first quarter of 2009, reserve accumulation posted strongly positive figures even in the crisis years 2008 and 2009, roughly equivalent to the GDP of India in 2008 and of South Korea in 2009.
3. Implications of reserve accumulation
The accumulation of foreign reserves, especially when associated with a pegged and/or undervalued currency, involves several medium-term distortions, costs and risks, which I will refer to as “inefficiencies”. I will first focus on the inefficiencies within countries, and then across them.
3.1 Domestic inefficiencies
Reserve accumulation in a context of heavily managed exchange rates can hamper monetary policy autonomy and slow down financial market developments as well as the market-based transmission of monetary policy impulses. It can also distort resource allocation and income distribution, impair financial stability, hold back the development of the services sector and impinge on employment and consumption growth.
Monetary policy inefficiencies
An anchored exchange rate entails importing the monetary stance of the country to which the currency is pegged. [6] In the present, post-crisis context characterised by very high growth differentials between most emerging and advanced economies, the following inefficiencies have become apparent.
First, anchoring the exchange rate has clearly become sub-optimal for monetary policy since the underlying emerging economy conditions are just too different from those of the anchor country. The latest evidence and consensus forecasts predict inflation rates to further pick up in a number of emerging markets. In association with much stronger growth rates in these countries than in the anchor economy, this has fuelled a new wave of carry trades and search for yield, potentially fuelling new bubbles in financial asset and property prices and increasing financial fragility.
The reserve build-up has been often coupled with excess net portfolio inflows, often called “speculative inflows of hot money” by the accumulating countries. This is shown in Figure 5 with reference to the past year, which compares the monthly changes in foreign reserves of emerging economies with the monthly changes in net portfolio flows to and from such economies. The chart suggests some correlation between these two variables which is consistent with the following story. Since the surge in net portfolio inflows to emerging countries after March 2009 was exerting upward pressure on their exchange rates, several countries sought to resist appreciation by means of foreign exchange intervention. But resisting exchange rate appreciation did not discourage – and may have even encouraged, by preventing the emergence of two-way risks and leading to one-way bets in local currency markets – the upsurge in speculative net portfolio inflows to reserve accumulators. Some policy-makers claimed that the problem lay in the monetary policy conditions of advanced economies, which they considered as “too accommodative for too long”. But the simple truth is that only local solutions can address the problem of excess portfolio inflows to emerging economies.
Second, there is ample evidence of cases when the extent and pace of reserve accumulation has made it increasingly difficult to sterilise the impact of foreign exchange intervention, as the central bank has to withdraw the liquidity that it injects when purchasing foreign assets. Sterilisation, moreover, has its own costs.
Third, as insufficient sterilisation may eventually result in higher inflation and/or asset bubbles, one way to prevent these risks from materialising has consisted in the adoption of (i) capital controls to curb portfolio inflows and/or (ii) administrative “quantitative” measures to contain money and credit growth. In theory and sometimes even in practice, this may still make sense as a temporary solution (Ostry et al. 2010 and IMF 2010), though many questions arise with regard to what an effective and “not-too-distortionary” system of controls would look like. But when capital controls and the transmission of monetary policy via administrative measures become an intrinsic permanent feature of an economy, the cost may become too high over the long run. The development of a modern financial system is hampered, with negative implications for both resource allocation and, eventually, also financial stability. Underdeveloped financial markets are not capable of channelling savings to the most efficient investments. And they are characterised by an inability of market participants to properly price assets and liabilities, potentially becoming even more speculative than in a context of developed and highly liquid markets. Over the long run, “financial repression”, if not linked to liberalisation, creates more problems than solutions even from a financial stability point of view, becoming one of the main sources of domestic fragility (Padoa-Schioppa 2001).
I will further elaborate on the inefficiencies engendered by financial repression in the next sub-section, with China as a case study.
Financial repression: the case of China
When reserve accumulation becomes a by-product of a government’s pursuit of an undervalued exchange rate, this may lead to forms of financial repression and underdevelopment that have several unintended consequences, including on income distribution, as well as in terms of asset bubbles and inefficient allocation of capital leading to over-investment.
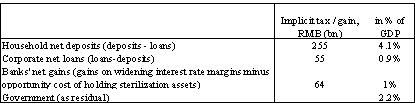
In making this point I will take China as an example. Figure 6 confirms two important features of monetary policy in this country: i) a very low average level of real interest rates – especially deposit rates – on average over time; and ii) the setting by the central bank of benchmark nominal interest rates on bank deposits and loans, which remains an important instrument to protect commercial banks’ margins.
In the period 2002-09, the average real GDP growth in China was 9.9%, while the real one-year deposit rate was at 0.3%, with the real lending rate at 3.6%. In this context, Chinese households witnessed a redistribution of income to other sectors of the economy, especially the government. The redistribution of income from households to other sectors via artificially low deposit rates – also called financial repression by Lardy (2008) – is estimated to have represented an implicit tax on households of 4.1% of GDP in 2008-Q1 compared with the situation in 2002-Q1, when the real lending rate was approximately equal to real GDP growth (see Appendix).
This form of financial repression became apparent in China after 2002, and appears to be the consequence of the government’s policy of maintaining an undervalued exchange rate. Specifically:
When, after February 2002, the US dollar began to depreciate, the Chinese authorities maintained a fixed nominal exchange rate initially, and then a crawling peg to the US dollar between mid-2005 and mid-2008, despite a rising current account surplus throughout the period. This called for increasing central bank intervention in the foreign exchange market and, to prevent rising inflation, large-scale sterilisation operations.
Despite rising inflation until summer 2008, the government was reluctant to raise interest rates for fear of attracting even larger speculative inflows, which would have compounded the challenge of controlling the pace of appreciation and the growth of monetary aggregates. As a result, the People’s Bank of China suspended its programme of interest rate liberalisation in the fourth quarter of 2004, which significantly slowed down the process of domestic financial development.
The decline in real interest rates until summer 2008 as inflation rose reduced the cost of maintaining an undervalued exchange rate (Figure 6).
It is interesting to observe that a similar process has been under way since the end of 2009, with the real deposit rate reaching negative territory due to an upsurge in domestic inflation (Figure 6).
This sequence of policies and events has not only resulted in a redistribution of income, to the detriment of the household sector, but it also hints at other important inefficiencies. Financial repression has also led to lending rates that are far too low in China, thus potentially fuelling excess demand for bank loans and engendering episodes of over-investment and asset bubbles. This has in turn elicited further use of quantitative targets and administrative measures to control credit growth. These measures represent an obstacle to the objective of rebalancing growth towards domestic demand in China. An explicit recognition of these issues might become part of the debate on further reform of China’s financial and exchange rate system.
Cross-sector distortions
Another very important implication of an undervalued exchange rate is that it tends to lower the relative price of tradable goods, thereby leading to an undue penalisation of the services sector, with negative implications both for employment and consumption. China provides, again, an interesting case study.
Regarding employment, it is interesting to note that in China the cost of capital is not just low, but has fallen relative to wages despite the country’s abundant labour. As a result, production has been skewed increasingly toward capital-intensive processes – as economic theory would predict – and job creation has slowed, despite this being the government’s main objective. Figures 7 and 8 corroborate this assessment. Figure 7 shows that, in the period 2001-08, a 10% GDP average annual growth produced only about 1% employment growth in China, whereas in most other emerging Asian and Latin American countries GDP growth of around 5% per year was associated with employment growth of close to 2%. While the Chinese numbers are of course the outcome of an impressive redistribution of employment from agriculture to manufacturing and services, [7] the services sector is the one which, being more labour-intensive, can contribute to employment for the most part.
Hence, a shift from the manufacturing to the services sector would help increase employment growth in China. But the undervalued exchange rate partly hinders this shift, and indeed – as Figure 8 illustrates – the share of the services sector employment in total employment is only slightly above 30% in China. This is very low by international standards, even when China’s low GDP per capita level is taken into account.
Turning to the implications for consumption, Bai and Qian (2009) and Kroeber (2010) have shown that Chinese wages have grown less than GDP since the mid-1990s, thus leading to a decreasing labour income share of GDP and conflicting with the government’s objective to boost the consumption share of the economy. About two-thirds of the fall in labour income may in turn be explained by the structural shift from agriculture to industry, whose labour income shares are, respectively, around 90% and less than 50%. As the labour income share in services is higher than in industry (usually up to 60%), a brisk development of services would definitely contribute to an increase in household incomes and consumption.
In conclusion, reserve accumulation in a context of currency undervaluation does not seem to support – and may even conflict with – some of the core objectives pursued by the authorities of one country. As the Chinese case study illustrates, this may include the pursuit of a high level of employment, as well as a number of much-needed rebalancing acts: from net exports to domestic demand, from investment to consumption, from manufacturing to services, and from urban to rural incomes.
3.2 Cross-country inefficiencies
Global imbalances
At the global level, the accumulation of sizeable stocks of foreign exchange reserves has been also shaping the patterns of global financial flows. This has corresponded to a gigantic re-allocation of capital flows organised by the public sectors of reserve accumulators. The risks to the efficient functioning of global financial markets and their stability have been discussed for years now, and therefore I will consider them only very briefly here.
The debate on global imbalances has recently resumed. The reason is that global imbalances are projected to re-widen over the medium run, given the largely cyclical and temporary nature of the adjustment in 2009-11. Current account positions are expected to evidence a significant expansion of the imbalances by as early as 2014-15. Overall, these projected current account imbalances underline that the policy measures taken thus far may be insufficient to diminish the major external imbalances in the global economy in a sustainable manner. This is all the more the case as many of the structural factors that led to the initial build-up in imbalances are likely to remain in place, though the jury is still out about the extent of possible adjustment. For instance, limited social safety nets in emerging markets with large surpluses will continue to encourage domestic savings. The financial underdevelopment of many of these economies will remain an incentive to channel domestic savings abroad. And some countries may continue to have a preference for exports as a key engine of growth, despite growing awareness about the need to strengthen domestic demand.
Re-accumulating imbalances, and re-accumulating reserves as part of this trend, would again produce major distortions in the global economy and international financial markets. This would have important implications for:
the direction of capital flows, with total capital flowing “uphill” to advanced economies instead of “downhill” to emerging economies, as should be;
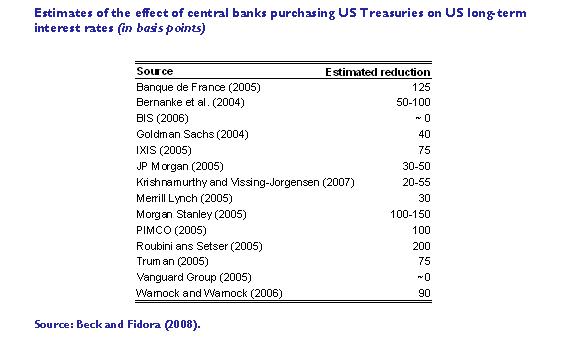
global liquidity conditions, by possibly contributing to an artificially low- yield environment. A broad body of empirical literature has indeed corroborated the impact of foreign exchange interventions on global liquidity conditions (Table 1). The low-yield environment is widely seen as one of the root causes of the financial crisis. Also, by making capital available under easier conditions, it reduces the incentive for deficit countries to adjust;
the potential for build-up of asset price bubbles, as discussed earlier;
global exchange rate configurations, including the risk of misalignments.
It is the poor who pay for undervalued currencies
An exchange rate that is kept persistently undervalued through policy interventions is the equivalent of a protectionist trade policy. As Subramanian (2010) observed, it mainly hurts other emerging and developing economies: not only do they tend to compete more closely with the countries issuing undervalued currencies, but they also tend to have similar comparative advantages, unlike those of, say, the United States or Europe.
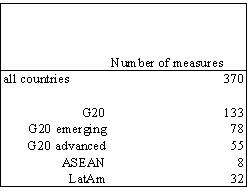
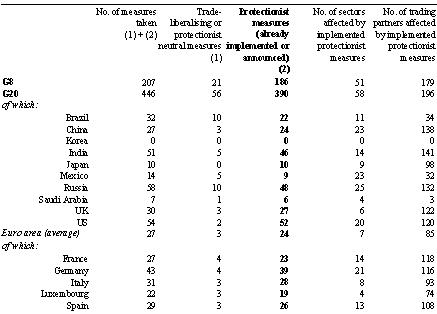
In this context, it is not surprising that currency undervaluation has fuelled protectionist pressures in emerging trade partners. Out of 517 protectionist measures taken by G20 members in the period from November 2008 to January 2010, 133 (more than 25%) were aimed at China. A large majority of these measures were taken by other emerging economies (Table 2). In half of the cases, import tariffs and anti-dumping duties or equivalent safeguards were adopted, whereas the other half included state aid, export subsidies and non-tariff barriers. Even when safeguard measures were involved, while the cases that made the headlines were initiated by the European Union and the United States (e.g. on steel pipes, footwear and tyres), the majority of safeguard measures were actually issued by other emerging countries. Moreover, evidence shows that these countries tend to implement measures that are more “harmful”, i.e. impact on more sectors and more trading partners (Table 3).
Negative returns on net assets abroad
An important opportunity cost of reserve accumulation is illustrated by the fact that a number of Asian economies are the main counterparts, with a minus sign, of the “exorbitant privilege” which the United States enjoys by issuing an international currency and being the world’s leading financial centre.
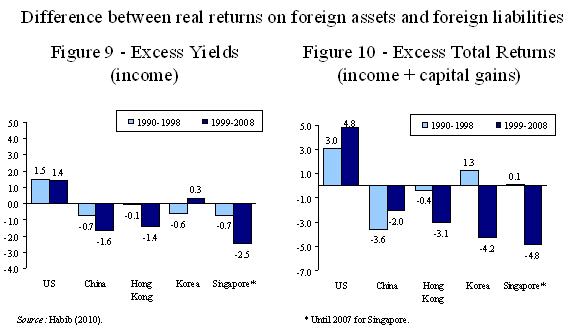
Habib (2010) shows that this exorbitant privilege can be measured, according to the simplest and most narrow definition, by the positive difference between i) the real total return on foreign assets that is enjoyed by US residents investing abroad (i.e. deflated with domestic consumer price inflation), and ii) the real total return on foreign liabilities that is paid to foreigners investing in the United States. These total returns include two main components: yields from the income balance (interest and coupon payments, dividends and so on) and capital gains stemming from asset price movements and exchange rate changes. Focusing on the first component, the income balances in the various balances of payment point to the conclusion that the excess yields of the United States have averaged around 1.5% per year in the last twenty years. Conversely, several Asian reserve accumulators (e.g. China, Hong Kong S.A.R. and Singapore) have experienced a negative differential between real returns on foreign assets and returns on foreign liabilities (Figure 9).
The picture becomes even clearer, as Figure 10 shows, when capital gains are included, i.e. the valuation effects resulting from asset price and exchange rate movements. In this case the excess return on the net foreign assets of the United States has surged to almost 5% in the last ten years. This was partly due to the fact that on average the country benefited from currency depreciation, which did not affect its dollar-denominated liabilities but increased the value of assets denominated in foreign currency, and partly from the better performance of stock markets in Europe and the emerging markets compared with that of the United States. The capital losses of Asian reserve accumulators have been, conversely, particularly large in the past ten years (see dark blue bars in Figure 9). This was due to negative valuation effects because of three factors: i) the relative underperformance of official investment in low yield foreign assets, as confirmed by the negative differentials from the income balance in Figure 10; ii) the inevitable real exchange rate appreciations; and iii) the overperformance of their stock markets compared with the United States and Europe. Resisting exchange rate appreciations can reduce losses over the short run, but it exacerbates the problem over the longer run. Similarly, investing in the debt securities and stock markets of mature economies may not ensure a better return compared with domestic investment for Asian countries in the long run.
Conclusions
The issue of reserve accumulation has been at the heart of the policy and academic debate on the international monetary system over the past decade. But it has become even more important today, at a time when both the assessment of countries’ policies and a number of systemic reforms are on the international agenda. Especially in the IMF and G20 context, it has become crucial to assess the extent, the drivers and implications of reserve accumulation in order to properly design the rebalancing of global growth, enhance global financial safety nets, and avoid creating unhealthy macroeconomic conditions that could eventually contribute to the next financial crisis. Difficult questions are being debated such as: Are reserves big enough by now, or is their further build-up advisable? Is the accumulation only or overwhelmingly driven by the objective to self-insure against various sources of instability, or are there other key explanatory factors – first and foremost the pursuit of an undervalued currency – at stake? And does accumulation bring net benefits or net costs to individual countries and the international community over the medium run?
In shedding some light on these questions, I showed, first of all, that in many countries the build-up of reserves already goes far beyond the need to reconstitute pre-crisis levels. It is true that the need for self-insurance has made this process partly understandable in the light of the recent experience with the financial crisis. But even self-insurance can be challenged as globally inefficient in relation to alternative multilateral, regional and bilateral buffers. In several countries, moreover, the level of reserves already looks just adequate for prudential purposes. When it is not, then the best approach is to establish alternative forms of foreign currency liquidity provision. During the crisis a large toolkit became available to this end, and the international community, especially the Fund and the G20, is currently assessing whether further – in my view relatively marginal – improvements are required.
I then elaborated on my main point – that the pursuit of an undervalued exchange rate is another important, but unwelcome, driver of reserve accumulation in certain economies. The exchange rate may not be the only – nor the key – factor in determining external imbalances, in particular current account surpluses, but the lack of adjustment in the desired direction prevents a rebalancing of demand towards the domestic sector and has a number of other undesirable effects within and across countries, as reviewed above.
This suggests that not all reserve accumulators can be placed in the same pot. The prospect of a small open economy with a managed float regime and no obvious undervaluation genuinely aiming to contain episodes of exchange rate overshooting and excess volatility is, of course, not the same as the prospect of a major economy with a high potential for reliance on domestic demand which is hampered by a systematically undervalued exchange rate. Recent experience also shows that for a small open economy confronted with overheating pressures, excess portfolio inflows and potential asset bubbles, it is difficult to let the currency appreciate if the major trade competitor has an exchange rate peg.
Appendix 1
Measuring China’s financial repression
Nicolas R. Lardy calculated the size of financial repression in China (see Lardy, N. R. (2008), Financial Repression in China, Peterson Institute for International Economics Policy Brief No. PB08-8). Lardy’s calculations reflect the situation in 2008Q1, when real interest rates were at a historical low. Some of the data used for these calculations is not available publicly, and therefore it is difficult to update the numbers to reflect the current situation. Nonetheless, if nominal interest rates remain unchanged the expected pick-up in Chinese inflation by mid-2010 may result in negative real deposit rates close to the 2008Q1 level. For that reason, it is interesting to reconstruct Lardy’s calculation.
Lardy defines financial repression as an implicit tax imposed on households due to the decline in the real return on savings deposits. To quantify this implicit tax for 2008Q1 Lardy calculates how much higher household interest income would have been in the first quarter of 2008 if households had received the same real rate of interest on their net renminbi-denominated savings deposits as in 2002. (Lardy does not justify his choice of the benchmark year. Nonetheless, 2002 was a year when the real lending rate was close to the real GDP growth rate.)
The implicit tax on households
Real deposit rates were more than 6.5 percentage points below their 2002 level in 2008Q1. Household deposits at the end of the first quarter of 2008 stood at RMB 19.1 trillion while their bank borrowings stood at RMB 5.3 trillion, making their net deposits RMB 13.8 trillion. The estimated implicit tax on these deposits is RMB 255 billion, equivalent to 4.1% of GDP, in the first quarter of 2008.
| Table A. Implicit tax on households and main beneficiaries as of Q1 2008 |
 |
| Source: Lardy (2008). |
The question therefore arises about the sector(s) which benefit from this large implicit tax on households.
Corporate sector
Corporates might be a major beneficiary of financial repression, given that most loans go to this sector. In 2002 the real lending rate was 7.6%, which declined to -0.5% by 2008Q1. With corporate loans outstanding of RMB 22.2 trillion, the implicit subsidy to corporates would appear to be enormous, far more than the implicit tax on households.
However, corporates are also large depositors in the banking system, and they face the same low real deposit rates as households. At the end of 2008Q1, non-financial corporate bank deposits stood at RMB 19.4 trillion, so corporates were net borrowers of only RMB 2.8 trillion. The net benefit in the first quarter of 2008 to corporates from financial repression was RMB 55 billion, a little less than 1% of GDP and about a fifth of the net implicit tax on households.
Banking sector
The banking sector benefits from a widening of the interest rate margin. During 2007, for example, the People’s Bank of China (PBC) raised benchmark interest rates six times. But the central bank left the benchmark rate on demand deposits unchanged, except for a five-month interlude when it raised the rate by only 9 basis points. On the other hand, the banking sector suffers losses due to the opportunity cost of holding sterilisation assets, which have lower return than lending. At the beginning of 2008 banks held RMB 4.2 trillion in central bank bills (with a return of 4.56% on three-year bills), while from 2002 through the end of June 2008 they placed an additional RMB 5.2 trillion on deposit at the central bank (with a return of 1.89%).
Overall, in the first quarter of 2008 banks are calculated to have “captured” about one-quarter of the net implicit tax imposed on households, an amount slightly larger than corporate gains.
Government sector
The above calculations imply that the government would capture slightly more than half of the implicit net tax imposed on households by financial repression. But how does the government gain from financial repression? Mainly via the implicit tax it imposes on the banks via central bank sterilisation operations. The cost to the Chinese government - and its agent, the central bank - of maintaining an undervalued exchange rate is much lower than it would be in a more liberalised interest rate environment. In such an environment, the cost of sterilisation would rise more over time, putting greater pressure on the authorities to allow the exchange rate to appreciate so as to reduce the external surplus, thus reducing both the needed amount of intervention in the foreign exchange market and the needed magnitude of sterilisation operations.
Figure 1
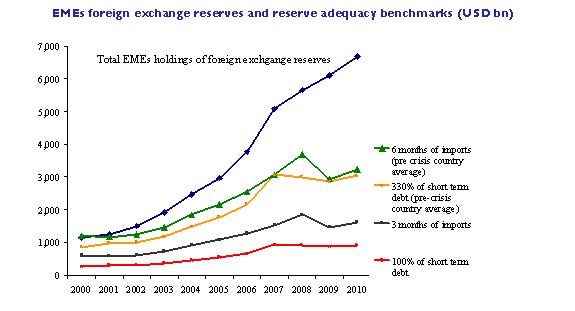
Figure 2
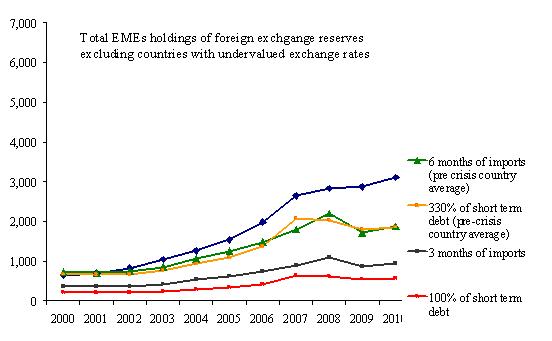
Figure 3
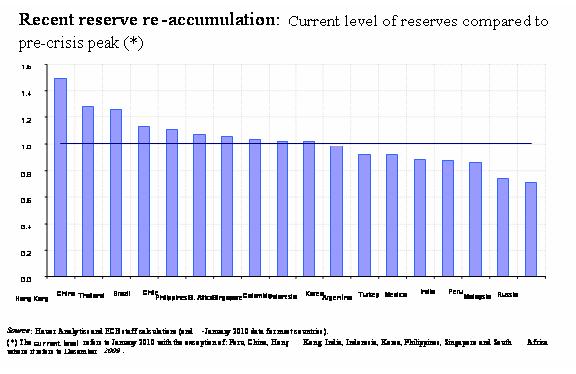
Figure 4
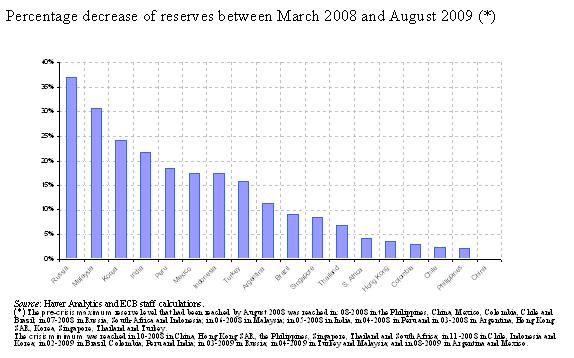
Figure 5
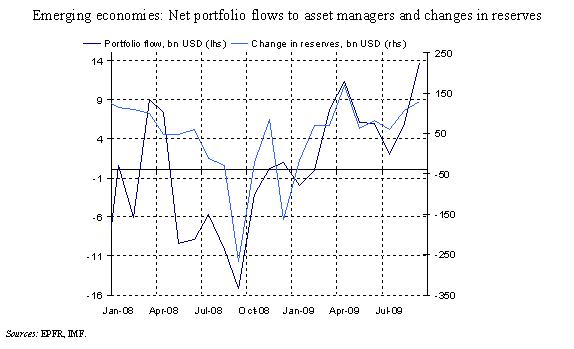
Figure 6
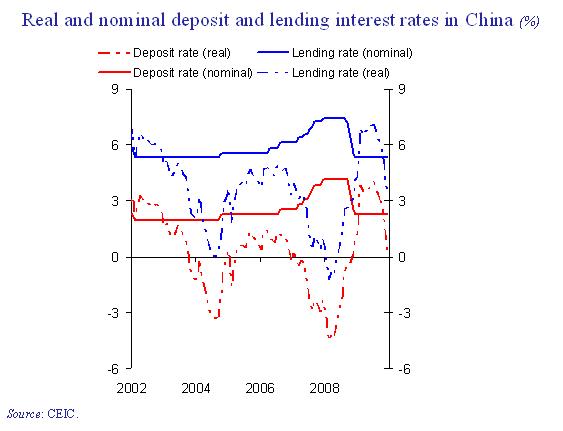
Figure 7
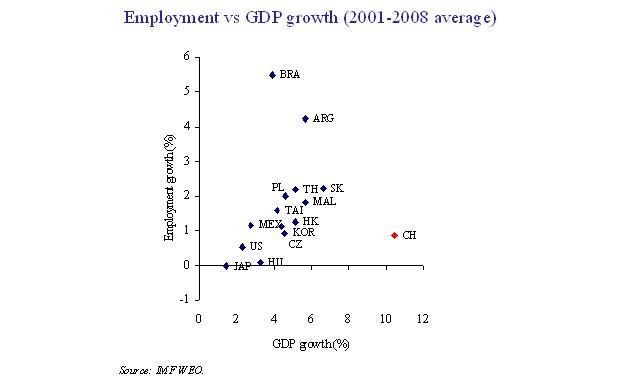
Figure 8
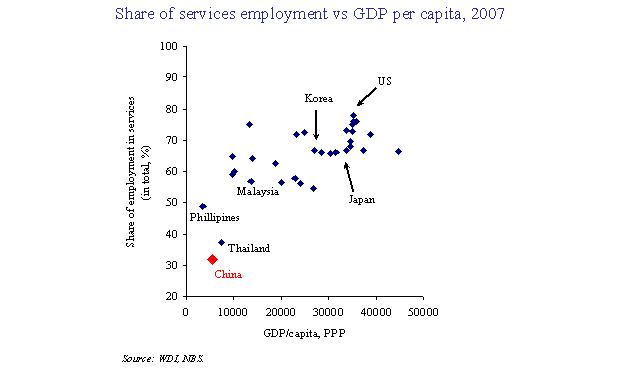
Table 1
| Table 2. Protectionist measures against China by implementing country November 2008 –January 2010 |
 |
| Source: Global Trade Alert. |
| Table 3: Protectionist measures by implementing country November 2008 - December 2009 |
 |
| Source: Global Trade Alert. |
Figures 9 and 10
-
[1] I wish to thank Ettore Dorrucci for his contribution to the preparation of the speech, and Michael Fidora, Maurizio Habib, Elitza Mileva, Gabor Pula and Isabel Vansteenkiste for their inputs. The opinions expressed here are mine alone.
-
[2] Self insurance has two dimensions: ex ante crisis prevention and ex post crisis mitigation. Ex ante self-insurance relies on the fact that reserve accumulation is expected to increase investor confidence, which decreases the probability of a crisis. This in turn is expected to lower sovereign risk and borrowing costs, which further reduces the likelihood of a crisis. Ex post, foreign reserves help mitigate the adverse impact of a shock on the economy. Traditionally, reserves have been used to cover balance-of-payments deficits resulting from negative current or financial account shocks. More recent examples include countries with current account surpluses that use their reserves for financial stability purposes. Examples include the government guarantees used in Russia and South Korea to cover currency mismatches by the private sector during the recent financial crisis, and several measures of re-capitalisation of local banks through shifts from reserve assets (e.g. in China in the aftermath of the Asian financial crisis and in Russia during the recent one). On crisis prevention, see Aizenman and Marian (2003), Durdu et al. (2007), Garcia and Soto (2004). On crisis mitigation, see Jeanne and Rancière (2008), Aizenman and Lee (2007), and Caballero and Panageas (2006). See also Jeanne (2007) in respect of both phenomena.
-
[3]I refrain from discussing more sophisticated model-based approaches to estimate optimal reserve levels, since they tend to yield benchmarks that are not too different from those discussed here. See e.g. O. Jeanne and R. Rancière (2006).
-
[4]This alternative benchmark is calculated by taking the unweighted average across all countries’ maximum reserves-to-imports ratios reached prior to the crisis. This ratio turns out to be six, meaning that prior to the crisis the average emerging economy was holding foreign exchange reserves equivalent to about six months’ worth of imports. The benchmark total emerging market reserve holdings are then computed by multiplying the total emerging market monthly imports by six. By taking unweighted averages, I assume that a reasonable benchmark is given by the reserves-to-imports ratio of an average country, irrespective of the size of its reserves. Taking reserves-weighted averages would of course (i) yield higher benchmarks and (ii) require that total reserves be equal to benchmark reserves when they reached their peak levels prior to the crisis.
-
[5]This alternative benchmark reflects the potential for a resident-based capital flight from the domestic currency.
-
[6]History provides examples of when this may have proved useful in order to anchor expectations during a disinflationary process, namely when the domestic monetary authorities had not yet gained sufficient credibility, so they needed to import it from abroad. However, this is no longer the case with today’s reserve accumulators because most of them have by now achieved a decent track record in fighting inflation. Moreover, this strategy was not without risks, including the likelihood of a currency crisis when the exchange rate peg was no longer credible. We have plenty of examples of such outcomes, ranging from Mexico in 1994-95 to East Asia in 1997-98, or from Russia in 1998 to Argentina in 2001-02.
-
[7]In China, agricultural employment is estimated to have decreased by 58 million between 2001 and 2008 (a 3% decline per year on average).
Europska središnja banka
glavna uprava Odnosi s javnošću
- Sonnemannstrasse 20
- 60314 Frankfurt na Majni, Njemačka
- +49 69 1344 7455
- media@ecb.europa.eu
Reprodukcija se dopušta uz navođenje izvora.
Kontaktni podatci za medije