
The ECB Survey of Professional Forecasters - Fourth quarter of 2021
Summary
In the ECB Survey of Professional Forecasters (SPF) for the fourth quarter of 2021, HICP inflation expectations were revised up, standing at 2.3%, 1.9% and 1.7% for 2021, 2022 and 2023 respectively.[1] Compared with the previous round (third quarter of 2021), these were 0.4 percentage points higher for 2021 and 2022 and 0.2 percentage points higher for 2023. Longer-term inflation expectations for 2026 were revised upward to 1.9% from 1.8% in the previous round. GDP growth expectations were broadly unchanged. The profile of the expected unemployment rate has been revised down for all horizons by between 0.2 and 0.4 percentage points. Indicators of the uncertainty surrounding expectations for the main macroeconomic variables mostly eased somewhat further but still remained elevated when compared with levels that prevailed pre-coronavirus.
Table 1
Results of the SPF in comparison with other expectations and projections
(annual percentage changes, unless otherwise indicated)
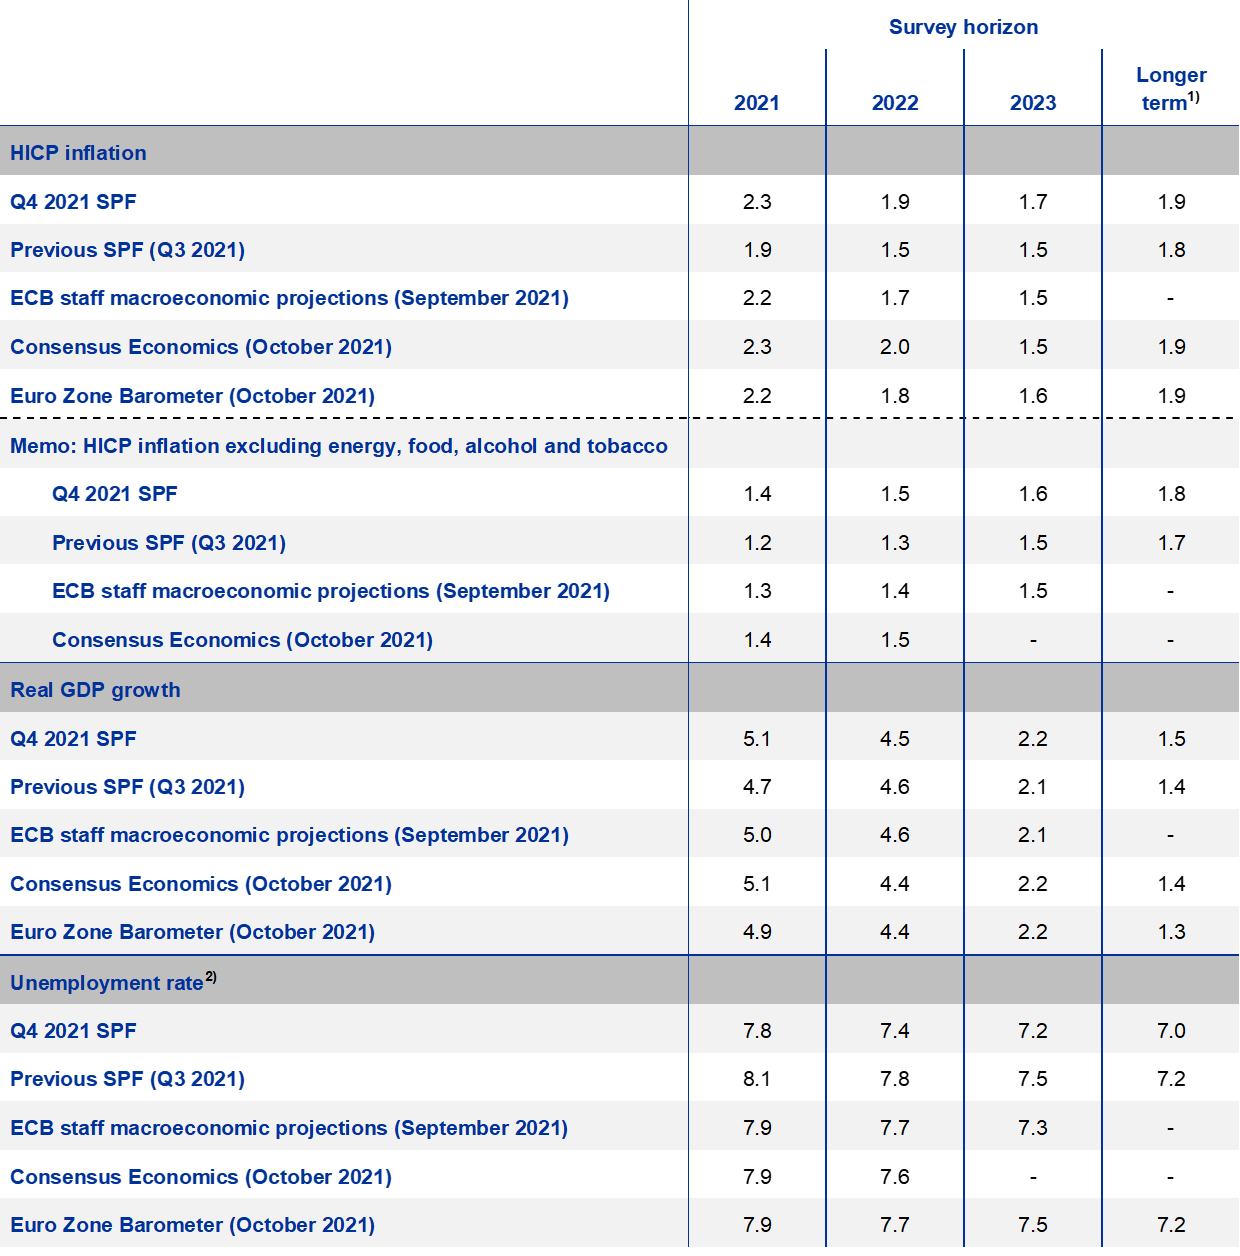
1) Longer-term expectations refer to 2026 (in the Euro Zone Barometer they refer to 2025).
2) As a percentage of the labour force.
1 HICP inflation expectations revised up
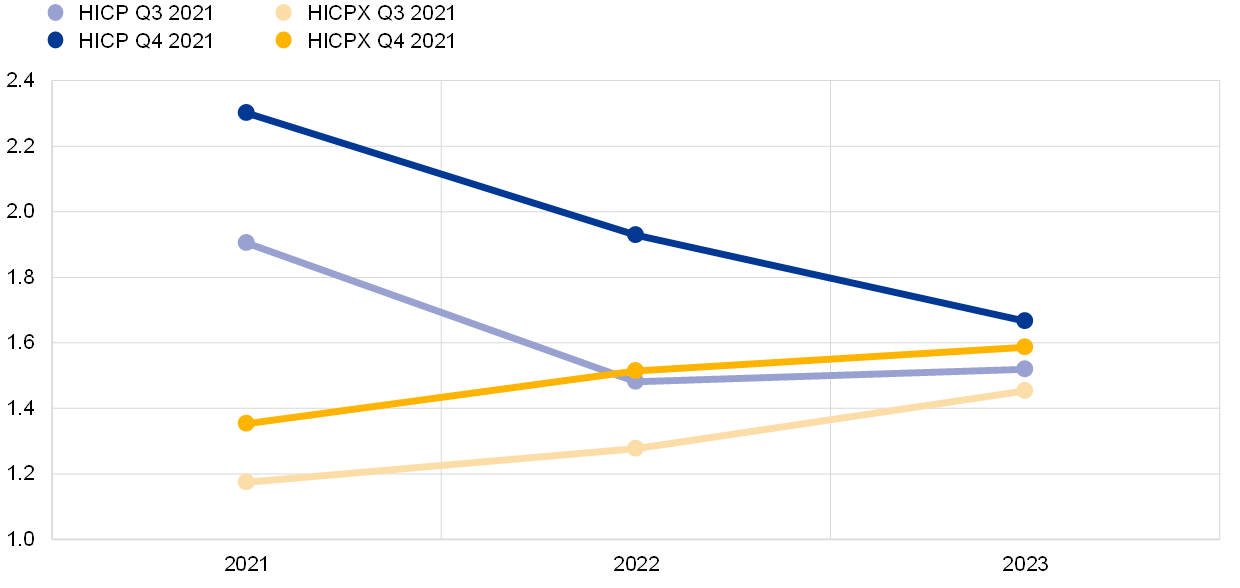
SPF respondents revised up their inflation expectations across all horizons. Inflation expectations for 2021, 2022 and 2023 were 2.3%, 1.9% and 1.7% respectively in the ECB SPF survey for the fourth quarter of 2021 (see Chart 1). For 2021 and 2022 this implies an upward revision of 0.4 percentage points compared with the previous survey for the third quarter of 2021. Inflation expectations for 2023 were revised up by 0.2 percentage points. Respondents attributed the upward revisions mainly to higher energy prices and the impact of supply chain tensions. Although both these factors were also cited in the previous round, the recent developments were seen to have been more intense and were expected to be more persistent than previously anticipated. Compared with the September 2021 ECB staff macroeconomic projections, inflation expectations in this SPF round were higher by 0.1 percentage point for 2021 and by 0.2 percentage points for 2022 and 2023 (see Table 1).
Chart 1
Inflation expectations: overall HICP inflation and HICP inflation excluding energy, food, alcohol and tobacco
(annual percentage changes)
Regarding the near-term inflation outlook, many respondents reported that they expected a further increase in the inflation rate in the final months of 2021 but that they continue to expect a sharp fall in inflation during the course of 2022. In addition to previously noted factors that have pushed inflation up during the course of 2021, many respondents indicated that they expect the more recent energy price developments (for oil, gas, coal and electricity) and intensifying supply chain tensions (having an impact on the cost and availability of commodities, raw materials, inputs and transport) to result in further increases in inflation in the final months of 2021. However, owing in part to base effects from the inflation increases observed in early 2021 and to expectations that supply chain tensions and some energy market dislocations will ease in the first half of 2022, they expect a relatively sharp decline in inflation during the course of 2022. Their expectation for the one-year ahead inflation rate in September 2022 was 1.7%.
Regarding the broader factors influencing the inflation outlook, respondents on average believed that underlying inflation pressure would gradually rise in line with the recovery in economic activity. On expected wage developments, respondents reported some counteracting forces. The main dampening factor cited was the ongoing labour market disruption stemming from the pandemic. On the other hand, respondents considered that the recovery in economic activity and the decline in the unemployment rate would gradually open up the scope for higher but still largely moderate increases in wages. A number of respondents mentioned the possibility of second-round effects from the current high inflation rates on wage settlements, but considered the probable magnitude to be limited (owing to the still considerable amount of slack in the labour market). See the Section entitled “Expectations for other variables” for more detailed information on assumptions regarding oil prices, the USD/EUR exchange rate, ECB policy rates and wage growth. Although some pass-through to producer prices of the higher input costs along the supply chain was expected, respondents considered that second-round effects on prices more generally were unlikely.
SPF expectations for inflation excluding energy, food, alcohol and tobacco (HICPX) were also revised up for all horizons and continued to be for a steady but gradual upward movement (see Chart 1). HICPX expectations for 2021 to 2023 stood at 1.4%, 1.5% and 1.6%, representing upward revisions of 0.2 percentage points for 2021 and 2022 and 0.1 percentage point for 2023. HICPX inflation expectations remained lower than those for headline HICP across all horizons. As was previously the case, the main factor behind the upward profile for underlying inflation is the expected economic recovery and consequent gradual reduction of the amount of slack in the economy. The SPF forecasts for HICPX were slightly higher (by 0.1 percentage point) than those from the September 2021 ECB staff macroeconomic projections for 2021, 2022 and 2023.
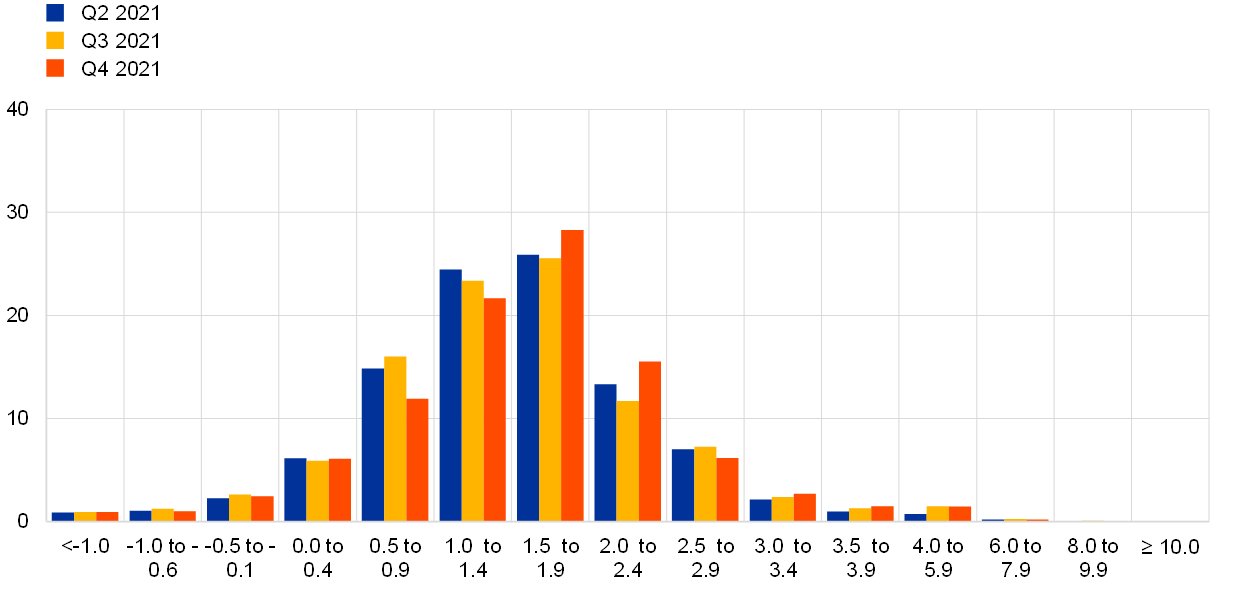
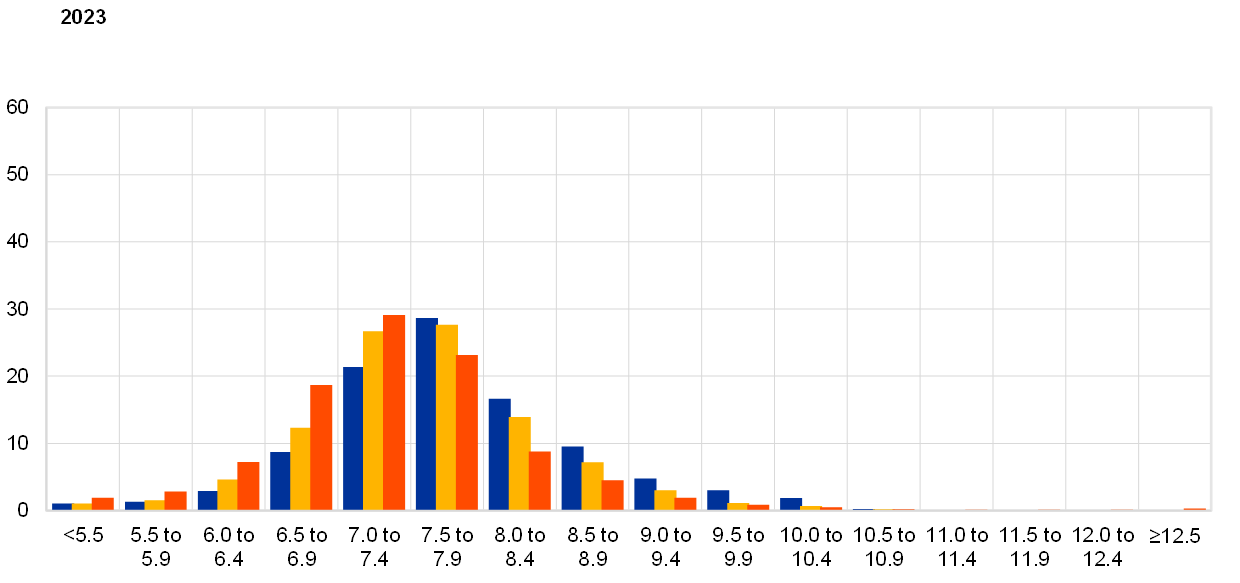
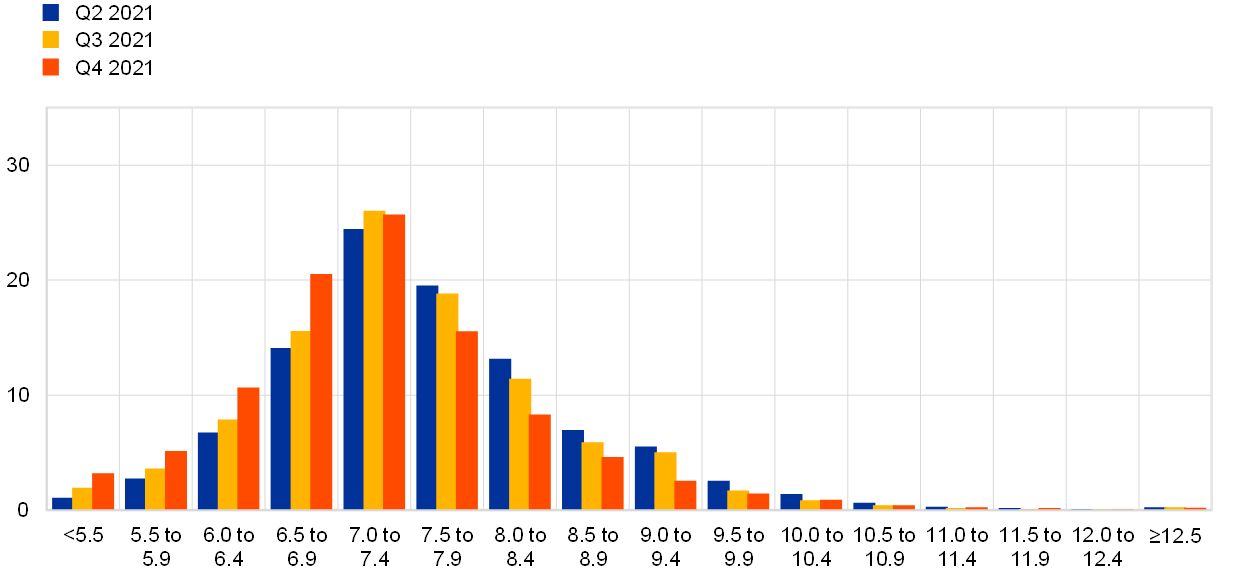
For the shorter- and medium-term horizons, quantitative indicators of uncertainty surrounding the inflation outlook have increased again and risks to the baseline expectations were assessed to be slightly to the upside on balance. In their qualitative remarks, respondents reported energy price developments and supply chain tensions as the key sources of uncertainty and upside risk in two ways. First, that they could be more severe or persistent than expected. Second, that they could affect wage and price-setting behaviour. On the other hand, some respondents noted that, should energy market and supply tensions resolve themselves sooner than expected, this would represent a downside risk to the baseline forecasts. Having eased somewhat in recent rounds, quantitative indicators of uncertainty for inflation derived from the reported probability distributions increased once more. The width of the reported probability distributions indicates the perceived degree of uncertainty, whereas the asymmetry of the distributions indicates whether that uncertainty is more concentrated on higher or lower outturns, i.e. it measures the perceived balance of risks. The aggregate probability distributions for the calendar years 2021-23 are presented in Chart 2. For the one- and two-year ahead horizons, the increase in “aggregate uncertainty” owed mainly to higher “disagreement” among forecasters about their point forecasts while the average level of “individual uncertainty” remained broadly unchanged. For 2021, the modal bin range (i.e. the one with the largest associated probability) shifted upward to 2.0-2.4%. For 2022 and 2023, the modal bin ranges remained at 1.5-1.9%, although the probability mass shifted somewhat towards higher outcomes.
Chart 2
Aggregate probability distributions for expected inflation in 2021, 2022 and 2023
(x-axis: HICP inflation expectations, annual percentage changes; y-axis: probability, percentages)
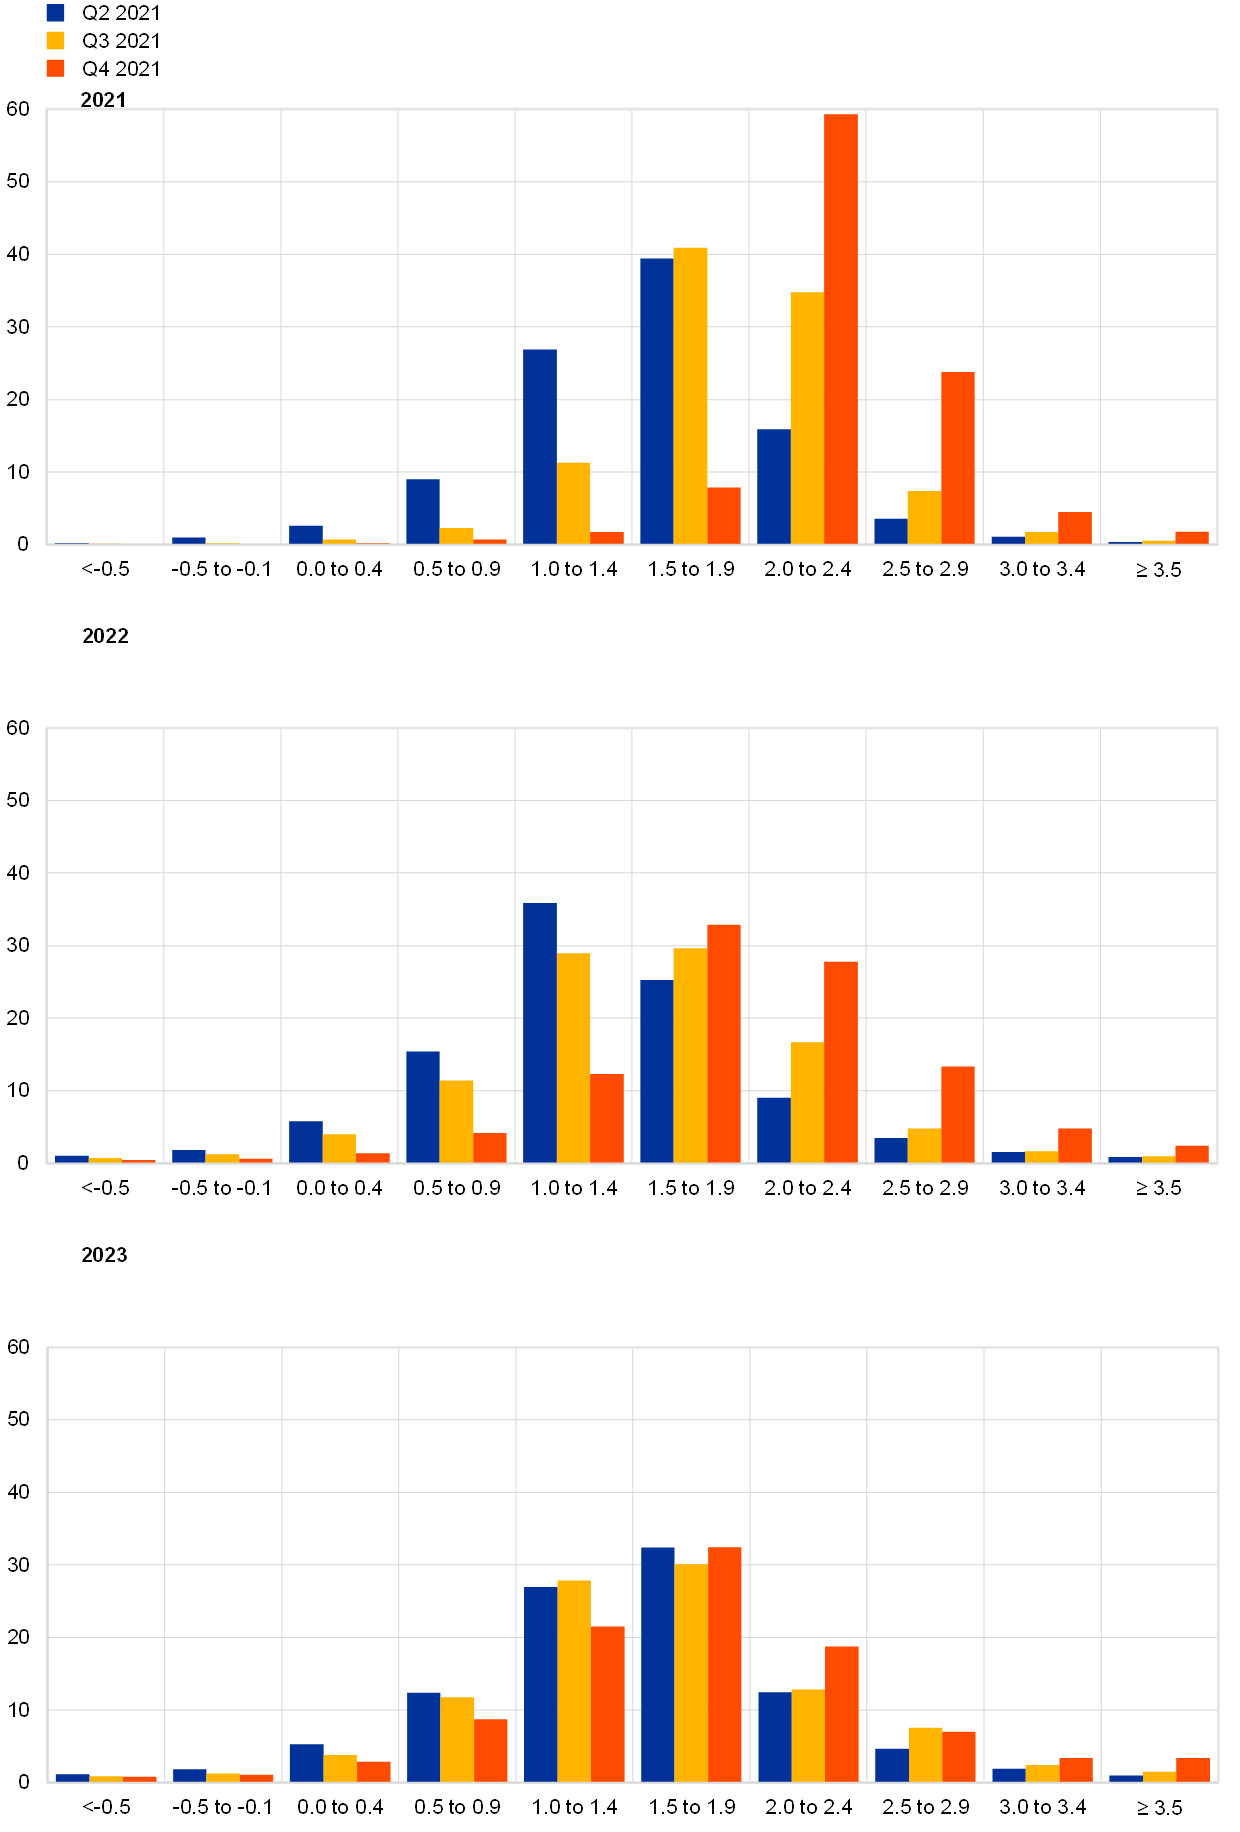
Notes: The SPF asks respondents to report their point forecasts and to separately assign probabilities to different ranges of outcomes. This chart shows the average probabilities they assigned to different ranges of inflation outcomes in 2021, 2022 and 2023.
2 Longer-term inflation expectations increased to 1.9%
Longer-term inflation expectations for 2026 averaged 1.9%, an upward revision from 1.8% in the previous round. Having remained in the narrow range of 1.64-1.69% in the SPF rounds between the fourth quarter of 2019 and the second quarter of 2021, longer-term inflation expectations have moved up noticeably in the last two rounds (third quarter of 2021 and fourth quarter of 2021). While part of this upward movement was owing to two relatively strong outliers, the upward revision over the last two rounds excluding these two outliers entirely was still relatively strong at 0.14 percentage points (from 1.67% to 1.81%).[2] In the most recent (fourth quarter of 2021) round, considering a balanced panel of those who also replied in the third quarter of 2021 round, many more respondents revised their longer-term inflation expectations upward than downward.[3] Regarding other summary statistics, while the median point expectation remained unchanged at 1.8%, the estimated mean of the aggregate probability distribution increased notably to 1.86% from 1.74% (see Chart 3). The aggregate probability distribution was also influenced by the two strong outliers. Nonetheless, over the last two SPF rounds, the revision in the estimated mean of the aggregated probability distribution excluding these two outliers was still noteworthy at 0.18 percentage points (to 1.78% from 1.60%). The distribution of individual point forecasts changed somewhat when compared with recent rounds (i.e. from the first quarter of 2019 to the third quarter of 2021).There were more respondents reporting 1.8% and 2.0%, and the mode of the distribution moved back to the 1.7-2.0% range (see Chart 4).
While respondents generally did not explicitly discuss the factors underlying their longer-term inflation expectations, in this round they were also asked to participate in an additional survey canvassing their views of the new ECB monetary policy strategy and its impact on their expectations. The results of this special survey will be presented in more detail in a separate report. It appears that the new monetary policy strategy may have been one factor behind the upward revision in this round, as approximately one-third of respondents noted that they had revised their longer-term inflation expectations upward as a result of the new strategy. There was also a further striking increase (to 32% from 26% and 11% in the previous two rounds) in the share of respondents reporting longer-term inflation expectations of 2.0% or higher.
The longer-term expectations for HICP inflation excluding energy, food, alcohol and tobacco (HICPX) were also revised upward significantly. They increased to 1.8% for 2026, up from 1.7% in the previous round.[4] The median longer-term point expectation for HICPX also increased to 1.8% from 1.7% previously. The evolution of longer-term expectations for HICP and HICPX inflation has been broadly similar for the period of available data since the fourth quarter of 2016 and the level difference of around 0.1 percentage point on average remained broadly unchanged also in the fourth quarter of 2021 round.
Chart 3
Longer-term inflation expectations
(annual percentage changes)
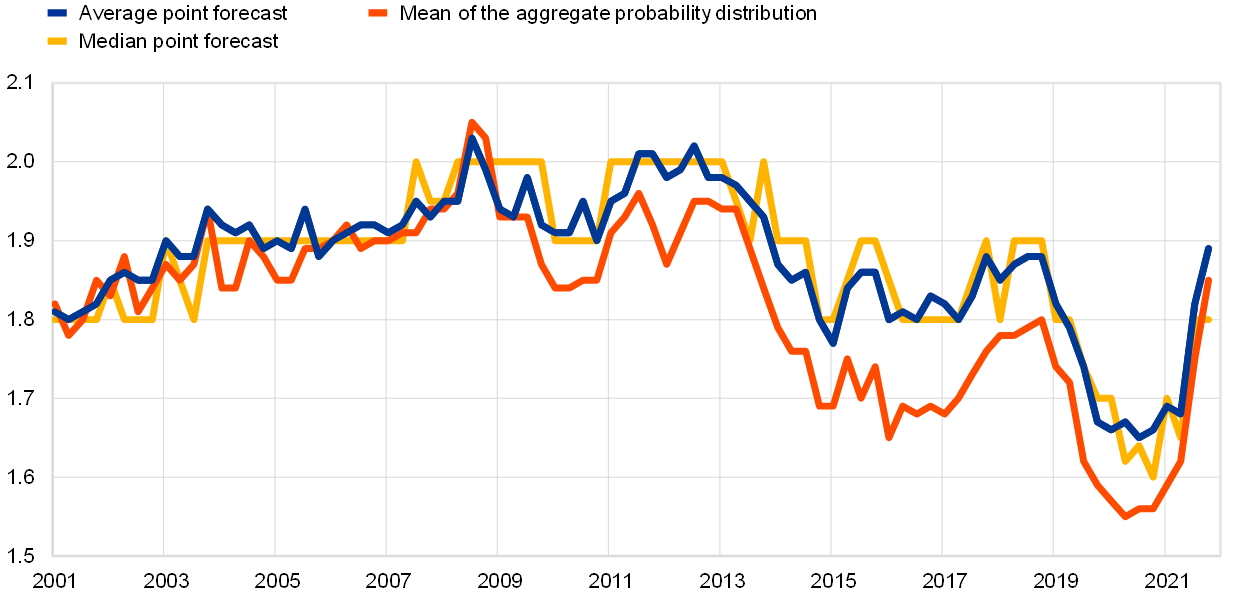
Chart 4
Distribution of point expectations for HICP inflation in the longer term
(x-axis: longer-term HICP inflation expectations, annual percentage changes; y-axis: percentages of respondents)
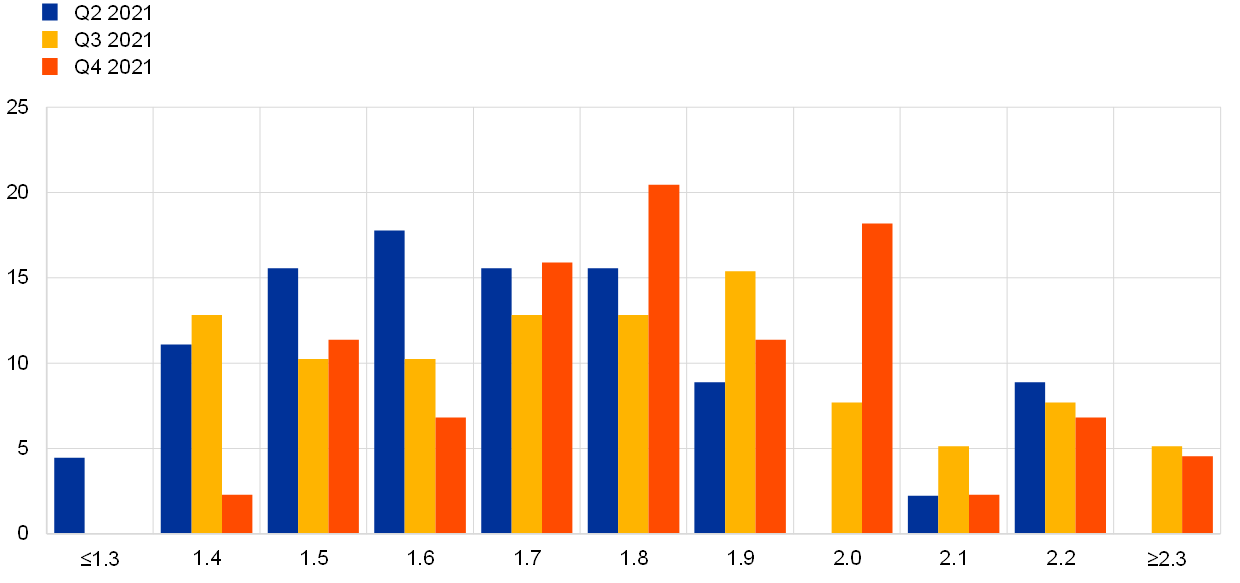
Notes: The SPF asks respondents to report their point forecasts and to separately assign probabilities to different ranges of outcomes. This chart shows the spread of point forecast responses.
Although uncertainty surrounding longer-term inflation expectations remained elevated, the balance of risks became less negative. The increase in the standard deviation of the aggregate probability distribution was due entirely to increased disagreement (reflecting mainly the two strong outliers mentioned above) as there was a decrease in individual uncertainty.[5] In addition to the upward revision in point expectations, respondents’ probability distributions imply that the balance of risks surrounding these became less negative. The probability associated with longer-term inflation being negative remained broadly unchanged from the previous round at around 2% (see Chart 5).
Chart 5
Aggregate probability distribution for longer-term inflation expectations
(x-axis: HICP inflation expectations, annual percentage changes; y-axis: probability, percentages)
Notes: The SPF asks respondents to report their point forecasts and to separately assign probabilities to different ranges of outcomes. This chart shows the average probabilities they assigned to different ranges of inflation outcomes in the longer term.
3 Real GDP growth expectations largely unchanged
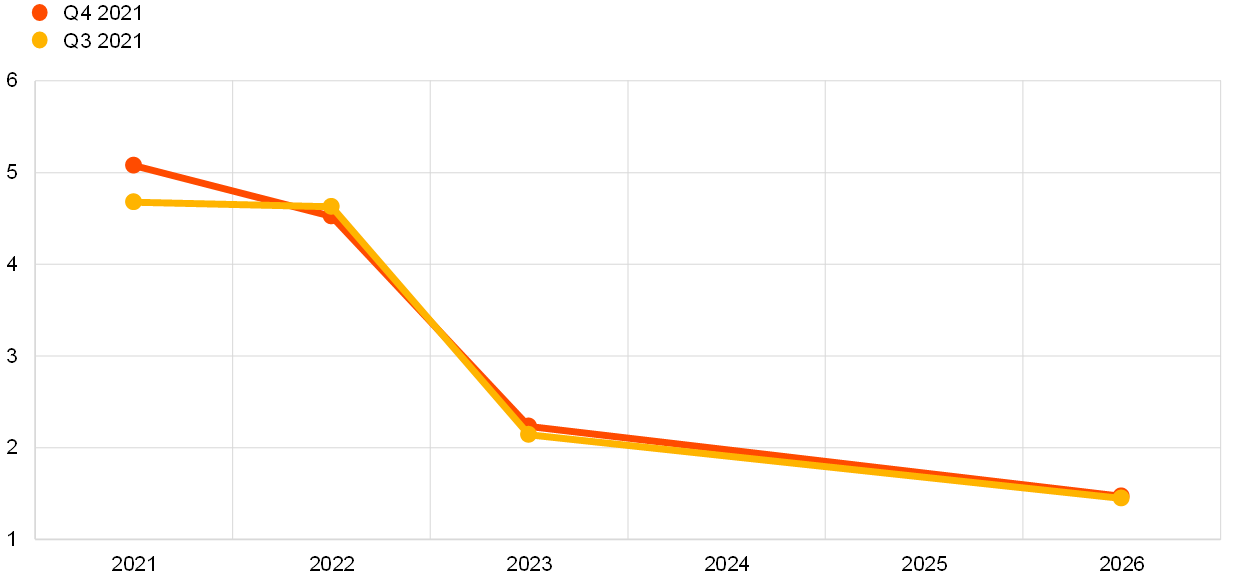
GDP growth expectations in the fourth quarter survey round stood at 5.1% for 2021, 4.5% for 2022 and 2.2% for 2023 (see Chart 6). These expectations implied an upward revision of 0.3 percentage points for 2021, a downward revision of 0.1 percentage point for 2022 and an upward revision of 0.1 percentage point for 2023. Respondents explained that their upward revisions for 2021 were due to the factoring in of the surprisingly strong growth rate in the second quarter of 2021. Looking ahead, they continued to expect an ongoing economic recovery from the pandemic in the euro area. In this context, the catch-up potential of sectors that have been particularly affected by COVID-19, such as the services industry, were mentioned as well as pent-up consumer demand, which is intensified by the savings accumulated over the lockdown period. The average SPF point forecasts are very similar to the baseline of the September 2021 ECB staff macroeconomic projection exercise (MPE) (see Table 1). Longer-term growth expectations (which refer to 2026) edged up from 1.4% to 1.5% (1.45% rounded to the second decimal place).
Chart 6
Expectations for real GDP growth
(annual percentage changes)
Respondents were again asked to provide the profile of their short-term GDP outlook (from the third quarter of 2021 until the second quarter of 2022). Before discussing this profile, it should first be noted that actual GDP growth for the second quarter of 2021 at 2.2% turned out noticeably stronger than the forecast of 1.4% in the previous round.[6] In this round, forecasters expected further strong growth in the third quarter of 2021 of 2.1% (although this is somewhat lower than the 2.6% they expected in the previous round). They then forecast quarter-on-quarter growth in real GDP to moderate to a still robust rate of around 1.0% in the fourth quarter of 2021, the first quarter of 2022 and the second quarter of 2022. Compared with the September 2021 ECB staff MPE, SPF respondents were on average less optimistic regarding the third and fourth quarters of 2021, broadly in line for the first quarter of 2022 and marginally more optimistic for the second quarter of 2022 (see Chart 7).
Chart 7
Expected profile of quarter-on-quarter GDP growth
(quarter-on-quarter percentage changes)
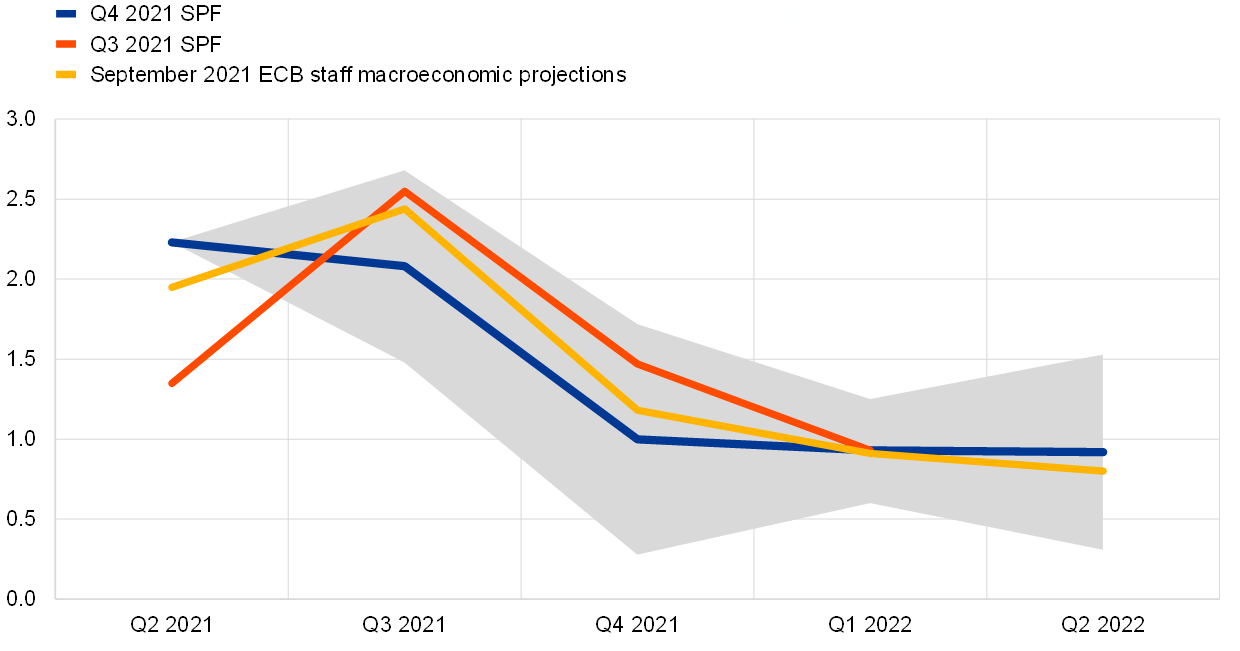
Notes: Grey area indicates one standard deviation (of individual expectations) around average SPF expectation.
Real GDP is expected to return above its pre-pandemic level in the fourth quarter of 2021 and respondents expected a quicker return to the pre-COVID-19 growth path than in previous rounds (see Chart 8). In annual terms, the expected level of GDP is expected to be above the 2019 level by 2022 and at that point stand higher (by 1.0 per cent) than anticipated in the previous survey round. Expected GDP levels are similar to those forecast in the September MPE. The level of GDP is expected to return above its pre-COVID-19 path at some point during the course of 2023.
Chart 8
Forecast profile of real GDP level
(2019 = 100)
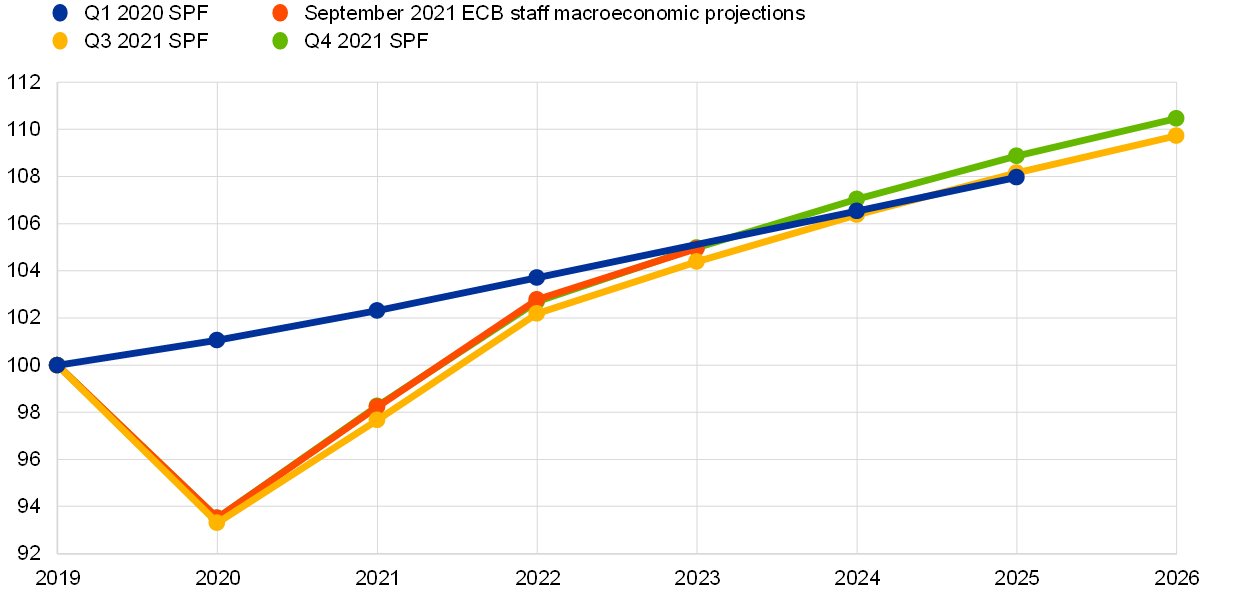
Notes: Growth expectations for years not surveyed have been interpolated linearly.
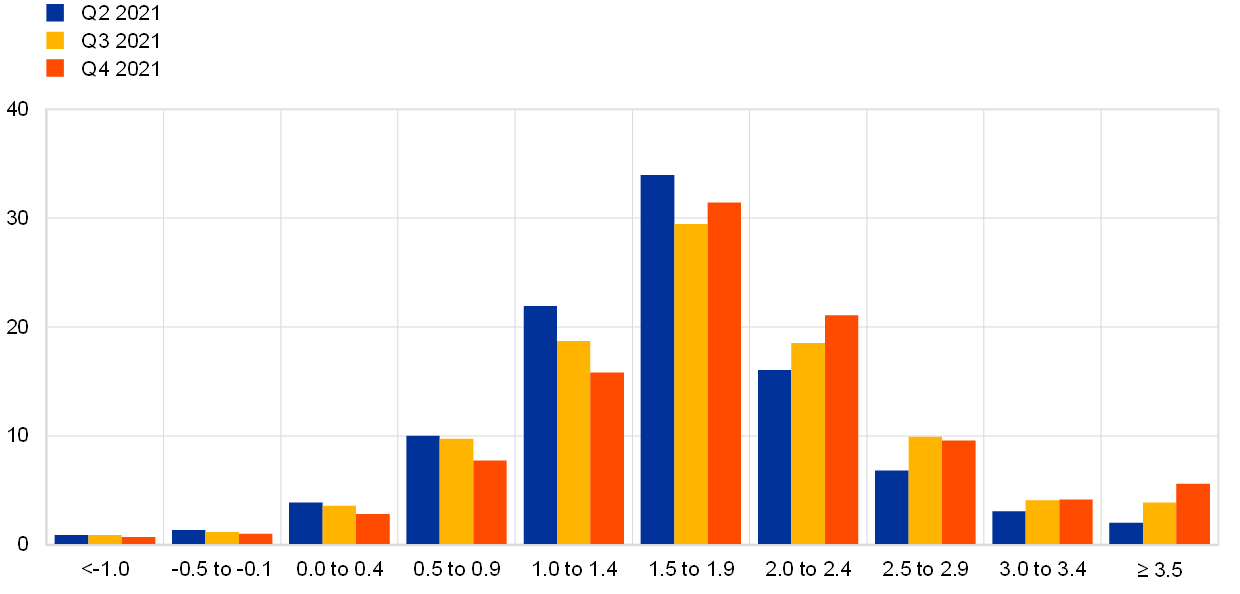
Although the quantitative measures of uncertainty have eased slightly, they remained at high levels while the balance of risks nudged slightly further into positive territory. Chart 9 and Chart 10 present the aggregate probability distributions for GDP growth for the years 2021-23 and in the longer term (2026) respectively. Uncertainty was considerably lower than at its peak in the second and third quarters of 2020 but also remained considerably higher than before the pandemic. This higher level of uncertainty compared with the pre-pandemic average is due to a combination of higher disagreement and higher average individual uncertainty. Many of the risk factors identified in the qualitative comments were also factors mentioned when explaining the baseline forecasts. On the upside these included the possibility that the pandemic evolves more favourably as well as the possible release of pent-up consumer demand and savings. Fiscal impulses for the economy through the European recovery fund were identified as an upside risk by some respondents. Respondents also pointed to downside risks, with the most cited being supply bottlenecks as well as rising energy and housing prices, which threaten to reduce the disposable income of households and therefore demand, as well as the uncertainty surrounding the future path of the pandemic. On balance, respondents cited increasingly more upside risks to their baseline forecasts than in previous survey rounds.
Chart 9
Aggregate probability distributions for GDP growth expectations for 2021, 2022 and 2023
(x-axis: real GDP growth expectations, annual percentage changes; y-axis: probability, percentages)
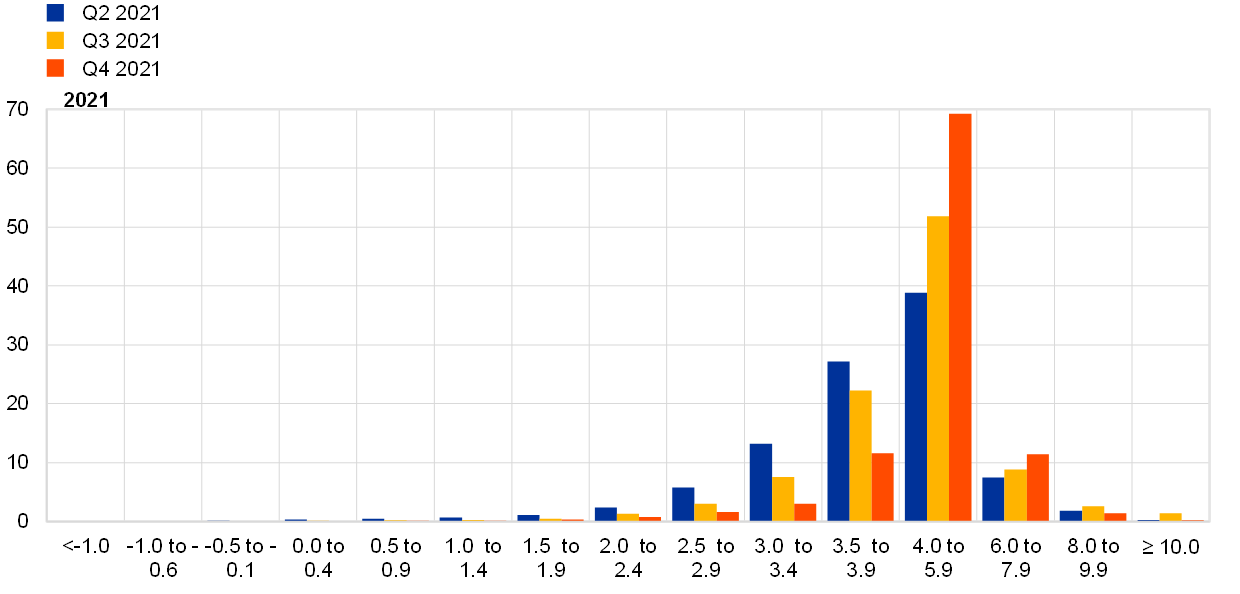
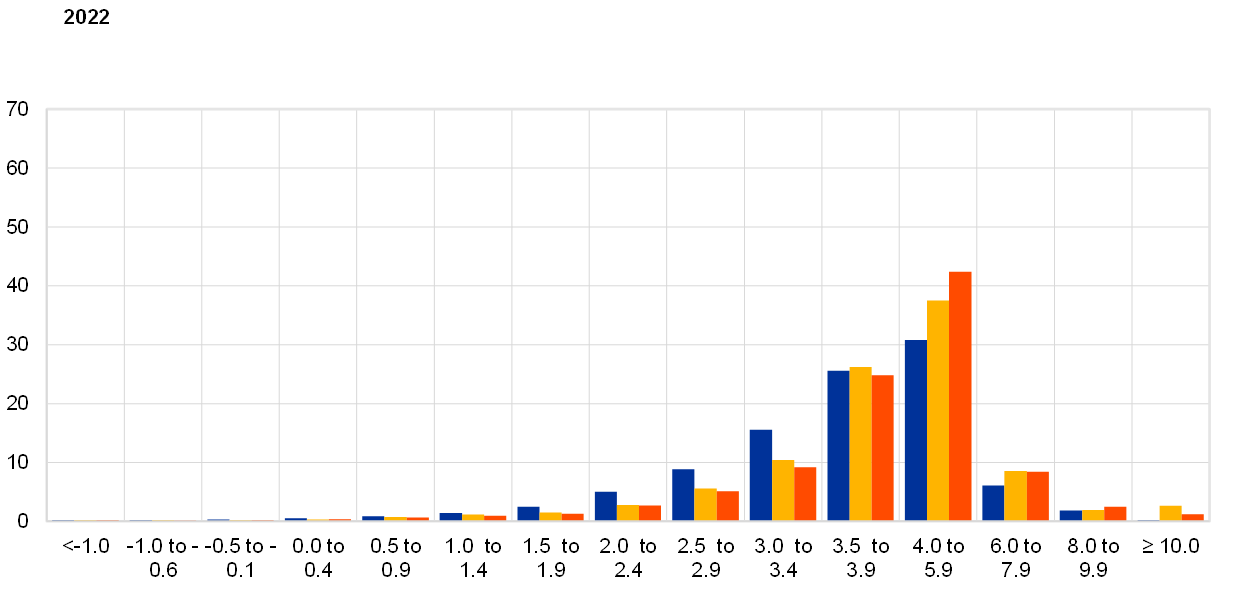
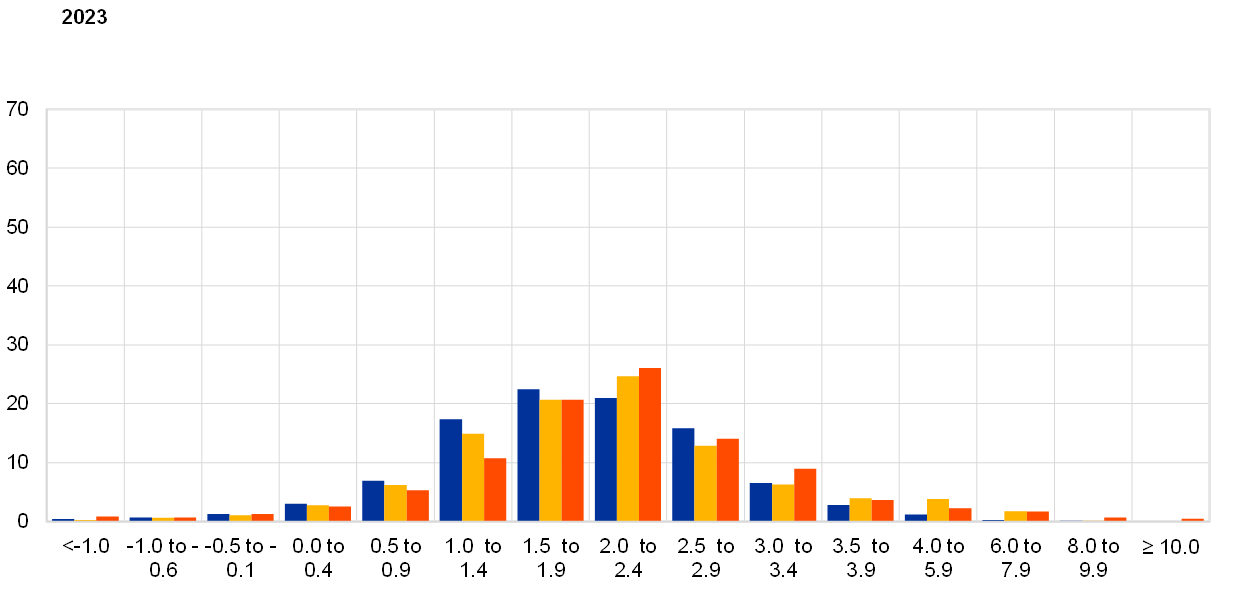
Notes: The SPF asks respondents to report their point forecasts and to separately assign probabilities to different ranges of outcomes. This chart shows the average probabilities they assigned to different ranges of real GDP growth outcomes in 2021, 2022 and 2023. For outcomes above 4%, bins are 2 percentage points wide.
Chart 10
Aggregate probability distribution for longer-term GDP growth expectations
(x-axis: real GDP growth expectations, annual percentage changes; y-axis: probability, percentages)
Notes: The SPF asks respondents to report their point forecasts and to separately assign probabilities to different ranges of outcomes. This chart shows the average probabilities they assigned to different ranges of real GDP growth outcomes in the longer term.
4 Unemployment rate expectations revised down for all horizons
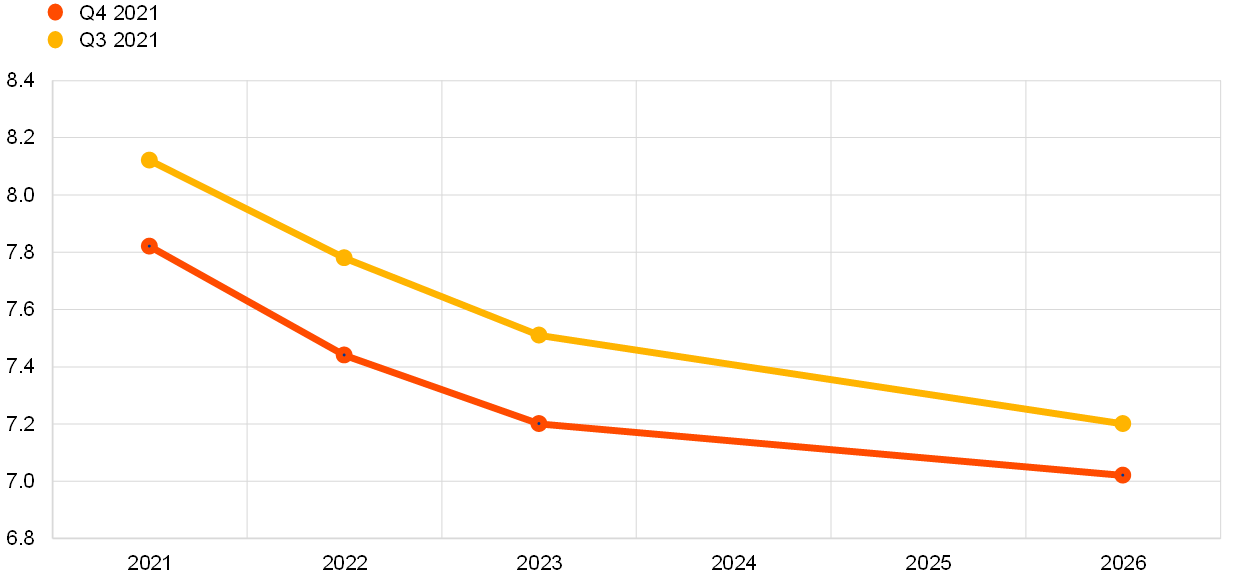
The average point forecasts for the unemployment rate in the fourth quarter of 2021 round were 7.8%, 7.4% and 7.2% for 2021, 2022 and 2023 respectively (see Chart 11). The expectation for 2026 was 7.0%, the lowest rate recorded for long-term unemployment expectations since the third quarter of 2008. This downward sloping trajectory shifted further down compared to the previous round but became slightly flatter because of stronger downward revisions over shorter horizons compared with longer horizons. The marked reduction in unemployment expectations was reported to be mainly due to the continuously decreasing outcomes recorded over recent quarters combined with higher than expected GDP growth. For the medium term, respondents considered that downside risks might stem from a wider reopening of the services sector and potential improvements in the skills match for those sectors currently lacking specialised workers. However, some forecasters identified upside risks due to higher participation rates, potential job losses following the end of job-retention schemes and lower-than-expected growth. With respect to previous rounds, only a few respondents mentioned pandemic containment measures as a potential source of upside risk.
Chart 11
Expectations for the unemployment rate
(percentages of the labour force)
Uncertainty surrounding unemployment rate expectations remained largely stable and still stands at historically high levels, while risks were neutral overall. Aggregate uncertainty about the expected unemployment rate (as measured by the average width or standard deviations of the aggregated probability distributions) were broadly unchanged compared to the previous SPF round and continued to hover at high levels. On balance, the probability distributions were broadly neutral for the shorter horizons but remained marginally skewed to the upside for the longer horizon (see Chart 12 and Chart 13).
Chart 12
Aggregate probability distributions for the unemployment rate in 2021, 2022 and 2023
(x-axis: unemployment rate expectations, percentages of the labour force; y-axis: probability, percentages)
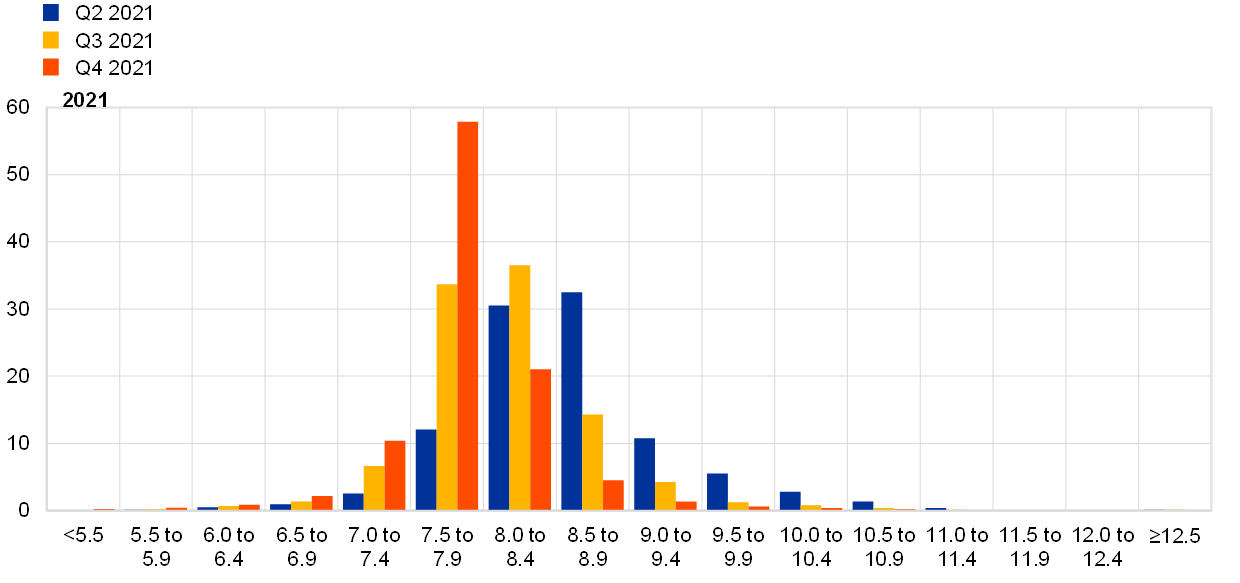
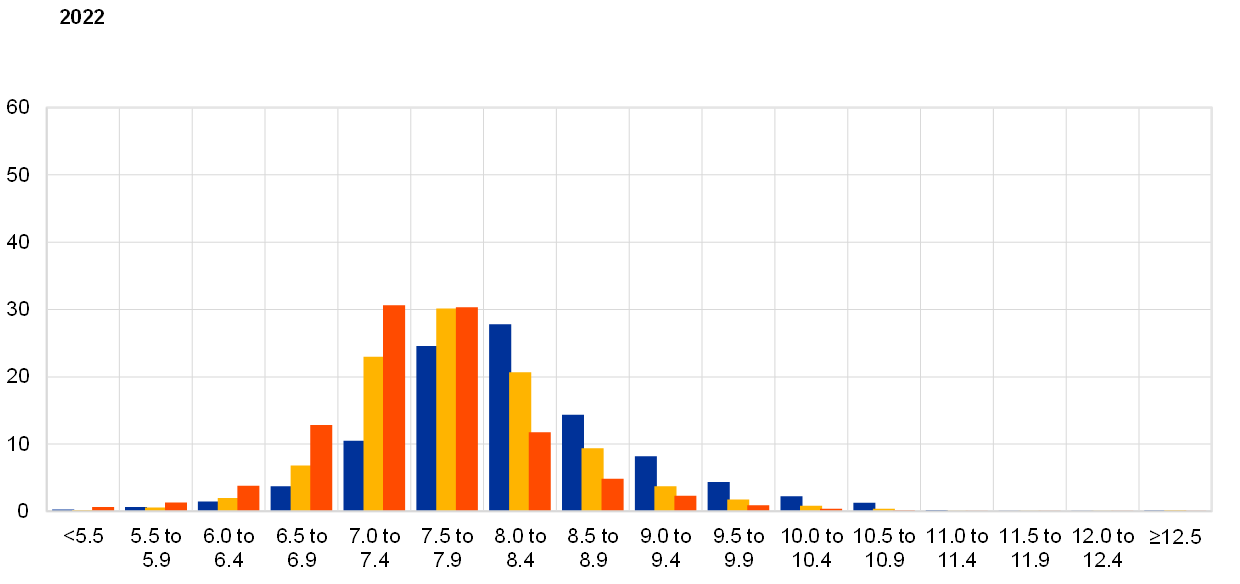
Notes: The SPF asks respondents to report their point forecasts and to separately assign probabilities to different ranges of outcomes. This chart shows the average probabilities they assigned to different ranges of unemployment rate outcomes for 2021, 2022 and 2023.
Chart 13
Aggregate probability distribution for the unemployment rate in the longer term
(x-axis: unemployment rate expectations, percentages of the labour force; y-axis: probability, percentages)
Notes: The SPF asks respondents to report their point forecasts and to separately assign probabilities to different ranges of outcomes. This chart shows the average probabilities they assigned to different ranges of unemployment rate outcomes in the longer term.
5 Expectations for other variables
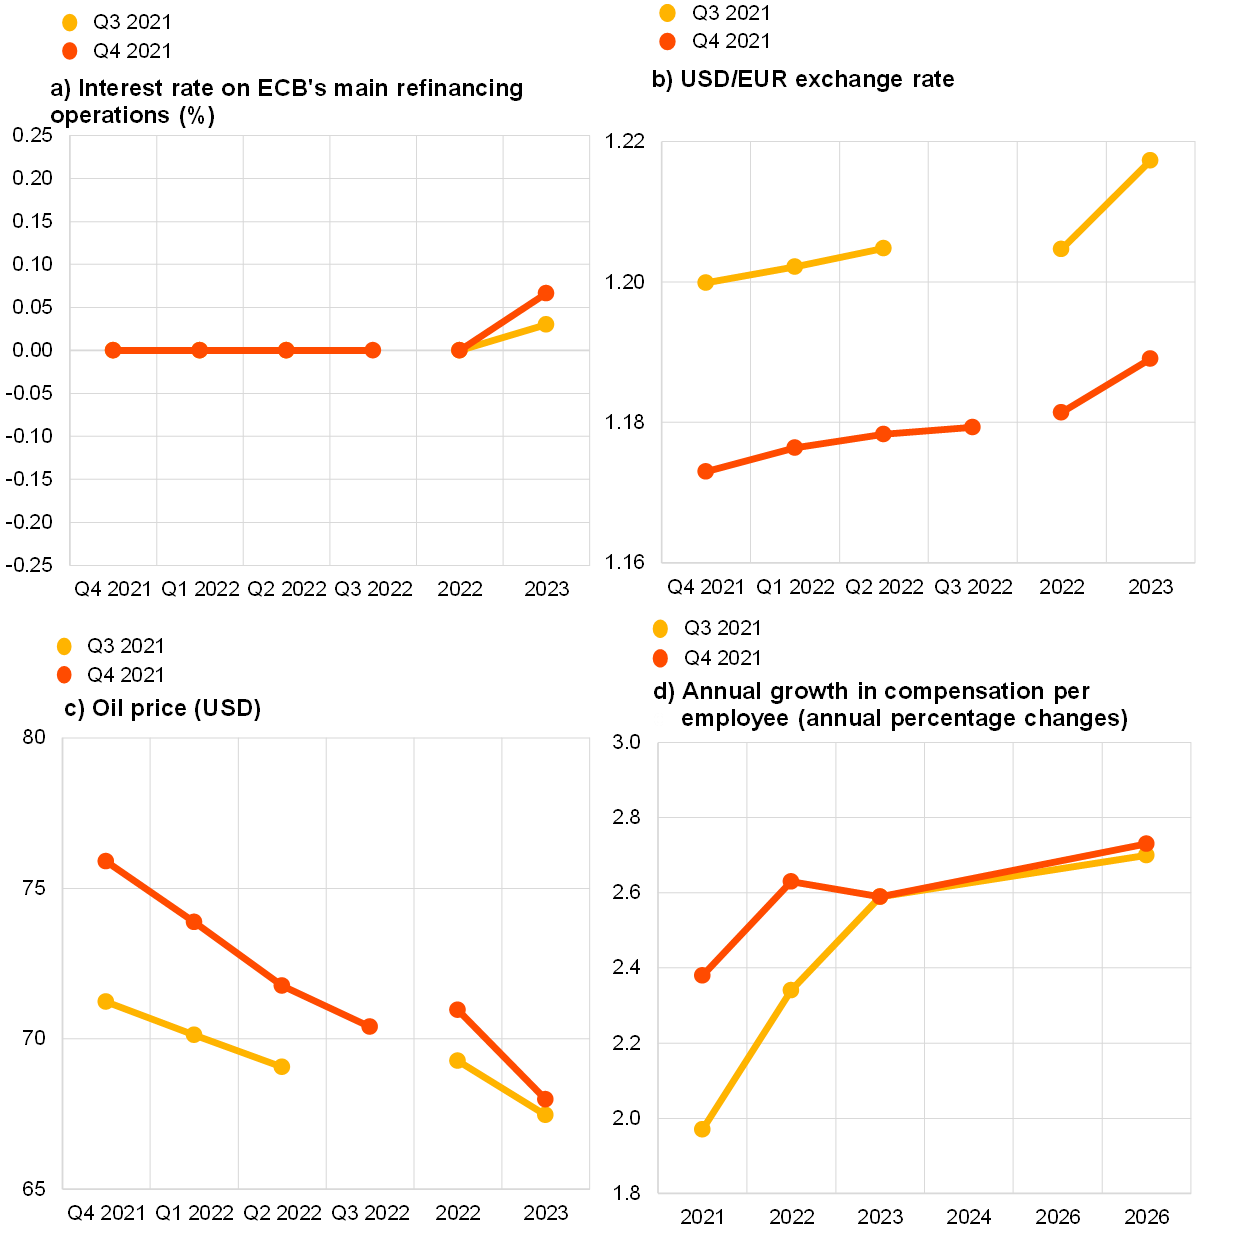
Respondents expected: (i) the ECB’s main policy rates to remain largely unchanged until at least 2023; (ii) the euro to be largely stable against the dollar at about 1.18 until 2023; (iii) oil prices to decrease gradually to levels around USD 68 per barrel by 2023; and (iv) nominal wage growth to increase over the whole forecast horizon from around 2.4% in 2021 to 2.7% by 2026.
The median (and majority) expectation for the rate on the ECB’s main refinancing operations was for it to remain at 0% until at least 2023. Overall, interest rate expectations were essentially unchanged from the previous round (see panel (a) of Chart 14).
The average USD/EUR exchange rate was revised downward to around 1.17 for the fourth quarter of 2021 and expected to broadly remain at that level (1.18) in 2022, with a slight increase to 1.19 expected for 2023 (see panel (b) of Chart 14). This is slightly lower when compared with the previous round, albeit with the same broad profile.
Compared with the previous round, the expected level of US dollar-denominated oil prices (per barrel) was revised upwards. The revisions were larger at around USD 4 per barrel for the fourth quarter of 2021, more modest at around USD 2 per barrel for 2022, and almost negligible for 2023. Overall, the profile of expected oil prices follows a downward trajectory from about USD 71 per barrel in the fourth quarter of 2021 to around USD 68 per barrel in 2023 (see panel (c) of Chart 14). Given the broadly unchanged profile of expectations for the USD/EUR exchange rate, the implied revisions to the profile for the oil price in euro terms are similar to the revisions to the profile in US dollar terms.
The profile of the average expectation for the annual growth in compensation per employee was revised upwards for 2021 and 2022 compared to the previous round, while remaining roughly the same from 2023 onwards. With an increase from 2.4% in 2021 to 2.7% in 2026, the expectations trajectory is still upward sloping but flatter than in the previous round – see panel (d) of Chart 14.
Chart 14
Expectations for other variables
6 Annex (chart data)
Excel data for all charts can be downloaded here.
© European Central Bank, 2021
Postal address 60640 Frankfurt am Main, Germany
Telephone +49 69 1344 0
Website www.ecb.europa.eu
All rights reserved. Reproduction for educational and non-commercial purposes is permitted provided that the source is acknowledged.
For specific terminology please refer to the ECB glossary (available in English only).
PDF ISSN 2363-3670, QB-BR-21-004-EN-N
HTML ISSN 2363-3670, QB-BR-21-004-EN-Q
- The survey was conducted on 1–11 October 2021 with 58 responses received – this is broadly in line with the historical average response of 59 for the fourth quarter (October) round. Participants were provided with a common set of the latest available data for annual HICP inflation (September 2021 flash estimates: overall inflation, 3.4%; underlying inflation, 1.9%), annual GDP growth (second quarter of 2021, 14.3%) and unemployment (August 2021, 7.5%). Note: 14.3% was the estimated annual growth rate in the second quarter of 2021 at the time the SPF survey was conducted. In its third estimate of euro area national accounts for the second quarter of 2021 (released on 18 October) Eurostat revised this down by 0.1 percentage point to 14.2%.
- The previously strongest cumulative upward revision over the course of two SPF rounds was 0.09 percentage points.
- Of the 34 respondents providing longer-term inflation expectations in both rounds (fourth quarter of 2021 and third quarter of 2021), 16 revised them up, 3 revised them down and 15 were unchanged.
- Of the 26 respondents who provided longer-term HICPX expectations in both the fourth quarter and third quarter rounds, 13 revised them up, one revised them down and 12 were unchanged.
- The width of the reported probability distributions indicates the perceived degree of overall uncertainty, whereas the asymmetry of the distributions indicates whether that uncertainty is more concentrated on higher or lower outturns, i.e. it measures the perceived balance of risks. Regarding uncertainty, it can be shown that the width (or standard deviation) of the aggregated probability distribution (“aggregate uncertainty”) is a function of the average width (or standard deviations) of the individual probability distribution (“individual uncertainty”) and standard deviation of the individual point forecasts (“disagreement”).
- 2.2% was the estimated quarter-on-quarter growth rate for the second quarter of 2021 at the time the SPF survey was conducted. In its third estimate of euro area national accounts for the second quarter of 2021 (released on 18 October), Eurostat revised this down by 0.1 percentage point to 2.1%.
-
29 October 2021