
Survey on the Access to Finance of Enterprises in the euro area - April to September 2022
1 Overview of the results
This report presents the main results of the 27th round of the Survey on the Access to Finance of Enterprises (SAFE) in the euro area, which was conducted between 7 September and 14 October 2022. The survey covered the period from April to September 2022. The sample comprised 10,984 enterprises in the euro area, of which 10,006 (91.1%) had fewer than 250 employees.[1]
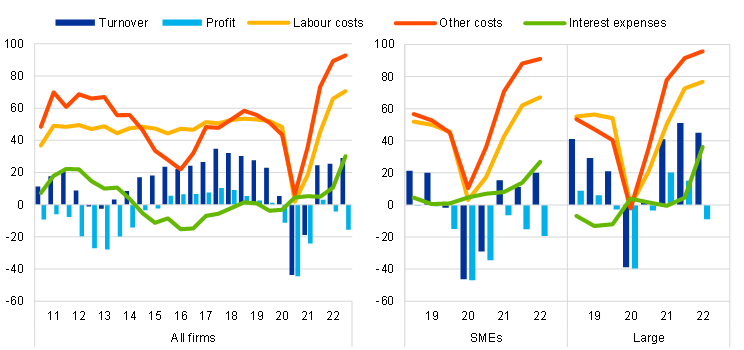
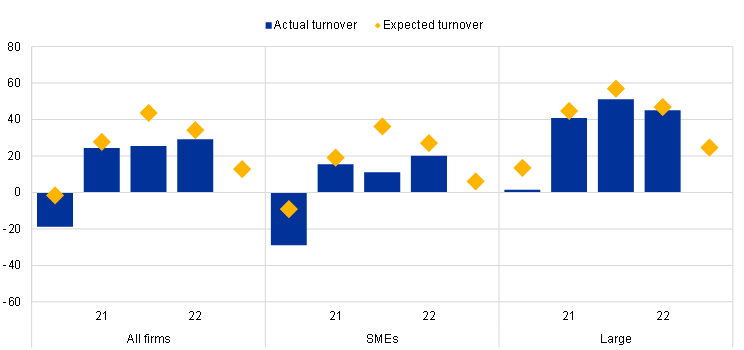
Euro area enterprises continued to signal a recovery in business activity over the past six months (with 29% in net terms[2] reporting increases in turnover) (see Chart 1 in Section 2). This is the third round in which enterprises have recorded improvements in turnover since the declines observed during the coronavirus (COVID-19) pandemic. Across firm sizes, it appears that large companies are still experiencing a faster rebound than small and medium-sized enterprises (SMEs).
Firms still expect increases in turnover, but they have become less optimistic as the war in Ukraine continues and amid rising inflation (see Chart 18 in Section 5). A net 13% of euro area firms now expect turnover to increase over the next six months (down from 34% in the previous survey round).
Despite the ongoing growth in turnover, euro area firms’ profitability continued to weaken, both for SMEs and for large firms (see Chart 1 in Section 2). More SMEs reported a continued deterioration in profits in net terms (-19% compared with -15% in the previous round), while large firms signalled a decline in profits (-9%), having reported an increase in the previous survey round (15%).
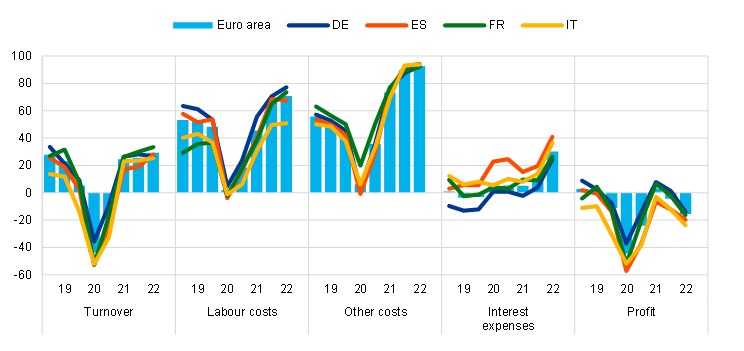
The weaker profitability again reflected a widely reported rise in materials and energy costs as well as labour costs. A net 91% of firms (up from 89% in the previous round) reported higher costs for materials and energy. Meanwhile, a net 71% (up from 66%) signalled an increase in labour costs. The significant rise in production costs is widespread across both firm sizes and countries.
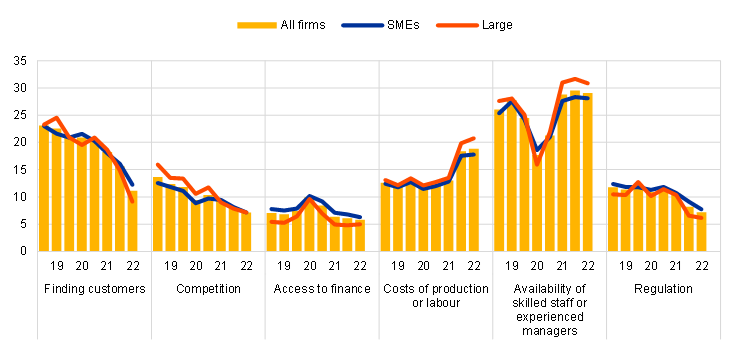
In this survey round, enterprises of all sizes reported that the lack of skilled labour and the rise in input costs were the dominant concerns for their business activity, while access to finance remained among the least-reported concerns (see Chart 4 in Section 2). The lack of skilled labour continued to be the main concern for euro area firms (29%), followed by the increase in the costs of production and labour (19%). At the same time, concerns about access to finance remained unchanged at a low level in the euro area (6%), while those about difficulty in finding customers declined (11%). Meanwhile, concerns about competition and regulatory burdens (both 7%) were relatively limited for enterprises in the euro area.
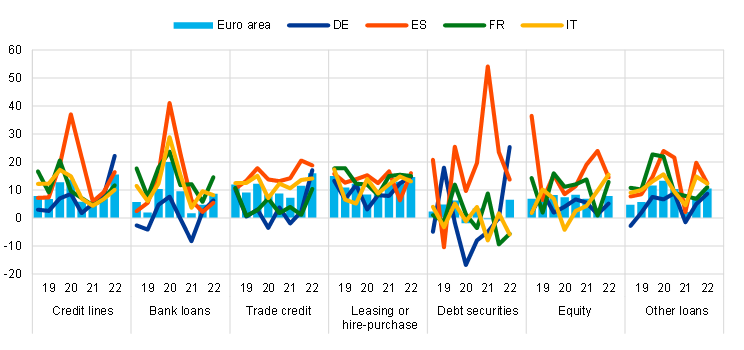
In net terms, euro area firms reported increased demand for external financing across instruments (see Table 1, columns 1-4 in this section and Chart 6 in Section 3.1). A net 9% of companies reported higher demand for bank loans (up from 5% in the previous survey round) and 16% for credit lines (up from 7%). The results are in line with those of the euro area Bank Lending Survey (BLS) for the second and third quarters of 2022, as well as being consistent with an acceleration in the overall growth in bank loans in the same period. The increased demand for external financing was also reported for other types of loans and equity. For most instruments, large firms reported increased demand for external financing more often than SMEs.
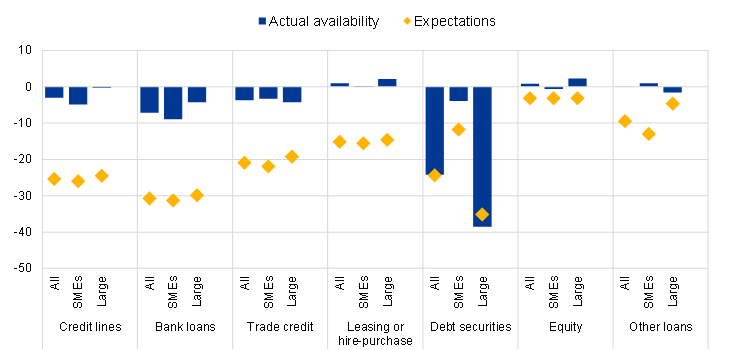
In addition, euro area firms reported that the availability of external financing had deteriorated slightly (see Table 1, columns 5-8 in this section and Chart 7 in Section 3.2). Specifically, firms reported (in net terms) a decline in the availability of bank loans (7%), credit lines (3%) and trade credit (4%). The availability of equity, leasing and other loans was reported to be broadly unchanged.
Firms’ higher financing needs along with lower availability of external funds resulted in a widening of the financing gap (see Table 1 in this section, columns 9-10 and Chart 8 in Section 3.2). In this survey round, 9% of firms reported a widening of the financing gap (up from 1%). Across size classes, large companies reported an increasing financing gap more often (11%) than SMEs (7%).
Table 1
Latest developments in SAFE country results for euro area firms
(net percentages of respondents)
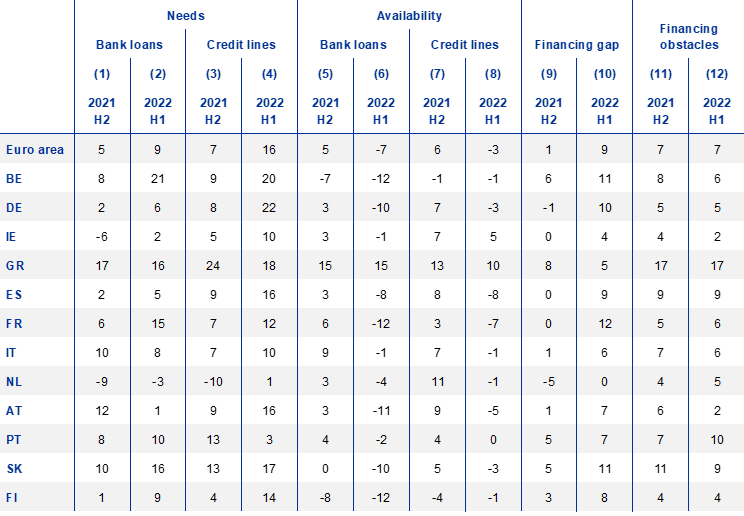
Notes: For the “financing gap”, see the notes to Chart 8; for “financing obstacles”, see the notes to Chart 12. “2021 H2” refers to round 26 (October 2021 – March 2022) and “2022 H1” refers to round 27 (April 2022-September 2022).
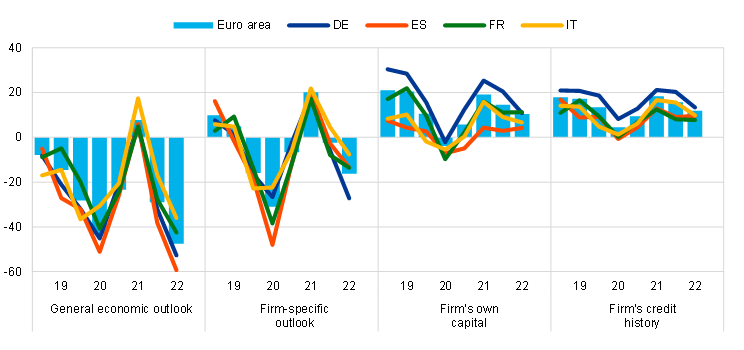
The outlook for economic activity, both at the aggregate level and at the firm level, was broadly perceived as deteriorating and thus hampering the availability of external financing (see Chart 10 in Section 4). A net 48% of firms reported a deterioration in the general economic outlook (compared with 29% in the previous round). Similarly, enterprises reported a further deterioration in firm-specific factors, such as outlook in terms of profits and turnover (-16%). By contrast, factors related to the capital position and creditworthiness (around 10%) were still having a positive impact on access to finance.
Euro area firms reported on balance that there had been no change in the willingness of banks to provide credit. However, while large companies continued to indicate that banks were taking a more positive attitude towards lending, for the first time since 2014 SMEs reported a slight deterioration in the willingness of banks to provide credit.
Despite the tightening in financing conditions, but in line with firms’ perceptions that access to finance was not the most important impediment for business activity, few firms reported obstacles to obtaining a bank loan, with percentages broadly unchanged from those of the previous survey rounds. The overall indicator[3] of obstacles preventing euro area enterprises from accessing bank loans remained unchanged at 7% (see Table 1, columns 11 and 12 in this section). In this survey round, the percentage of firms applying for bank loans remained unchanged (29%), with self-financing slightly declining. Most of the firms that applied were successful in obtaining the full amount requested, whether they were SMEs (62%) or large companies (73%), although these percentages were below the pre-COVID-19 levels.
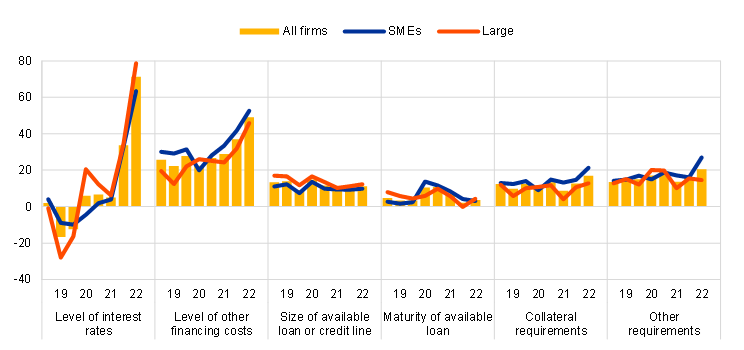
In this survey round, most enterprises reported increases in bank interest rates and a considerable deterioration in other costs of financing, a pattern that was common to all firm sizes and countries (see Chart 15 in Section 4). Specifically, a net 71% of firms reported rises in bank interest rates (up from 34%). No comparable percentage has been observed in the replies to questions about the price terms and conditions of bank financing since the survey started in 2009, which points to a widespread tightening of financing conditions across firms. This development is in line with the tightening related to collateral requirements and other terms and conditions. It also reflects the widening of margins applied to bank loans reported in the euro area BLS for the second quarter of 2022 and, more recently, the third quarter as well.[4]
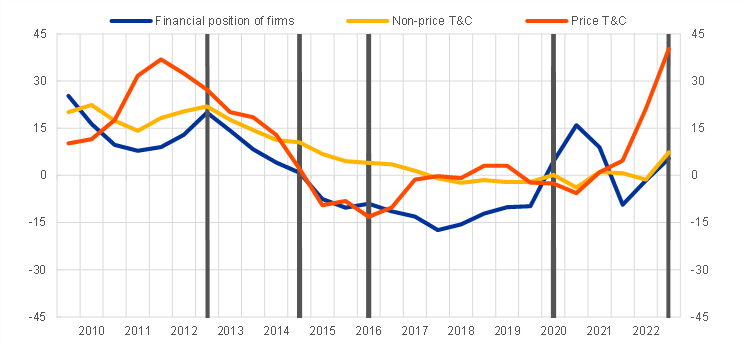
A comprehensive indicator reflecting the price terms and conditions of financing provided to firms shows a deterioration across firm sizes (see Chart A in this section). This indicator – denoted in the chart by the abbreviated form “price T&C” – mainly covers changes in bank interest rates and other costs of bank financing (charges, fees and commissions), and is one of three main components summarising how euro area firms perceive financing conditions.[5] The recent deterioration (which is denoted by positive indicator values) is reported by about 40% of both SMEs and large firms – a level not seen since the survey was introduced in 2009. Another indicator, summarising financing conditions in terms of firms’ balance sheet quality (profits, own capital and creditworthiness) deteriorated slightly during this survey round, both for large firms (4%) and for SMEs (5%), mainly reflecting firms’ negative perceptions of their ability to obtain external finance (see Section 4). Finally, the indicator denoted in the chart by “non-price T&C” focuses mainly on factors such as collateral requirements and other terms of loans, but weighs also on banks’ willingness to provide credit. This indicator has deteriorated for small firms lately, while it points to easing conditions for larger firms. The reason for the difference is that, unlike SMEs, large firms reported an increase in banks’ willingness to provide credit.
Chart A
Financing conditions as perceived by euro area firms
(weighted scores)
a) Small and medium-sized firms
b) Large firms
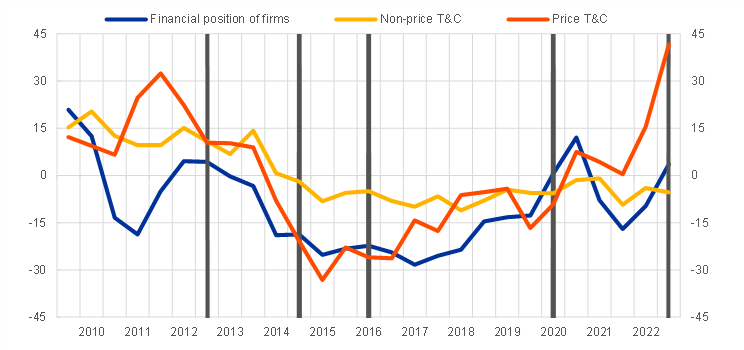
Notes: Indicator obtained by factor analysis. Positive values indicate a deterioration in firms’ financing conditions. For details, see the box entitled “Financing conditions through the lens of euro area companies”, Economic Bulletin, Issue 8, ECB, 2021. The individual scores are weighted by size class, economic activity and country to reflect the economic structure of the underlying population of firms. The individual scores are standardised, so they have a range of between -1 and 1 and are multiplied by 100 to obtain weighted balances in percentages. The first vertical grey line denotes the announcement of the Outright Monetary Transactions; the second vertical grey line denotes the start of the first series of targeted longer-term refinancing operations (TLTRO I) and the negative interest rate policy; the third vertical grey line denotes the start of TLTRO II and the corporate sector purchase programme; the fourth denotes the start of the pandemic emergency purchase programme and TLTRO III; the last vertical grey vertical line denotes the rise of the three key ECB interest rates by 50 basis points and approval of the Transmission Protection Instrument (TPI) in July 2022. Latest observation: April-September 2022.
Looking ahead, euro area firms are pessimistic regarding the availability of both internal and external financing (see Charts 16 and 17 in Section 5). Regarding external financing, firms are particularly pessimistic about access to bank loans and credit lines, with a net 31% and 25% of firms respectively expecting a deterioration over the next six months. At the same time, a net 8% of firms expect financing through internal funds to deteriorate.
Price terms and conditions are becoming an increasingly decisive factor in firms’ expectations of the future availability of bank loans. For all three indicators of financing conditions as perceived by firms, a tightening is associated with a deterioration in firms’ expectations about the future availability of bank loans (see Chart B). Since the outbreak of the pandemic, an increase in the indicator summarising price terms and conditions has been associated with an increasingly negative impact on firms’ expectations about the future availability of bank loans. Specifically, before the COVID-19 pandemic, a one standard deviation deterioration in price terms and conditions was associated with a 5% increase in the probability of an expected decline in bank loan availability. Since April 2021, the effect has increased to 9%. Overall, the empirical analysis shows not only that firms are more concerned about the rise in financing costs, but also that these concerns also translate more strongly into pessimism about the availability of finance. Among the three indicators of financing conditions, firms’ financial positions continue to have the largest marginal effect on firms’ expectations regarding the future availability of bank loans. Similar developments can be observed for the relationship between financial conditions and firms’ expectations about future turnover. While changes in financial conditions due to firms’ financial positions have historically had a strong effect on turnover, changes related to price terms and conditions have only become relevant for expected turnover in the most recent wave.[6]
Chart B
Contributions of the indicators of financing conditions to a deterioration in perceived future availability of bank loans
(average marginal effects, percentages)
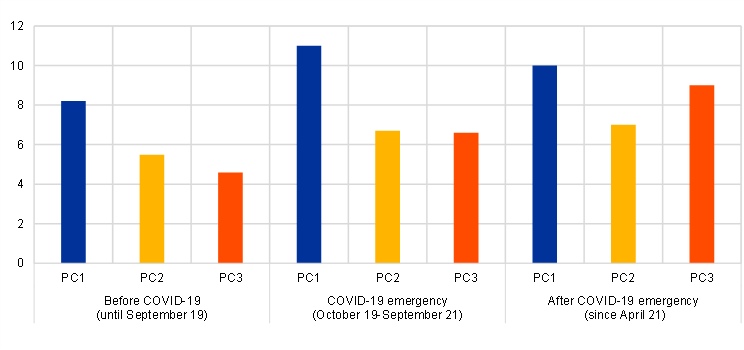
Notes: Average marginal effects of the increase by one standard deviation in the principal components on a deterioration in the future availability of bank loans based on logit regressions. PC stands for “principal component”. PC 1 refers to firms’ financial positions; PC 2 to non-price terms and conditions; PC 3 to price terms and conditions. For details, see the box entitled “Financing conditions through the lens of euro area companies”, Economic Bulletin, Issue 8, ECB, 2021. Latest observation: April-September 2022.
Overall, the survey results suggest a continued improvement in business activity, as firms expect turnover to continue rising in the next six months, albeit to a lesser extent than in the previous round. Owing to higher production costs for energy, materials and labour, more firms reported a drop in profitability.
Euro area firms signalled an increase in their financing needs as well as lower availability, resulting in a widening of the financing gap, especially for large companies. In addition, the percentage of firms reporting a rise in the price terms and conditions of bank loans was the highest since the beginning of the survey in 2009.
Despite the tightening of financial conditions, firms were not too concerned about access to finance in this survey round and reported no changes in banks’ willingness to lend. However, euro area firms expect a further deterioration in the availability of external financing in the coming six months as well as reduced ability to compensate for their financing needs with internal funds.
2 The economic situation of euro area firms
2.1 Business activity continues to improve, but increasing costs weigh on profitability
Business activity continued to improve among euro area firms over the last six months (see Chart 1). The net percentage of euro area firms reporting an increase in turnover in the survey rose to 29% (from 25%). This net percentage reflects the rebound in economic activity observed during the summer months and is widespread across firm sizes, although somewhat more so for larger companies. The net percentage of large firms reporting turnover growth dropped to 45% in this round (from 51%), while the figure was 20% for SMEs (up from 11%).
Chart 1
Changes in the income situation of euro area enterprises
(net percentages of respondents)
Base: All enterprises. The figures refer to rounds 3-27 of the survey (March 2010-September 2010 to April 2022-September 2022) for all firms and to rounds 20-27 (October 2018 -March 2019 to April 2022-September 2022) for SMEs and large firms.
Notes: Net percentages are the difference between the percentage of enterprises reporting an increase for a given factor and the percentage reporting a decrease. The data included in the chart refer to Question 2 of the survey.
At the same time, euro area enterprises reported continued increases in materials and energy costs, as well as labour costs. A very high proportion of euro area firms reported rises in materials and energy costs (93%, up from 89%) and in labour costs (71%, up from 66%), with the net percentage of firms reporting an increase in both types of costs standing at a new historical peak in the survey.
Similarly, firms reported an increase in interest expenses, in line with the upward trend in the cost of bank credit. The survey replies indicate a sustained pass-through from higher actual and expected policy rates to bank lending rates but with some differences across firm sizes. Large firms (36%, up from 5%) reported increased interest expenses more often than SMEs (27%, up from 14%).
Owing to rising costs, euro area firms’ profitability weakened further, despite the ongoing expansion in turnover. The net percentage of euro area corporations that signalled a decline in their profits over the last six months increased strongly (net -16%, from -4% in the previous wave). This negative development is shared by both SMEs and large companies. While SMEs continued to report on balance that profits had deteriorated (-19%, from -15%), large firms signalled a turning point in this survey round, with a net 9% of them signalling a decline in profits (from 15% signalling an increase in the previous survey round).
Across countries, trends in firms’ business activity have followed similar patterns in the past six months (see Chart 19 in Annex 1). The net share of firms reporting an expansion in turnover was very similar across the largest euro area countries. The deterioration in profits was somewhat more broadly reported by Italian and Spanish firms (net -24% and -20% respectively compared with -16% for all euro area firms). Changes in labour costs were similar across the large countries, except for Italy, where increases were less frequently reported (net 51% compared with 71% for all euro area firms).
Chart 2
Changes in the debt situation and real decisions of euro area enterprises
(net percentages of respondents)
Base: All enterprises. The figures refer to rounds 11-27 of the survey (March 2014-September 2014 to April 2022-September 2022) for all firms and to rounds 20-27 (October 2018 -March 2019 to April 2022-September 2022) for SMEs and large firms.
Notes: See the notes to Chart 1. The data included in the chart refer to Question 2 of the survey.
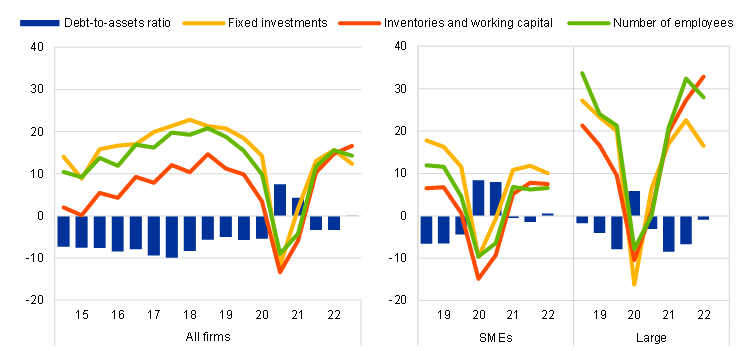
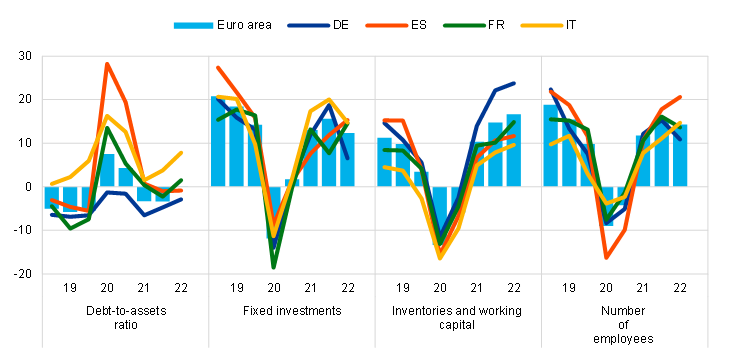
In net terms, euro area firms reported no change in debt-to-assets ratios in this survey round, but patterns diverged to some extent across euro area countries (see Chart 20 in Annex 1). In this survey round, euro area firms indicated on balance that there had been no change in their indebtedness (from a net 3% reporting a decline in the previous round – see Chart 2). However, while German and Spanish firms continued to report slight decreases in debt-to-assets ratios, French and, to an even greater extent, Italian firms signalled increases (see Chart 20).
Firms’ investment and employment growth has broadly held up, but with some heterogeneity. A net percentage of euro area enterprises reported increases in fixed investment (12%, down from 16%), inventories and working capital (17%, up from 15%) and number of employees (14%, down from 16%). The growth in fixed investment, inventories, and employment was more widely reported among large firms.
Growth in inventories and working capital were widespread across countries. In this survey round, German firms continued to report increases in inventories (24%) more broadly than firms in the other countries (around 10-15%). At the same time, increases in fixed investment were signalled most by Spanish, French and Italian firms (all 15%) than by German firms (7%).
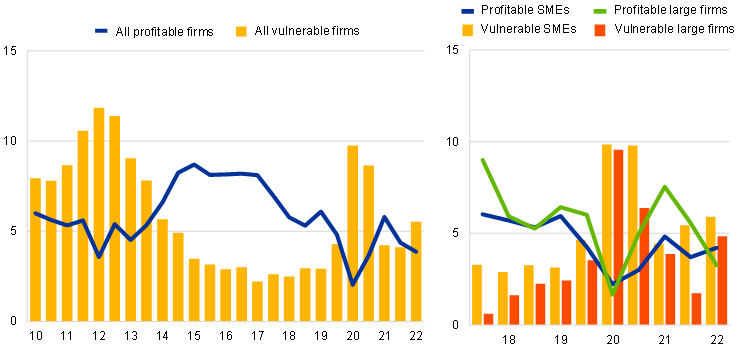
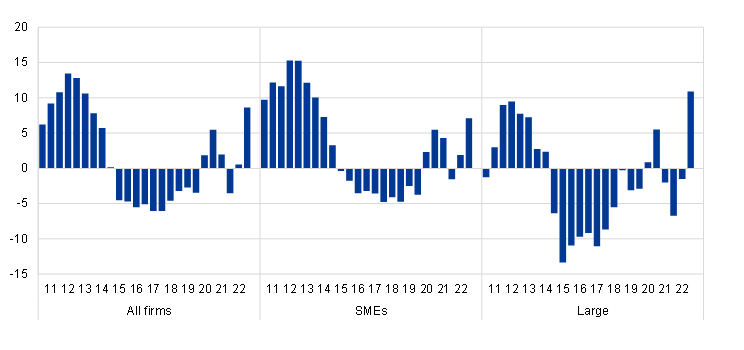
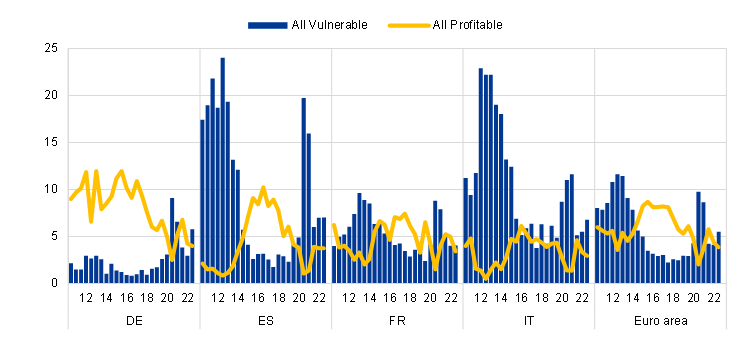
The financial vulnerability of euro area enterprises has increased for both SMEs and large firms (see Chart 3). The financial vulnerability indicator, a comprehensive indicator of firms’ financial situation[7], suggests that 6% of euro area enterprises encountered major difficulties in running their businesses and servicing their debts over the past six months. The increase in this survey round is more noticeable for large firms, with the percentage jumping from 2% to 5%. Meanwhile, 6% of SMEs can now be considered vulnerable (a minor increase). Moreover, financial vulnerability remains somewhat above its average levels prior to the outbreak of COVID-19. At the other end of the spectrum, the percentage of profitable firms (i.e. those that are more likely to be resilient to adverse shocks) fell to slightly below 4% overall. This was due to a sharp drop in the number of profitable large firms.
Chart 3
Vulnerable and profitable enterprises in the euro area
(percentages of respondents)
Base: All enterprises. The figures refer to rounds 3-27 of the survey (March 2010-September 2010 to April 2022-September 2022) for all firms and to rounds 18-27 (October 2017-March 2018 to April 2022-September 2022) for SMEs and large firms.
Notes: For definitions, see footnote 7. The data included in the chart refer to Question 2 of the survey.
The financial vulnerability indicator increased for German firms in particular (see Chart 21 in Annex 1). The percentage of vulnerable companies remained roughly constant in Spain (7%), Italy (7%) and France (4%), while it increased markedly in Germany (6%, up from 3%). By contrast, profitability decreased across the four largest economies in this survey round, in line with the euro area aggregate.
2.2 Euro area enterprises remain more concerned about staff availability and production costs than about access to finance
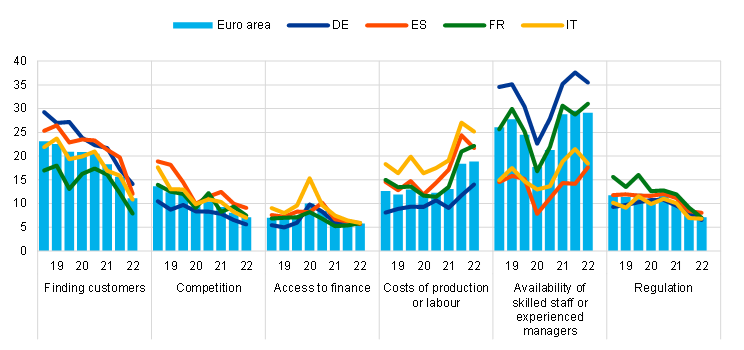
The availability of skilled labour and the rise in production costs have remained the main concern for euro area enterprises (see Chart 4). Even though slightly fewer euro area firms were most concerned about the availability of skilled labour, it remained the most pressing concern overall (signalled by 29% of firms, down from 30%). This remains in line with recent employment readings indicating general labour shortages as limitations to production. Production costs were more often reported as the main concern (19%, up from 18%), remaining the second most important concern for euro area enterprises. By contrast, difficulty in finding customers (11%, down from 16%), regulation and competition (both 7%, down from 8%) moderated again with respect to the previous survey rounds. These developments were common to both SMEs and large firms.
Companies’ main concerns differ across the largest euro area countries (see Chart 22 in Annex 1). Compared with the euro area average, German firms responding to the survey were particularly concerned about the availability of skilled labour (35%) but were less concerned about production costs (14%). By contrast, Italian and Spanish firms were more concerned about production costs (25% and 22%) and less concerned about the availability of skilled labour (both 18%).
Chart 4
The most important problems faced by euro area enterprises
(percentages of respondents)
Base: All enterprises. The figures refer to rounds 20-27 of the survey (October 2018-March 2019 to April 2022-September 2022).
Notes: The data included in the chart refer to Question 0b of the survey.
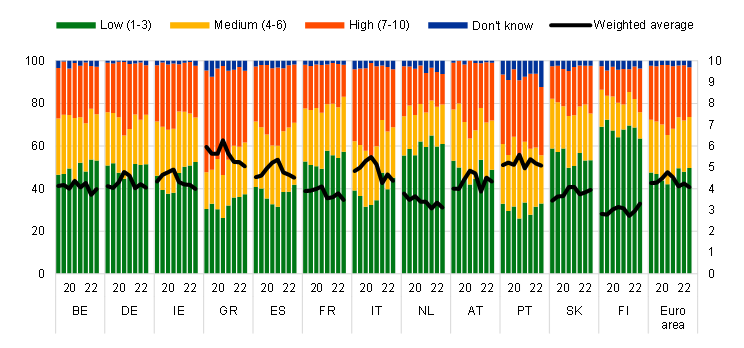
Despite the recent increases in the cost of borrowing, euro area firms were still not too concerned about access to finance. In the euro area, only 6% of firms reported access to finance as the main factor limiting production. This percentage remained broadly in line with pre-pandemic levels. In addition, firms reported that they were marginally less concerned about access to finance in this survey round compared with the last one (see Chart 5).
Chart 5
Importance of access to finance as perceived by euro area enterprises
(left-hand scale: percentages of respondents; right-hand scale: importance of access to finance on a scale of 1 to 10)

Base: All enterprises. The figures refer to rounds 18-27 of the survey (October 2017-March 2018 to April 2022-September 2022).
Notes: Enterprises were asked to indicate how important a specific problem was on a scale of 1 (not at all important) to 10 (extremely important). On the chart, the scale has been divided into three categories: low (1-3), medium (4-6) and high importance (7-10). The weighted average score is an average of the responses using the weighted number of respondents. The data included in the chart refer to Question 0b of the survey.
3 Demand for and availability of external financing
3.1 Increased demand for external financing across instruments
In net terms, euro area firms reported a considerable increase in the demand for external financing (see Chart 6). A net 9% of companies reported higher demand for bank loans[8] (up from 5% in the previous survey round), while 16% reported increased demand for credit lines (up from 7%). The results are in line with the Bank Lending Survey for the second and third quarters of 2022, as well as the overall growth in bank loans recorded in the euro area since April 2022. At the same time, net demand for trade credit and leasing or hire-purchase continued to increase (16% and 15% respectively), as did demand for other loans (mainly informal loans from family and friends, a related enterprise or shareholders), as well as equity and debt securities. The increased demand signals the need for firms to diversify their external financing as the cost of such financing is increasing across instruments, albeit at a different pace in each case. In this survey round, the increased demand for external financing was reported more often by large firms than SMEs for most instruments.
Chart 6
Changes in external financing needs of euro area enterprises
(net percentages of respondents)
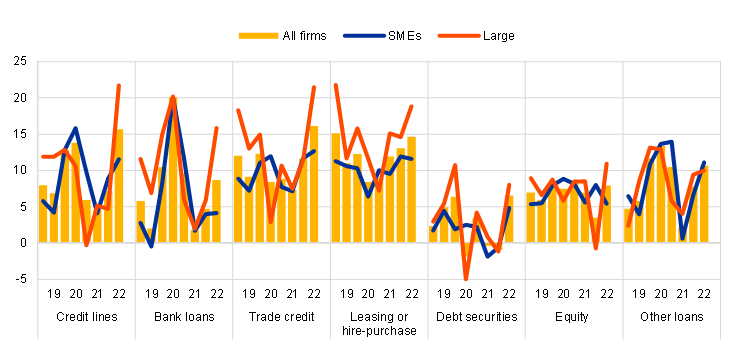
Base: Enterprises for which the instrument in question is relevant. The figures refer to rounds 20-27 of the survey (October 2018-March 2019 to April 2022-September 2022).
Notes: See the notes to Chart 1. The data included in the chart refer to Question 5 of the survey.
Demand for bank loans and credit lines continued to increase at a higher pace across most countries, although it remained below the peak reached during the first phase of the pandemic (see Chart 24 in Annex 1). The increase in net demand for bank loans was higher for French firms (15%), while needs for credit lines were more pronounced for German firms (22%).
3.2 Lower availability of external financing, mainly because of the deterioration in the economic outlook
3.2.1 Declining availability of bank loans across firm sizes and countries contributed to a widening of the financing gap
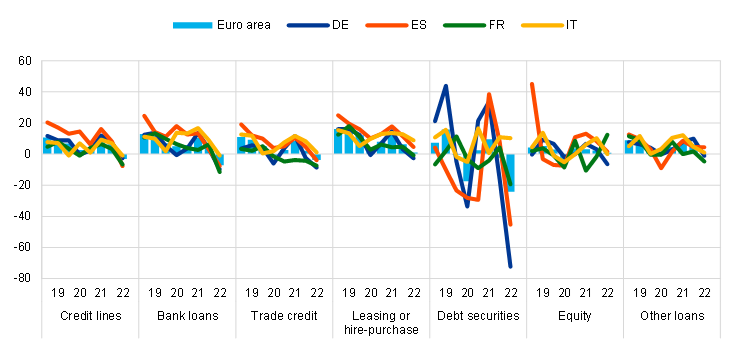
Firms reported a deterioration in the availability of most external financing sources relevant to their business (see Chart 7).[9] The net percentages of firms reporting a deterioration in the availability of bank loans and credit lines were 7% and 3% respectively. This was the first sizeable net decrease in bank loan availability since 2014 and stands in contrast to the results of the previous survey round, in which firms reported increased availability of both bank loans and credit lines. In addition, firms signalled a decrease in the availability of trade credit over the past six months (4%). The availability of equity, other loans and leasing was reported to be roughly unchanged, while the availability of debt securities dropped quite significantly. Similar developments were reported across size classes and countries (see Chart 26 in Annex 1).
Chart 7
Changes in the availability of external financing for euro area enterprises
(net percentages of respondents)
Base: Enterprises for which the instrument in question is relevant. The figures refer to rounds 20-27 of the survey (October 2018-March 2019 to April 2022-September 2022).
Notes: See the notes to Chart 1. The data included in the chart refer to Question 9 of the survey.
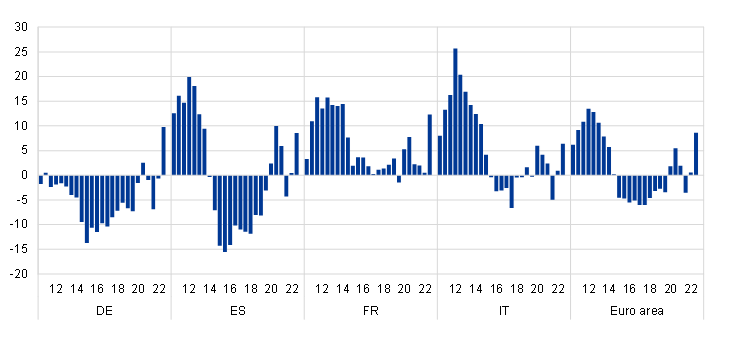
Firms’ increased needs for external finance combined with lower availability resulted in a widening of the financing gap (see Chart 8). In the euro area, the external financing gap – the difference between the change in demand for and the change in the supply of external financing – reached 9% (compared with 1% in the previous round). Among large companies, the external financing gap increased for a net 11% of firms (compared with 7% for SMEs), which is a new peak in the survey. In the last survey round, large firms reported on balance that there had been a slight decrease in the financing gap (-2%), while SMEs reported a similar sized net increase (2%). Among the largest euro area countries, the financing gap increased most broadly in France (16%) and Germany (10%). The change in the financing gap reported by German firms was by far the largest recorded in the history of the survey (see also Chart 27 in Annex 1).
Chart 8
Changes in the external financing gaps reported by euro area enterprises
(weighted net balances)
Base: Enterprises for which the instrument in question is relevant (i.e. they have used it or considered using it). Respondents replying with “not applicable” or “don’t know” are excluded. The figures refer to rounds 3-27 of the survey (March 2010-September 2010 to April 2022-September 2022).
Notes: The financing gap indicator combines both financing needs and the availability of bank loans, credit lines, trade credit, and equity and debt securities issuance at firm level. For each of the five financing instruments, the indicator of the perceived change in the financing gap takes a value of 1 (-1) if the need increases (decreases) and availability decreases (increases). If enterprises perceive only a one-sided increase (decrease) in the financing gap, the variable is assigned a value of 0.5 (-0.5). The composite indicator is a weighted average of the financing gaps for the five instruments. A positive value for the indicator points to an increase in the financing gap. Values are multiplied by 100 to obtain weighted net balances in percentages. The data included in the chart refer to Question 5 and Question 9.
3.3 Euro area firms used financing primarily for fixed investment and for inventories and working capital
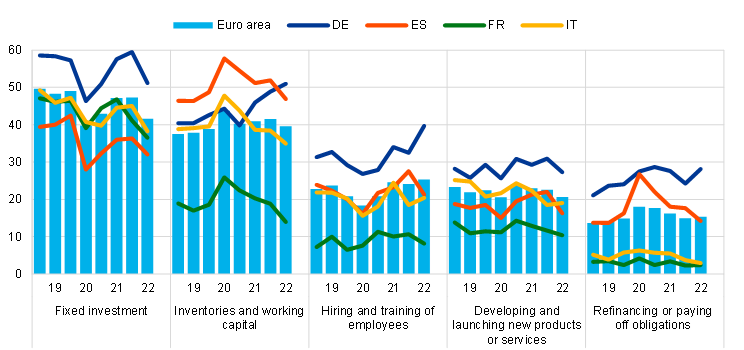
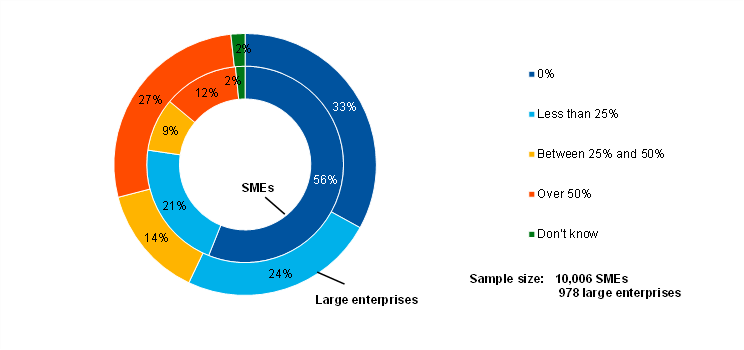
Financing from external and internal sources continued to be used mainly for fixed investment and for inventories and working capital (see Chart 9). Although fixed investment was reported as the most common purpose of financing (42% of firms), the percentage fell compared with the last survey round (47%), bringing it close to the levels observed during the first phase of the pandemic. This could reflect the incipient slowdown in economic activity (see Section 2). Financing was reported to be used for inventories and capital for 40% of firms, making it the second most common purpose. Across size classes, more large companies than SMEs used external finance for fixed investment (57% compared with 33%) and for working capital and inventories (51% compared with 33%), which might be due to large companies having greater capacity to build up precautionary inventories.
Chart 9
Purpose of financing as reported by euro area enterprises
(percentages of respondents)
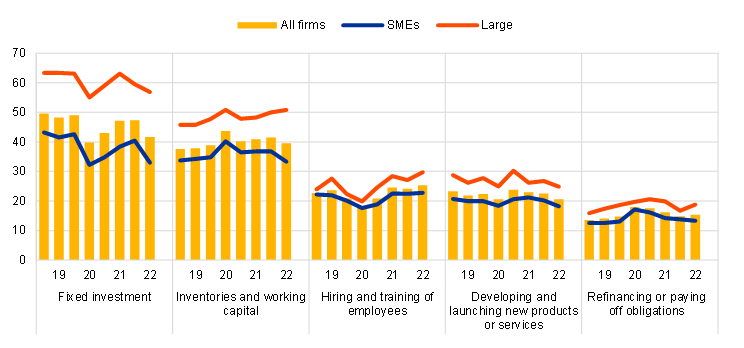
Base: All enterprises. The figures refer to rounds 20-27 of the survey (October 2018-March 2019 to April 2022-September 2022).
Note: The data included in the chart refer to Question 6A.
In all the largest euro area countries, fewer firms used financing for fixed investment, although it continues to be a more common purpose of financing among German firms (51%). German firms increasingly used financing for inventories and working capital (also 51%), while this purpose of financing declined in Spain, Italy and France (see Chart 25 in Annex 1).
4 Factors affecting financing conditions and financing obstacles
4.1 Euro area enterprises perceived the economic outlook as negatively affecting their ability to obtain external finance
The outlook for economic activity, both at aggregate level and at firm level, was broadly reported as an important factor hampering the availability of external financing (see Chart 10). In this survey round, euro area firms reported that changes in the general economic outlook had had a very strong negative impact on their access to finance (net -48% of firms, from -29%). Similarly, enterprises reported a further deterioration in firm-specific factors, such as the outlook in terms of profits and turnover (-16%, from -2%). Across size classes, a higher percentage of large companies than SMEs signalled a negative impact from both macroeconomic and firm-specific factors. By contrast, factors related to capital position (10%, down from 15%) and creditworthiness (12%, down from 16%) were still having a positive impact on access to finance. This may reflect the ongoing efforts of companies to restore their equity capital buffers and thus become more resilient to economic shocks.
Chart 10
Changes in factors that have an impact on the availability of external financing to euro area enterprises
(net percentages of respondents)
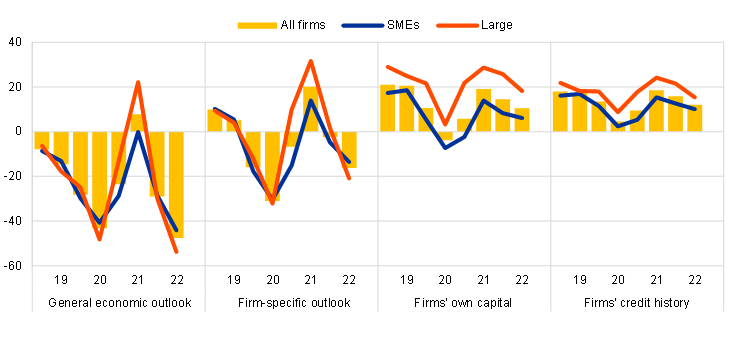
Base: All enterprises. The figures refer to rounds 20-27 of the survey (October 2018-March 2019 to April 2022-September 2022).
Notes: See the notes to Chart 1. The data included in the chart refer to Question 11 of the survey.
Among the largest euro area countries, the most pessimistic perceptions on the general economic environment came from Spanish and German companies. In net terms, 59% of Spanish and 53% of German companies reported a negative impact from the general economic outlook. German firms were also the most pessimistic about their own specific outlook (see Chart 28 in Annex 1).
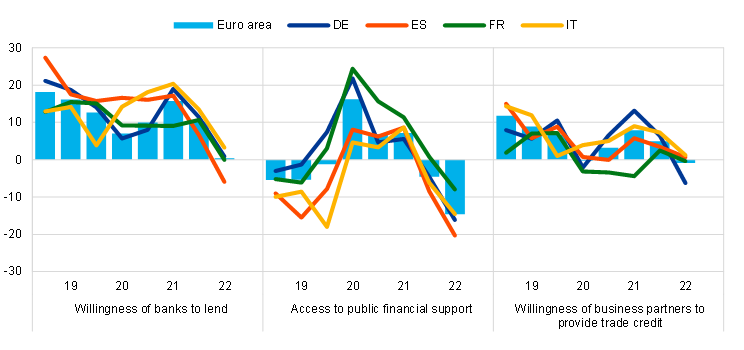
Euro area firms reported on balance that there had been no change in the willingness of banks to provide credit, although SMEs indicated a slight deterioration (see Chart 11). While large companies continued to indicate that banks were taking a more positive attitude towards lending, for the first time since 2014 SMEs indicated a deterioration in the willingness of banks to provide credit. There were small differences across countries: while Italian and German firms continued to report on balance that there had been a narrow improvement in banks’ willingness to provide credit, Spanish firms indicated a deterioration (see Chart 29 in Annex 1).
Enterprises reported more broadly that public financial support was playing a decreasing role in easing access to finance (see Chart 11). Reflecting the phasing-out of several support measures across the euro area, a net 15% of euro area firms considered the access of grants or subsidised loans to have declined. Looking at firm size, SMEs were more pessimistic than large firms in this respect. At country level, this perception was most widespread among Spanish firms (see Chart 29 in Annex 1).
Chart 11
Changes in factors that have an impact on the availability of external financing to euro area enterprises
(net percentages of respondents)

Base: All enterprises; for the category “willingness of banks to lend”, enterprises for which at least one bank financing instrument (credit line, bank overdraft, credit card overdraft, bank loan or subsidised bank loan) is relevant. The figures refer to rounds 20-27 of the survey (October 2018-March 2019 to April 2022-September 2022).
Notes: See the notes to Chart 1. The data included in the chart refer to Question 11.
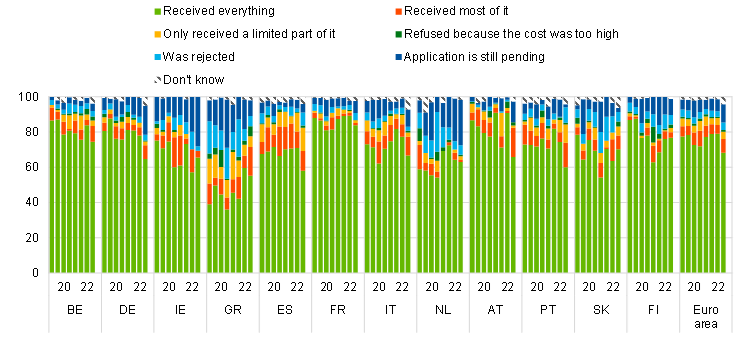
4.2 Few firms reported obstacles to obtaining a bank loan
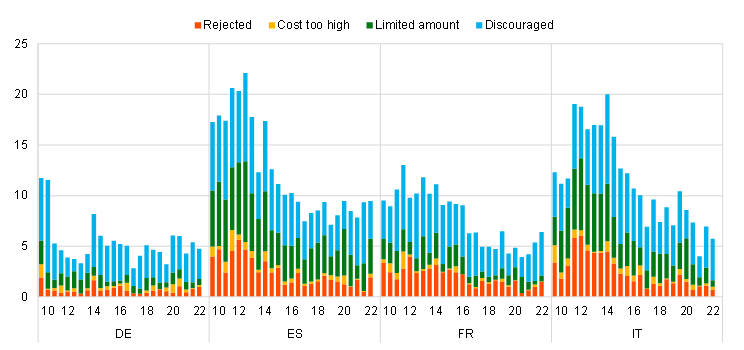
Despite the tightening of financing conditions, but in line with firms’ perceptions that access to finance was not the most important impediment for business activity, few firms reported obstacles to obtaining a bank loan, with percentages broadly similar to those recorded in the previous survey rounds (see Chart 12, panel a). Among enterprises that judged bank loans to be relevant for their funding, 7% faced obstacles when obtaining a loan (as in the previous survey round), while among SMEs the percentage remained slightly higher at 8%. Across countries, looking at the different components of financing obstacles, there were slight increases overall in the percentages of firms that either saw their applications rejected or received only part of the loan. The increases were strongest in Spain but were also seen in Germany and France (see Chart 30 in Appendix 1).
Chart 12
Obstacles to obtaining a bank loan
(percentages of respondents)
Panel a: Euro area enterprises

Panel b: Euro area SMEs and large enterprises
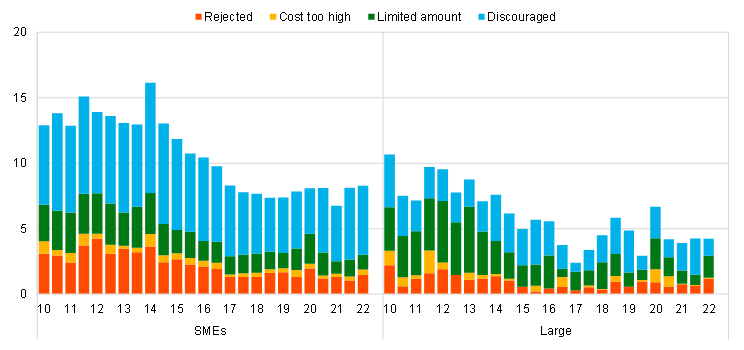
Base: Enterprises for which bank loans (including subsidised bank loans) are relevant. The figures refer to rounds 3-27 of the survey (March 2010-September 2010 to April 2022-September 2022).
Notes: Financing obstacles are defined here as the total of the percentages of enterprises reporting (i) loan applications that were rejected, (ii) loan applications for which only a limited amount was granted, (iii) loan applications that resulted in an offer that was declined by the enterprise because the borrowing costs were too high and (iv) a decision not to apply for a loan for fear of rejection (discouraged borrowers).
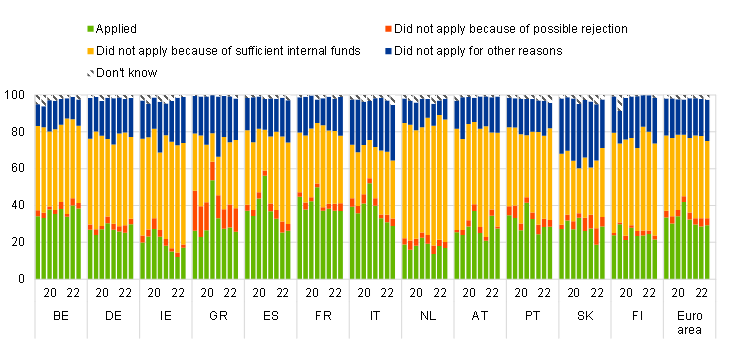
The percentage of firms applying for bank loans remained unchanged, with self-financing declining slightly (see Chart 13). According to figures based only on enterprises that deemed bank loans to be relevant for their business, 29% of firms reported having applied for a loan (unchanged). Only 22% of SMEs applied, with 44% reporting that they did not apply because they had sufficient internal funds available. By contrast, a higher percentage of large companies applied for bank loans (41%, up from 37%) in response to a depletion of internal funds. Most of the firms that applied were successful in obtaining the full amount requested, whether they were SMEs (62%) or large companies (73%), although these percentages declined to pre-COVID-19 levels (see Chart 14).
Chart 13
Applications for bank loans by euro area enterprises
(percentages of respondents)
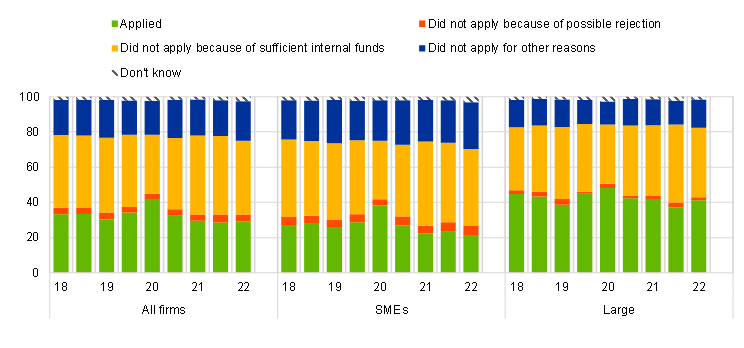
Base: Enterprises for which bank loans (including subsidised bank loans) are relevant. The figures refer to rounds 19-27 of the survey (April 2018-September 2018 to April 2022-September 2022).
Notes: The data included in the chart refer to Question 7A of the survey.
Chart 14
Outcome of applications for bank loans by euro area enterprises
(percentages of respondents)
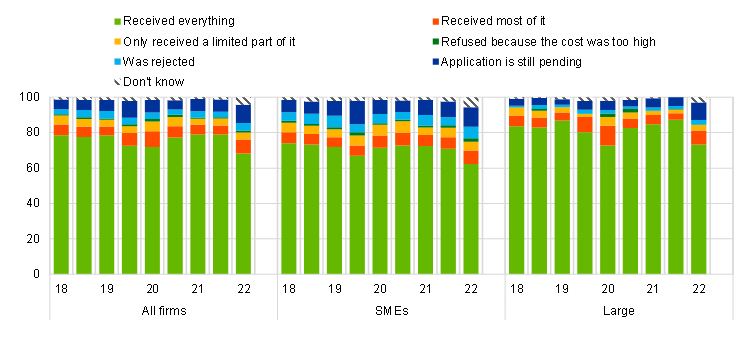
Base: Enterprises that had applied for bank loans (including subsidised bank loans). The figures refer to rounds 19-27 of the survey (April 2018-September 2018 to April 2022-September 2022).
Notes: The data included in the chart refer to Question 7B of the survey.
4.3 Significant tightening of financing conditions, with increases in price terms and conditions for bank loans
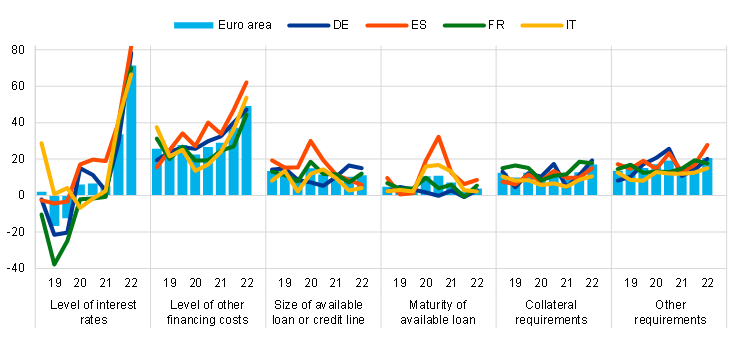
In this survey round, almost all firms across size classes and countries reported a rise in bank interest rates, alongside a considerable increase in other costs of financing (see Chart 15). The net percentage of firms reporting higher bank rates jumped to 71% (up from 34% in the previous round). No comparable percentage has been observed since the beginning of the survey in 2009, which points to a widespread tightening of financing conditions across firms. This development partly reflects the tightening of monetary policy and is in line with the widening of margins applied to bank loans reported in the euro area Bank Lending Survey (BLS) for the second quarter of 2022 and, more recently, the third quarter as well. At the same time, a net 49% of firms, up from a net 37%, also reported increases in other costs of financing (i.e. charges, fees and commissions). Again, this percentage reached historical highs within the survey period. The rises in bank interest rates and other costs of bank loans appear to be broadly similar across SMEs and large firms. Firms also reported stricter collateral requirements, while more firms indicated increases in the maturity of loans and in the size of loans.
Among the largest euro area countries, Spanish and German firms reported increases in bank interest rates the most frequently (see Chart 33 in Appendix 1). The broad increase in interest rates was widespread across countries, ranging from a net 66% increase in Italy to a net 82% increase in Spain.
Chart 15
Changes in the terms and conditions of bank financing for euro area enterprises
(net percentages of respondents)
Base: Enterprises that had applied for bank loans (including subsidised bank loans), credit lines, or bank or credit card overdrafts. The figures refer to rounds 20-27 of the survey (October 2018-March 2019 to April 2022-September 2022).
Notes: See the notes to Chart 1. The data included in the chart refer to Question 10.
5 Expectations regarding access to finance and turnover
5.1 Firms expect a substantial deterioration in their access to external financing
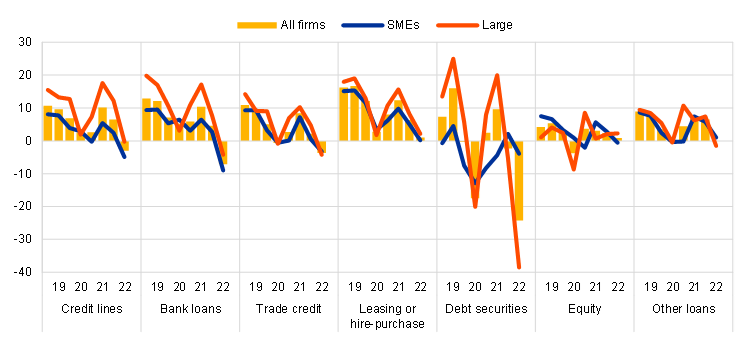
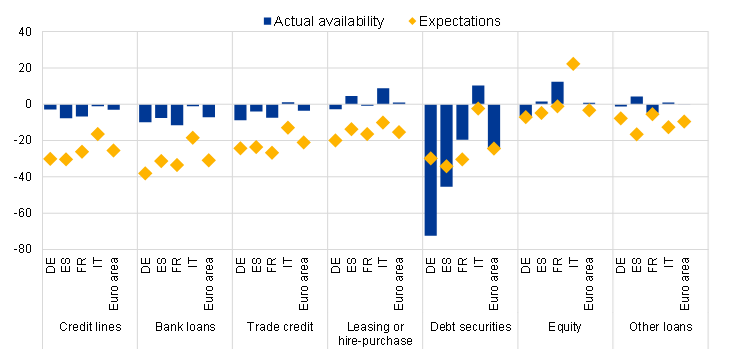
Euro area firms were pessimistic about the availability of most sources of external financing, especially financing from banks (see Chart 16). A relatively high percentage of firms reported a deterioration in the expected availability of bank loans and credit lines (31% and 25% respectively) over the next six months. The expected deterioration was common not only across size classes but also across countries (see Chart 34 in Annex 1). This reflects the prevailing economic uncertainty and the tightening credit stance of banks. Similarly, firms indicated a deterioration in their access to trade credit (-21%, from -13%), while large firms in particular were concerned about the prospects for issuing debt securities (with a net 35% expecting lower availability over the next six months).
Chart 16
Actual and expected availability of external financing for euro area enterprises
(past six-month period and next six-month period; net percentages of respondents)
Base: Enterprises for which the instrument in question is relevant. The figures refer to round 27 of the survey (April 2022-September 2022).
Notes: See the notes to Chart 1. The data included in the chart refer to Question 9 and Question 23 of the survey.
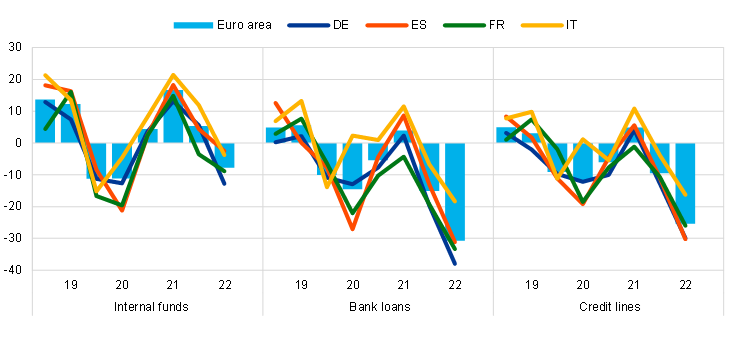
In addition to the expected reduction in availability of external finance, firms were also pessimistic about retained earnings as a means of financing their future business (see Chart 17). Across size classes, a net 8% of firms expected internal funds as a source of financing to deteriorate over the next six months. This is in line with firms’ expectations about future profitability (see Section 2).
Chart 17
Changes in euro area enterprises’ expectations regarding the availability of financing
(next six-month period; net percentages of respondents)

Base: Enterprises for which the instrument in question is relevant. The figures refer to rounds 20-27 of the survey (October 2018-March 2019 to April 2022-September 2022).
Notes: See the notes to Chart 1. The data included in the chart refer to Question 23 of the survey.
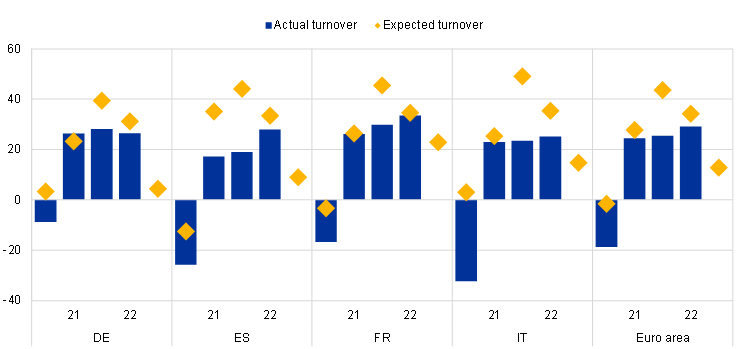
While firms still expect turnover to increase, they are less optimistic than in the last survey round (see Chart 18 in the report). A net 13% of euro area firms (down from 34% in the previous survey round) continue to expect an increase in turnover over the next six months. Expectations of future turnover have declined significantly during 2022, probably owing to the war in Ukraine and to rising inflation. Although firms across countries and size classes have become less optimistic regarding future turnover, more large firms (net 25%) than SMEs (net 6%) expect turnover to increase. Among the four largest euro area economies, German firms were the least optimistic (see Chart 36 in Appendix 1).
Chart 18
Actual and expected turnover among euro area enterprises
(past six-month period and next six-month period; net percentages of respondents)
Base: All enterprises. The figures refer to round 24-27 of the survey (October 2020-March 2021 to April 2022-September 2022).
Notes: See the notes to Chart 1. The data included in the chart refer to Question 2 and Question 26 of the survey.
Annexes
Annex 1
Overview of survey replies – country results
Chart 19
Changes in the income situation
(net percentages of respondents)
Base: All enterprises. The figures refer to rounds 20-27 of the survey (October 2018-March 2019 to April 2022-September 2022).
Notes: See the notes to Chart 1. The data included in the chart refer to Question 2 of the survey.
Chart 20
Changes in the debt situation and real decisions
(net percentages of respondents)
Base: All enterprises. The figures refer to rounds 20-27 of the survey (October 2018-March 2019 to April 2022-September 2022).
Notes: See the notes to Chart 1. The data included in the chart refer to Question 2 of the survey.
Chart 21
Vulnerable and profitable euro area enterprises
(percentages of respondents)
Base: All enterprises. The figures refer to rounds 3-27 of the survey (March 2010-September 2010 to April 2022-September 2022).
Notes: For definitions, see footnote 7. The data included in the chart refer to Question 2 of the survey.
Chart 22
The most important problems faced by enterprises
(percentages of respondents)
Base: All enterprises. The figures refer to rounds 20-27 of the survey (October 2018-March 2019 to April 2022-September 2022).
Notes: The data included in the chart refer to Question 0b of the survey.
Chart 23
Importance of access to finance
(left-hand scale: percentages; right-hand scale: weighted averages)
Base: All enterprises. The figures refer to rounds 20-27 of the survey (October 2018-March 2019 to April 2022-September 2022).
Notes: Enterprises were asked to indicate how important a specific problem was on a scale of 1 (not at all important) to 10 (extremely important). On the chart, the scale has been divided into three categories: low (1-3), medium (4-6) and high importance (7-10). The weighted average score is an average of the responses using the weighted number of respondents. The data included in the chart refer to Question 0b of the survey.
Chart 24
Changes in external financing needs
(net percentages of respondents)
Base: Enterprises for which the instrument in question is relevant. The figures refer to rounds 20-27 of the survey (October 2018-March 2019 to April 2022-September 2022).
Notes: See the notes to Chart 1. The data included in the chart refer to Question 5 of the survey.
Chart 25
Purposes of financing
(percentages of respondents)
Base: All enterprises. The figures refer to rounds 20-27 of the survey (October 2018-March 2019 to April 2022-September 2022).
Notes: The data included in the chart refer to Question 6A of the survey.
Chart 26
Changes in the availability of external financing
(net percentages of respondents)
Base: Enterprises for which the instrument in question is relevant. The figures refer to rounds 20-27 of the survey (October 2018-March 2019 to April 2022-September 2022).
Notes: See the notes to Chart 1. The data included in the chart refer to Question 9 of the survey.
Chart 27
Changes in the external financing gaps
(weighted net balances)
Base: Enterprises for which the instrument in question is relevant. Respondents replying with “not applicable” or “don’t know” are excluded. The figures refer to rounds 3-27 of the survey (March 2010-September 2010 to April 2022-September 2022).
Notes: The financing gap indicator combines both financing needs and the availability of bank loans, credit lines, trade credit, and equity and debt securities issuance at firm level. For each of the five financing instruments, the indicator of the perceived change in the financing gap takes a value of 1 (-1) if the need increases (decreases) and availability decreases (increases). If enterprises perceive only a one-sided increase (decrease) in the financing gap, the variable is assigned a value of 0.5 (-0.5). The composite indicator is a weighted average of the financing gaps for the five instruments. A positive value for the indicator points to an increase in the financing gap. Values are multiplied by 100 to obtain weighted net balances in percentages. The data included in the chart refer to Question 5 and Question 9.
Chart 28
Changes in factors that have an impact on the availability of external financing
(net percentages of respondents)
Base: All enterprises. The figures refer to rounds 20-27 of the survey (October 2018-March 2019 to April 2022-September 2022).
Notes: See the notes to Chart 1. The data included in the chart refer to Question 11 of the survey.
Chart 29
Changes in factors that have an impact on the availability of external financing
(net percentages of respondents)
Base: All enterprises; for the category “willingness of banks to lend”, enterprises for which at least one bank financing instrument (credit line, bank overdraft, credit card overdraft, bank loan or subsidised bank loan) is relevant. The figures refer to rounds 20-27 of the survey (October 2018-March 2019 to April 2022-September 2022).
Notes: See the notes to Chart 1. The data included in the chart refer to Question 11.
Chart 30
Obstacles to obtaining a bank loan
(percentages of respondents)
Base: Enterprises for which bank loans (including subsidised bank loans) are relevant for rounds 3-27 of the survey (March 2010-September 2010 to April 2022-September 2022).
Notes: Financing obstacles are defined here as the total of the percentages of enterprises reporting (i) loan applications that were rejected, (ii) loan applications for which only a limited amount was granted, (iii) loan applications that resulted in an offer that was declined by the enterprise because the borrowing costs were too high, and (iv) a decision not to apply for a loan for fear of rejection (discouraged borrowers). The calculation of the indicator starts in 2010, when the question on applications for credit lines was first included in the questionnaire. The components of the financing obstacles indicator were affected by the amendments to the questionnaire in round 11 (filtering based on the relevance of the financing instrument and addition of the new category “my application is still pending”), and past data have been revised accordingly. These figures include the categories “my application is still pending” and “don’t know”.
Chart 31
Applications for bank loans
(percentages of respondents)
Base: Enterprises for which bank loans (including subsidised bank loans) are relevant. The figures refer rounds 20-27 of the survey (October 2018-March 2019 to April 2022-September 2022).
Notes: The data included in the chart refer to Question 7A of the survey.
Chart 32
Outcome of applications for bank loans
(percentages of respondents)
Base: Enterprises that had applied for bank loans (including subsidised bank loans). The figures refer to rounds 20-27 of the survey (October 2018-March 2019 to April 2022-September 2022).
Notes The data included in the chart refer to Question 7B of the survey.
Chart 33
Changes in the terms and conditions of bank financing
(net percentages of respondents)
Base: Enterprises that had applied for bank loans (including subsidised bank loans), credit lines, or bank or credit card overdrafts. The figures refer to rounds 20-27 of the survey (October 2018-March 2019 to April 2022-September 2022).
Notes: See the notes to Chart 1. The data included in the chart refer to Question 10 of the survey.
Chart 34
Actual and expected availability of external financing
(past six-month period and next six-month period; net percentages of respondents)
Base: Enterprises for which the instrument in question is relevant. The figures refer to round 27 of the survey (April 2022-September 2022).
Notes: See the notes to Chart 1. The data included in the chart refer to Question 9 and Question 23.
Chart 35
Changes in expectations regarding the availability of financing
(next six-month period; net percentages of respondents)
Base: Enterprises for which the instrument in question is relevant. The figures refer to rounds 20-27 of the survey (October 2018-March 2019 to April 2022-September 2022).
Notes: See the notes to Chart 1. The data included in the chart refer to Question 23 of the survey.
Chart 36
Actual and expected turnover
(past six-month period and next six-month period; net percentages of respondents)
Base: All enterprises. The figures refer rounds 20-27 of the survey (October 2018-March 2019 to April 2022-September 2022).
Notes: The data included in the chart refer to Question 2 and Question 26 of the survey.
Annex 2
Descriptive statistics for the sample of enterprises
Chart 37
Breakdown of enterprises by economic activity
(unweighted percentages)
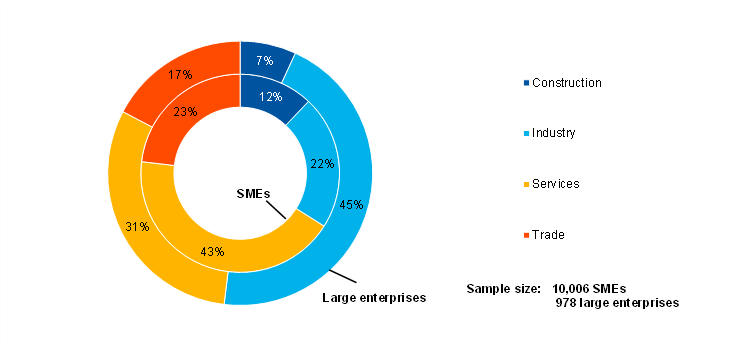
Base: The figures refer to round 27 of the survey (April 2022-September 2022).
Chart 38
Breakdown of enterprises by age
(unweighted percentages)
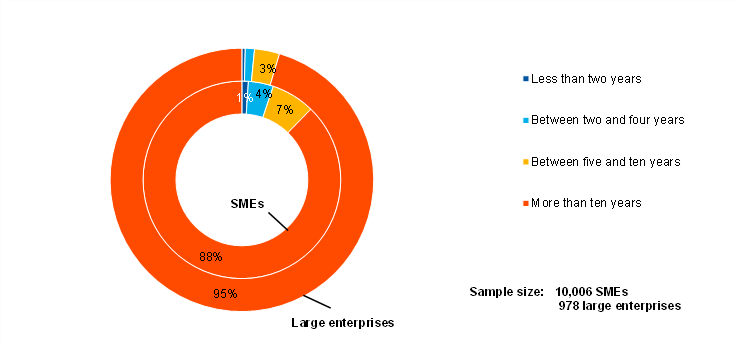
Base: The figures refer to round 27 of the survey (April 2022-September 2022).
Chart 39
Breakdown of enterprises by ownership
(unweighted percentages)
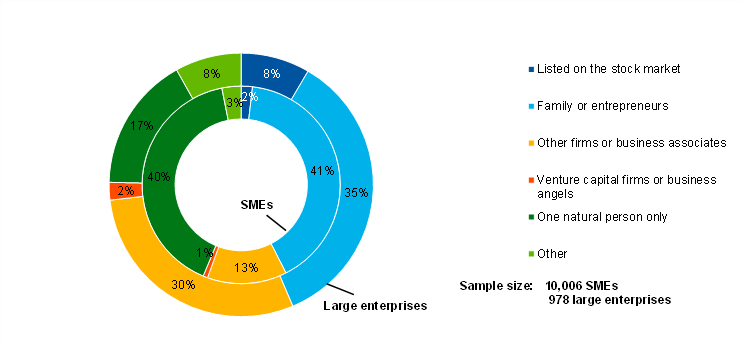
Base: The figures refer to round 27 of the survey (April 2022-September 2022).
Chart 40
Breakdown of enterprises by exports
(unweighted percentages)
Base: The figures refer to round 27 of the survey (April 2022-September 2022).
Annex 3
Methodological information on the survey
For an overview of how the survey was set up, the general characteristics of the euro area enterprises that participate in the survey and the changes introduced to the methodology and the questionnaire over time, see the “Methodological information on the survey and user guide for the anonymised micro dataset”, which is available on the ECB’s website.[10]
In this survey round, no major changes were made to the existing questions in the questionnaire.[11]
© European Central Bank, 2022
Postal address 60640 Frankfurt am Main, Germany
Telephone +49 69 1344 0
Website www.ecb.europa.eu
All rights reserved. Reproduction for educational and non-commercial purposes is permitted provided that the source is acknowledged.
The cut-off date for data included in this report was 5 December 2022.
For specific terminology please refer to the ECB glossary (available in English only).
PDF ISSN 1831-9998, QB-AP-20-002-EN-N
HTML ISSN 1831-9998, QB-AP-20-002-EN-Q
See Annex 3 for details of methodological issues relating to the survey.
The net percentages indicated in this report are defined as the difference between the percentage of enterprises reporting that something has increased and the percentage reporting that it has declined.
The financing obstacles indicator is the sum of the percentages of firms reporting the rejection of loan applications, loan applications for which only a limited amount was granted, and loan applications which resulted in an offer that was declined by the firms because the borrowing costs were too high, as well as the percentage of firms that did not apply for a loan for fear of rejection.
See https://www.ecb.europa.eu/stats/ecb_surveys/bank_lending_survey/html/index.en.html.
The indicator is one of the “principal components” derived from a factor analysis using firm-level survey replies since 2009 and is interpreted as relating to price terms and conditions. The aggregate indicator is the average of firm-level scores, weighted by size, economic activity and country. For a detailed description of the indicator, see the box entitled “Financing conditions through the lens of euro area companies”, Economic Bulletin, Issue 8, ECB, 2021.
Results based on logit regressions of firm-level expected deterioration of turnover on the three principal components used in Chart B. In two-wave backward-looking rolling window logit regressions, the average marginal effect of PC 3 is only statistically significant in the most recent wave 27.
Vulnerable firms are defined as firms that simultaneously report lower turnover, decreasing profits, higher interest expenses and a higher or unchanged debt-to-assets ratio, while profitable firms are those that simultaneously report higher turnover and profits, lower or no interest expenses and a lower or no debt-to-assets ratio. The third (and typically largest) group consists of firms that satisfy some, but not all, conditions of the vulnerable and profitable categories. See the box entitled “Distressed and profitable firms: two new indicators on the financial position of enterprises”, Survey on the Access to Finance of Enterprises in the euro area, October 2017 to March 2018, ECB, 2022.
Only survey respondents who report that a particular financing instrument is relevant for their enterprise are asked about their need for that source of financing.
Only those survey respondents which report that a particular financing instrument (i.e. bank loans, credit lines, trade credit, leasing or hire-purchase, debt securities, equity or other loans) is relevant for their enterprise are asked about the availability of that source of financing.
The questionnaire is available on the ECB’s website. It has been translated into various languages for the purposes of the survey.
-
6 December 2022