
Economic Bulletin Issue 7, 2022
Update on economic, financial and monetary developments
Summary
At its meeting on 27 October 2022, the Governing Council decided to raise the three key ECB interest rates by 75 basis points. With this third major policy rate increase in a row, the Governing Council has made substantial progress in withdrawing monetary policy accommodation. The Governing Council took its decision, and expects to raise interest rates further, to ensure the timely return of inflation to the ECB’s 2% medium-term inflation target. The Governing Council will base the future policy rate path on the evolving outlook for inflation and the economy, following its meeting-by-meeting approach.
Inflation remains far too high and will stay above the target for an extended period. In September, euro area inflation reached 9.9%. In recent months, soaring energy and food prices, supply bottlenecks and the post-pandemic recovery in demand have led to a broadening of price pressures and an increase in inflation. The Governing Council’s monetary policy is aimed at reducing support for demand and guarding against the risk of a persistent upward shift in inflation expectations.
The Governing Council also decided to change the terms and conditions of the third series of targeted longer-term refinancing operations (TLTRO III). During the acute phase of the pandemic, this instrument played a key role in countering downside risks to price stability. Now, in view of the unexpected and extraordinary rise in inflation, it needs to be recalibrated to ensure that it is consistent with the broader monetary policy normalisation process and to reinforce the transmission of policy rate increases to bank lending conditions. The Governing Council therefore decided to adjust the interest rates applicable to TLTRO III from 23 November 2022 and to offer banks additional voluntary early repayment dates. The recalibration of the TLTRO III terms and conditions will contribute to the normalisation of bank funding costs. The ensuing normalisation of financing conditions, in turn, will exert downward pressure on inflation, contributing to restoring price stability over the medium term. The recalibration also removes deterrents to early voluntary repayment of outstanding TLTRO III funds. Earlier voluntary repayments would reduce the Eurosystem balance sheet and, with that, contribute to the overall monetary policy normalisation.
Finally, in order to align the remuneration of minimum reserves held by credit institutions with the Eurosystem more closely with money market conditions, the Governing Council decided to set the remuneration of minimum reserves at the ECB’s deposit facility rate.
Economic activity
Global economic activity contracted in the second quarter of 2022, with survey data indicating that a subdued growth momentum will continue in the near term. Although there are some tailwinds for the world economy from the further easing of global supply chain pressures owing to improvements in supply and weakening of demand, downside risks persist. These are associated with continuing geopolitical uncertainty, in particular potential disruptions related to Russia’s unjustified war against Ukraine and a possible worsening of coronavirus (COVID-19) developments in the autumn and winter. Despite easing supply chain pressures, global trade momentum remains moderate amid the deteriorating global economic outlook.
Economic activity in the euro area is likely to have slowed significantly in the third quarter of 2022, and the Governing Council expects a further weakening in the remainder of 2022 and the beginning of 2023. By reducing people’s real incomes and pushing up costs for firms, high inflation continues to dampen spending and production. Severe disruptions in the supply of gas have worsened the situation further, and both consumer and business confidence have fallen rapidly, which is also weighing on the economy. Demand for services is slowing, after a strong performance in previous quarters when those sectors most affected by the pandemic-related restrictions reopened, and survey-based indicators for new orders in the manufacturing sector are falling. Moreover, global economic activity is growing more slowly, in a context of persistent geopolitical uncertainty, especially owing to the war in Ukraine, and tighter financing conditions. Worsening terms of trade, as the prices paid for imports rise faster than those received for exports, are weighing on incomes in the euro area.
The labour market continued to perform well in the third quarter, and the unemployment rate remained at the historically low level of 6.6% in August. While short-term indicators suggest that jobs were still being created in the third quarter, the weakening of the economy could lead to somewhat higher unemployment in the future.
To limit the risk of fuelling inflation, fiscal support measures to shield the economy from the impact of high energy prices should be temporary and targeted at the most vulnerable. Policymakers should provide incentives to lower energy consumption and bolster energy supply. At the same time, governments should pursue fiscal policies that show they are committed to gradually bringing down high public debt ratios. Structural policies should be designed to increase the euro area’s growth potential and supply capacity and to boost its resilience, thereby contributing to a reduction in medium-term price pressures. The swift implementation of the investment and structural reform plans under the Next Generation EU programme will make an important contribution to these objectives.
Inflation
Inflation rose to 9.9% in September, reflecting further increases in all components. Energy price inflation, at 40.7%, remained the main driver of overall inflation, with an increasing contribution from gas and electricity prices. Food price inflation also rose further, to 11.8%, as high input costs made food production more expensive.
Supply bottlenecks are gradually easing, though their lagged impact is still contributing to inflation. The impact of pent-up demand, while weakening, is still driving up prices in the services sector. The depreciation of the euro has added to the build-up of inflationary pressures.
Price pressures are evident in more and more sectors, in part owing to the impact of high energy costs feeding through to the whole economy. Measures of underlying inflation have thus remained at elevated levels. Among those measures, inflation excluding energy and food rose further to 4.8% in September.
Strong labour markets are likely to support higher wages, as is some catch-up in wages to compensate for higher inflation. Incoming wage data and recent wage agreements indicate that the growth of wages may be picking up. Most measures of longer-term inflation expectations currently stand at around 2%, although further above-target revisions to some indicators warrant continued monitoring.
Risk assessment
The incoming data confirm that risks to the economic growth outlook are clearly on the downside, especially in the near term. A long-lasting war in Ukraine remains a significant risk. Confidence could deteriorate further and supply-side constraints could worsen again. Energy and food costs could also remain persistently higher than expected. A weakening world economy could be an additional drag on growth in the euro area.
The risks to the inflation outlook are primarily on the upside. The major risk in the short term is a further rise in retail energy prices. Over the medium term, inflation may turn out to be higher than expected if there are increases in the prices of energy and food commodities and a stronger pass-through to consumer prices, a persistent worsening of the production capacity of the euro area economy, a persistent rise in inflation expectations above the Governing Council’s target, or higher than anticipated wage rises. By contrast, a decline in energy costs and a further weakening of demand would lower price pressures.
Financial and monetary conditions
Bank funding costs are increasing in response to the rise in market interest rates. Borrowing has also become more expensive for firms and households. Bank lending to firms remains robust, as they need to finance high production costs and build up inventories. At the same time, demand for loans to finance investment has continued to decline. Lending to households is moderating, as credit standards have tightened and demand for loans has decreased in a context of rising interest rates and low consumer confidence.
The most recent euro area bank lending survey reports that credit standards tightened for all loan categories in the third quarter of the year, as banks are becoming more concerned about the deteriorating outlook for the economy and the risks faced by their customers in the current environment. Banks expect to continue tightening their credit standards in the fourth quarter.
Conclusion
Summing up, the Governing Council decided at its meeting on 27 October 2022 to raise the three key ECB interest rates by 75 basis points, and expects to raise interest rates further, to ensure the timely return of inflation to its medium-term target. With this third major policy rate increase in a row, the Governing Council has made substantial progress in withdrawing monetary policy accommodation. The changes to the terms and conditions of the targeted longer-term refinancing operations will also contribute to the ongoing policy normalisation process.
The Governing Council’s future policy rate decisions will continue to be data-dependent and follow a meeting-by-meeting approach. It stands ready to adjust all of its instruments within its mandate to ensure that inflation returns to its medium-term inflation target.
Monetary policy decisions
The Governing Council decided to raise the three key ECB interest rates by 75 basis points. Accordingly, the interest rate on the main refinancing operations and the interest rates on the marginal lending facility and the deposit facility will be increased to 2.00%, 2.25% and 1.50% respectively, with effect from 2 November 2022.
The Governing Council decided to recalibrate the conditions of TLTRO III as part of the monetary policy measures adopted to restore price stability over the medium term. In view of the current inflationary developments and outlook, it is necessary to adapt certain parameters of TLTRO III to reinforce the transmission of policy rates to bank lending conditions so that TLTRO III contributes to the transmission of the monetary policy stance needed to ensure the timely return of inflation to the ECB’s 2% medium-term target. From 23 November 2022 until the maturity date or early repayment date of each respective outstanding TLTRO III operation, the interest rate on TLTRO III operations will be indexed to the average applicable key ECB interest rates over this period. The Governing Council also decided to offer banks three additional voluntary early repayment dates. In any case, the Governing Council will regularly assess how targeted lending operations are contributing to its monetary policy stance.
The Governing Council decided to set the remuneration of minimum reserves at the Eurosystem’s deposit facility rate. The change will become effective as of the beginning of the reserve maintenance period starting on 21 December 2022. Minimum reserves have until now been remunerated at the ECB’s main refinancing operations rate. However, under the prevailing market and liquidity conditions, the deposit facility rate better reflects the rate at which funds can be invested in money market instruments if not held as minimum reserves and the rate at which banks borrow funds in the money market to fulfil minimum reserves.
The Governing Council intends to continue reinvesting, in full, the principal payments from maturing securities purchased under the asset purchase programme for an extended period of time past the date when it started raising the key ECB interest rates and, in any case, for as long as necessary to maintain ample liquidity conditions and an appropriate monetary policy stance.
As concerns the pandemic emergency purchase programme (PEPP), the Governing Council intends to reinvest the principal payments from maturing securities purchased under the programme until at least the end of 2024. In any case, the future roll-off of the PEPP portfolio will be managed to avoid interference with the appropriate monetary policy stance.
The Governing Council will continue to apply flexibility in reinvesting redemptions coming due in the PEPP portfolio, with a view to countering risks to the monetary policy transmission mechanism related to the pandemic.
The Governing Council stands ready to adjust all of its instruments within its mandate to ensure that inflation stabilises at its 2% target over the medium term. The Transmission Protection Instrument is available to counter unwarranted, disorderly market dynamics that pose a serious threat to the transmission of monetary policy across all euro area countries, thus allowing the Governing Council to more effectively deliver on its price stability mandate.
1 External environment
Global economic activity contracted in the second quarter of 2022, with survey data indicating that a subdued growth momentum will continue in the near term. Although there are some tailwinds for the world economy from further easing of global supply chain pressures owing to improvements in supply and weakening of demand, downside risks persist. These are associated with continuing geopolitical uncertainty, in particular potential war-related disruptions and a possible worsening of coronavirus (COVID-19) developments in the autumn and winter. Despite easing supply chain pressures, global trade momentum remains moderate amid the deteriorating global economic outlook. While headline inflationary pressures seem to be peaking globally, the persistence in core inflation momentum, driven by high services price inflation, suggests only a gradual return of inflation towards targets.
Global growth is facing a slowdown amid rising recession concerns. Global GDP (excluding the euro area) contracted in the second quarter, mainly reflecting a decline in activity in China stemming from its zero-COVID restrictions, a fall in Russia’s GDP owing to the war, and a modest contraction in the United States. Overall, however, during the third quarter there was a relatively large degree of synchronisation across countries in terms of softening indicators of global activity, pointing to a deterioration in the outlook for the second half of this year. The global headline manufacturing PMI (excluding the euro area) declined further in September, remaining just above the neutral threshold and indicating continued subdued growth momentum in the third quarter. While the index rebounded somewhat for advanced economies, it fell into contractionary territory for emerging markets.
There are some tailwinds for the world economy from a further easing of global supply chain pressures. In September the global PMI supply shortages index improved for the fifth consecutive month (Chart 1). Supply pressures declined across all items, and the range across sectors also narrowed. Improvements in supply and a weakening in demand both explain the easing in supply chain bottlenecks, but downside risks persist owing to potential war-related disruptions and a possible worsening of COVID-19 developments in the autumn and winter. On the other hand, businesses seem to have adjusted to longer delivery times by building up larger stocks and strengthening the resilience of their supply chains to shocks. In September the global (excluding the euro area) inventories-to-new orders PMI ratio stood at its highest point since 2009, excluding the COVID-19 crisis in 2020. Accordingly, there is a risk that a further darkening of the outlook for global demand could cause excess inventories later on.
Chart 1
PMI suppliers’ delivery times
(diffusion indices)

Sources: Markit and ECB staff calculations.
Note: The latest observations are for October 2022 (flash estimates for United Kingdom, United States and Japan) and September 2022 for China and Global (excluding euro area).
Despite easing supply chain pressures, global trade momentum remains moderate amid the darkening global economic outlook. World (excluding the euro area) merchandise trade remained unchanged in August, after expanding in July. Continued growth in trade in emerging market economies (EMEs) was offset by a decline in trade in advanced economies, particularly in the United States. At the same time, more recent data point to a subdued global trade outlook. In particular, the global (excluding the euro area) PMI manufacturing output for September and the latest indices on export orders moved further into negative territory.
Global inflationary pressures remain very high. While annual headline inflation in OECD countries (excluding Turkey) remained stable at 7.9% in August, inflation excluding food and energy increased further to 5.3%. Moreover, core inflation momentum – driven by high services price inflation – remains persistent across countries (Chart 2). This contrasts with headline inflation momentum, which is declining on the back of lower energy prices.
Chart 2
Headline and core inflation in the United States, United Kingdom and Japan
(three month-on-three month annualised percentage changes; headline and core inflation)

Sources: OECD, Haver Analytics and ECB staff calculations.
Notes: Core inflation refers to inflation for all items excluding food and energy. The latest observations are for September 2022.
Prices for energy commodities have eased since the Governing Council’s meeting in September amid a gloomier economic outlook and a confluence of factors in the gas market. Oil prices have been broadly stable since the September Governing Council meeting (+0.7%), because the decision of OPEC+ to cut its oil supply offset the effects of lower demand owing to the moderation in global economic growth. On 5 October the cartel agreed to cut its oil supply target by 2 million barrels per day as of November in response to the recent downward trend in oil prices. However, the impact on actual OPEC+ supply is expected to be smaller, as several countries have been unable to meet production targets over the past year. At the same time, significant uncertainty prevails in the oil market, especially regarding the prospects for Russian oil supply. The G7 countries aim to enforce an oil price cap, which puts a ceiling on the price paid by third parties for Russian oil, by 5 December, when European Union sanctions banning seaborne imports of Russian crude come into force. European gas prices dropped by around 80% amid an easing in gas demand due to warmer than expected weather and the EU’s proposed measures to address high European energy prices, including an electricity savings plan that is also expected to reduce gas demand. High levels of EU gas in storage, more wind-generated electricity production, lower industrial gas demand and a higher supply of liquified natural gas and pipeline gas from Norway also weighed on spot gas prices, outweighing the effects of Russia’s complete shutdown of the Nord Stream 1 pipeline. However, the European gas market situation remains fragile. Any factor that increases gas demand, such as a colder than expected winter, would mean continued tight competition over securing gas supplies, adding to price pressures. The uncertainty in the European gas market is also illustrated by the high futures curve throughout 2023, which projects an average gas price of above 130 EUR/MWh, significantly higher than the current spot price.
The global economic slowdown has weighed further on metal and food prices, but supply risks persist. Since the September meeting of the Governing Council, non-energy commodity prices have fallen slightly, by 3.5%, as both metal prices and food prices declined somewhat amid worsening economic growth prospects. The easing of food price pressure was also supported by better supply prospects for some food categories (such as soybeans and coffee). Conversely, grain prices increased, as the recent developments in the war in Ukraine have led to heightened concerns about whether the safe corridor for Ukrainian grain exports at the Black Sea can be maintained.
Chart 3
Commodity price developments
(index: 23 February 2022 = 100)

Sources: Refinitiv, HWWI and ECB calculations.
Notes: Gas refers to the Dutch TTF gas price. The vertical line marks the date of the Governing Council meeting in September 2022. The latest observations are for 26 September 2022 for oil and gas and 21 September 2022 for commodities excluding energy.
In the United States, following the contraction in activity in the first half of the year, growth is set to remain subdued.[1] Real GDP growth fell in the second quarter by 0.1% quarter-on-quarter, owing to a negative contribution from inventories and, to a lesser extent, private investment and government consumption. Meanwhile, private consumption slowed, as high inflation has weighed on real incomes since the beginning of the year. Although showing initial signs of cooling down, the labour market remains persistently tight, with robust job gains in September and the unemployment rate still at low levels (3.5%). At the same time, inflation remains high, given the strong inflation momentum in services. Annual headline consumer price inflation eased to 8.2% in September as energy prices continued to decline. Excluding food and energy, annual inflation increased further to 6.6%. Looking ahead GDP growth is expected to remain subdued amid a significant tightening in credit conditions, mainly in response to the Federal Open Market Committee’s decisions to raise key interest rates, as well as the overall darkening global economic outlook.
In China, GDP growth rebounded somewhat in the third quarter, but key indicators point to a loss in momentum. The economy expanded in the third quarter of 2022, by 3.9% both in quarter-on-quarter and year-on-year terms. This rebound followed a sharp deceleration in the second quarter triggered by a large COVID-19 outbreak and the related severe containment measures. GDP growth was supported by a positive contribution from net trade, and a recovery in investment and consumption, which benefited from authorities’ stimulus measures and the reopening of the economy. However, with regard to momentum in September, key monthly indicators are already pointing to a significant slowdown in consumption, as the pace of growth in retail sales also slowed in August. The Chinese economy continues to face persistent headwinds from the zero-COVID policy which remains in place and from protracted weaknesses in the real estate sector. The 20th Congress of the Chinese Communist Party stressed the continuity of President Xi’s tenure and policies, focusing on self-reliance, for both economic and security reasons, and the strengthening of state-owned sectors, while playing down the pursuit of GDP growth at all costs.
In Japan, economic activity is expected to continue to recover in the third quarter despite some headwinds. July and August data suggest that private consumption, particularly in services, was resilient in the face of the COVID-19 wave over the summer, supported by pent-up demand. However, the recovery may be hampered by the impact of stronger price increases on consumer sentiment. Headline inflation remained at 3.0% in September, its highest level in about 30 years (excluding periods of VAT hikes). Higher food prices remain a key driver of inflation, mirroring higher international commodity prices and a weaker yen, as well as energy inflation. Core inflation increased but remains at more moderate levels (0.9%). Rising inflation expectations – both among households and firms – may signal a gradual pass-through of cost pressures to final prices. This hints at a potential change in firms’ traditionally cautious price-setting behaviour, a factor that has weighed on Japanese price dynamics in the past.
In the United Kingdom, the growth momentum weakened further. Monthly GDP in August surprised on the downside, at -0.3% month-on-month, reflecting declines in both the manufacturing and services sectors. Declining retail sales and record-low consumer confidence further underlined the weakness in consumer demand, while short-term indicators also pointed to a deterioration in business sentiment. The UK economy is expected to have entered recession in the third quarter. Consumer price inflation increased to 10.1% in September on account of higher prices for food and non-alcoholic beverages. Core inflation increased to 6.5% in September, driven in particular by rising prices charged by restaurants and hotels.
The worsening global outlook is weighing on the growth prospects of EMEs. Surveys point to weaker output in most EMEs, and new export orders softened, suggesting that activity is set to deteriorate further now that manufacturing firms have largely worked through their backlogs. The global tightening in monetary policy affects financial conditions and weighs on industrial production across EMEs. This is because, compared with advanced economies, they have a larger share of US dollar-denominated external liabilities and invoicing in US dollars is more prevalent. In Russia, monthly indicators signal a protracted recession, but no further sharp deceleration. In August, headline inflation declined to 14.3% owing to a stronger rouble exchange rate and weaker consumer demand. Overall, owing to the policies pursued and better macroeconomic conditions (i.e. fewer vulnerabilities), EMEs have so far avoided the major market turbulence seen during past episodes of global policy tightening.
2 Economic activity
High inflation continues to dampen spending and production by reducing purchasing power and pushing up costs for firms. Severe disruptions in the supply of gas have worsened the situation further, and confidence across sectors has fallen rapidly. After a strong performance in previous quarters, when those sectors most affected by the pandemic-related restrictions reopened, demand for services is now slowing. Moreover, in a context of persistent geopolitical uncertainty and tighter financing conditions, global economic activity is growing more slowly. Worsening terms of trade are weighing on incomes in the euro area, as the prices paid for imports rise faster than those received for exports. At the same time, while the labour market continues to perform well, the weakening of the economy could lead to somewhat higher unemployment in the future. Incoming data confirm that risks to the economic growth outlook are clearly on the downside, especially in the near term.
Euro area output displayed solid growth in the first two quarters of the year. Following a growth rate of 0.6% in the first quarter of 2022, there was another strong increase in real GDP in the second quarter of 2022, with it rising by 0.8% quarter on quarter (Chart 4). Domestic demand and, albeit to a lesser extent, net trade positively contributed to growth, whereas changes in inventories had a small negative impact. On the production side, output growth was mainly supported by a strong increase in value-added services. The rise in output was relatively broad-based across euro area countries. Growth did vary, largely reflecting the different extents to which countries were affected by the reopening of the services sector and increased tourism. Furthermore, the proximity of the war in Ukraine – and the associated sanctions against Russia and Belarus – had a clear adverse impact on growth in some countries in the second quarter.
Chart 4
Euro area real GDP, composite output PMI, and ESI
(left-hand scale: quarter-on-quarter percentage changes; right-hand scale: diffusion index)

Sources: Eurostat, European Commission, S&P Global and ECB calculations.
Notes: The two lines indicate monthly developments; the bars show quarterly data. The European Commission’s Economic Sentiment Indicator (ESI) has been standardised and rescaled to have the same mean and standard deviation as the Purchasing Managers’ Index (PMI). The latest observation is for the second quarter of 2022 for “Real GDP”, September 2022 for “ESI” and October 2022 for “Composite output PMI”.
Economic activity is expected to slow substantially over the coming quarters. The expected deterioration in growth dynamics is mainly owing to four interconnected factors. First, high inflation is dampening spending and production throughout the economy, and these headwinds are reinforced by gas supply disruptions. Second, the strong rebound in demand for services that came with the reopening of the economy will lose steam in the coming months. Third, the weakening in global demand, in addition to tighter monetary policy in many major economies, and the worsening terms of trade will mean less support for the euro area economy. Fourth, uncertainty remains high and confidence is falling sharply.
This weakening is corroborated by incoming economic data. The expected modest growth in the third quarter was a result of a positive carry-over effect from the second quarter combined with negative growth dynamics in the third quarter itself.[2] In the first two months of the third quarter industrial production (excluding construction) was 0.5% below its level in the second quarter. In the third quarter the euro area composite output PMI averaged 49.0, well below its level in the second quarter and in line with contracting activity. The PMI continued to decline further, falling to 47.1 in October. The recent deterioration in growth prospects reflects developments in both industry and services, with the former being affected by supply chain disruptions and high commodity prices brought about by Russia’s invasion of Ukraine, and the subsequent rise in overall uncertainty (Chart 5). In the latest ECB Survey of Professional Forecasters, which was conducted in early October, respondents forecast three consecutive quarters of contracting output, starting in the third quarter of this year.[3] Incoming data suggest that risks to the economic growth outlook are clearly on the downside, especially in the near term. More fundamentally and beyond any short-term considerations, at the current juncture it is crucial to increase the euro area’s growth potential and supply capacity and to boost its resilience. Well-designed structural policies will make an important contribution in this regard. One example would be to swiftly implement the investment and structural reform plans under the Next Generation EU programme.
Chart 5
Value added, production and PMI for manufacturing and services
(left-hand scale: quarter-on-quarter percentage changes; right-hand scale: index, February 2021 = 50, diffusion index)

Sources: S&P Global, Eurostat and ECB calculations.
Notes: The latest observation is for the second quarter of 2022 for “Value added” and October 2022 for “PMI output/activity”. In the “Manufacturing” panel, the latest observation is for August 2022 for “Production”, while in the “Services” panel, the latest observation for “Production” refers to June 2022 (with an estimate for July 2022 based on published country data).
The labour market in the euro area remains robust, but is losing some momentum. The unemployment rate stood at 6.6% in August 2022, unchanged from July 2022 and 0.8 percentage points lower than the pre-pandemic level observed in February 2020 (Chart 6). Quarter on quarter, total employment rose by 0.4% in the second quarter of 2022, after growing by 0.6% in the first quarter, broadly in line with economic activity. As a result of the economic recovery that followed the lifting of pandemic-related restrictions, job retention schemes covered 0.7% of the labour force in the second quarter of 2022, down from around 1.3% in the first quarter. Total hours worked in the second quarter of 2022 were 0.4% above pre-pandemic levels. That said, the recovery of hours worked following the lifting of coronavirus (COVID-19) restrictions remains quite heterogenous across the largest euro area countries and the main sectors of the economy.[4]
Chart 6
Euro area employment, PMI employment indicator and the unemployment rate
(left-hand scale: quarter-on-quarter percentage changes, diffusion index; right-hand scale: percentages of the labour force)

Sources: Eurostat, S&P Global and ECB calculations.
Notes: The two lines indicate monthly developments; the bars show quarterly data. The PMI is expressed as a deviation from 50 divided by 10. The latest observation is for the second quarter of 2022 for “Employment”, October 2022 for “PMI assessment of employment” and August 2022 for “Unemployment rate”.
Short-term labour market indicators continue to point to a euro area labour market that is resilient on the whole, albeit with some signs of a deceleration. The composite PMI employment indicator for the third quarter of 2022 was 52.8, thus suggesting further growth in employment from the second quarter. However, the PMI employment indicator peaked in May 2022, and developments in recent months indicate an overall loss of momentum. Looking at developments across different sectors, the PMI employment indicator continues to point to robust employment growth in services and manufacturing, while the construction sector is showing signs of deceleration.
Following a strong rebound of 1% in the second quarter of 2022, household real consumption growth likely moderated in the third quarter and is expected to weaken further in the last quarter of the year. Between April and June, spending on services increased strongly, bringing overall consumption close to its pre-pandemic level. In contrast, amid higher inflation, ongoing supply strains and elevated uncertainty, spending on both durable and non-durable goods fell. Consumption growth is estimated to have declined in the third quarter amid rising inflation and uncertainty and weakening demand for both goods and services. This weakness is suggested by the recent developments in retail sales, which, over the course of July and August 2022, stood on average 1.1% below their level in the second quarter. Furthermore, despite a rise in the third quarter, new passenger car registrations remained 17% below their pre-pandemic level. The European Commission’s indicator on consumer confidence rose in October but remained very close to its September record low, and much lower than in the second quarter. Households’ expected major purchases dropped in September, in line with deteriorating economic and financial expectations. The latest results from the Consumer Expectations Survey (CES) also suggest that households’ holiday spending plans moderated by September (Chart 7, panel a) amid the fading economic rebound that followed the lifting of COVID-19 restrictions. Furthermore, households’ intentions to buy major physical items, such as cars and household appliances, remained subdued.
Household savings might partly buffer the impact of the expected lower real disposable income on consumption. While accumulated savings in excess of the levels observed in the fourth quarter of 2019 amounted to around €900 billion by the second quarter of 2022, their liquid component, namely deposits in excess of the levels observed in the fourth quarter of 2019, amounted to only around €360 billion by August 2022.[5] Furthermore, these savings are concentrated in medium and high-income groups, which spend a lower share of their income on essentials and are thus less exposed to the cost-of-living crisis. In contrast, households in lower-income groups have accumulated smaller buffers and may need to reduce their real consumption and saving, or take from previous savings, i.e. “dissave”, in response to the energy and food price shocks. Lower-income households in particular perceive the recently introduced fiscal support measures as inadequate and have become more pessimistic about their consumption, while more people expect they will not be able to pay their utility bills on time.[6] Overall, despite the strengthened incentives to save due to the environment of elevated uncertainty, further reductions in saving levels are expected to provide some support for private consumption. The saving rate already fell from 15.2% in the first quarter of 2022 to 13.7% in the second quarter. It is expected to decline further in the second half of the year, as it still remains above its 12.9% average for the period 1999-2019.
Chart 7
Household holiday spending plans for the next 12 months and PMI output developments by energy dependence and sector
a) Holiday spending plans for the next 12 months
(percentages of respondents)

b) PMI output developments by energy dependence and sector
(percentages, point changes in PMI output/activity indicator between the second quarter of 2022 and the third quarter of 2022)

Sources: CES, S&P Global, OECD and ECB calculations.
Note: The latest observations are for September 2022.
After robust growth in the first half of 2022, business investment is expected to slow significantly in the second half of the year. Non-construction investment (excluding Ireland) grew by 0.8% quarter on quarter in the second quarter, albeit slowing from the previous two quarters.[7] Investment growth in machinery and equipment slowed markedly in the second quarter, despite a strengthening of investment in transport equipment, potentially reflecting an easing of supply bottlenecks in the sector.[8] However, the available indicators point to a marked slowdown in investment from the third quarter. Growth in industrial production of capital goods fell to around 0.4% quarter on quarter, according to data up to August. PMI new orders for capital goods also declined significantly in the third quarter, signalling a worsening outlook going into the final quarter of the year. In the latest round of the ECB Corporate Telephone Survey (CTS), respondents suggested that the current investment hesitancy stems from a combination of high uncertainty, elevated energy prices and rising financing costs.[9] The PMIs suggest that there have already been significant output reductions among the more energy-intensive sectors (Chart 7, panel b). Profitability appears to be declining while uncertainty, which is typically a major disincentive to invest, has risen substantially since the summer, as reflected in the European Commission’s survey indicators. The October 2022 euro area bank lending survey[10] also points to a further deterioration in loan demand for fixed investment purposes in the third quarter of the year.
Housing investment is likely to have recorded a second consecutive decline in the third quarter of 2022. After dropping in the second quarter by 0.7%, housing investment is estimated to have declined again in the third quarter, according to several short-term indicators. The number of building permits – a leading indicator of construction activity – declined in the second quarter, signalling fewer new projects in the pipeline. Building construction output in July and August stood on average 0.6% below its level in the second quarter (Chart 8). The PMI for residential construction output dipped further into contractionary territory, averaging 44.4 in the third quarter, down from 48.3 in the second quarter. According to a European Commission survey, the index for trends in construction activity also continued its decline in the third quarter. This is mainly due to subsiding demand, deteriorating financial conditions and worsening shortages of material. ECB surveys confirm the weakening in demand for housing investment. In the October round of the CTS, respondents from construction companies indicated abating expectations for activity in the coming months owing to tighter financing conditions, higher costs and greater uncertainty. The CES for August also highlights that households’ perceptions of housing as a good investment and expectations for house price increases, especially for higher-income households, have been deteriorating since the start of the year. All things considered, weakening demand is expected to significantly weigh on housing investment going forward.
Chart 8
Housing investment and short-term indicators
(left-hand scale: quarter-on-quarter percentage changes; right-hand scale: diffusion indices and quarter-on-quarter changes)

Sources: Eurostat, DG-ECFIN, S&P Global and ECB calculations.
Notes: The PMI is expressed as a deviation from 50. The latest observations are for the second quarter of 2022 for “Housing investment”, August 2022 for “Building construction output” and September 2022 for “Trends in construction activity” and “PMI residential output”.
Exports of goods rebounded in August, but the near-term outlook has since deteriorated significantly. In August 2022 nominal extra-euro area goods exports moderately expanded after a decrease in July, while extra-euro area goods imports continued to increase substantially. After stabilising in May and June, the goods trade balance tilted further into a deficit in July and August, mainly driven by rapidly rising import bills for energy. High-frequency data on trade point to a further easing of supply bottlenecks in the third quarter of 2022.[11] Forward-looking indicators point to a slowdown in exports of both goods and services, reflecting further weakness in manufacturing exports and a moderation in consumption growth due to the decline in real incomes. The September PMI indicates that export orders in the manufacturing sector fell deeper into contractionary territory, while export orders for services, following a tentative recovery in August, also point to further weakening. After a strong summer season, in September tourism indicators showed some signs of moderation.
3 Prices and costs
Inflation rose to 9.9% in September, reflecting further increases in all components. Energy price inflation, at 40.7%, remained the main driver of overall inflation, with an increasing contribution from gas and electricity prices. Food price inflation also rose further, to 11.8%, as high input costs made food production more expensive. Supply bottlenecks are gradually easing, though their lagged impact is still contributing to inflation. The impact of pent-up demand, while weakening, is still driving up prices in the services sector. The depreciation of the euro has added to the build-up of inflationary pressures. Price pressures are evident in more and more sectors, in part owing to the impact of high energy costs feeding through to the whole economy. Measures of underlying inflation have thus remained at elevated levels. Among those measures, inflation excluding energy and food rose further to 4.8% in September.
HICP inflation rose from 9.1% in August to 9.9% in September. This significant further increase was driven by all main components of the HICP. The energy component continued to account for almost half of overall inflation and the food component for another quarter, implying that these more volatile components with a consumption weight of around one-third currently explain three-quarters of headline HICP inflation (Chart 9).
Chart 9
Headline inflation and its main components
(annual percentage changes; percentage point contributions)

Sources: Eurostat and ECB calculations.
Note: The latest observations are for September 2022.
Energy price developments are influenced by different factors and, in turn, influence other HICP components. The annual rate of change in HICP energy edged up again to 40.7%, after having declined for two consecutive months in July and August. In terms of sub-components, this rise was driven by gas price inflation, which reached 72.2% in September (63.1% in August), while the annual rates of change for private transportation fuel and electricity prices were broadly unchanged in September, standing at high levels. One special factor behind the increase in the annual rate of change in energy prices was the discontinuation of certain temporary government measures (i.e. discounts for transportation fuels in Germany). The annual growth rates of industrial producer prices for energy increased strongly to 116.8% in August, after having remained somewhat lower between May and July. Food inflation rose substantially, from 10.6% in August to 11.8% in September, reflecting the pass-through of accumulated cost pressures and the impact of the drought this summer. While the increase in the annual growth rate of euro area farm gate prices was relatively small in September, compared with increases at the beginning of this year, the growth rate remains elevated. The growth rate of fertiliser prices picked up again after having declined over the summer, as some production plants closed due to high energy prices. The input cost pressures on food prices are visible in producer price dynamics of food manufacturing industries (Chart 10).
Chart 10
Energy and food input cost pressures on HICP food prices
(annual percentage changes)
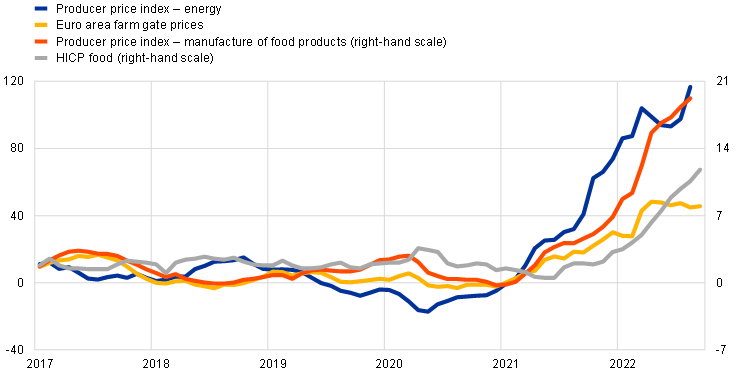
Source: Eurostat.
Note: The latest observations are for September 2022 for euro area farm gate prices and HICP food and August 2022 for the remaining items.
HICP inflation excluding energy and food (HICPX) increased further to 4.8% in September, reflecting rising inflation rates for both non-energy industrial goods (NEIG) and services inflation (Chart 9). NEIG inflation continued to increase to a record level of 5.5%, driven by prices for semi-durable and non-durable goods. While the durable goods inflation rate remained unchanged at a high level, month-on-month dynamics strengthened, driven by strong increases in the prices for cars and furniture. Services inflation rose to 4.3% in September (from 3.8% in August), with rates for transportation and miscellaneous services picking up the most on account of special factors. For transportation services, the discontinuation of the €9 public transport ticket in Germany was the main driver behind this increase, whereas for miscellaneous services, the largest increase was recorded in costs for education owing to the discontinuation of government discounts on tuition and course fees introduced during the COVID-19 crisis in the Netherlands.
Most indicators of underlying inflation continued to increase in September (Chart 11). This reflects the spreading of price pressures across increasingly more sectors and HICP items. In September, more than half of the items in the HICP showed annual inflation rates of above 4%. When removing from HICPX inflation the more volatile travel-related items, as well as clothing and footwear (HICPXX), this implies an increase in the measure to 4.4%, from 3.8%. The Supercore indicator, which comprises cyclically sensitive HICP items, rose to 5.5%, from 5.2% in August, while the model-based Persistent and Common Component of Inflation (PCCI), which is constructed by filtering out shorter-term disturbances but includes the energy component, declined slightly to 5.5%. While the PCCI has been declining since May, reflecting the lower monthly dynamics of energy inflation, the PCCI excluding energy has been stable at around 4% since June, edging slightly downwards in September. A large part of the underlying inflation dynamics can be attributed to indirect effects from the surge in energy and food prices and from exceptional developments in the balance between supply and demand related to both the pandemic and the Russian invasion of Ukraine. The unprecedented nature of these events makes it difficult to assess how persistent their impact on the different measures of underlying inflation will be. A key factor in underlying inflation developments are wages and labour costs. The latest available data (for the second quarter of 2022) continued to point to relatively moderate annual growth in both negotiated wages (2.4%) and actual wages, where growth in compensation per hour and growth in compensation per employee stood at 3.3% and 4.4% respectively, although the latter was considerably distorted upwards owing to the impact of job retention schemes.
Chart 11
Indicators of underlying inflation
(annual percentage changes)

Sources: Eurostat and ECB calculations.
Notes: The range of indicators of underlying inflation includes HICP excluding energy, HICP excluding energy and unprocessed food, HICPX (HICP excluding energy and food), HICPXX (HICP excluding energy, food, travel-related items, clothing and footwear), the 10% and 30% trimmed means, and the weighted median. The grey dashed line represents the ECB’s inflation target of 2% over the medium term. The latest observations are for September 2022.
Pipeline pressures on NEIG inflation remain strong, despite the recent moderation in inflation at early stages of the pricing chain (Chart 12). At the early stages of the pricing chain, the annual growth rates of import and domestic producer prices of intermediate goods industries declined for the fourth consecutive month, following a year of persistent increases. The annual growth rate of import prices of intermediate goods decreased by 1.5 percentage points (from 18.4% in July to 16.9% in August) and domestic producer prices decreased by 1.6 percentage points (from 21.5% in July to 19.9% in August). At the same time, developments at the earlier stages of the pricing chain tend to be more strongly shaped by energy prices, for which import prices recorded a renewed strong increase in August. At the later stages of the pricing chain, inflation rates of import and domestic producer prices for non-food consumer goods continued to show somewhat mixed signals. While import prices showed signs of stabilisation, the annual rate of change of producer prices increased to a record high of 8.6%.
Chart 12
Indicators of pipeline pressures
(annual percentage changes)

Sources: Eurostat and ECB calculations.
Note: The latest observations are for August 2022.
Survey-based measures of longer-term inflation expectations remained stable, at levels around or slightly above 2%, and are broadly in line with market-based measures of inflation compensation (Chart 13). According to the ECB’s Survey of Professional Forecasters (SPF), for the fourth quarter of 2022, longer-term inflation expectations (for 2027) were unchanged at 2.2%. The same applies to the longer-term expectations from the October Consensus Economics survey (for 2027), at 2.1%, and those from the October ECB Survey of Monetary Analysts (for 2026), at 2.0%. The ECB’s Consumer Expectations Survey in August also showed that the longer-term (three-years ahead) inflation expectations remained stable compared with July.[12] Market-based measures of inflation compensation (based on HICP excluding tobacco) continued to be subject to some volatility over the review period. Near-term maturities remained volatile, also following developments in the energy market, while longer-term maturities were more stable. These measures now suggest that inflation may already return to around 2% by the end of 2023, rather than over the course of 2024, as forecast prior to the September Governing Council meeting. However, longer-term measures of inflation compensation increased slightly over the review period. The five-year forward inflation-linked swap rate five years ahead increased by 10 basis points to 2.3%. Importantly, market-based measures of inflation compensation are not a direct measure of market participants’ actual inflation expectations, since these contain inflation risk premia that compensate for inflation uncertainty.
Chart 13
Survey-based indicators of inflation expectations and market-based indicators of inflation compensation
(annual percentage changes)

Sources: Eurostat, Refinitiv, Consensus Economics, Survey of Professional Forecasters, ECB staff macroeconomic projections for the euro area and ECB calculations.
Notes: The market-based indicators of inflation compensation series is based on the one-year spot inflation rate, the one-year forward rate one year ahead, the one-year forward rate two years ahead, the one-year forward rate three years ahead and the one-year forward rate four years ahead. The latest observations for market-based indicators of inflation compensation are for 25 October 2022. The Survey of Professional Forecasters for the fourth quarter of 2022 was conducted between 30 September and 6 October 2022. The cut-off date for the Consensus Economics long-term forecasts was October 2022. The cut-off date for data included in the ECB staff macroeconomic projections was 25 August 2022. The latest observations for the HICP are for September 2022.
The risks to the inflation outlook are primarily on the upside. The major risk in the short term is a further rise in retail energy prices. Over the medium term, inflation may turn out to be higher than expected if there are increases in the prices of energy and food commodities and a stronger pass-through to consumer prices, a persistent worsening of the production capacity of the euro area economy, a persistent rise in inflation expectations above the ECB’s target, or higher than anticipated wage rises. By contrast, a decline in energy costs and a further weakening of demand would lower price pressures.
4 Financial market developments
Over the review period (8 September to 26 October 2022) euro area asset prices remained volatile and market participants continued to update their expectations towards faster and more pronounced policy rate hikes in the euro area and globally. This revision in expectations was reflected in the euro area short and long-term risk-free rates, which both increased over the review period. Sovereign bond yields in the euro area increased in line with risk-free rates, meaning that sovereign spreads saw little change, although they displayed some volatility in certain countries. The higher rates and deteriorating growth outlook weighed on risky corporate assets, with European corporate bond spreads widening and equity prices experiencing elevated volatility and differentiation across sectors. The euro appreciated broadly in trade-weighted terms, while it appreciated only slightly against the US dollar.
Following the September Governing Council meeting, the euro area short-term risk-free rates rose as market participants revised their expectations towards a faster and more pronounced tightening of monetary policy. Over the review period the €STR averaged 57 basis points, which was the weighted average of -8.5 basis points between 8 September and 13 September, and 66 basis points after 14 September, i.e. following the ECB’s September interest rate hike. Excess liquidity increased by approximately €86 billion to €4,682 billion. The overnight index swap (OIS) forward curve – based on the benchmark €STR – displayed above-average volatility. Overall, as market participants’ inflation concerns outweighed rising fears of a recession, the OIS forward curve increasingly pointed towards expectations for a faster and more pronounced tightening of the ECB’s rate policy. At the end of the review period, the OIS forward curve priced in cumulative hikes amounting to 134 basis points by the end of 2022, implying a peak rate of approximately 3.0% in late 2023.
Long-term bond yields increased amid the market reassessment of the expected future monetary policy path (Chart 14). This increase came with significant intermediate swings, mostly in response to macroeconomic data releases and energy price developments, as well as the market fluctuations surrounding the announcement of a new expansionary fiscal package in the UK and the Bank of England’s subsequent intervention. On balance, euro area long-term bond yields rose markedly: the euro area GDP-weighted average ten-year sovereign bond yield increased to around 2.9%, 48 basis points higher than at the time of the September Governing Council meeting. Likewise, the ten-year US, UK and German sovereign bond yields rose by 68, 42 and 40 basis points to about 4.0%, 3.6% and 2.1% respectively. Sovereign bond yields in the euro area also displayed increased volatility, the extent of which varied across jurisdictions, but they broadly mirrored risk-free rates in terms of overall direction. As a result, the average spread of the aggregate GDP-weighted euro area ten-year sovereign bond over the OIS rate remained relatively stable at around 0.20%.
Chart 14
Ten-year sovereign bond yields and the ten-year OIS rate based on the €STR
(percentages per annum)

Sources: Refinitiv and ECB calculations.
Notes: The vertical grey line denotes the start of the review period on 8 September 2022. The latest observations are for 26 October 2022.
Corporate bond spreads widened somewhat during the review period amid higher risk-free rates, with increases most pronounced in the high-yield segment. Over the review period, increasing concerns about an impending slowdown in economic growth and tighter-than-expected monetary policy contributed to somewhat wider spreads. Spreads on high-yield corporate bonds widened by 49 basis points, while spreads on investment-grade corporate bonds showed some resilience, widening by 22 basis points.
European equity markets rose over the review period but continued to experience elevated volatility owing to the macroeconomic uncertainties and headwinds. Beyond the negative impact from higher risk-free rates, market participants were also concerned with the unfolding earnings season and the resulting insights into how companies were coping with rising energy costs and interest rates. While market participants expected most sectors to be negatively impacted by higher interest rates, not all sectors were equally affected, as for example the banking sector could benefit in the short term with an increase of net interest margins. This differentiation was evident in equity prices, which decreased by 0.6% for non-financial corporations (NFCs) while increasing by 6.3% for banks. Overall, stock prices in the euro area were supported by a fall in the equity risk premium (see Section 5). The difference between NFCs and banks was less pronounced in the United States, where equity prices declined by 4.3% for the former and 1.3% for the latter.
In foreign exchange markets, the euro broadly strengthened in trade-weighted terms (Chart 15). During the review period, the nominal effective exchange rate of the euro – as measured against the currencies of 42 of the euro area’s most important trading partners – appreciated by 1.5%. In terms of bilateral exchange rate developments, the euro remained broadly unchanged against the US dollar and the pound sterling, appreciating by 0.1% and depreciating by 0.1% respectively, although with some intermediate swings. The strengthening of the euro was more pronounced vis-à-vis other currencies of major advanced economies, including the Japanese yen and the Swiss franc, against which it appreciated by 2.6% and 1.8% respectively. The euro also broadly strengthened vis-à-vis the currencies of most major emerging economies, including the Chinese renminbi (by 3.4%), as well as against the currencies of non-euro area EU countries.
Chart 15
Changes in the exchange rate of the euro vis-à-vis selected currencies
(percentage changes)

Source: ECB.
Notes: EER-42 is the nominal effective exchange rate of the euro against the currencies of 42 of the euro area’s most important trading partners. A positive (negative) change corresponds to an appreciation (depreciation) of the euro. All changes have been calculated using the foreign exchange rates prevailing on 26 October 2022.
5 Financing conditions and credit developments
Bank lending rates and bank funding costs have increased further, as policy normalisation continues. Bank lending to firms remained robust in September, while lending to households moderated. Over the period from 8 September to 26 October, both the cost of market-based debt and – to a much lesser extent – the cost of equity financing increased. The most recent bank lending survey indicates that credit standards for firms and households tightened substantially in the third quarter of 2022 amid increasing downside risks to economic growth and the ongoing normalisation of monetary policy. The increase in broad money growth in September was driven by a one-off technical factor without which M3 growth would have moderated compared with August.
The funding costs of euro area banks have increased further, reflecting changes in risk-free and market rates, as policy normalisation continues. In August, the composite cost of the debt financing of euro area banks continued on an upward trend (Chart 16, panel a). This development is explained by two factors. First, as monetary policy normalises, yields on bank bonds have increased steeply along with risk-free and market rates and reached their highest level since 2012 (Chart 16, panel b). Second, the ECB’s recent interest rate hikes have provided banks with an incentive to increase the remuneration on their customer deposits. The recent recalibration of the third series of targeted longer-term refinancing operations (TLTRO III) in response to the unexpected and extraordinary rise in inflation will also contribute to the normalisation of bank funding costs.[13] The ensuing normalisation of financing conditions for firms and households, in turn, will exert downward pressure on inflation, contributing to restoring price stability over the medium term. In August, the deposit rate increased to 0.24%, which was 10 basis points above the level recorded before the first hike in July. In keeping with historical regularities, the pass-through of recent monetary policy measures to deposits has been somewhat delayed compared with the more immediate response of bank bond yields.
Chart 16
Composite bank funding rates in selected euro area countries
(annual percentages)
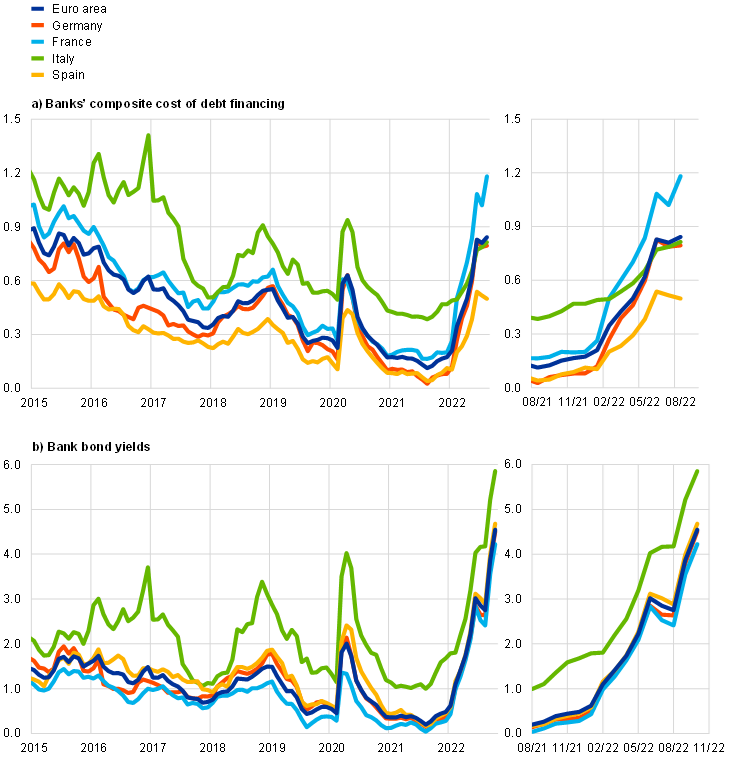
Sources: ECB, IHS Markit iBoxx indices and ECB calculations.
Notes: Composite bank funding rates are a weighted average of the composite cost of deposits and unsecured market-based debt financing. The composite cost of deposits is calculated as an average of new business rates on overnight deposits, deposits with an agreed maturity and deposits redeemable at notice, weighted by their respective outstanding amounts. Bank bond yields are monthly averages for senior-tranche bonds. The latest observations are for August 2022 for composite bank funding rates and 26 October 2022 for bank bond yields.
Bank lending rates for firms and households have increased further, as banks tighten their loan supply. Since February 2022, increases in bank funding costs have pushed up lending rates in all euro area countries (Chart 17), while credit standards have become tighter. The composite bank lending rate for loans to households for house purchase increased further in August to stand at 2.26%, a 95 basis point increase from the level recorded at the end of 2021. Results from the August 2022 Consumer Expectations Survey suggest that consumers expect mortgage rates to increase further over the next 12 months as it will become harder to obtain housing loans. Meanwhile, bank lending rates for loans to non-financial corporations (NFCs) increased to 1.86% in August. The monthly increase of 8 basis points has brought lending rates for firms up by a cumulative 50 basis points since the start of 2022. For the coming months, available evidence based on diffusion indices suggests that further increases in the lending rates for firms are likely.[14] The spread between bank lending rates on very small loans and on large loans was close to its historical average, and the cross-country dispersion of lending rates to firms and households decreased somewhat, suggesting that the transmission of the ECB’s monetary policy tightening is working smoothly so far (Chart 17, panels a and b).
Chart 17
Composite bank lending rates for NFCs and households in selected countries
(annual percentages, three-month moving averages; standard deviation)

Source: ECB.
Notes: Composite bank lending rates are calculated by aggregating short and long-term rates using a 24-month moving average of new business volumes. The cross-country standard deviation is calculated using a fixed sample of 12 euro area countries. The latest observations are for August 2022.
Over the period from 8 September to 26 October 2022 the cost of market-based debt issuance for NFCs increased substantially. Due to lags in the data available for the cost of bank borrowing, the overall cost of financing for NFCs, comprising the cost of bank borrowing, the cost of market-based debt and the cost of equity, can be calculated only up to August 2022, when it stood at 5.4%, which is around the same level as the previous month. This was the result of an increase in the cost of market-based as well as short and long-term bank debt financing, which was fully compensated for by a decline in the cost of equity, which as a component of the overall cost of financing index has a weighting of around 50 per cent. The fall in the cost of equity, in turn, was driven by a decline in the equity risk premium that more than compensated for the impact of the increase in the risk-free rate on the cost of equity (Chart 18). The August 2022 data were only slightly lower than the peak recorded earlier in the year and significantly above the levels seen in the previous two years. Continuing the increasing trend observed at the beginning of 2022, since 8 September the cost of market-based debt has recorded a further significant increase of around 70 basis points. This is attributable to an upward adjustment of the risk-free rate as well as a further increase in corporate bond spreads, in both the investment grade segment and – more notably – in the high-yield segment. The cost of equity experienced a more moderate increase of around 10 basis points because the upward impact of the spike in the risk-free rate was almost fully compensated for by a decline in the equity risk premium.
Chart 18
Nominal cost of external financing for euro area NFCs, broken down by components

Sources: ECB and ECB estimates, Eurostat, Dealogic, Merrill Lynch, Bloomberg and Thomson Reuters.
Notes: The overall cost of financing for NFCs is calculated as a weighted average of the cost of borrowing from banks, market-based debt and equity, based on their respective outstanding amounts. The latest observations are for 26 October 2022 for the cost of market-based debt (monthly average of daily data), 21 October 2022 for the cost of equity (weekly data) and August 2022 for the overall cost of financing and the cost of borrowing from banks (monthly data).
According to the October 2022 euro area bank lending survey, credit standards for loans to firms and to households for house purchase tightened substantially in the third quarter of 2022 (Chart 19). Against the background of an economic slowdown and growing fears of recession, the main factors underlying the tightening of credit standards for firms and households were downside risks related to economic growth and lower risk tolerance by banks. Amid the ongoing normalisation of monetary policy, euro area banks have reported that their cost of funds and balance sheet constraints have also contributed to a tightening of credit standards, which was, in the case of firms, stronger than in previous survey rounds. In the fourth quarter of 2022 banks expect that the tightening of credit standards on loans to firms and to households for house purchase will continue.
Chart 19
Changes in credit standards and net demand for loans to NFCs and loans to households for house purchase
(net percentages of banks reporting a tightening of credit standards or an increase in loan demand)

Source: Euro area bank lending survey.
Notes: For survey questions on credit standards, “net percentages” are defined as the difference between the sum of the percentages of banks responding “tightened considerably” and “tightened somewhat” and the sum of the percentages of banks responding “eased somewhat” and “eased considerably”. For survey questions on demand for loans, “net percentages” are defined as the difference between the sum of the percentages of banks responding “increased considerably” and “increased somewhat” and the sum of the percentages of banks responding “decreased somewhat” and “decreased considerably”. The diamonds denote expectations reported by banks in the most recent round of the survey for the following quarter. The latest observations are for the third quarter of 2022.
Loan demand by firms increased in the third quarter of 2022, as input costs and working capital needs increased, while households’ demand for housing loans decreased in the context of higher interest rates and lower confidence. Firms’ loan demand continued to be supported by their financing needs for working capital and growing inventories in the light of high input costs, the slowdown in demand and persistent supply bottlenecks. Fixed investment again had a dampening impact on firms’ loan demand, in line with the expected slowdown in investment. In the context of monetary policy normalisation, the contribution of the general level of interest rates to loan demand turned negative in the third quarter. The substantial decrease in the demand for housing loans is mainly explained by the increase in the general level of interest rates and lower consumer confidence. For the fourth quarter of 2022, banks expect a decrease in firms’ demand for loans and a further strong decrease in the demand for housing loans.
The survey also suggests that banks’ credit intermediation activities have received less support from the ECB’s non-standard monetary policy measures, as policy normalises. Banks indicated that their access to retail funding, securitisation and, in particular, to medium-to-long term debt securities deteriorated in the third quarter of 2022, reflecting the tightening of financial market conditions for banks as monetary policy normalises. Banks reported that the ECB’s asset purchase programmes had a negative impact on their liquidity position, market financing conditions and profitability over the past six months, in the context of the ending of net asset purchases. During this period, which partly covered the phase in which the ECB’s deposit facility rate (DFR) was still negative, banks reported that the DFR had a positive, albeit small, impact on lending volumes, and a direct negative impact on bank profitability. Furthermore, banks indicated that TLTRO III had a smaller positive impact on their financial situation and lending volumes, as well as a lower net easing impact on terms and conditions for loans to firms and households compared with the previous survey round.
Bank lending to firms remained robust in September, while lending to households moderated. The annual growth rate of loans to NFCs increased to 8.9% in September from 8.8% in August despite a smaller flow than in the preceding months (Chart 20, panel a). The strong growth rate of loans to firms reflects high financing needs for inventories and working capital and a move away from the issuance of debt securities – a result of market-based funding costs increasing more sharply than those of bank-based funding. Shorter-term loans made the largest contribution to firms’ loan growth given the persistence of supply chain bottlenecks, high input costs and extraordinary uncertainty, all of which raise firms’ working capital needs. Longer-term loans made a small contribution, consistent with a weakening of investment and the deterioration in business confidence. The annual growth rate of loans to households decreased to 4.4% in September from 4.5% in August (Chart 20, panel b). Lending for house purchase edged down, confirming the turning point in mortgage lending as banks tightened their credit standards and housing market prospects deteriorated.
Chart 20
MFI loans in selected euro area countries
(annual percentage changes; standard deviation)

Source: ECB.
Notes: Loans from monetary financial institutions (MFIs) are adjusted for loan sales and securitisation; in the case of NFCs, loans are also adjusted for notional cash pooling. The cross-country standard deviation is calculated using a fixed sample of 12 euro area countries. The latest observations are for September 2022.
The pace of overnight deposit accumulation moderated in September amid monetary policy normalisation. The annual growth rate of overnight deposits showed a strong decrease to 5.6% in September from 6.8% in August (Chart 21). Moreover, this development is overstated due to a one-off technical factor, without which the annual growth rate for September would be lower and closer to 4.8%.[15] The decline is explained by the large-scale substitution of overnight deposits with time deposits, reflecting the improved remuneration of term deposits for firms and households relative to overnight deposits as policy rates increase. Firms and other financial institutions (OFIs) recorded outflows from overnight deposits accompanied by strong inflows into time deposits. Households also showed interest in time deposits by recording the largest inflow in the last ten years, but nevertheless continued to increase their holdings of overnight deposits. Households’ overall deposit inflows are likely a continued reflection of precautionary motives. At the same time, growth in the deposit holdings of firms and households has varied across countries, pointing to differences in their liquidity needs and national fiscal measures.
Chart 21
M3, M1 and overnight deposits
(annual growth rate, adjusted for seasonal and calendar effects)

Source: ECB.
Note: The latest observations are for September 2022.
Annual broad money (M3) growth increased in September, though this was due to a one-off technical factor, without which M3 growth would have moderated compared with August. The annual growth rate of M3 increased to 6.3% in September from 6.1% in August and 5.7% in July (Chart 21). However, this rebound in annual M3 growth was driven by the one-off technical factor mentioned in the previous paragraph, which will be reversed in the next month. Without this factor, the annual growth rate of M3 would have declined to around 5.8% in September. On the components side, the shift into time deposits in September led to a significant decline in the contribution of overnight deposits included in the narrow aggregate M1 to annual M3 growth. Time deposits included in the broad monetary aggregate M3, which benefitted from the portfolio substitution, made a greater contribution to M3 growth compared with the previous month. On the counterparts side, credit to the private sector remained the largest contributor to annual M3 growth. The annual contribution from the Eurosystem’s purchases of government securities under the asset purchase programme and the pandemic emergency purchase programme continued to decline, reflecting the end of the net asset purchases as of July 2022. Meanwhile, net monetary outflows to the rest of the world continued to dampen broad money growth, as high energy prices are exerting a negative impact on the euro area trade balance.
Boxes
1 Supply bottlenecks and price pressures in euro area goods trade and tourism
This box provides an assessment of recent trends in goods trade and the tourism sector in the euro area based on the Purchasing Managers’ Indices (PMIs). Both sectors have been severely affected by the economic fallout from the coronavirus (COVID-19) pandemic. Regarding goods trade, our analysis shows that bottlenecks in the supply chain have historically preceded upward pressures on import prices, especially for intermediate goods. These pressures are now slowly easing as export demand weakens and supply chains adjust. As regards trade in services, a surge in extra and intra-euro area demand for tourism (which accounts for 19% of services exports and has been one of the sectors most affected by the pandemic) during the summer of 2022 pushed up prices in the tourism and recreation sector. Waning pent-up demand for travel, falling real incomes, rising uncertainty and higher prices may start to dampen overall demand for European tourism services in the coming months.[16]
More2 Motor vehicle sector: explaining the drop in output and the rise in prices
This box discusses the structural and cyclical factors behind the notable drop in euro area motor vehicle output since mid-2018 and the recent marked increase in car prices. Euro area motor vehicle output fell by 30.4% between June 2018 and August 2022, of which around 10% occurred before the start of the pandemic and 20% after. This pattern, which is common across the largest euro area countries, was not observed for other major international car producers such as South Korea, the United States and Japan, which recorded rather stable production levels before 2020 and a quicker recovery from the pandemic (Chart A). This box explains that this drop in motor vehicle output and the rise in car prices can be attributed to a combination of factors associated with the more stringent emissions tests implemented in the EU in 2018, the new EU regulation on carbon dioxide (CO2) emissions, the transition towards greener cars, supply chain disruptions, the rise in energy costs and, more recently, the uncertainty caused by the war in Ukraine.[17] The last three factors affected euro area automotive production more severely than foreign production, owing to the relatively higher participation of the euro area car sector in global supply chains, the greater dependence of the euro area on Russian energy supplies and the higher uncertainty generated by the euro area’s proximity to the war.
More3 Carry-over effects and intra-quarter GDP growth – estimates based on monthly indicators[18]
The annual average growth rate of real GDP for a given year partly reflects developments in the previous year. The annual growth rate of real GDP for a given year is determined by the growth dynamics of real GDP not only in that particular year but also in the previous year, which results in a “carry-over effect”. The carry-over effect captures how much annual GDP would grow if all quarterly growth rates in that year were zero. The growth dynamics in the year in question can then simply be calculated as the difference between the annual growth rate and the carry-over effect. The carry-over effect is a useful metric as it gives some early indication of growth in the current year as a whole.[19]
More4 The impact of the recent rise in inflation on low-income households
The effects of the recent increase in euro area HICP inflation significantly differ for low and high-income households. This box explores how recent high inflation levels are affecting low-income and high-income households differently in two main areas: their effective inflation rate due to different spending patterns, and their ability to buffer cost of living increases through savings or borrowing. The gap between the effective inflation rates experienced by those in the lowest and highest income quintiles, calculated using data on household consumption patterns, is at its greatest since 2006. Additionally, low-income households consume a larger share of their income, save less and are more liquidity-constrained than high-income households; they therefore have less room to buffer sharp increases in their cost of living through savings.
More5 Main findings from the ECB’s recent contacts with non-financial companies
This box summarises the results of contacts between ECB staff and representatives of 69 leading non-financial companies operating in the euro area. The exchanges mainly took place between 26 September and 6 October 2022.[20]
More6 A closer look at consumers’ inflation expectations – evidence from the ECB’s Consumer Expectations Survey
With the strong increase in euro area HICP inflation over the past 18 months, monitoring and understanding the behaviour of consumers’ inflation expectations have become increasingly important. In this box, we analyse developments in consumers’ inflation expectations[21] using data from the ECB’s Consumer Expectations Survey (CES), which was launched in 2020.[22] We look at changes in the entire distribution of inflation expectations, focusing on both mean and median inflation expectations, as the two measures can differ owing to skew in survey responses. We present the findings for consumers’ inflation expectations for one year ahead and three years ahead. Expectations for one year ahead measure shorter-term inflation expectations and are found to be more responsive to current inflation developments than those for longer horizons. Expectations for three years ahead measure more medium-term inflation expectations and, as such, better capture the potential risks of the de-anchoring of inflation expectations from a central bank’s inflation target.
More7 The role of demand and supply in underlying inflation – decomposing HICPX inflation into components
HICP inflation excluding energy and food (HICPX inflation) has continued to increase and reached 4.8% in September 2022 according to Eurostat’s flash release. Headline HICP inflation, which also includes energy and food, increased to 10% in September – with energy and food contributing around two-thirds and HICPX inflation around one-third to overall inflation. In the increase in HICPX inflation, both supply and demand factors played an important role. Persistent supply bottlenecks for industrial goods and input shortages, including shortages of labour due in part to the effects of the coronavirus (COVID-19) pandemic, led to a sharp increase in inflation. Since pandemic restrictions were lifted, a recovery in demand has also contributed to the current high rates of inflation, especially in the services sector. Components in the HICP basket that anecdotally are strongly affected by supply disruptions and bottlenecks and components that are strongly affected by the effects of reopening following the pandemic together contributed around half (2.4 percentage points) of HICPX inflation in the euro area in August 2022 – the last month for which detailed data are available (Chart A). However, this ad hoc decomposition leaves out a large part of HICPX inflation, calling for further distinction between the roles of demand and supply factors in underlying inflation in the euro area. Monetary policy works mainly via the demand channel, so it is important to assess to what extent developments in underlying inflation can be attributed to either supply or demand factors.
More8 Euro area linkages with Russia: latest insights from the balance of payments
This box provides an analysis of recent developments in trade and financial linkages between the euro area and Russia as recorded in the euro area balance of payments. Euro area trade and financial linkages with Russia are in the spotlight due to Russia’s invasion of Ukraine and the sanctions that have subsequently been imposed on Russia by the European Union (EU) as well as the United States and other countries. This box documents how the record deficit in the trade balance between the euro area and Russia – due to steep price increases for imported energy and lower exports amid EU sanctions – contributed to a sizeable shift in the euro area’s overall current account balance. Moreover, it documents how bilateral financial linkages, which were already limited prior to the invasion, were affected by the impact of sanctions and volatility in financial markets.
MoreArticle
1 Risk sharing in the euro area: a focus on the public channel and the COVID-19 pandemic
The reform of the architecture of Economic and Monetary Union (EMU) has been at the centre of an economic and policy debate which has, recently, also been shaped by the events related to the coronavirus (COVID-19) pandemic and Russia’s war in Ukraine. There are two fundamental dimensions in this debate. The first concerns the measures a country can take to reduce exposure to economic risks or to mitigate their effects (e.g. eliminating price and wage rigidities, building fiscal buffers or strengthening macroeconomic resilience). The second involves the notion of international risk sharing, which relates to the cross-border channels available to insure domestic disposable income and consumption against country-specific output shocks (as opposed to shocks hitting the euro area as a whole).
MoreStatistics
Statistical annex© European Central Bank, 2022
Postal address 60640 Frankfurt am Main, Germany
Telephone +49 69 1344 0
Website www.ecb.europa.eu
All rights reserved. Reproduction for educational and non-commercial purposes is permitted provided that the source is acknowledged.
This Bulletin was produced under the responsibility of the Executive Board of the ECB. Translations are prepared and published by the national central banks.
The cut-off date for the statistics included in this issue was 26 October 2022.
For specific terminology please refer to the ECB glossary (available in English only).
ISSN 2363-3417 (html)
ISSN 2363-3417 (pdf)
QB-BP-22-007-EN-Q (html)
QB-BP-22-007-EN-N (pdf)
Real GDP increased at an annual rate of 2.6% in the third quarter of 2022, according to the advance estimate released by the Bureau of Economic Analysis after the Governing Council meeting, mostly reflecting a rebound in the contribution from net trade.
For more details, see the box entitled “Carry-over effects and intra-quarter GDP growth – estimates based on monthly indicators” in this issue of the Economic Bulletin.
See “The Survey of Professional Forecasters – Third Quarter of 2022”, ECB, Frankfurt am Main, 2022.
For more details, see the box entitled “The role of public employment during the COVID-19 crisis”, Economic Bulletin, Issue 6, ECB, 2022.
The calculations of accumulated savings and deposits in excess of the respective levels of savings and deposit flows observed in the fourth quarter of 2019 disregard the underlying upward trends in nominal variables, including upward trends in income and deposit flows.
For more details, see the box entitled “The impact of the recent rise in inflation on low-income households” in this issue of the Economic Bulletin.
Including Ireland, it rose by 1.8% quarter on quarter, largely reflecting the well-known volatility of intellectual property products.
For more details, see the box entitled “Motor vehicle sector: explaining the drop in output and the rise in prices” in this issue of the Economic Bulletin.
See box “Main findings from the ECB’s recent contacts with non-financial companies”, op.cit.
See Section 2.1 of the ECB’s October 2022 euro area bank lending survey and Section 5 of this Issue of the Economic Bulletin.
For more details, see the box entitled “Supply bottlenecks and price pressures in euro area goods trade and tourism” in this issue of the Economic Bulletin.
See “ECB’s Consumer Expectations Survey results – August 2022”, press release, 7 October 2022.
See ECB press release “ECB recalibrates targeted lending operations to help restore price stability over the medium term”, 27 October 2022.
These indices, which are computed from micro data, measure the net number of banks that are raising lending rates for firms and tend to have leading indicator properties.
The September 2022 M3 figures include a large temporary position of the Eurosystem vis-à-vis a clearing house, classified within the “non-monetary financial corporations excluding insurance corporations and pension funds” sector. All the aggregates to which these deposits belong are inflated by this one-off technical factor.
While a direct mapping of tourism activities in the balance of payments is not straightforward, its share in total services exports could be approximated to 19% in 2019. Tourism includes passenger transport services and travel-related services such as accommodation and food, with the exceptions being purchases of goods and services of seasonal and cross-border short-term workers. For additional details see the box entitled “Impact of the COVID-19 lockdown on trade in travel services”, Economic Bulletin, Issue 4, ECB, 2020.
Since September 2018 all new cars must be certified according to the Worldwide Harmonised Light Vehicle Test Procedure. This laboratory test is used to measure fuel consumption and CO2 emissions from passenger cars, as well as their pollutant emissions. For the regulation on CO2 emissions, see Regulation (EU) 2019/631 of the European Parliament and of the Council of 17 April 2019 setting CO2 emission performance standards for new passenger cars and for new light commercial vehicles, and repealing Regulations (EC) No 443/2009 and (EU) No 510/2011 (OJ L 111, 25.4.2019, p. 13).
This box includes data released after the cut-off date for data for the main text (26 October 2022).
For a more detailed explanation of the carry-over effect on annual growth from quarterly developments, see, for example, the box entitled “The carry-over effect on annual average real GDP growth”, Monthly Bulletin, ECB, March 2010.
For further information on the nature and purpose of these contacts, see the article entitled “The ECB’s dialogue with non-financial companies”, Economic Bulletin, Issue 1, ECB, 2021.
Available measures of inflation expectations vary across many dimensions, including agents (households/consumers, firms, professional macroeconomic forecasters and financial markets); type (survey-based or financial market prices); and horizon (short, medium and long-term). The inflation expectations of forecasters and financial markets represent those of professional macroeconomists. Household expectations are likely to be more varied depending on their knowledge of macroeconomic developments. In this context, relatively small movements should not be over interpreted, but clearer shifts do provide important information.
The CES started in April 2020 and is an ongoing monthly panel survey of more than 10,000 respondents from the six largest euro area countries (Belgium, Germany, Spain, France, Italy and the Netherlands). The survey is administered by the ECB and collects fully harmonised data on consumer expectations from a representative sample of the underlying population via the internet. For further methodological information, a user’s guide and recent updates on the ECB’s CES, see the dedicated web page. A more detailed account is provided in “ECB Consumer Expectations Survey: an overview and first evaluation”, Occasional Paper Series, No 287, ECB, Frankfurt am Main, December 2021, as well as in Georgarakos, D. and G. Kenny, “Household spending and fiscal support during the COVID-19 pandemic: Insights from a new consumer survey”, Journal of Monetary Economics, Vol. 129, 2022, pp. 1-14.
We are grateful to Adam Shapiro for his guidance and support in applying his approach to the euro area and to Omiros Kouvavas for his help in matching data on prices and activity for the euro area.