
- SPEECH
Monetary-fiscal interactions on the way out of the crisis
Keynote speech by Fabio Panetta, Member of the Executive Board of the ECB, at the Conference of the Governors of Mediterranean Central Banks on “Central banks at the frontline of the COVID-19 crisis: weathering the storm, spurring the recovery”
Frankfurt am Main, 28 June 2021
The pandemic has seen a paradigm shift. For the first time in decades, monetary and fiscal policies across advanced economies are working together to stimulate demand. And following many years of low growth and low inflation, both are now picking up.
The key question is whether this moment will last.
Some view close monetary-fiscal interactions as an exceptional response to the pandemic emergency that should end when the pandemic does. But the experience we have gained since the great financial crisis shows that situations in which monetary and fiscal policies should work together are not exceptional. These situations can arise more frequently than we previously thought, especially in an environment of structurally low interest rates.
In fact, the current phase of monetary-fiscal cooperation in various parts of the globe is giving us an opportunity to escape from the persistent “liquidity trap” that is affecting advanced economies – a situation characterised by weak inflation and nominal interest rates in the neighbourhood of their lower bound, but insufficiently low to stimulate aggregate demand.
If we are to succeed in escaping that trap and sustainably reflating the economy, there needs to be the confidence that combined policy support will not be withdrawn prematurely.
Today I will discuss how advanced economies entered this liquidity trap, how likely they are to exit it, and what this means for the future policy mix in the euro area.
Entering a liquidity trap
The decade prior to the pandemic was characterised by three key features.
First, while the link between inflation and employment weakened across advanced economies – in other words, the Phillips curve flattened – it remained essentially intact.[1] It was therefore still possible to achieve healthy price pressures, but doing so required running the economy “hotter” than in the past, while anchoring inflation expectations became even more important for ensuring that inflation settled on target over the medium term.
Second, natural rates of interest fell everywhere, increasing the likelihood of hitting the effective lower bound and reducing the power of monetary policy to lift demand and steer expectations. Monetary policy could still work through unconventional tools[2], but they were not equivalent to being able to cut rates by several hundred basis points.
Third, just when monetary policy was facing the constraint of the lower bound, it was largely left to carry the macroeconomic stabilisation burden alone, especially in the euro area. Fiscal policy eased in response to the great financial crisis but quickly reverted to focusing on fiscal consolidation. In the euro area, the fiscal stance became strongly procyclical.
Few countries were able to generate a “hot” economy. Output gaps eventually closed, but this was largely due to downward revisions of potential output (Chart 1).[3] Major economies did not recover their pre-crisis growth trend, and only after a long expansion did the supply constraints of the economy start to be tested.
Chart 1
Real GDP – actual and potential
(index: 1999 = 100)
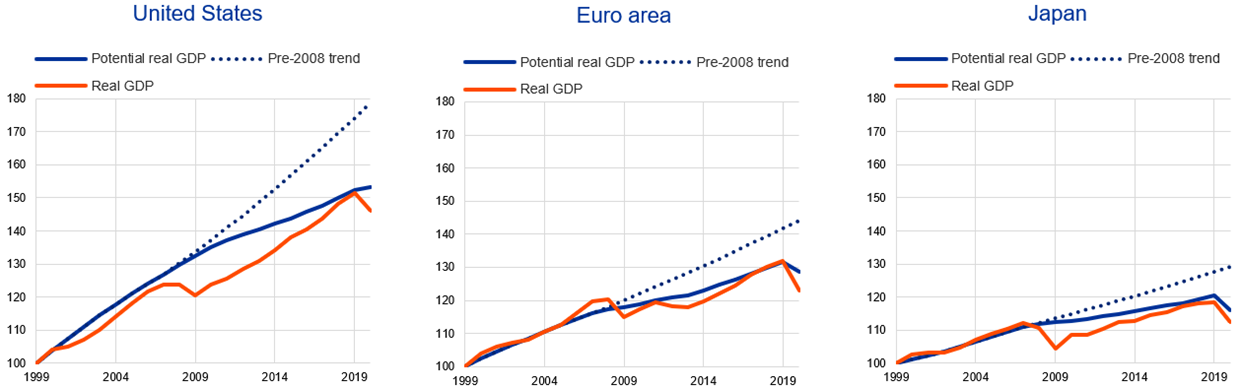
Source: IMF.
In the euro area, this under-heating of the economy was fuelled by an excessive focus on external demand after the crisis, unlike in the United States, which relied more on internal demand (Chart 2).[4] Yearly domestic demand growth was 2 percentage points lower, on average, than it had been in the decade before the crisis.[5]
Chart 2
Domestic and external demand
(share of GDP)
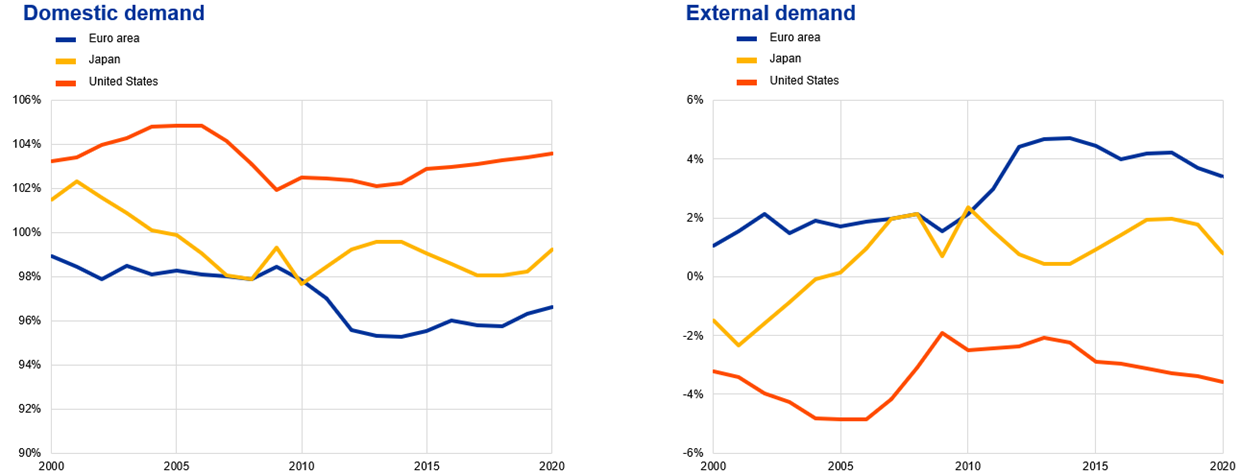
Source: Ameco.
Inflation dynamics failed to keep up with a 2% trend – although economies where unconventional monetary policy was used earlier and more aggressively did perform better (Chart 3). And crucially, inflation expectations began to adapt to prolonged below-target inflation. Long-term market-based expectations fell by more than 150 basis points in both the United States and the euro area.[6]
Chart 3
Headline inflation
(index: January 2009 = 100)
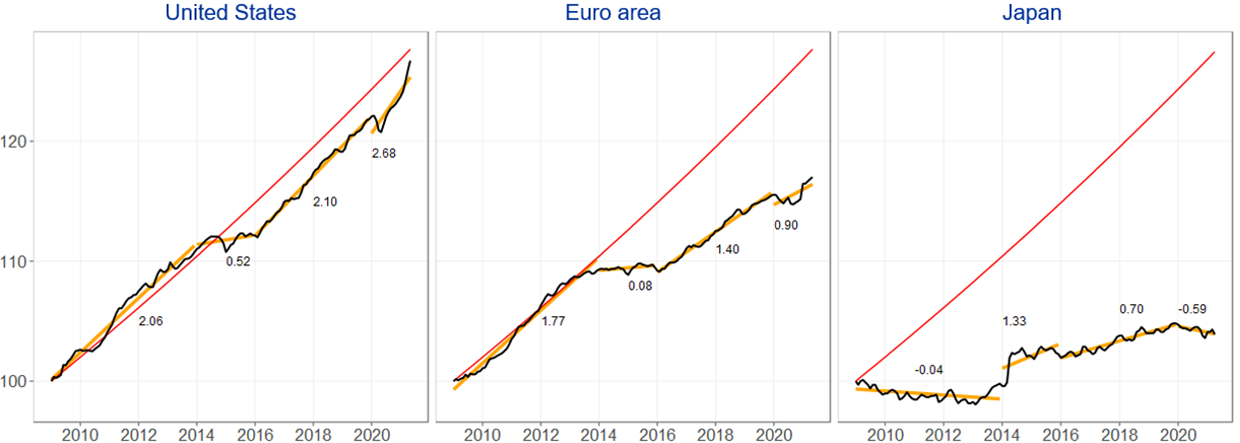
Sources: Eurostat, Federal Reserve and Bank of Japan.
Notes: Numbers denote average annualised inflation over sub-periods. Red line denotes constant 2% growth.
Advanced economies fell into a phase of insufficient demand, weak inflation and low interest rates – in other words, a persistent liquidity trap – which was aggravated by self-fulfilling expectations.[7]
At the lower bound, falling inflation expectations push up real rates, compounding economic stagnation and low inflation.[8] And expectations of subdued demand discourage firms from investing in new capacity and households from bringing forward future income, which then validates those initial pessimistic expectations.[9]
Escaping a liquidity trap
The problem of past policies was not adjusting the policy mix to reflect this new reality. Academic research[10] and historical experience[11] indicate that monetary policy cannot escape a liquidity trap by trying to induce a pessimistic private sector to spend more. It can only succeed if the public sector also responds to its policy impulses.[12] Fiscal policy needs to add to aggregate demand such that expectations of future demand and inflation shift decisively upwards.
It is the combination of monetary and fiscal policy that makes this policy mix successful. The promise – via forward guidance – that policy rates will not increase until inflation rises sustainably produces higher fiscal multipliers. And the use of unconventional policy tools to lower sovereign yields reduces government borrowing costs relative to growth rates, in turn creating additional fiscal space.
These interactions have nothing to do with a loss of central bank independence or an abdication of monetary dominance. Achieving price stability requires acknowledging that monetary and fiscal policies cannot ignore each other.[13] What ensures monetary dominance is that such interactions remain consistent with the central bank’s goals, not those of the fiscal authority.[14] In a liquidity trap situation, this is self-evidently the case.
Analyses by ECB staff confirm this. They find that, while the ECB was lifting inflation with its asset purchases after 2015, fiscal policy was not supportive in this regard (Chart 4, left and middle panels). If fiscal policy had instead acted countercyclically, making an effort to eliminate the output gap – or better still, acted patiently, maintaining support beyond the closure of the output gap – inflation could have been closer to our 2% target (Chart 4, right panel).[15]
Chart 4
Contribution of monetary policy and fiscal policy to inflation between 2015 and 2019
(percentage points)
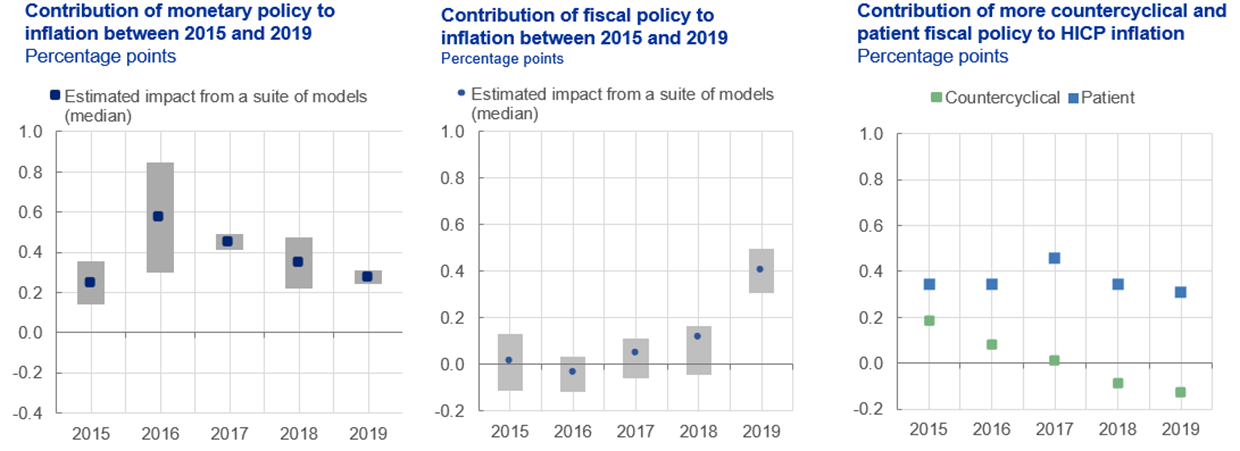
Sources: Left panel – Eurosystem and Rostagno, M. et al. (2019), “A tale of two decades: the ECB’s monetary policy at 20”, Working Paper Series, No 2346, ECB, December; middle and right panels – ECB staff calculations.
Notes: The boxplot for the left panel refers to a range of assessments comprising the Eurosystem staff assessment based on a suite of models and the assessment documented in Rostagno, M. et al. (2019), op. cit. In this panel, “inflation” refers to HICP inflation. In the middle panel, the results shown are the average from the Broad Economic Exercise elasticities and a VAR model estimate. Inflation is the private consumption deflator. In the right panel, the results show the counterfactual simulation results from the ECB-BASE model. Monetary policy is assumed to accommodate the fiscal accommodation (i.e. monetary policy is exogenous). Inflation is the private consumption deflator.
The pandemic has now jolted governments – out of necessity – into policies that better reflect the needs of macroeconomic stabilisation. As a result, we are currently witnessing a real-world test case of whether combined fiscal and monetary easing can still lift inflation.
The most prominent example is the United States, where two key policy shifts have marked a break with the thinking of the previous decade. First, fiscal policy has acted alongside monetary policy to ensure that the economy quickly returns to the pre-crisis GDP growth path. Second, the Federal Reserve has committed to providing policy support until it sees evidence that realised inflation has returned to sustainably higher levels – in other words, until capacity constraints in the economy have actually emerged.
In order to firmly anchor inflation expectations at 2%, the Federal Reserve has announced that it aims to achieve inflation moderately above 2% for some time – a strategy which reflects the fact that, when the Phillips curve is flat, anchoring inflation expectations matters even more.[16]
The effects of this combined policy shift will become evident in the coming months. Signs are emerging that the economy could break out of the liquidity trap and that the Phillips curve framework remains valid.
At this stage, however, measures of underlying inflation[17] have not increased much in any major economy, and in the euro area they remain well below 2% (Chart 5). Underlying inflation is driven largely by wages, so a sustained upward shift will require persistently tight labour markets. For this to happen, demand will need to remain buoyant enough to test potential even after supply normalises.
Chart 5
Measures of underlying inflation
(percentages per annum)
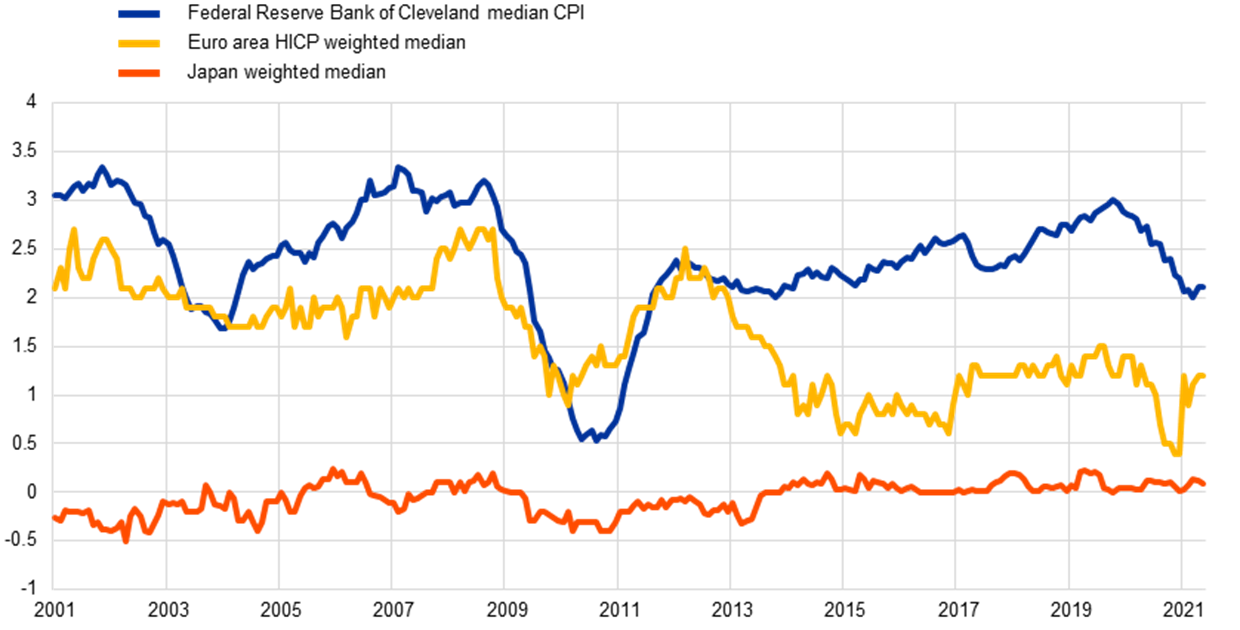
Sources: ECB, Federal Reserve Bank of Cleveland and Bank of Japan.
The outlook for the euro area
How likely is this to happen in the euro area?
The policy mix in Europe today is clearly superior to what we had before. The ECB’s monetary policy has lowered real interest rates to historically low levels. Fiscal policy has effectively absorbed the loss of private sector income.
Labour income fell by 3.5% in 2020, but household real disposable income dropped by only 0.3%, mainly because government transfers compensated for the loss of income. This represents a turnaround compared with the sovereign debt crisis, when disposable income fell by up to 2% year-on-year (Chart 6).
Chart 6
Euro area real disposable income and compensation of employees
(year-on-year growth, percentages)
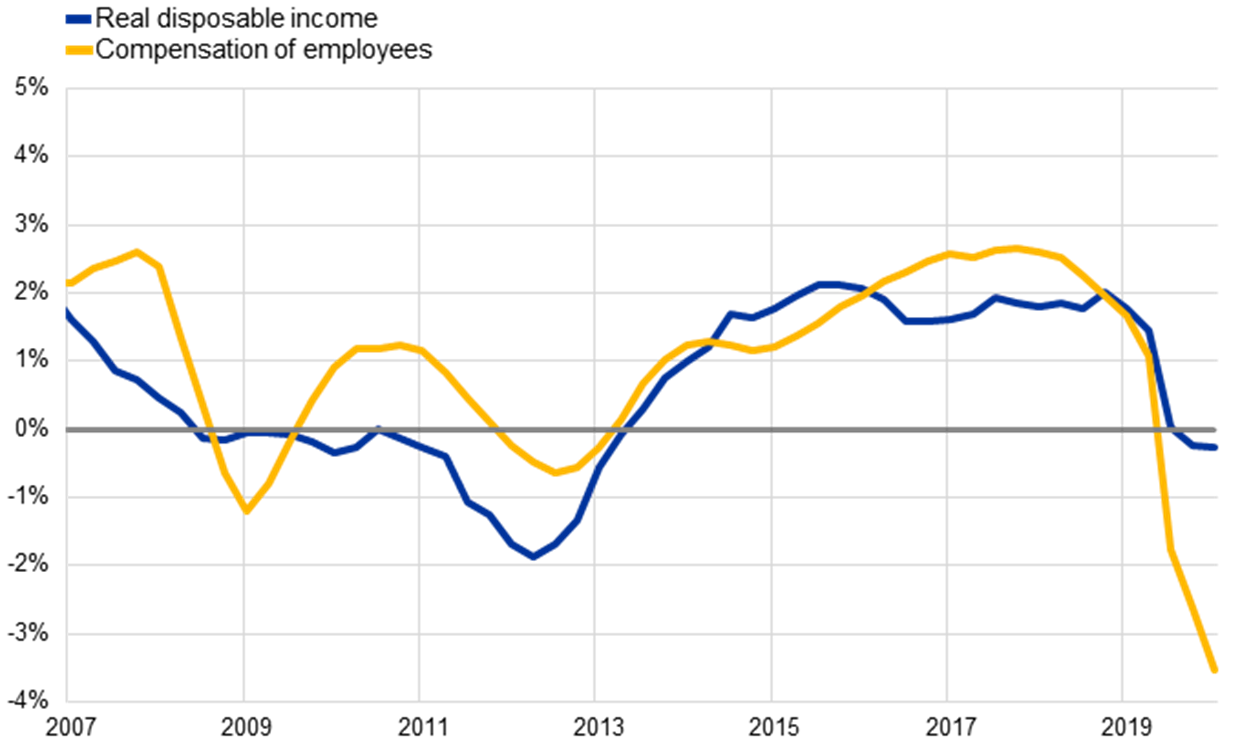
Source: Eurostat.
These income transfers – coupled with measures to support firms – have helped avert the destruction of productive capacity that seemed likely a year ago. In fact, the Next Generation EU (NGEU) programme may even increase capacity in the years to come. The European Commission projects potential output in 2024 to be 7% above its 2019 level, 0.7 percentage point more than estimated before the pandemic (Chart 7).
Chart 7
Euro area potential output
(index: 2019 = 100)
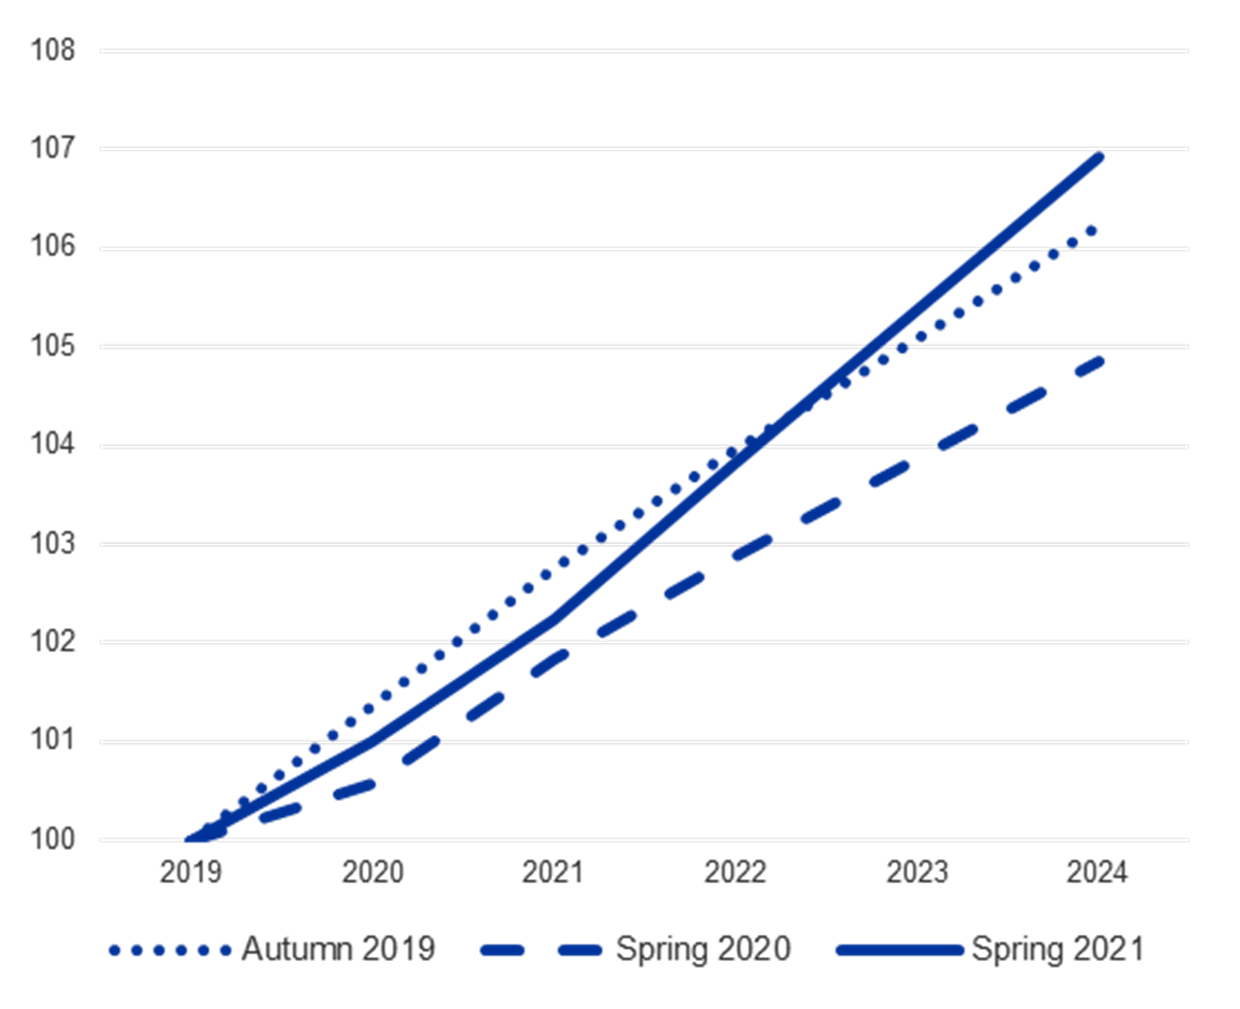
Sources: European Commission and Output Gaps Working Group of the Economic Policy Committee.
The challenge we now face is to take advantage of the global upswing and lift demand up to and beyond current potential, thereby re-anchoring expected medium-term inflation at levels consistent with our target of 2%. But on our current policy trajectory, the likelihood that demand in the euro area will be strong enough to test the supply constraints of the economy – beyond short-term bottlenecks – does not look as high as in the United States.
Euro area inflation will rise this year. But this will be a temporary increase, largely driven by base effects on energy and food products and the unwinding of previous VAT cuts in Germany. Temporary supply disruptions and some catch-up effects in services prices will also add to inflation in the coming months. We do not see, however, convincing signs that this upward movement will translate into a sustained inflationary process. The risk of second-round effects[18] remains limited, as the conditions for them to emerge are not yet in place.
In fact, the extent to which the surge in demand will last once the economy re-opens is unclear. Accumulated savings are concentrated among older, wealthier people who are unlikely to spend them. The euro area saving rate will normalise, but we do not expect extensive dissaving.[19]
Even accounting for planned fiscal stimulus, slack in the economy is likely to remain large for some time. Unemployment is not expected to return to its pre-crisis level until the end of 2023 – and in any case, this was not a level that delivered strong wage pressures before the pandemic. Our core inflation forecast for 2023 is still just 1.4%.
So we do not seem to be on track to “run the economy hot”.
That said, policy can put us on a better growth path. According to simple, illustrative estimates, extra fiscal spending on productive investment of 1.6% of GDP[20] would reconnect the economy with its pre-crisis growth trend by 2022. And thanks to the recent improvement in the outlook, this figure is lower than was estimated in April (Chart 8).[21]
Chart 8
Euro area real GDP projections
(index: 2019 = 100)
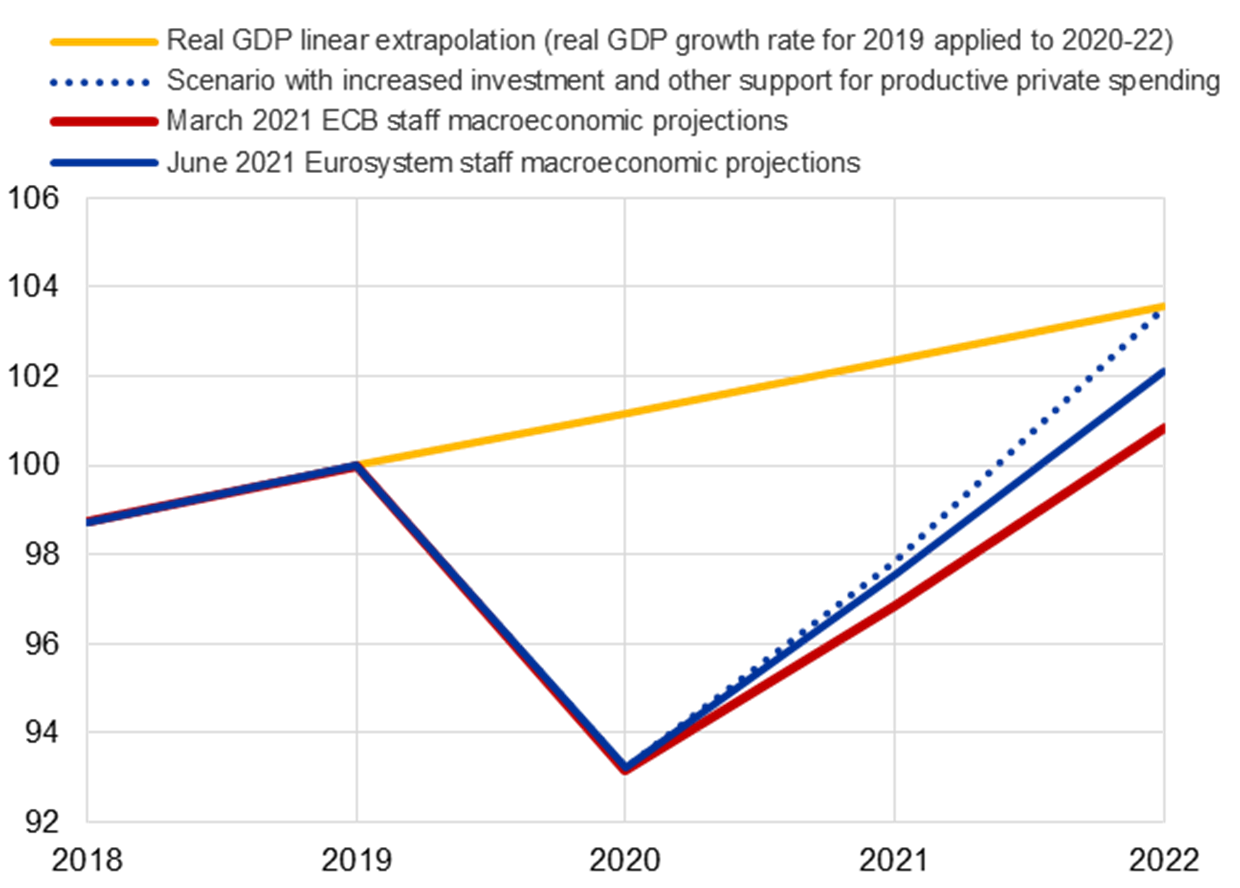
Source: ECB.
Monetary-fiscal interactions in the pandemic and beyond
Achieving a sufficiently supportive fiscal stance is in the hands of governments. But the ECB can ensure that, for as long as inflation is below our aim, the financing conditions remain in place for the transmission of monetary policy to work via public and private spending. To do so successfully, we need to clearly understand what stage of the pandemic we are in.
The economic outlook is improving, but we are not yet out of the pandemic phase. The shock caused by the pandemic was of an exceptional magnitude and has not yet been fully reabsorbed. Monetary policy is still playing a critical role in anchoring the yield curve (Chart 9). Experience shows that attempting to reduce the pace of asset purchases too early would lead to a tightening of financing conditions and a higher pace of purchases later.
Chart 9
Estimated impact of the APP and PEPP on sovereign term premia
(basis points)
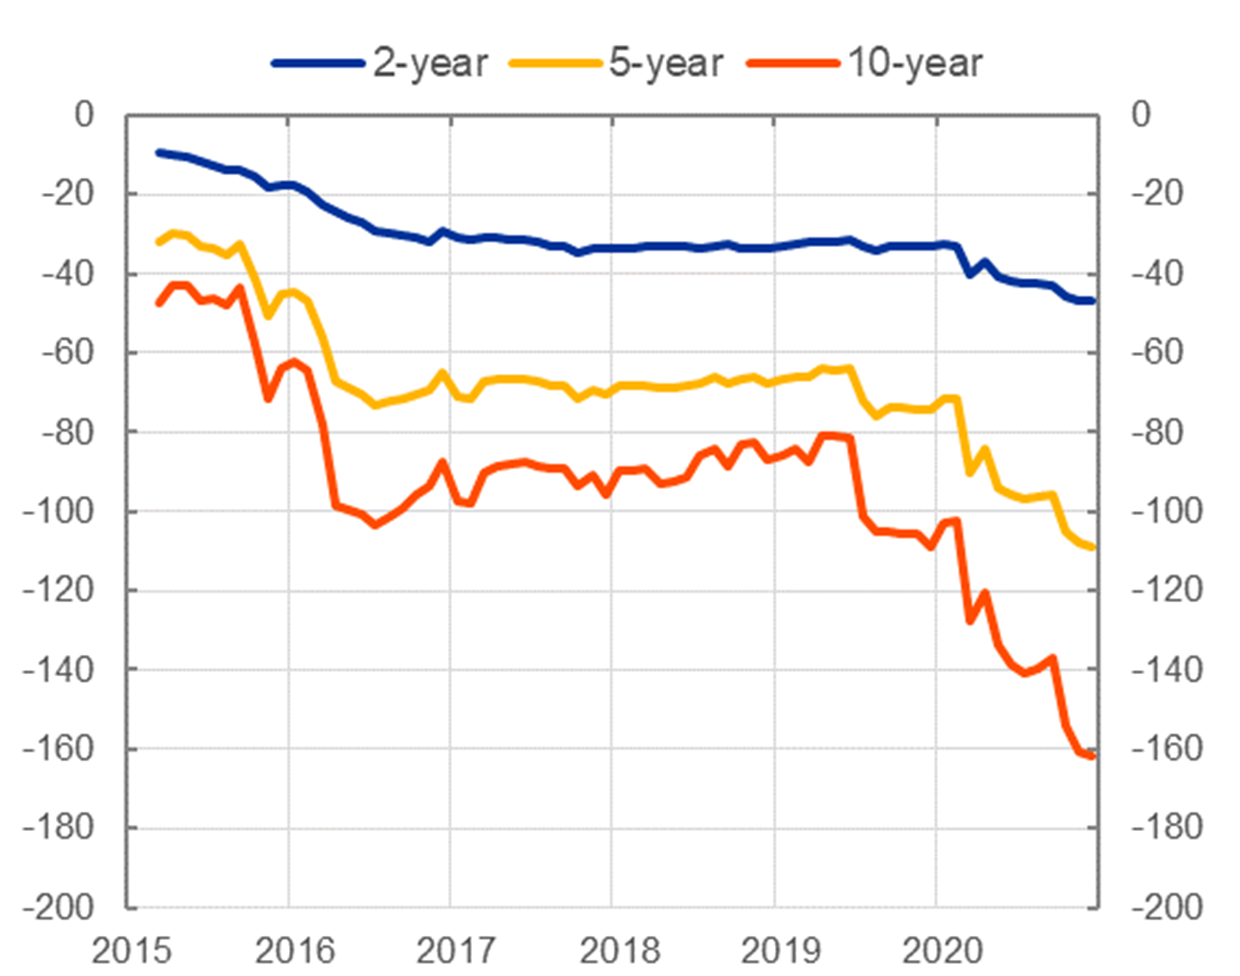
Source: ECB calculations.
Notes: APP stands for asset purchase programme and PEPP stands for pandemic emergency purchase programme. Impacts are derived on the basis of an arbitrage-free econometric term structure model with a quantity factor (see Eser, F. et al. (2019), “Tracing the impact of the ECB’s asset purchase programme on the yield curve”, Working Paper Series, No 2293, ECB, July). The model results are for GDP-weighted averages of the zero-coupon yields of the big four sovereign issuers (Germany, France, Italy and Spain). While impact elasticities may have been larger during the peak times of the pandemic, the same model (estimated based on the APP experience) is used to quantify APP and PEPP impacts. Results are subject to estimation and model uncertainty.
Once we move firmly into the recovery phase, we can start to reorient our policy away from offsetting the pandemic shock. But our focus will then need to be on bringing inflation to 2% over the policy horizon. This will in turn require us to design our post-pandemic policy framework carefully and calibrate our instruments properly.
We must be clear that, in order to re-anchor inflation expectations, our policy horizon cannot extend far into the future. If we are seen as determined to achieve 2% without undue delay and have a clear plan to do so by enabling monetary-fiscal interactions, rising inflation expectations will make our task easier. But if we are seen to be lacking determination, expectations will be less responsive and the “bang for our buck” will be considerably lower: we will end up spending more, not less, and we may not exit the liquidity trap.
We cannot waste the opportunity of having, for the first time in more than a decade, a combination of expansionary monetary and fiscal policies and a global reflationary environment to re-anchor inflation expectations to our target.
This has two key implications.
First, our forward guidance will be key for embedding credibility and shifting inflation expectations upwards. We are committed to keeping interest rates low until we have seen the inflation outlook robustly converge to our aim within our projection horizon, and such convergence has been consistently reflected in underlying inflation dynamics. And we will continue asset purchases until shortly before this point.
This guidance creates a natural window for fiscal action. Governments that spend wisely today can be assured that they will not be penalised with a premature rise in borrowing costs.
Second, we should recognise that what was seen as unconventional in the past is now conventional. In particular, the pandemic emergency purchase programme (PEPP) has shown the benefits of flexible monetary policies when differences in financing conditions across countries represent a persistent obstacle to the transmission mechanism. We should strive to retain the “unconventional flexibility” that has served us well during the pandemic.
Conclusion
Let me conclude.
The experience during the pandemic has yielded two key lessons.
First, we should not be afraid of monetary and fiscal policies working together when interest rates are near the lower bound: in such a situation, a combined policy easing is necessary to close the output and inflation gaps. This does not violate the principle of monetary dominance. It is in fact the way to ensure that a regime of price stability endures and to dispel pessimistic expectations which could cripple monetary policy effectiveness.
Second, combined fiscal and monetary support has lifted the economy out of the state of emergency. If the commitment to use both policies proactively is pursued further, it has the potential, for the first time in more than a decade, to bring us back sustainably to our inflation aim and to an economy operating at full capacity.
A return of macroeconomic policy to the pre-pandemic status quo would be an immense wasted opportunity. NGEU, flexible monetary policy, monetary-fiscal interactions – all of these innovations are helping our monetary union to function better. We now have an opportunity to build on them and permanently lift the euro area to higher growth levels.
- For the euro area, see Del Negro, M., Lenza, M., Primiceri, G.E. and Tambalotti, A. (2020), “What’s up with the Phillips Curve?”, Working Paper Series, No 2435, ECB, July; and Eser, F., Karadi, P., Lane, P.R., Moretti, L. and Osbat, C. (2020), “The Phillips Curve at the ECB”, Working Paper Series, No 2400, May. For the United States, see Hazell, J., Herreño, J., Nakamura, E. and Steinsson, J. (2020), “The Slope of the Phillips Curve: Evidence from U.S. States”, NBER Working Paper Series, No 28005, National Bureau of Economic Research, October.
- Rostagno, M. et al. (2021), “Combining negative rates, forward guidance and asset purchases: identification and impacts of the ECB’s unconventional policies”, Working Paper Series, No 2564, ECB, June.
- Cerra, V., Fatás A. and Saxena, S. (2020), “Hysteresis and Business Cycles”, Discussion Paper Series, No 14531, Centre for Economic Policy Research, March.
- Panetta, F. (2021a), “Monetary autonomy in a globalised world”, welcome address at the joint BIS, BoE, ECB and IMF conference on “Spillovers in a “post-pandemic, low-for-long” world”, 26 April.
- Panetta, F. (2021b), “Mind the gap(s): monetary policy and the way out of the pandemic”, speech at an online event organised by Bocconi University, Milan, 2 March.
- 5-year forward, 5-year ahead inflation-linked swaps.
- Nakata, T. and Schmidt, S. (2020), “Expectations-Driven Liquidity Traps: Implications for Monetary and Fiscal Policy”, Discussion Paper Series, No 15422, Centre for Economic Policy Research, November; Schmidt, S. (2021), “Avoiding a self-fulfilling low-inflation trap”, Research Bulletin, No 85, ECB, June.
- Lansing, K.J. (2021), “Endogenous forecast switching near the zero lower bound”, Journal of Monetary Economics, Vol. 117, pp. 153-169.
- Benigno, G. and Fornaro, L. (2018), “Stagnation Traps”, Review of Economic Studies, Vol. 85, No 3, pp. 1425-1470.
- Nakata, T. and Schmidt, S. (2020), op. cit.; Michau, J.-B. (2020), “Fiscal Policy under Secular Stagnation: An Optimal Pump Priming Strategy”, Working Papers, No 2020-14, Center for Research in Economics and Statistics.
- Jacobson, M.M., Leeper, E.M. and Preston, B. (2019), “Recovery of 1933”, NBER Working Paper Series, No 25629, National Bureau of Economic Research, March.
- Reichlin, L., Ricco, G. and Tarbé, M. (2021), “Monetary-fiscal crosswinds in the European Monetary Union”, BIS Working Papers, No 940, Bank for International Settlements, May.
- See, for example, Sargent, T.J. and Wallace, N. (1981), “Some Unpleasant Monetarist Arithmetic”, Quarterly Review, Vol. 5, No 3, Federal Reserve Bank of Minneapolis.
- Draghi, M. (2019), “Policymaking, responsibility and uncertainty”, acceptance speech for the Laurea Honoris Causa from the Università Cattolica, Milan, 11 October.
- Bankowski, K., Christoffel, K. and Faria, T. (2021), “Assessing fiscal-monetary policy mix in the euro area”, mimeo. Countercyclical fiscal policy is based on fiscal rules that increase government spending in response to a negative output gap, and reduce it in response to a positive output gap. Patient fiscal policy, in addition, keeps government spending at an elevated level, conditional on the short-term rate reaching the zero lower bound, even when the output gap closes. As such, this policy would have attempted to recover some of the previously accumulated output losses.
- Hazell, J. et al. (2020), op. cit.
- Measures of underlying inflation aim to filter out short-term volatility in headline inflation in order to capture the low-frequency component of inflation. Such measures help central banks to distinguish in real time the “signal” on medium-term inflationary pressure contained in inflation data from the “noise” stemming from temporary or idiosyncratic factors. The measures of median inflation presented in Chart 5 give an indication of how broad-based movements in inflation are. See Ehrmann, M., Ferrucci, G., Lenza, M. and O’Brien, D. (2018), “Measures of underlying inflation for the euro area”, Economic Bulletin, Issue 4, ECB.
- Second-round effects describe a situation where a temporary deviation of inflation from target becomes entrenched in wage and price-setting behaviour and then becomes persistent.
- See the box entitled “Household saving ratio dynamics and implications for the euro area economic outlook”, in ECB (2021), Eurosystem staff macroeconomic projections for the euro area, June.
- 0.3% in 2021 and 1.3% in 2022, beyond the measures already factored into the ECB’s baseline for our June projections. Ex-post, i.e. factoring in the growth-enhancing impact of the extra investment spending, budgetary costs compared with the baseline would be 0.9% in total for 2021 and 2022.
- Panetta, F. (2021a), op. cit.
Európska centrálna banka
Generálne riaditeľstvo pre komunikáciu
- Sonnemannstrasse 20
- 60314 Frankfurt nad Mohanom, Nemecko
- +49 69 1344 7455
- media@ecb.europa.eu
Šírenie je dovolené len s uvedením zdroja.
Kontakty pre médiá