Oil price developments and Russian oil flows since the EU embargo and G7 price cap
Published as part of the ECB Economic Bulletin, Issue 2/2023.
New sanctions on Russia’s oil exports have come into effect in recent months, including EU bans on seaborne oil imports from Russia and price caps on Russian oil in response to Russia’s continuing war of aggression in Ukraine. The EU ban on seaborne imports of Russian crude oil entered into force on 5 December 2022, followed by the embargo on refined oil products as of 5 February 2023. In tandem with the EU embargoes, the G7, the EU and partner countries have also prohibited the provision of maritime services[1] for Russian crude oil shipments and for Russian oil products, unless the oil is being purchased at or below a capped price.[2] The oil price cap for Russian crude oil was set at USD 60 per barrel, which is currently above the market selling price for the majority of Russian crude oil exports. Two price cap levels were imposed on refined products: one at USD 100 per barrel for petroleum products traded at a premium to crude oil, such as diesel, kerosene and gasoline; and one at USD 45 per barrel for petroleum products traded at a discount to crude oil, such as fuel oil and naphtha. The price cap mechanism is intended to restrain Russian oil revenues by capping the price, while still allowing the supply of Russian oil to the global market, thereby avoiding spikes in international oil prices. This box provides an initial assessment of the impact of the new sanctions on international oil prices and Russian seaborne oil exports.
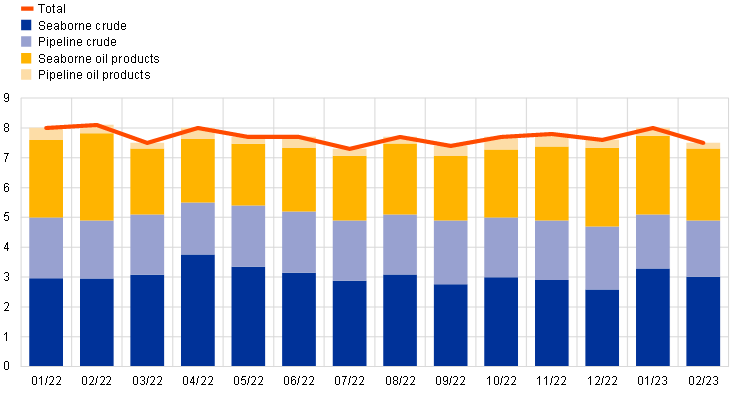
Russia had already redirected much of its oil supply before the EU embargo and the G7 price cap entered into force. Russia exported around 8 million barrels of oil per day to a broad variety of trading partners before its invasion of Ukraine. Two-thirds of these exports were composed of crude oil and one-third of refined oil products, which collectively were carried mainly by sea (Chart A, panel a). Less than one-third of oil exports was transported to customers via pipelines. Deliveries to the EU accounted for almost half of Russia’s oil exports at the beginning of 2022, but trade patterns changed significantly over the course of the year. The announcement in June of an upcoming EU embargo and “self-sanctioning” behaviour by European customers led to Russia’s seaborne crude oil exports to the EU falling by almost 70% (1.4 million barrels per day) between February and November 2022. Russia redirected these exports mainly to Asian countries (Chart A, panel b), leaving the aggregate volume of Russian seaborne crude oil exports broadly unchanged. In particular, more crude oil was exported to China and India, with their collective share of Russian oil exports rising to approximately 70% in November 2022 (before the new sanctions regime came into effect on 5 December 2022), compared with just below 20% in the pre-war period.
Chart A
Evolution of Russian oil exports as war-related sanctions entered into force
a) Russia’s total oil exports by type and mode of delivery
(million barrels per day)
b) Russian seaborne crude oil exports before the war and around the EU embargo implementation date
(million barrels per day)
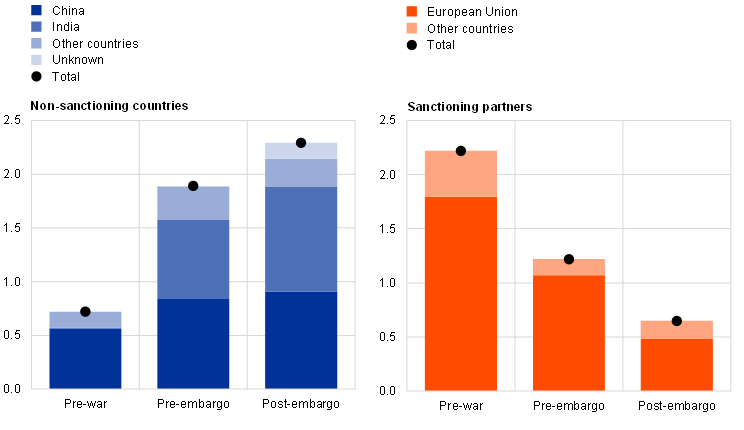
Sources: International Energy Agency (IEA), Refinitiv and ECB staff calculations.
Notes: Panel a): figures provided by the IEA for Russia's total monthly crude oil exports are assumed to include oil transported on vessels and via pipelines. The same is assumed for figures for Russia’s total monthly exports of refined oil products. Discrepancies relative to IEA data on seaborne oil exports may result from the use of different underlying data sources for the automatic identification system (AIS). Panel b): sanctioning partners include Canada, Australia, Japan, Albania, Bosnia and Herzegovina, Iceland, Liechtenstein, Montenegro, North Macedonia, Norway, Ukraine, Switzerland, the United States, the United Kingdom and the EU27, while non-sanctioning countries include all other countries. Seaborne shipments to unknown locations are included in the non-sanctioning bars. The data consider only Russian blends, excluding the Kazakh blend. The pre-war period corresponds to 1 November 2021 to 23 February 2022, the pre-embargo period corresponds to 24 February to 4 December 2022, and the post-embargo period corresponds to 5 December 2022 to 14 March 2023. The latest observations are for February 2023 for panel a) and 14 March 2023 for panel b).
The new sanctions initially led to a notable drop in Russia’s seaborne exports of crude oil, but volumes have since recovered. During the first weeks after 5 December 2022, Russian seaborne crude oil exports fell by 35% as flows to the EU declined sharply.[3] Exports to India, China and Türkiye also declined when the new sanctions entered into force, although these countries did not join the oil price cap mechanism. However, following the initial slump, crude oil exports have since recovered. The recovery reflects a further redirection of crude oil from sanctioning countries to non-sanctioning countries, although the available statistics are incomplete as a significant amount of Russian crude oil is categorised as loaded onto tankers with undisclosed destinations. In total, Russia’s export volumes of seaborne crude oil have, on average, remained practically unchanged since the implementation of crude oil sanctions when compared with the export volumes in November 2022.
Global oil prices have exhibited limited volatility despite the introduction of the EU crude oil embargo and the crude oil price cap. Since 5 December 2022 international oil prices have decreased (by 9%). Model estimates suggest that oil supply has contributed negatively to oil prices (Chart B), which can be explained by the relatively small impact on volumes of Russian seaborne crude oil exports when compared with initial expectations of more significant declines. At the same time, other factors might be at play, such as higher production in Kazakhstan and Nigeria, which also supported global oil supply during the period. These developments stand in contrast to the oil price evolution in the immediate aftermath of the Russian invasion of Ukraine when concerns about global oil supply shortages were the main driver of the spike in oil prices seen during the spring of 2022 amid fears of disruptions to oil supplies from Russia.
Chart B
Oil price developments
Model-based decomposition of changes in Brent crude oil prices
(daily accumulated percentage changes)
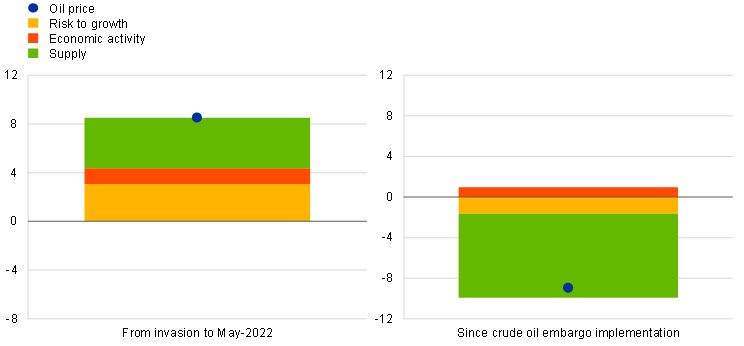
Sources: Refinitiv and ECB staff calculations.
Notes: The daily oil model from Venditti, F. and Veronese, G., “Global financial markets and oil price shocks in real time”, Working Paper Series, No 2472, ECB, September 2020, is used. Structural shocks are estimated using the spot price, the futures/spot spread, market expectations of oil price volatility and the stock price index. The risk component identifies uncertainty regarding growth and oil demand, whereas the economic activity component identifies shocks to current demand from changes in economic activity. 24 February 2022 is taken as the date of the Russian invasion of Ukraine. The crude oil embargo was implemented on 5 December 2022. The latest observations are for 14 March 2023.
Russian oil continued to be traded at a discount. Urals oil – the main grade of crude oil exported from Russia to Europe – has been sold at a large discount to Brent crude since the Russian invasion of Ukraine because many European firms have refrained from buying it. Before the invasion, the Brent/Urals spread was small, at around USD 3 per barrel, but it subsequently increased to around USD 35 per barrel. Immediately after the implementation of the new sanctions on Russian crude oil, the discount increased, but later returned to the levels seen before December 2022.[4] In contrast, the market price of the Russian Eastern Siberia-Pacific Ocean (ESPO) grade oil, which is traditionally exported to Asia, has been closer to international oil prices and stayed at levels above the oil price cap. This may reflect the fact that around 45% of Russian oil exports to eastern Asia are transported via pipelines to China, which are not affected by sanctions from the G7 and EU countries. In addition, ESPO oil has usually been shipped by tankers flagged in countries outside the G7 and EU, which makes it easier to transport Russian ESPO grade oil without being subject to the new sanctions.
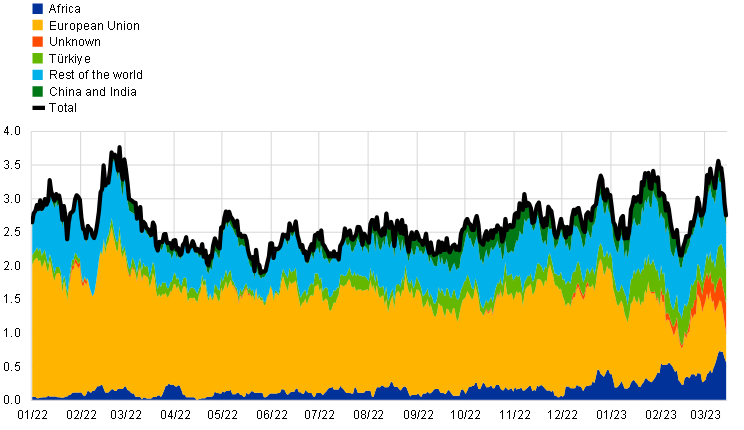
Russia’s exports of refined oil products declined somewhat as new measures came into effect. In contrast to crude oil exports, Russia had only redirected limited volumes of refined oil products from the EU to other countries since the invasion of Ukraine, indicating that the redirection of refined oil exports to other countries could be more challenging for Russia than the redirection of seaborne crude oil (Chart C, panel a). One reason for this might be that China and India, countries which attracted large amounts of crude oil from Russia, are net exporters of a large range of refined oil products. Following the announcement of sanctions back in June 2022, Russia’s exports of refined oil products gradually increased, driven by flows to Africa and Asia, but with the implementation of sanctions on 5 February 2023 flows declined notably. However, since then Russia has been able to offset the reduction in imports by EU Member States by further increasing exports to Africa and other undisclosed destinations. Overall, compared with January 2023, the aggregate exports of refined oil have decreased by only 3% since the implementation of sanctions.
Chart C
Developments in the refined oil market
a) Russian seaborne exports of refined oil products by destination
(million barrels per day, 10-day moving average)
b) European crack spreads
(USD per barrel)
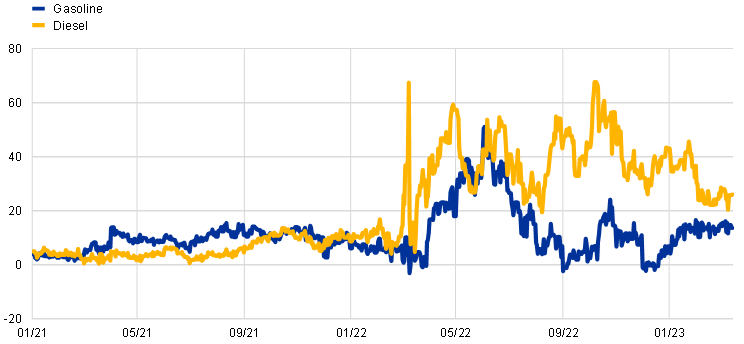
Sources: Refinitiv and ECB staff calculations.
Notes: Refined oil products are diesel and gasoil, gasoline components, jet fuel, kerosine and naphtha. Crack spreads are the difference between the prices of crude oil and the corresponding refined oil product. The latest observations are for 14 March 2023 for both panels.
The European diesel market remains tight despite the EU bolstering Its refined oil imports ahead of 5 February. The EU increased its imports of refined oil products significantly towards the turn of the year, reflecting more trade with the Middle East and Asia as well as a frontloading of fuel oil and diesel imports from Russia ahead of the embargo. Europe’s dependence on Russian diesel has led to persistent worries about supply shortages, as reflected in a sharp increase in the spread between diesel and crude oil prices – also known as the “diesel crack spread” – since the start of the Russian war in Ukraine (Chart C, panel b). In the weeks around 5 February, the EU’s aggregate diesel imports declined sharply, yet crack spreads also narrowed, suggesting that the initial decline was anticipated by the market. A global fall in diesel prices following from a recovery in inventories also contributed to the decline in crack spreads. Nonetheless, the European diesel market remains tight, with crack spreads higher than before the onset of the war.
A stronger impact of sanctions on global oil markets could still materialise. First, the price cap on crude oil might have a stronger impact on Russian crude oil exports in the coming months, as sanctioning partners aim to keep the level of the cap at least 5% below the market price for Russian oil. Future reassessments of the price cap level could test whether the sanctions are working as intended, particularly as Russia officially prohibited exports of oil to countries that join the cap mechanism as of February and more than 60% of Russian crude oil flows from the Baltic Sea and the Black Sea are still being insured by sanctioning countries.[5] Russia has already announced a reduction in oil production starting in March 2023 in response to the implementation of the sanctions, corresponding to around 0.5% of global crude oil supply. Second, the embargo and the corresponding price cap mechanism on refined oil products are still at an early phase of implementation,[6] implying that there is still high uncertainty about the ultimate impact on refined oil product markets. Over time the embargo may add additional price pressures in an already tight European diesel market, with the EU having to bid for barrels of diesel from the United States and the Middle East in competition with those suppliers’ traditional customers.
Including trading and commodities broking, financing, shipping, insurance (including protection and indemnity), flagging and customs broking.
The G7, the EU and Australia together form the Price Cap Coalition, while Albania, Bosnia and Herzegovina, Iceland, Liechtenstein, Montenegro, North Macedonia, Norway, Switzerland and Ukraine have all pledged to follow EU sanctions against Russia.
Small amounts of crude oil were still arriving in Bulgaria, which is temporarily exempted from the embargo. It is likely that exports to other EU countries after 5 December are related to implementation exemptions as ships loaded before the embargo date could still deliver Russian oil.
We focus on the price without freight and insurance costs, since the price cap refers to the price excluding transportation costs. In particular, the prices for Urals crude oil given here are free-on-board in Primorsk prices as quoted by Refinitiv.
See the Centre for Research on Energy and Clean Air’s “Weekly snapshot – Russian fossil fuels 6 to 12 February 2023”.
The implementation of the price cap on refined oil includes a 55-day wind-down period for seaborne Russian petroleum products purchased at above the price cap, provided they are loaded onto a vessel at the port of loading prior to 5 February 2023 and unloaded at the final port of destination prior to 1 April 2023.


