
Survey on the Access to Finance of Enterprises in the euro area - October 2021 to March 2022
This report presents the main results of the 26th round of the Survey on the Access to Finance of Enterprises (SAFE) in the euro area, which was conducted between 7 March 2022 and 15 April 2022. The survey covered the period from October 2021 to March 2022. The sample comprised 10,950 enterprises in the euro area, of which 9,999 (91.3%) had fewer than 250 employees.[1]
In this survey round, enterprises of all sizes, in particular large firms, reported that the lack of skilled labour and the rise in input costs were the dominant concerns for their business activity, while access to finance was among the least reported concerns (see Chart 4 in section 2). The lack of skilled labour continued to be the main concern for euro area firms (30%), followed by the increase in costs of production and labour (18%). At the same time, concerns about access to finance remained unchanged at a low level in the euro area as a whole (6%), while difficulty in finding customers declined (16%). Meanwhile, concerns about competition and regulatory burden (both 8%) were relatively limited for enterprises in the euro area.
Labour shortages and input costs were reported as pressing problems that had intensified over time (see Chart A in this section). On a scale of 1 to 10, the responses regarding the importance of these two factors as problems show that 67% and 63% of euro area firms respectively considered them to be extremely pressing.
Chart A
Concerns about labour shortages and input costs as perceived by euro area enterprises
(left-hand scale: percentages; right-hand scale: weighted averages)
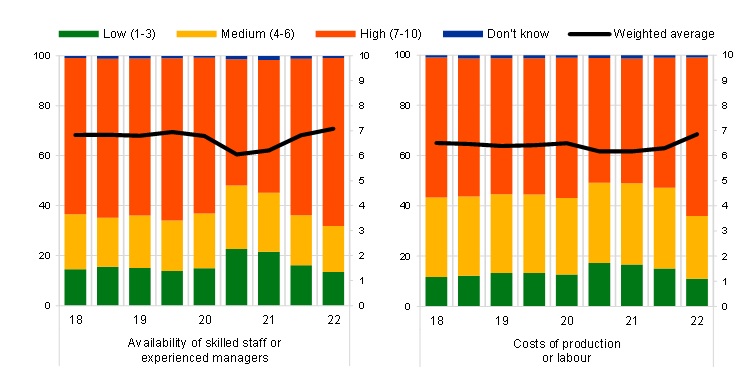
Base: All enterprises. The figures refer to rounds 18-26 of the survey (October 2017-March 2018 to October 2021-March 2022).
Notes: Enterprises were asked to indicate how important a specific problem was on a scale of 1 (not at all important) to 10 (extremely important). On the chart, the scale has been divided into three categories: low (1-3), medium (4-6) and high importance (7-10). The weighted average score is an average of the responses using the weighted number of respondents. The data included in the chart refer to Question 0b of the survey.
Euro area enterprises continued to signal a recovery in business activity over the past six months (with 25% in net terms[2] reporting increases in turnover) (see Chart 1 in section 2). This is the third round in which there has been an improvement since the historical low reached after the outbreak of the coronavirus (COVID-19) pandemic. Across firm sizes, it appears that large companies are still experiencing a faster rebound than small and medium-sized enterprises (SMEs).
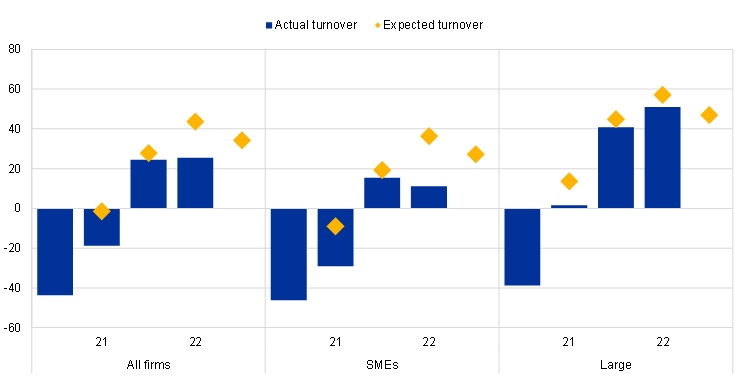
Expectations of future turnover seem to have been dented somewhat at the very start of this survey round, immediately after the start of the war in Ukraine, but remained positive and relatively stable thereafter during the fieldwork period up to mid-April. A net 34% of euro area firms (down from 44% in the previous survey round) continue to expect an increase in turnover over the next six months (see Chart 18 in section 5). A positive but somewhat less optimistic outlook for future turnover was reported among both large companies (47%, down from 57%) and SMEs (27%, down from 36%).
Despite the ongoing expansion in turnover, euro area firms’ profitability weakened slightly, but with significant heterogeneity across firm sizes. More SMEs reported a deterioration in profits in net terms (-15% compared with -6% in the previous round), while large firms continued to signal a rise in profits, albeit somewhat less frequently than in the previous survey round (a net 15% compared with 20%).
The weaker profitability reflected a significant rise in materials and energy costs as well as labour costs. 89% of firms (up from 73% in net terms in the previous round) reported higher costs for materials and energy, most likely reflecting the surge in commodity and input prices during the reporting period, which was in part related to the Russian invasion of Ukraine. Meanwhile 66% (up from 45%) signalled an increase in labour costs. For both types of costs, these net percentages represent new historical highs in the survey, which underscores the strength of the input cost pressures firms are currently experiencing and explains the toll on profits despite higher turnover. Moreover, the significant rise in production costs is widespread both across firm sizes and across countries.
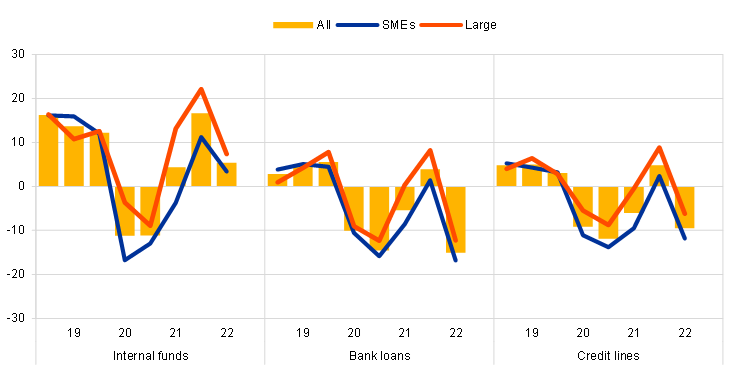
In net terms, euro area firms reported moderate increases in the demand for bank loans and credit lines at the euro area level, with credit demand broadly in line with pre-pandemic levels in most euro area countries (see Table 1, columns 2 and 4 in this section). A net 5% of companies reported higher demand for bank loans (down from 2% in the previous survey round) and 7% for credit lines (up from 4%). The results are in line with the overall growth in bank loans recorded since last October in the euro area, even though they show some heterogeneity across size classes, with SMEs more often reporting increases in their need for credit lines than large firms. External and internal financing continued to be used primarily for fixed investment, inventories and working capital.
Overall, euro area firms still indicated an improvement in the availability of bank loans, albeit to a lesser extent than in the previous survey (5% compared with 10%) (see Table 1, column 6 in this section). Although the percentage of firms reporting improvements in availability was smaller than in the previous round across size classes, large companies continued to indicate a much higher improvement in the availability of banking products than SMEs.
Improvements in access to external funds broadly compensated for firms’ higher financing needs (see Table 1, column 10). In this survey round, 1% of firms reported a positive financing gap (up from -4%). Across size classes, large companies continued to report a negative financing gap (-2% compared with -7%), while SMEs are now indicating a small gap in their ability to finance demand (2% compared with -2%).
Table 1
Latest developments in SAFE country results for euro area firms
(net percentages of respondents)
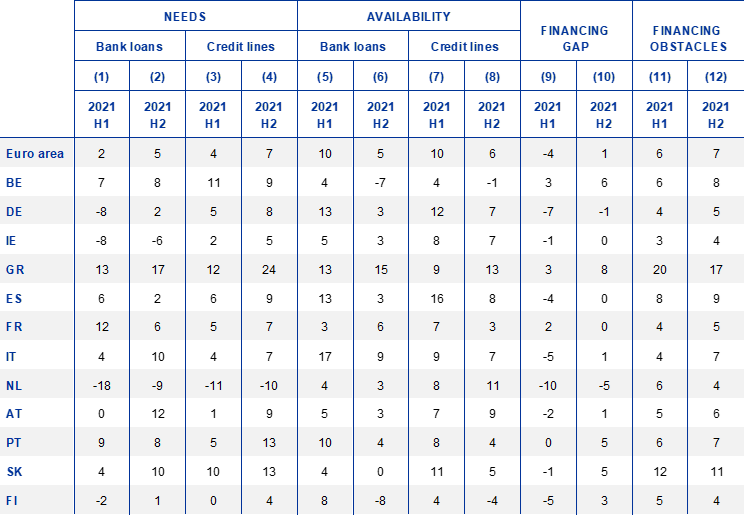
Notes: For the “financing gap”, see the notes to Chart 9; for “financing obstacles”, see the notes to Chart 12. “2021 H1” refers to round 25 (April 2021-September 2021) and “2021 H2” refers to round 26 (October 2021 – March 2022).
Euro area firms regarded the macroeconomic environment as having adversely affected the availability of external financing (a net -29%, compared with 8% in the previous round) (see Chart 10 in section 4). Similarly, firms reported a small deterioration in their firm-specific outlook (-2%), while other factors related to the capital position and creditworthiness (around 16%) were still having a positive impact on access to finance. At the same time, a smaller percentage of firms signalled an improvement in the willingness of banks to provide credit (10%). The percentage was lower for SMEs (6%) than for large firms (17%).
Reflecting the completion of many public support programmes in the euro area, firms started to report that public financial support was playing a decreasing role in easing access to finance. The role of public financial support returned to a level in line with the survey rounds before the pandemic. In this respect SMEs were more pessimistic than large firms (-6% and -2%, respectively).
The overall indicator[3] of obstacles preventing euro area enterprises from accessing bank loans increased slightly to 7% (see Table 1, column 12 in this section). The percentage of firms that were discouraged from applying for bank loans also increased slightly at the euro area level (4%) and across countries. In this survey round a smaller percentage of firms has applied for a loan (down to 29% from 30%) with the rate for fully successful loan applications reaching 79%, almost unchanged.
A very high percentage of firms reported increases in bank interest rates, with similar developments across firm sizes and countries (up from 5% to 34%) (see Chart 15 in section 4). No comparable percentage had been observed in the survey replies to questions about price terms and conditions for bank financing since 2012. The very high percentage figure is consistent with the recent net widening of margins applied to bank loans, which was also signalled by banks in the April 2022 bank lending survey (BLS).[4]
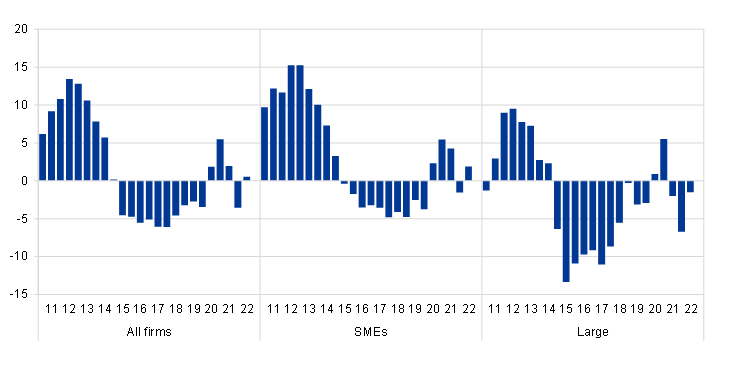
A comprehensive indicator of how firms perceive financing conditions shows a deterioration across size classes (see Chart B in this section). This indicator mainly covers changes in bank interest rates and other costs of bank financing (charges, fees and commissions) but is conditioned on firms’ characteristics and the willingness of banks to provide credit.[5] The recent deterioration (which is denoted by positive values of the indicator) is reported by about 20% of both SMEs and large firms – a percentage not seen since mid-2014.
Chart B
Financing conditions as perceived by euro area firms
(weighted scores)
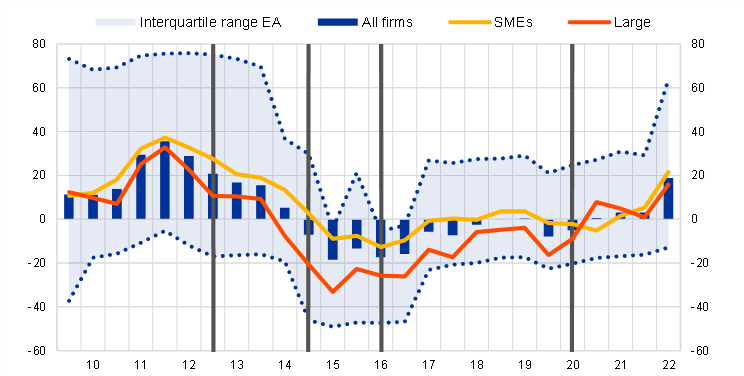
Notes: Indicator obtained by factor analysis. Positive values indicate a deterioration in firms’ financing conditions. For details, see the box entitled “Financing conditions through the lens of euro area companies”, Economic Bulletin, Issue 8, ECB, 2021. The individual scores are weighted by size class, economic activity and country to reflect the economic structure of the underlying population of firms. The individual scores are standardised, so they have a range of between -1 and 1 and are multiplied by 100 to obtain weighted balances in percentages. The first vertical grey line denotes the announcement of the Outright Monetary Transactions; the second vertical grey line denotes the start of the first series of targeted longer-term refinancing operations (TLTRO I) and the negative interest rate policy; the third vertical grey line denotes the start of TLTRO II and the corporate sector purchase programme; and the last vertical grey line denotes the start of the pandemic emergency purchase programme and TLTRO III. This coincides with the beginning of the COVID-19 pandemic. Latest observation: October 2021- March 2022.
Firms’ perceptions of financing conditions related to price terms and conditions are consistent with available information from the banking sector (see Chart C in this section). Chart C compares the dynamics of the indicator of financing conditions with two important aspects of the terms and conditions of loan contracts, namely the margins on average loans and the margins on riskier loans. These margins are defined as the spread over relevant market reference rates, as reported in the BLS. Since 2009, a widening (narrowing) of banks’ margins has been reflected in a worsening of (improvement in) financing conditions reported by firms. While the perceptions of changes in financing conditions of SMEs are broadly associated with changes in margins applied by banks on riskier loans, those of large companies mostly reflect changes in margins applied to average loans. In this survey round, however, the deterioration in financing conditions occurred mainly on account of a widening of margins on riskier loans for both size classes, reflecting assessments by banks that go beyond the creditworthiness of firms and are more focused on the intensification of economic risks.
Chart C
Banks’ lending conditions and firms’ perceived financing conditions
(net percentages for margins; weighted scores for price terms and conditions in percentages)
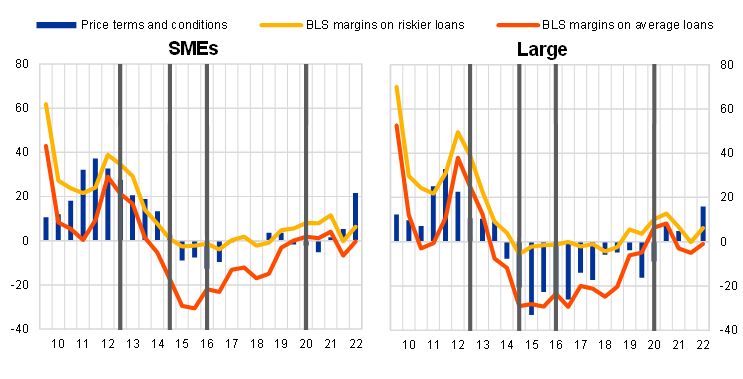
Sources: Euro area bank lending survey (BLS), ECB and European Commission Survey on the Access to Finance of Enterprises (SAFE).
Notes: Positive values indicate a deterioration in firms’ financing conditions and a net widening of loan margins. Small and medium-sized enterprises (SMEs) have fewer than 250 employees. For details, see the note to Chart B. Latest observation: October 2021- March 2022.
Looking ahead, euro area firms expect to see a decline in their access to external financing, especially financing from banks (see Chart 16 in section 5). In particular, a relatively high percentage of firms anticipated a deterioration in access to bank loans and credit lines (-15% and -10%, respectively) for the period April-September 2022. The expected deterioration was common to most countries and size classes, probably reflecting the prevailing economic uncertainty and a changing attitude on the part of banks.
Euro area companies reported higher selling prices over the last year (see Box 1 in the report). About three-quarters of euro area firms indicated that their prices increased “a little” (46%) or “a lot” (26%), and most expect price increases to continue over the next 12 months (47% by “a little”, 28% by “a lot”). Moreover, expectations of higher selling prices appear to be common across both large firms and SMEs of all sizes. Among countries, upward pressures on firm’s prices were more acute in Germany compared with the other three largest economies.
Higher selling prices are predominantly expected by firms in industry, construction, and trade sectors, while more moderate increases prevail in services (see Chart D in this section). Around 35% of firms in the former three sectors expect their prices to increase “a lot”. By contrast, the respective percentage for service firms is only 20%. Moreover, while 25% of service firms report no expectations of raising their prices in the near future, that percentage is significantly lower in the other sectors (12%, 15% and 13% for industry, construction and trade, respectively). Although there is no exact mapping between firms’ sector prices and HICP main sub-components, these survey results would be consistent with stronger price pressures in the non-energy industrial goods component of the HICP, with more limited price pressures in the services price sub-component.
Chart D
Expected changes in selling prices across sectors
(next 12 months; percentages of respondents)
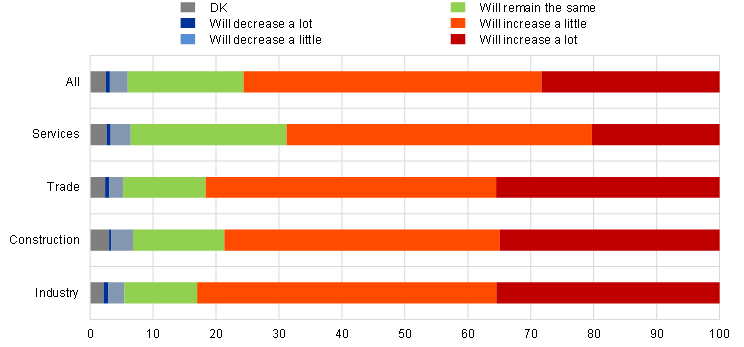
QA2: Looking ahead, considering the markets where you sell your main products or services, would you say that in the next twelve months your selling prices…?
Base: All enterprises. The figures refer to round 26 (October 2021-March 2022) of the survey.
Notes: DK stands for “Don’t know”.
Input costs is the most important factor currently influencing selling price expectations (“very” important for 74% of firms), followed by labour costs (60%), expected inflation (58%) and own demand (55%) (see Chart C in the box of the report). By contrast, factors such as market shares/competitors’ prices, the exchange rate and financing availability and costs play a much more limited role.
The perceived importance of expected inflation as a factor in selling prices has increased compared with 2020. The significant rise in inflation since 2020 also appears to have increased the influence of expected inflation on selling prices, a factor which 58% of firms now report as “very” important (up from 30% in 2020).
Overall, the survey results suggest that the recovery in economic activity among euro area enterprises after the pandemic continued over the past six months. However, firms’ profitability was reduced by surging input costs.
Despite the uncertainty related to the ongoing war in Ukraine, euro area firms still expect higher turnover, albeit to a lesser extent than in the previous survey round. Expectations of future turnover seem to have been dented somewhat at the very start of this survey round, immediately after the start of the war in Ukraine, but remained relatively stable thereafter during the fieldwork period up to mid-April. At the same time, upward pressures on selling prices are expected to continue in the coming months, due mainly to higher input prices but additionally to inflation expectations.
Euro area firms also signalled a significant tightening of financing conditions, with increases in price terms and conditions for bank loans. While the availability of bank financing was broadly in line with firms’ demand for financing, firms expect a deterioration in the availability of funds in the near future.
2 The financial situation of euro area firms
2.1 Business activity continues to improve among euro area enterprises
Reflecting some resilience to the impact of the war in Ukraine, euro area enterprises continued to report higher turnover (see Chart 1). For the period from October 2021 to March 2022, a net percentage of euro area enterprises reported increasing turnover (25%, up from 24% in the previous survey round). That net percentage suggests a continuation of the recovery in business activity from the historical lows recorded in 2020 with the onset of the COVID-19 pandemic, together with some resilience to the economic consequences of the Russian invasion of Ukraine.
Chart 1
Changes in the income situation of euro area enterprises
(net percentages of respondents)
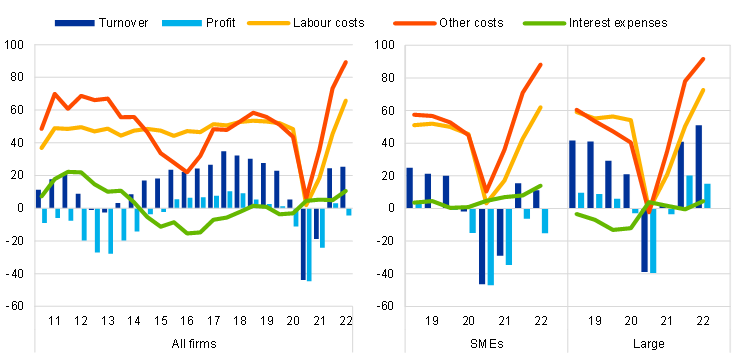
Base: All enterprises. The figures refer to rounds 3-26 of the survey (March 2010-September 2010 to October 2021-March 2022) for all firms and to rounds 19-26 (April 2018 -September 2018 to October 2021-March 2022) for SMEs and large firms.
Notes: Net percentages are the difference between the percentage of enterprises reporting an increase for a given factor and the percentage reporting a decrease. The data included in the chart refer to Question 2 of the survey.
The recovery in turnover is widespread across firm sizes, although it seems to have taken place at a faster pace for larger companies. The net percentage of large firms reporting turnover growth rose to 51% in this round (up from 41%). Among SMEs the figure was 35% (up from 32%) for medium-sized companies and 17% (down from 21%) for small firms; it was only among micro firms that a net percentage signalled lower turnover over the past six months (-5% compared with 3%).
At the same time, euro area enterprises also reported significant increases in materials and energy costs, as well as labour costs. A very high proportion of euro area firms reported rises in materials and energy costs (89%, up from 73%) and in labour costs (66%, up from 45%), with increases being reported for all firm sizes. Similarly, euro area firms reported an increase in interest rate expenses, with higher net percentages across all firm sizes.
Despite the resilient business activity, higher costs have weighed on firms’ profits, but with important differences across firm sizes. While a positive net percentage of large companies continued to report an increase in profits (15%, down from 20% in the previous round), SMEs reported a deterioration in profits in net terms (-15% overall, and -1%, -14% and -23% for medium-sized, small and micro SMEs respectively).
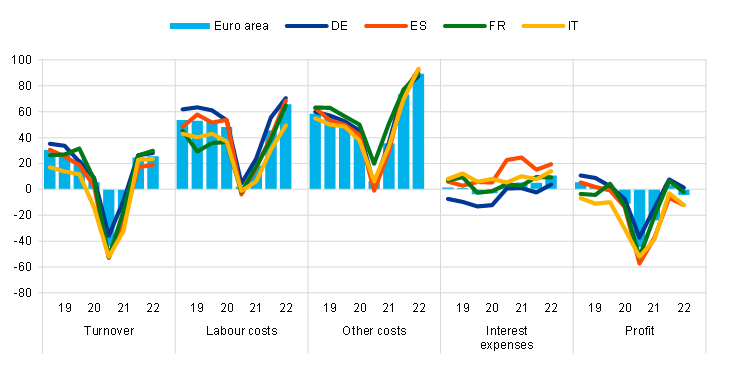
Across countries, trends in firms’ business activity have followed very similar patterns over the past six months (see Chart 19 in Annex 1). Firms in the largest euro area countries showed a very similar recovery in turnover. However, while the widespread increases in labour and other costs led to a net percentage of companies continuing to report a decline in profits for the euro area aggregate, Spanish and Italian enterprises were particularly affected (-12% for both compared with -4% for the euro area as a whole).
Chart 2
Changes in the debt situation and real decisions of euro area enterprises
(net percentages of respondents)
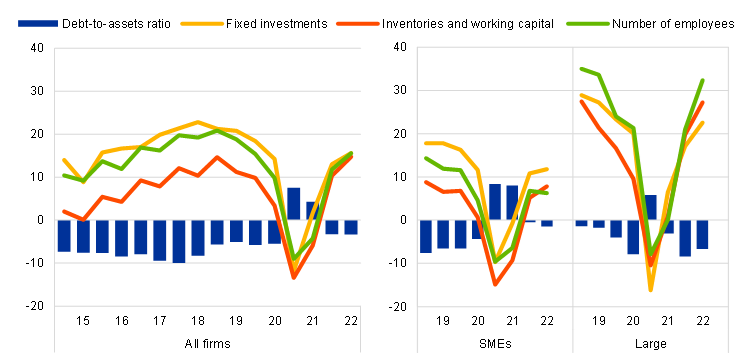
Base: All enterprises. The figures refer to rounds 11-26 of the survey (March 2014-September 2014 to October 2021-March 2022) for all firms and to rounds 19-26 (April 2018 -September 2018 to October 2021-March 2022) for SMEs and large firms.
Notes: See the notes to Chart 1. The data included in the chart refer to Question 2 of the survey.
The balance sheets of euro area enterprises improved slightly over the past six months (see Chart 2). A net percentage of euro area firms indicated a decline in their debt-to-assets ratios (-3%, unchanged from the previous round), most likely reflecting a continuation of the recovery in business activity after the pandemic lows. Debt-to-assets ratios were reported to have declined for firms of all sizes.
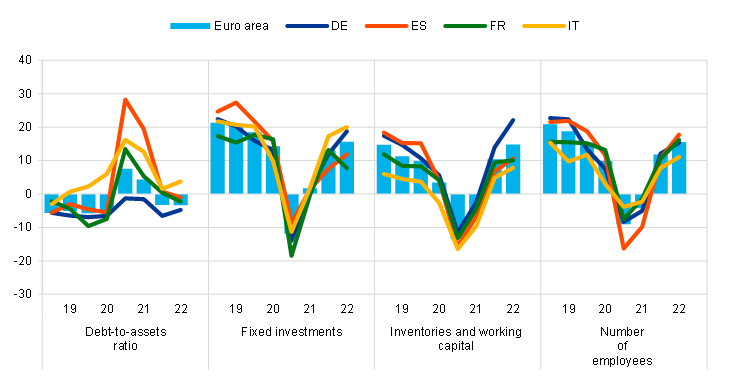
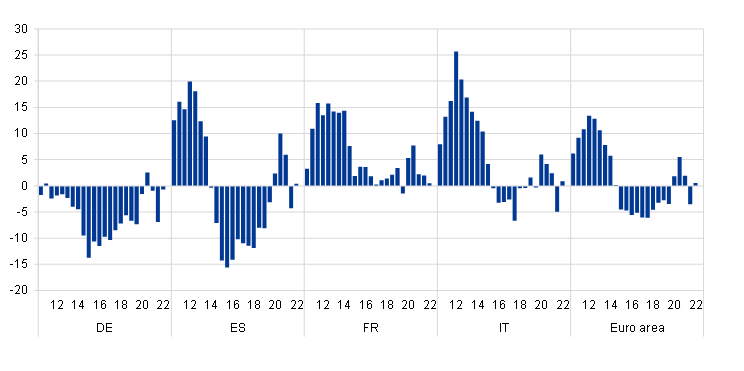
Developments in firms’ debt-to-assets ratios show diverging patterns across euro area countries. Looking at the four largest economies, German firms continued to report lower debt-to-assets ratios in net terms in this survey round in line with the aggregate at euro area level, while in the other large countries, enterprises continued to report increases, particularly in Italy (4%, up from 2%) (see Chart 20 in Annex 1 for other countries).
Firms’ investment and hiring decisions have also benefited from the continued recovery in economic activity. A net percentage of euro area enterprises reported increases in fixed investment (16%, up from 13%), inventories and working capital (15%, up from 10%) and number of employees (16%, up from 12%). However, while advances in fixed investment and inventories are widespread across all firm sizes, the recovery in employment seems to be stronger for larger firms, whereas micro SMEs are continuing to report an actual reduction in employees.
The recovery in fixed investment expenses, in inventories and working capital and in employment remained widespread across countries. In net terms, the percentages of firms reporting increases in fixed investment ranged between 8% and 20%, while for inventories and working capital expenses they ranged between 8% and 22%, and for employment between 11% and 18% in the four largest euro area economies.
The financial vulnerability of euro area enterprises eased overall, but differences across firm sizes are noticeable (see Chart 3). The financial vulnerability indicator, a comprehensive indicator of firms’ financial situation[6], suggests that, as in the previous survey round, 4% of euro area enterprises encountered major difficulties in running their businesses and servicing their debts over the past six months. That overall percentage masks differences between large firms (of which only 2% can be considered financially vulnerable, down from 4%), and SMEs (of which 5% are vulnerable, up from 4% in the previous survey round). Moreover, financial vulnerability remains somewhat above its average levels prior to the outbreak of COVID-19.
At the other end of the spectrum, the percentage of profitable firms (i.e. those that are more likely to be resilient to adverse shocks) also declined to 4% overall (from 6%) (Chart 21 in Annex 1 shows the results at country level).
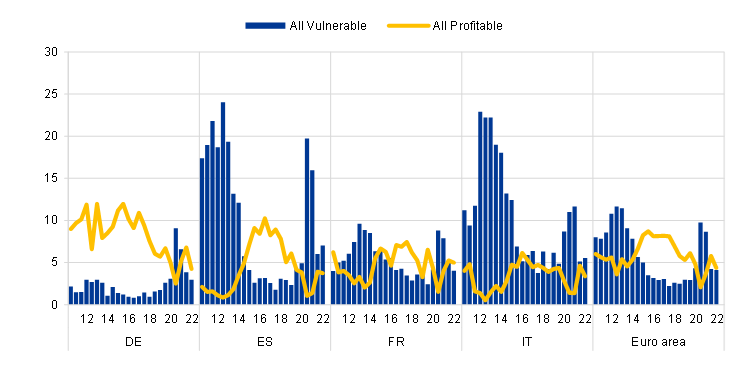
Chart 3
Vulnerable and profitable enterprises in the euro area
(percentages of respondents)
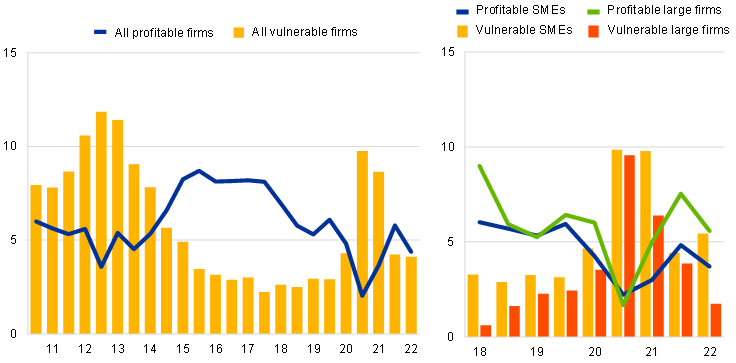
Base: All enterprises. The figures refer to rounds 3-26 of the survey (March 2010-September 2010 to October 2021-March 2022) for all firms and to rounds 18-26 (October 2017-March 2018 to October 2021-March 2022) for SMEs and large firms.
Notes: For definitions, see footnote 7. The data included in the chart refer to Question 2 of the survey.
Looking at firm size, smaller enterprises continued to be more vulnerable than larger companies. While the percentage of medium-sized SMEs that can be considered vulnerable remained at 3%, it increased to 5% (from 4%) for small firms, and to 7% (from 5%) for micro firms. The percentage of firms that can instead be characterised as “profitable” declined across all size categories, although it remains above the lows reached during 2020.
Trends in the financial vulnerability indicator diverged across countries (see Chart 21 in Annex 1). The percentage of vulnerable companies rose somewhat in Spain (7%, up from 6%) and Italy (6%, up from 5%), while it decreased slightly in France (4%, down from 5%) and Germany (3%, down from 4%). By contrast, profitability decreased across the four largest economies in this survey round, in line with the euro area aggregate, with the share of profitable firms ranging between 3% of firms in Italy and 5% in France.
For the second time in recent years, the questionnaire included some additional questions regarding the price expectations and price setting behaviour of euro area enterprises. Box 1 summarises the main results.
Box 1
Ad-hoc questions – Price expectations among euro area enterprises
Firms are important economic agents when it comes to determining inflation dynamics. This is because firms take many decisions that influence macroeconomic outcomes. These include decisions on wages and selling prices, on how much to invest and on how many people to employ. Firms’ price setting behaviour is therefore of significant interest for monetary policy. However, information about firms’ pricing practices remains relatively scarce compared with that from other economic agents. To help better understand of pricing practices among euro area corporations, this survey round introduced a few additional questions on recent price changes (i.e. those over the past 12 months) and expected price changes (i.e. those over the next 12 months) at firm level, along with questions on the importance of factors taken into account in determining those price expectations over the next 12 months.
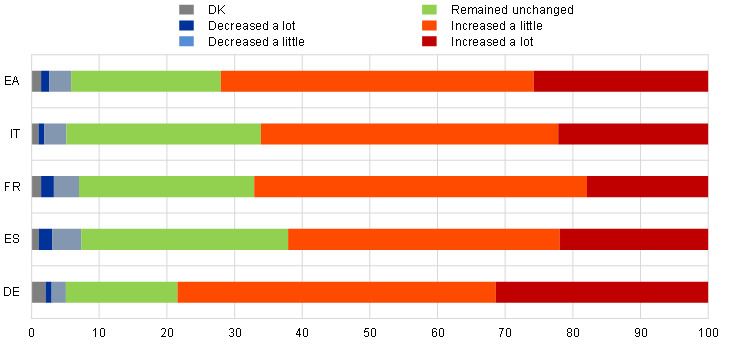
Euro area companies reported higher selling prices over the past year (Chart A). About three-quarters of euro area firms indicated that their prices increased “a little” (46%) or “a lot” (26%), while the proportion of firms for which prices remained unchanged was more limited (22%), and only very few reported lower prices (4%).
Among the largest economies, upward pressures on firms’ prices were more acute in Germany than in the other three largest economies. While firms in the euro area as a whole and in the largest four countries predominantly characterised price increases over the last 12 months as relatively moderate (between 40% and 49% of firms described prices as “increasing by a little”), 31% of German firms reported higher increases (”by a lot”), which was above the euro area average (26%). In the other large countries, the respective percentages were 22% in Italy and Spain and 18% in France. Meanwhile, the proportion of firms reporting unchanged prices ranged from 16% in Germany to 31% in Spain, with the euro area average standing at 22%. These price developments suggest a stronger pass-through of input costs among German companies than in other countries, which may help explain the diverging developments in profits across countries reported in the previous section. By contrast, differences across firm sizes in the euro area as a whole appear to be limited and broadly reflect the same qualitative pattern as that described above.
Chart A
Recent changes in selling prices in euro area countries
(over the preceding 12 months; percentages of respondents)
QA1: Considering the markets where you sell your main products or services, have your selling prices in the last twelve months…?
Base: All enterprises. The figures refer to round 26 (October 2021-March 2022) of the survey.
Note: DK stands for “Don’t know”.
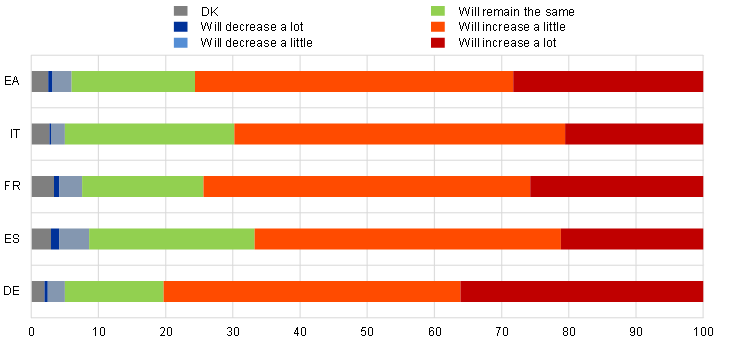
Upward pressures on firms’ prices are expected to continue (Chart B). Over the next 12 months, the overwhelming majority of euro area enterprises expect their prices to increase (47% by “a little”, 28% by “a lot”), with a lower proportion expecting their prices to remain unchanged (18%) or even to decrease a little (3%). The expectations of higher selling prices overall appear to be quite similar across firm sizes, and they are widespread among both large firms and SMEs of all sizes.
Chart B
Expected changes in selling prices in euro area countries
(over the next 12 months; percentages of respondents)
QA2: Looking ahead, considering the markets where you sell your main products or services, would you say that in the next twelve months your selling prices…?
Base: All enterprises. The figures refer to round 26 (October 2021-March 2022) of the survey.
Note: DK stands for “Don’t know”.
To help further understand the forces behind the expected price changes reported above, firms were also asked to report the importance of several factors when setting their prices. The factors range from demand for the firm’s own products/services, costs (for inputs, financing and labour) and market shares/competitors’ prices to expected inflation and exchange rate dynamics.
Costs (of both inputs and labour) and expected inflation are the main factors behind higher expected selling prices among euro area companies, followed by own demand (Chart C). Input costs are the most important factor currently influencing selling price expectations (“very” important for 74% of firms), followed by labour costs (60%), expected inflation (58%) and own demand (55%). By contrast, factors such as market shares/competitors’ prices, the exchange rate and the availability and costs of financing play a much more limited role.
Chart C
Factors influencing selling prices for euro area enterprises (2022 situation vs 2020 pre-COVID-19)
(percentages of respondents)
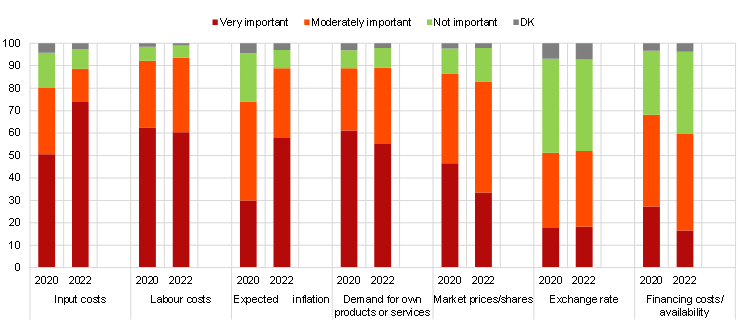
QA3: How important do you expect the following factors to be when setting or changing your selling prices over the next twelve months?
Base: All enterprises. Figures refer to round 22 (October 2019-March 2020) and round 26 (October 2021-March 2022) of the survey.
Changes in the relative importance assigned to different factors over time offer additional insights into the nature of increases in selling price expectations among firms. In the case of the SAFE, similar questions were asked two years ago, in early 2020. Labour and input costs were already the main source of upward pressures on selling prices before the pandemic in early 2020, while the impact of expected inflation has increased more recently.
More specifically, the share of firms reporting that labour costs are relevant has remained similar relative to the previous survey (“very” important for around 60% of firms and “moderately” important for about 33%), while the corresponding value for input costs has risen further (reported as “very” important by 74% of firms now, up from 51% in early 2020). The significant rise in inflation since 2020 also appears to have increased the influence of expected inflation on selling prices, a factor which 58% of firms now report as “very” important (up from 30% in 2020). By contrast, developments in own demand and in competitors’ prices/market share now play a smaller role than in 2020 when it comes to selling price expectations. The exchange rate and financing costs/availability continue to have more limited influence on expected selling prices, being rated as “not important” by around 40% of firms. These qualitative findings are broadly shared across firm sizes, although input costs and expected inflation seem to be more relevant to large companies than to SMEs, while the opposite seems to hold for financing costs.
Price increases are expected to remain stronger in Germany than in other large countries. More than a third of German firms expect their prices to increase by “a lot” (36%), while for the other large countries the proportion ranges between 21% (Spain and Italy) and 26% (France). Almost half of firms in all countries expect their prices to increase by “a little” (ranging between 44% in Germany to 49% in France and Italy). Meanwhile, about a quarter of reporting firms (ranging between 18% in Germany and 30% in Spain) expect constant or decreasing prices.
2.2 Euro area enterprises remain more concerned about staff availability and production costs and less about access to finance
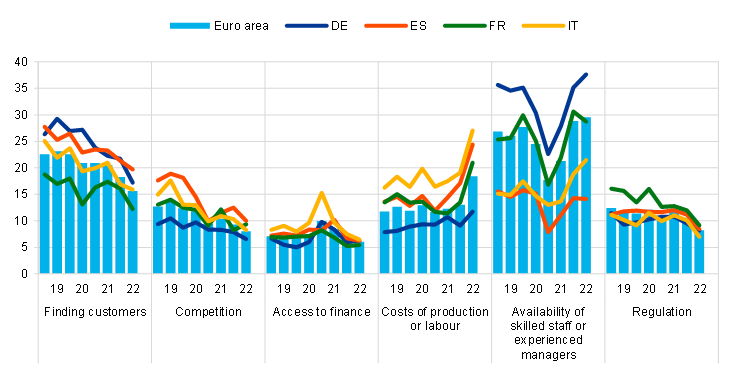
The availability of skilled labour and the rise in production costs have become the main concerns, in relative terms, for euro area enterprises (see Chart 4). Over the past six months, concerns about the availability of skilled labour continued to rise among euro area firms (signalled by a net 30% of firms, up from 29%). Concerns regarding production costs also rose (18%, up from 13%), becoming the second most important concern for euro area enterprises. By contrast, difficulty in finding customers (16%, down from 18%), regulation (8%, down from 11%) and competition (8%, down from 9%) moderated with respect to the previous survey round. Finally, SMEs reported that they were relatively less concerned about access to finance (unchanged at 6%), broadly in line with pre-pandemic percentages.
Chart 4
The most important problems faced by euro area enterprises
(percentages of respondents)

Base: All enterprises. The figures refer to rounds 19-26 of the survey (April 2018-September 2018 to October 2021-March 2022).
Notes: The data included in the chart refer to Question 0b of the survey.
Overall, concerns are broadly similar across euro area enterprises, regardless of their size. Concerns regarding production costs rose significantly for firms of all sizes, and large firms tended to report somewhat stronger concerns about shortages of skilled staff than smaller companies, possibly on account of their more advanced recovery from the trough in economic activity. Lower concerns about regulation, competition and access to finance were common across all firms, regardless of their size.
The main concerns among firms followed broadly similar patterns across euro area countries, although some cross-country heterogeneity remained (see Chart 22 in Annex 1). Looking at the different factors in relative terms, firms’ concerns about higher production costs rose significantly in the four largest euro area countries this round. However, the lack of skilled staff remained the biggest concern, particularly for German companies (signalled by a net 38%), although it was somewhat less of a problem in Spain and Italy (14% and 21% respectively). At the same time, Spanish firms reported more difficulty finding customers (20%), while this was significantly less of a concern among French and Italian enterprises (12% and 16% respectively).
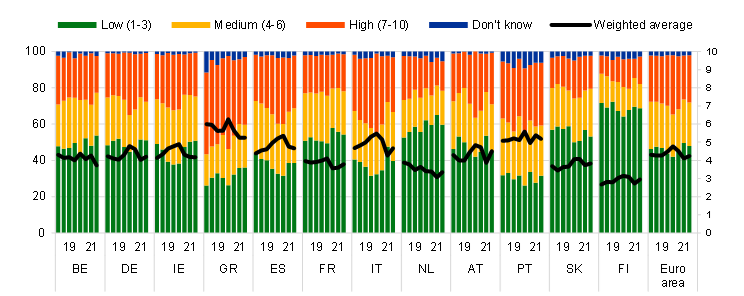
Focusing on the importance of access to finance as a problem on a scale of 1 to 10 offers additional insights into concerns regarding the evolution of euro area enterprises (see Chart 5). Scores remained within the low range of concerns for both large and SMEs, but their weighted averages rose marginally from the previous round. This suggests that, although in relative terms few companies (and less than in the previous round) ranked access to finance as their most important concern (compared with others as shown in Chart 4 above), when considering the score assigned to access to finance (on a scale of 1 to 10), firms’ responses point to a low but marginally growing concern about their access to finance, possibly related, for example, to the increases in interest rates and deterioration in conditions for bank loans that they report (see Section 4).
Chart 5
Importance of access to finance as perceived by euro area enterprises
(percentages of respondents)
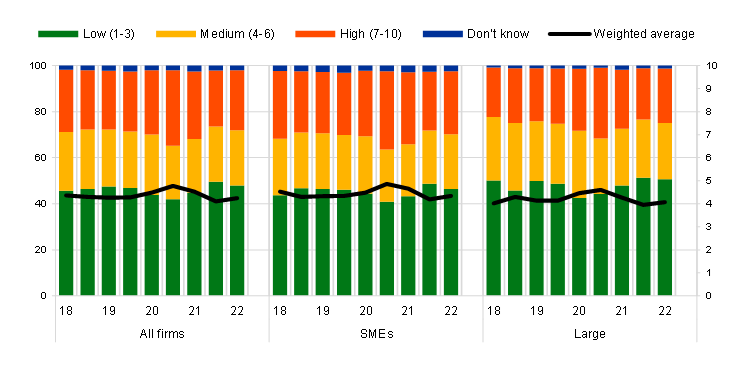
Base: All enterprises. The figures refer to rounds 18-26 of the survey (October 2017-March 2018 to October 2021-March 2022).
Notes: Enterprises were asked to indicate how important a specific problem was on a scale of 1 (not at all important) to 10 (extremely important). On the chart, the scale has been divided into three categories: low (1-3), medium (4-6) and high importance (7-10). The weighted average score is an average of the responses using the weighted number of respondents. The data included in the chart refer to Question 0b of the survey.
3 Firms’ needs for and uses of external financing
3.1 Moderate increases in demand for external financing
In net terms, firms reported some moderate increases in the demand for bank loans and credit lines at the euro area level, with credit demand now reaching pre-pandemic levels (see Chart 6). A net 5% of companies reported higher demand for bank loans[7] (up from 2% in the previous survey round), while 7% reported increased demand for credit lines (up from 4%). The results are in line with the overall growth in bank loans recorded since last October in the euro area, although they show some heterogeneity across size classes and countries. While demand for bank loans was similar for SMEs and large companies (4% and 6%, respectively), the increase in demand for credit lines was reported more often by SMEs (9%) than for large firms (5%). At the same time, net demand for trade credit and leasing or hire-purchase continued to increase (12% and 13% respectively), as did demand for other loans (8%), all signalling the need for firms to diversify external finance.
Chart 6
Changes in external financing needs of euro area enterprises
(net percentages of respondents)

Base: Enterprises for which the instrument in question is relevant. The figures refer to rounds 19-26 of the survey (April 2018-September 2018 to October 2021-March 2022).
Notes: See the notes to Chart 1. The data included in the chart refer to Question 5 of the survey.
Demand for bank loans and credit lines continued to increase at a slower pace across most countries after the peak reached during the first phase of the pandemic (see Chart 24 in Annex 1). The increase in net demand for bank loans was higher for Italian firms (10%), while needs for credit lines were more similar across countries.
3.2 Euro area firms used financing primarily for fixed investment and for inventories and working capital
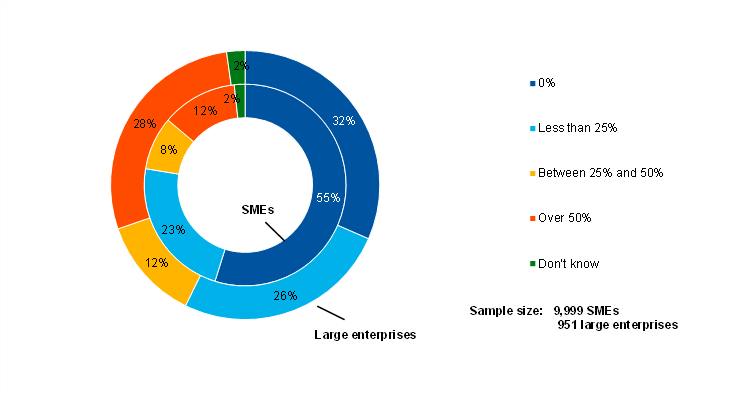
Financing from external and internal sources continued to be used mainly for fixed investment and for inventories and working capital (see Chart 7). Around 47% of euro area firms mentioned using financing for fixed investment, while 42% reported using it for inventories and working capital. After the decline during the pandemic, fixed investment and the hiring and training of employees rebounded in the last three survey rounds to reach levels close to those prevailing before the pandemic. Across size classes, more large companies than SMEs were using external finance for fixed investment (60% compared with 40%) and for working capital and inventories (50% compared with 37%), which might be due to higher capacity on the part of large companies to build up precautionary inventories.
Chart 7
Purpose of financing as reported by euro area enterprises
(percentages of respondents)

Base: All enterprises. The figures refer to rounds 19-26 of the survey (April 2018-September 2018 to October 2021-March 2022).
Note: The data included in the chart refer to Question 6A.
Looking at the largest euro area countries, German firms continued to stand out in terms of their use of funds for fixed investment (59%), while Spanish firms continued to use financing more for inventories and working capital (52%) (see Chart 25 in Annex 1).
4 Availability of external financing for firms in the euro area
4.1 Lower availability of external financing, mainly on account of the deterioration in the economic outlook
4.1.1 Improvements in the availability of bank loans lower across firm sizes and countries, only marginally compensating for increases in demand
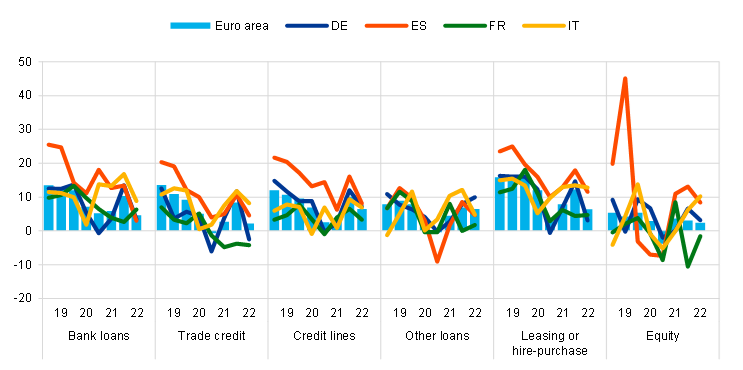
Fewer firms reported improvements in the availability of most external financing sources relevant for their business (see Chart 8).[8] For bank loans and credit lines, the net percentages of respondents indicating an improvement in availability declined to 5% and 6% respectively (both down from 10% in the previous survey round). In addition, fewer firms signalled increases in the availability of trade credit and equity (2% for both). Other loans (mainly informal loans from family and friends, a related enterprise or shareholders) and leasing remained important sources of available external funding as an alternative to banking and market-based finance.
Chart 8
Changes in the availability of external financing for euro area enterprises
(net percentages of respondents)
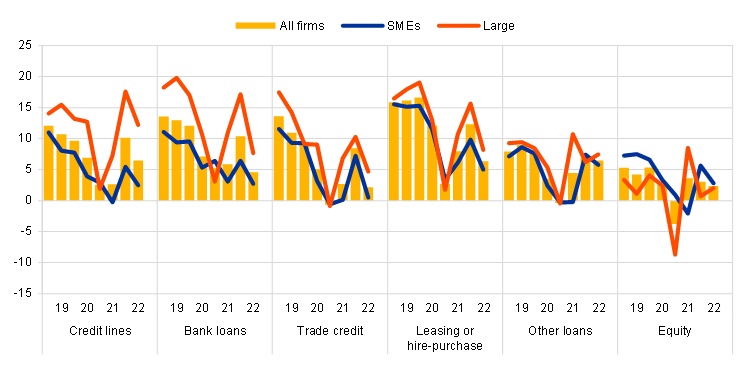
Base: Enterprises for which the instrument in question is relevant. The figures refer to rounds 19-26 of the survey (April 2018-September 2018 to October 2021-March 2022).
Notes: See the notes to Chart 1. The data included in the chart refer to Question 9 of the survey.
Firms across size classes pointed to similar developments. Indeed, in this survey round, both SMEs and large firms reported smaller improvements in the availability of most financing products. However, the net percentage of large companies indicating improvements in availability remained higher, reinforcing the disparities in access to external financing across firm sizes.
Fewer firms indicated improvements in the availability of bank loans across countries (see Chart 26 in Annex 1). The net percentage of respondents indicating improvements in the availability of bank loans declined in the largest euro area countries, except in France, where a slightly higher percentage of firms reported increases with respect to the previous survey round.
Improvements in firms’ access to external funds only marginally compensated for the corresponding increases in their financing needs (see Chart 9). In the euro area as a whole, the external financing gap – the difference between the change in demand for and the change in the supply of external financing – reached 1% (compared with -4% in the previous round). Across size classes, large companies continued to report a sufficient supply of external finance to cover their demand (i.e. a negative financing gap, -2% compared with -7%). By contrast, SMEs indicated a small gap in their ability to finance demand, which was the reverse of their previous situation (2% compared with -2%). At the level of individual euro area countries, the financing gap remained negative only in Germany (-1%), as it became positive in Italy (1%) (see also Chart 27 in Annex 1).
Chart 9
Changes in the external financing gaps reported by euro area enterprises
(weighted net balances)
Base: Enterprises for which the instrument in question is relevant. Respondents replying with “not applicable” or “don’t know” are excluded. The figures refer to rounds 3-26 of the survey (March 2010-September 2010 to October 2021-March 2022).
Notes: The financing gap indicator combines both financing needs and the availability of bank loans, credit lines, trade credit, and equity and debt securities issuance at firm level. For each of the five financing instruments, the indicator of the perceived change in the financing gap takes a value of 1 (-1) if the need increases (decreases) and availability decreases (increases). If enterprises perceive only a one-sided increase (decrease) in the financing gap, the variable is assigned a value of 0.5 (-0.5). The composite indicator is a weighted average of the financing gaps for the five instruments. A positive value for the indicator points to an increase in the financing gap. Values are multiplied by 100 to obtain weighted net balances in percentages. The data included in the chart refer to Question 5 and Question 9.
4.1.2 Euro area enterprises perceived that a weaker economic outlook was negatively affecting their ability to obtain external finance
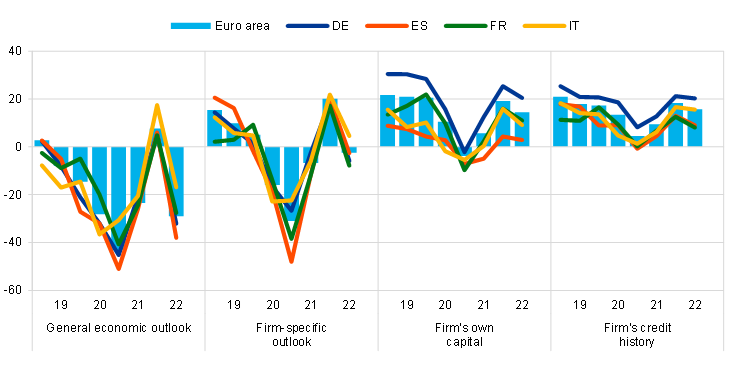
A deteriorating outlook for economic activity was reported as an important factor affecting access to finance (see Chart 10). In this survey round, euro area firms felt that changes in the general economic outlook had had a strong negative impact on their access to finance (-29%, from 8%). At the same time, enterprises reported a small deterioration in firm-specific factors, such as outlook in terms of profits and turnover (-2%, down from 20%). Across size classes, the factors related to the macroeconomic environment had a similar negative impact among SMEs and large firms, whereas firms’ specific factors weighed more negatively for SMEs. By contrast, factors related to capital position (15%, down from 19%) and creditworthiness (16%, down from 18%) were still having a positive impact on access to finance. This might reflect the ongoing efforts of companies to restore their equity capital buffers and thus become more resilient to economic shocks.
Chart 10
Changes in factors that have an impact on the availability of external financing to euro area enterprises
(net percentages of respondents)

Base: All enterprises. The figures refer to rounds 19-26 of the survey (April 2018-September 2018 to October 2021-March 2022).
Notes: See the notes to Chart 1. The data included in the chart refer to Question 11 of the survey.
Among the largest euro area countries, the most pessimistic perceptions on the general economic environment came from Spanish and German companies. In particular, 38% of Spanish and 32% of German companies reported a net negative impact from the general economic outlook (up from a previous positive impact of 6% and 5% respectively) (see Chart 28 in Annex 1).
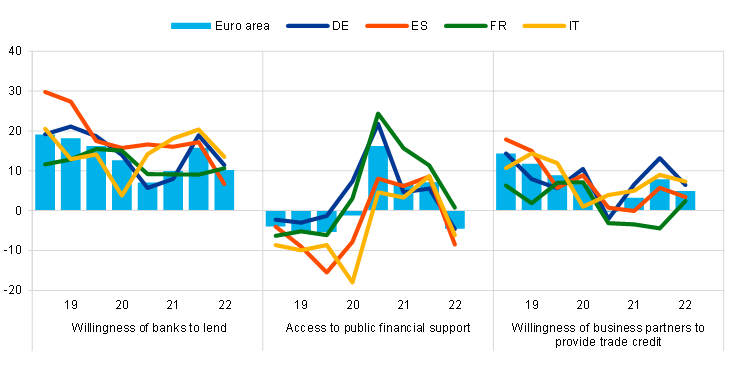
Euro area firms perceived that banks’ willingness to provide credit was still improving, but to a lesser extent than in the previous survey round (see Chart 11). In net terms, 10% of firms reported an increase in banks’ willingness to lend (down from 16% in the previous round), with a lower percentage for SMEs (6%) than for large firms (17%). At country level, the reduction was higher in Spain (7%, down from 17%), while French enterprises reported an increase (11%, up from 9%) (see Chart 29 in Annex 1).
Reflecting the completion of many public support programmes in the euro area, firms started to report that public financial support was playing a decreasing role in easing access to finance (see Chart 11). The role of public financial support returned to a level in line with the survey rounds before the pandemic. 5% of euro area firms no longer considered grants or subsidised loans to be important tools for obtaining access to finance. Looking at firm size, SMEs were more pessimistic than large firms in this respect. At country level, only French firms continued to signal positive changes in the impact of public policy (see Chart 29 in Annex 1).
Chart 11
Changes in factors that have an impact on the availability of external financing to euro area enterprises
(net percentages of respondents)
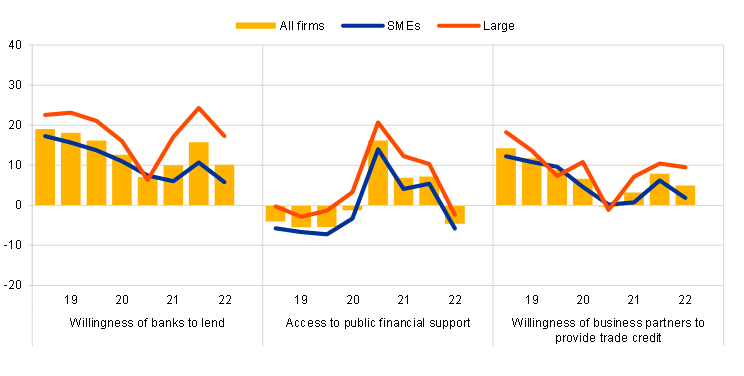
Base: All enterprises; for the category “willingness of banks to lend”, enterprises for which at least one bank financing instrument (credit line, bank overdraft, credit card overdraft, bank loan or subsidised bank loan) is relevant. The figures refer to rounds 19-26 of the survey (April 2018-September 2018 to October 2021-March 2022).
Notes: See the notes to Chart 1. The data included in the chart refer to Question 11.
4.2 Small increases in financing obstacles, mainly among SMEs
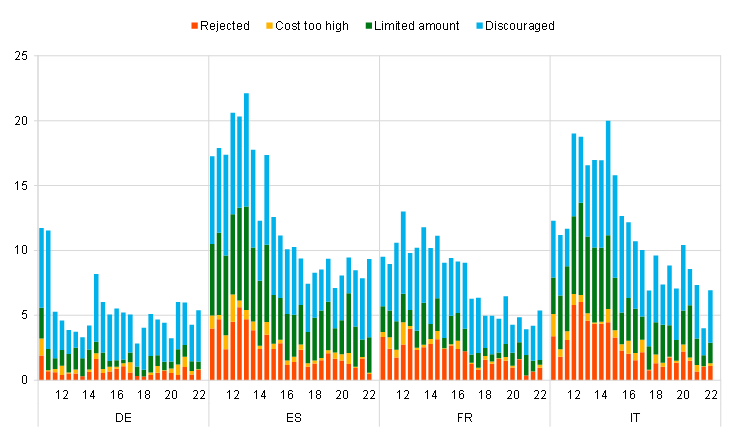
The percentage of firms reporting obstacles to obtaining a bank loan increased marginally (see Chart 12, panel a). Among enterprises that judged bank loans to be relevant for their funding, 7% faced obstacles when obtaining a loan (up from 6% in the previous survey round), with the increase mainly due to SMEs (8%). Looking at the different components of the indicator for financing obstacles, the percentage of firms that were discouraged from applying for a loan also increased slightly at the euro area level (to 4% from 3%) and across countries (see Chart 30 in Appendix 1).
Chart 12
Obstacles to obtaining a bank loan
(percentages of respondents)
Panel a: Euro area enterprises
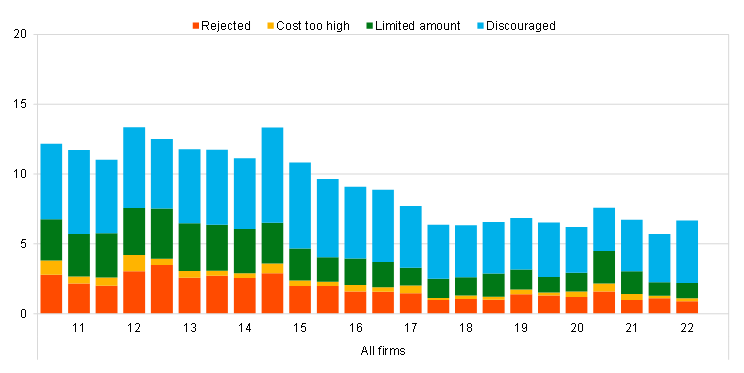
Panel b: Euro area SMEs and large enterprises
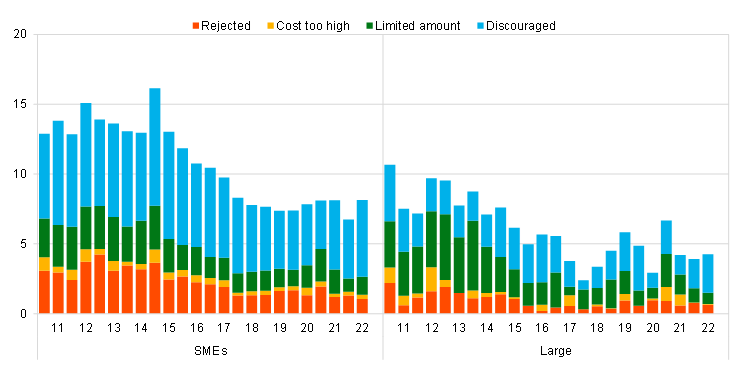
Base: Enterprises for which bank loans (including subsidised bank loans) are relevant. The figures refer to rounds 3-26 of the survey (March 2010-September 2010 to October 2021-March 2022).
Notes: Financing obstacles are defined here as the total of the percentages of enterprises reporting (i) loan applications that were rejected, (ii) loan applications for which only a limited amount was granted, (iii) loan applications that resulted in an offer that was declined by the enterprise because the borrowing costs were too high and (iv) a decision not to apply for a loan for fear of rejection (discouraged borrowers).
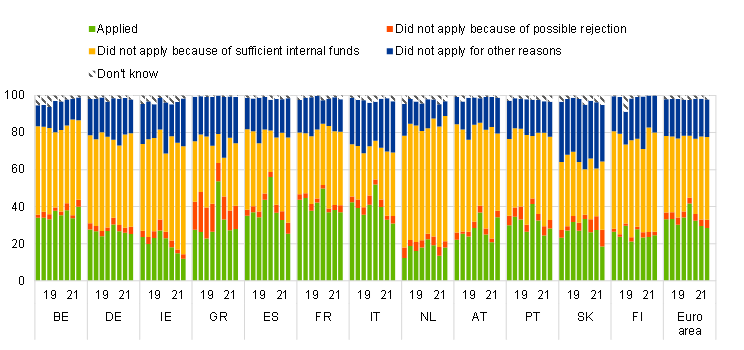
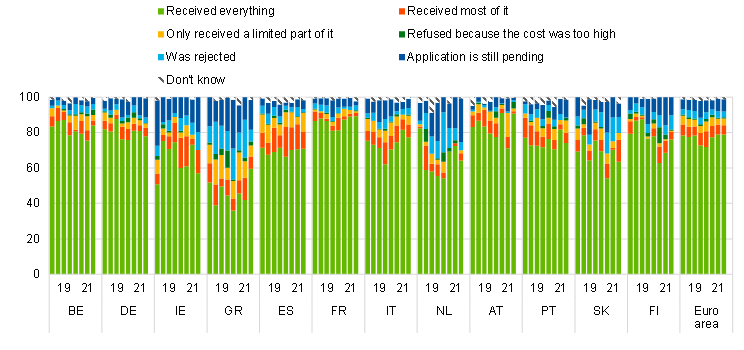
The percentage of firms applying for bank loans continued to decline after the peak reached at the beginning of the COVID-19 pandemic, while self-financing continued to increase (see Chart 13). According to figures based only on enterprises that deemed bank loans to be relevant for their business, 29% of firms reported having applied for a loan (down from 30%). Only 23% of SMEs applied, whereas 45% did not apply because they had sufficient internal funds available. By contrast, even though a similar percentage of large companies signalled sufficient internal funds, they still tended to apply more often for bank loans than smaller-sized companies (37%). Most of the firms that applied were successful in obtaining the full amount requested, whether they were SMEs (71%) or large companies (87%) (see Chart 14).
Chart 13
Applications for bank loans by euro area enterprises
(percentages of respondents)
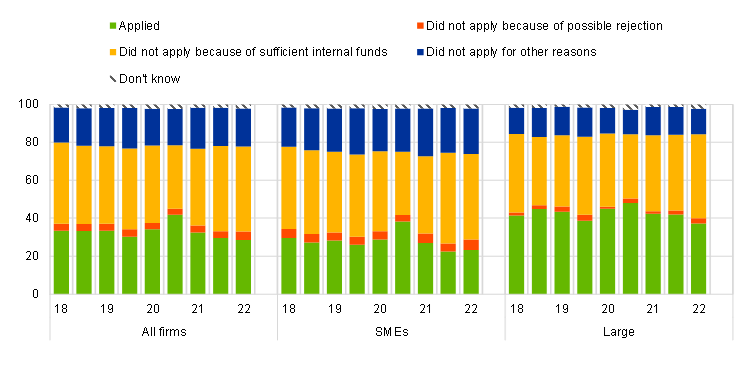
Base: Enterprises for which bank loans (including subsidised bank loans) are relevant. The figures refer to rounds 18-26 of the survey (October 2017-March 2018 to October 2021-March 2022).
Notes: The data included in the chart refer to Question 7A of the survey.
Chart 14
Outcome of applications for bank loans by euro area enterprises
(percentages of respondents)

Base: Enterprises that had applied for bank loans (including subsidised bank loans). The figures refer to rounds 18-26 of the survey (October 2017-March 2018 to October 2021-March 2022).
Notes: The data included in the chart refer to Question 7B of the survey.
4.3 Significant tightening of financing conditions, with increases in price terms and conditions for bank loans
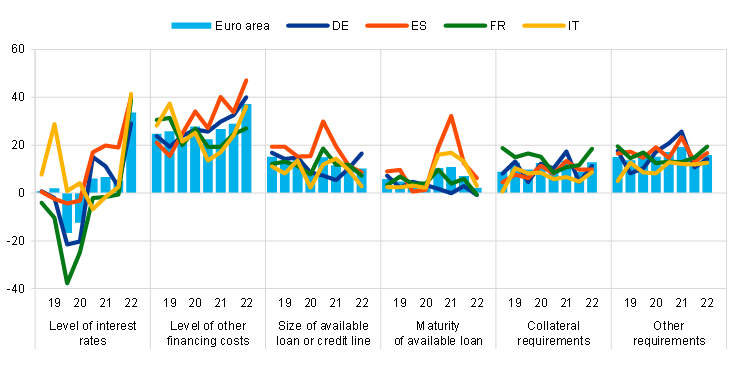
In this survey round, a very high percentage of firms reported increases in interest rates on bank loans together with some deterioration in other costs of financing, with similar developments across firm sizes and countries. The net percentage reporting such increases jumped to 34% (up from 5% in the previous round) (see Chart 15). No comparable percentage had been observed in the survey replies since 2012. The very high percentage is consistent with the recent net widening of margins applied to bank loans, also reported by banks in the April 2022 BLS. At the same time, the net percentage of firms signalling increases in other costs of financing (i.e. charges, fees and commissions) continued to increase, reaching 37% compared with 29%. The rises in bank interest rates and other costs of bank loans appear to be broadly similar across SMEs and large firms. Firms also reported stricter collateral requirements, while fewer firms indicated increases in the maturity of loans, with no changes in the size of loans.
Among the largest euro area countries, more Italian, Spanish and French firms reported increases in bank interest rates (see Chart 33 in Appendix 1). 41% of Italian firms, 40% of Spanish firms and 39% of French firms indicated that banks had increased bank interest rates (up from 3%,19% and -1% respectively).
Chart 15
Changes in the terms and conditions of bank financing for euro area enterprises
(net percentages of respondents)
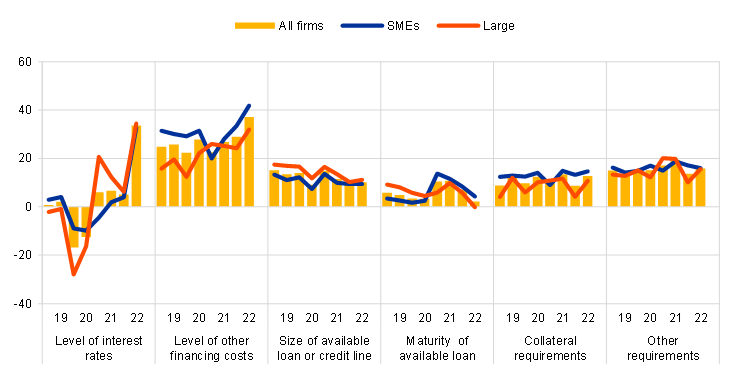
Base: Enterprises that had applied for bank loans (including subsidised bank loans), credit lines, or bank or credit card overdrafts. The figures refer to rounds 19-26 of the survey (April 2018-September 2018 to October 2021-March 2022).
Notes: See the notes to Chart 1. The data included in the chart refer to Question 10.
5 Expectations regarding access to finance and turnover
5.1 Firms expect a deterioration in their access to most forms of external financing in the near future
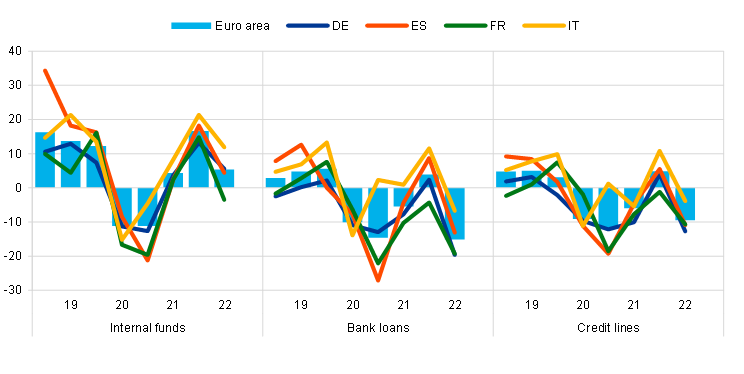
Euro area firms were quite pessimistic about the availability of most sources of external financing, especially financing from banks (see Chart 16). In particular, a relatively high percentage of firms reported a deterioration in expected access to bank loans and credit lines (-15% and -10%, respectively) over the next six months. The expected deterioration was common to size classes and most countries (see Chart 34 in Annex 1), reflecting the prevailing economic uncertainty and a changing attitude on the part of banks. Similarly, firms indicated a deterioration in their access to trade credit (-13%, down from 5%), while the improvement expected in the last survey round for equity issuance was reduced to 4% from 9%.
Chart 16
Actual and expected availability of external financing for euro area enterprises
(past six-month period and next six-month period; net percentages of respondents)
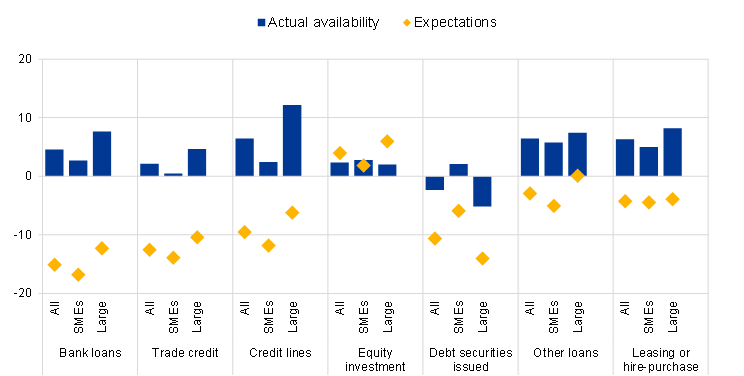
Base: Enterprises for which the instrument in question is relevant. The figures refer to round 26 of the survey (October 2021-March 2022).
Notes: See the notes to Chart 1. The data included in the chart refer to Question 9 and Question 23 of the survey.
To partly compensate for the expected reduction in availability of external finance, firms plan to use retained earnings to finance their future business, albeit to a lesser extent than in the previous survey round (5%, down from 17%) (see Chart 17). Across size classes, a smaller percentage of SMEs (3%) expected to use internal funds than large firms (7%), in line with the differences reported in their business turnover (see Section 2).
Chart 17
Changes in euro area enterprises’ expectations regarding the availability of financing
(next six-month period; net percentages of respondents)
Base: Enterprises for which the instrument in question is relevant. The figures refer to rounds 19-26 of the survey (April 2018-September 2018 to October 2021-March 2022).
Notes: See the notes to Chart 1. The data included in the chart refer to Question 23 of the survey.
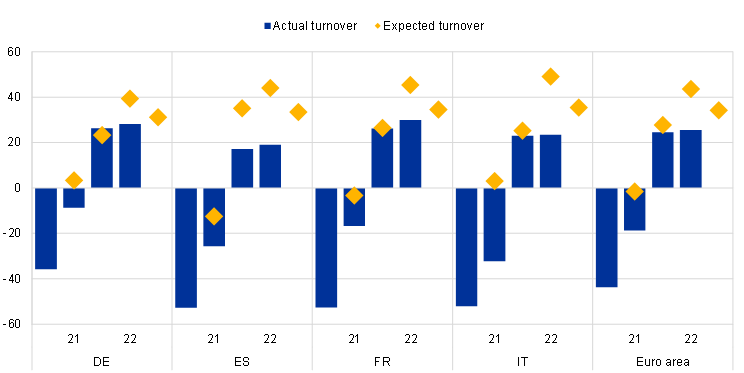
Meanwhile, the expected changes in turnover, while somewhat lower than in the previous round, are still positive and seem to be fairly resilient to the economic repercussions of the war in Ukraine (see Chart 18 in the report). A net 34% of euro area firms (down from 44% in the previous survey round) continue to expect an increase in turnover over the next six months. Expectations of future turnover seem to have been dented somewhat at the very start of this survey round, immediately after the start of the war in Ukraine, but remained relatively stable thereafter during the fieldwork period up to mid-April. A positive but somewhat less optimistic outlook for future turnover was reported among both large companies (47% compared with 57%) and SMEs (27% compared with 36%), as well as in the four largest euro area economies (see Chart 36 in Appendix 1).
Chart 18
Actual and expected turnover among euro area enterprises
(past six-month period and next six-month period; net percentages of respondents)
Base: All enterprises. The figures refer to round 23-26 of the survey (April 2020-September 2020 to October 2021-March 2022).
Notes: See the notes to Chart 1. The data included in the chart refer to Question 2 and Question 26 of the survey.
Annexes
Annex 1
Overview of survey replies – country results
Chart 19
Changes in the income situation
(net percentages of respondents)
Base: All enterprises. The figures refer to rounds 19-26 of the survey (April 2018-September 2018 to October 2021-March 2022).
Notes: See the notes to Chart 1. The data included in the chart refer to Question 2 of the survey.
Chart 20
Changes in the debt situation and real decisions
(net percentages of respondents)
Base: All enterprises. The figures refer to rounds 19-26 of the survey (April 2018-September 2018 to October 2021-March 2022).
Notes: See the notes to Chart 1. The data included in the chart refer to Question 2 of the survey.
Chart 21
Vulnerable and profitable euro area enterprises
(percentages of respondents)
Base: All enterprises. The figures refer to rounds 3-26 of the survey (March 2010-September 2010 to October 2021-March 2022).
Notes: For definitions, see footnote 7. The data included in the chart refer to Question 2 of the survey.
Chart 22
The most important problems faced by enterprises
(percentages of respondents)
Base: All enterprises. The figures refer to rounds 19-26 of the survey (April 2018-September 2018 to October 2021-March 2022).
Notes: The data included in the chart refer to Question 0b of the survey.
Chart 23
Importance of access to finance
(left-hand scale: percentages; right-hand scale: weighted averages)
Base: All enterprises. The figures refer to rounds 19-26 of the survey (April 2018-September 2018 to October 2021-March 2022).
Notes: Enterprises were asked to indicate how important a specific problem was on a scale of 1 (not at all important) to 10 (extremely important). On the chart, the scale has been divided into three categories: low (1-3), medium (4-6) and high importance (7-10). The weighted average score is an average of the responses using the weighted number of respondents. The data included in the chart refer to Question 0b of the survey.
Chart 24
Changes in external financing needs
(net percentages of respondents)

Base: Enterprises for which the instrument in question is relevant. The figures refer to rounds 19-26 of the survey (April 2018-September 2018 to October 2021-March 2022).
Notes: See the notes to Chart 1. The data included in the chart refer to Question 5 of the survey.
Chart 25
(percentages of respondents)

Base: All enterprises. The figures refer to rounds 19-26 of the survey (April 2018-September 2018 to October 2021-March 2022).
Notes: The data included in the chart refer to Question 6A of the survey.
Chart 26
Changes in the availability of external financing
(net percentages of respondents)
Base: Enterprises for which the instrument in question is relevant. The figures refer to rounds 19-26 of the survey (April 2018-September 2018 to October 2021-March 2022).
Notes: See the notes to Chart 1. The data included in the chart refer to Question 9 of the survey.
Chart 27
Changes in the external financing gaps
(weighted net balances)
Base: Enterprises for which the instrument in question is relevant. Respondents replying with “not applicable” or “don’t know” are excluded. The figures refer to rounds 3-26 of the survey (March 2010-September 2010 to October 2021-March 2022).
Notes: The financing gap indicator combines both financing needs and the availability of bank loans, credit lines, trade credit, and equity and debt securities issuance at firm level. For each of the five financing instruments, the indicator of the perceived change in the financing gap takes a value of 1 (-1) if the need increases (decreases) and availability decreases (increases). If enterprises perceive only a one-sided increase (decrease) in the financing gap, the variable is assigned a value of 0.5 (-0.5). The composite indicator is a weighted average of the financing gaps for the five instruments. A positive value for the indicator points to an increase in the financing gap. Values are multiplied by 100 to obtain weighted net balances in percentages. The data included in the chart refer to Question 5 and Question 9.
Chart 28
Changes in factors that have an impact on the availability of external financing
(net percentages of respondents)
Base: All enterprises. The figures refer to rounds 19-26 of the survey (April 2018-September 2018 to October 2021-March 2022). Notes: See the notes to Chart 1. The data included in the chart refer to Question 11 of the survey.
Chart 29
Changes in factors that have an impact on the availability of external financing
(net percentages of respondents)
Base: All enterprises; for the category “willingness of banks to lend”, enterprises for which at least one bank financing instrument (credit line, bank overdraft, credit card overdraft, bank loan or subsidised bank loan) is relevant. The figures refer to rounds 19-26 of the survey (April 2018-September 2018 to October 2021-March 2022).
Notes: See the notes to Chart 1. The data included in the chart refer to Question 11.
Chart 30
Obstacles to obtaining a bank loan
(percentages of respondents)
Base: Enterprises for which bank loans (including subsidised bank loans) are relevant for rounds 3-26 of the survey (March 2010-September 2010 to October 2021-March 2022).
Notes: Financing obstacles are defined here as the total of the percentages of enterprises reporting (i) loan applications that were rejected, (ii) loan applications for which only a limited amount was granted, (iii) loan applications that resulted in an offer that was declined by the enterprise because the borrowing costs were too high, and (iv) a decision not to apply for a loan for fear of rejection (discouraged borrowers). The calculation of the indicator starts in 2010, when the question on applications for credit lines was first included in the questionnaire. The components of the financing obstacles indicator were affected by the amendments to the questionnaire in round 11 (filtering based on the relevance of the financing instrument and addition of the new category “my application is still pending”), and past data have been revised accordingly. These figures include the categories “my application is still pending” and “don’t know”.
Chart 31
(percentages of respondents)
Base: Enterprises for which bank loans (including subsidised bank loans) are relevant. The figures refer to rounds 19-26 of the survey (April 2018-September 2018 to October 2021-March 2022).
Notes: The data included in the chart refer to Question 7A of the survey.
Chart 32
Outcome of applications for bank loans
(percentages of respondents)
Base: Enterprises that had applied for bank loans (including subsidised bank loans). The figures refer to rounds 19-26 of the survey (April 2018-September 2018 to October 2021-March 2022).
Notes The data included in the chart refer to Question 7B of the survey.
Chart 33
Changes in the terms and conditions of bank financing
(net percentages of respondents)
Base: Enterprises that had applied for bank loans (including subsidised bank loans), credit lines, or bank or credit card overdrafts. The figures refer to rounds 19-26 of the survey (April 2018-September 2018 to October 2021-March 2022).
Notes: See the notes to Chart 1. The data included in the chart refer to Question 10 of the survey.
Chart 34
Actual and expected availability of external financing
(past six-month period and next six-month period; net percentages of respondents)

Base: Enterprises for which the instrument in question is relevant. The figures refer to round 26 of the survey (October 2021-March 2022).
Notes: See the notes to Chart 1. The data included in the chart refer to Question 9 and Question 23.
Chart 35
Changes in expectations regarding the availability of financing
(next six-month period; net percentages of respondents)
Base: Enterprises for which the instrument in question is relevant. The figures refer to rounds 19-26 of the survey (April 2018-September 2018 to October 2021-March 2022).
Notes: See the notes to Chart 1. The data included in the chart refer to Question 23 of the survey.
Chart 36
(past six-month period and next six-month period; net percentages of respondents)
Base: All enterprises. The figures refer to round 23-26 of the survey (April 2020-September 2020 to October 2021-March 2022).
Notes: The data included in the chart refer to Question 2 and Question 26 of the survey.
Annex 2
Descriptive statistics for the sample of enterprises
Chart 37
Breakdown of enterprises by economic activity
(unweighted percentages)
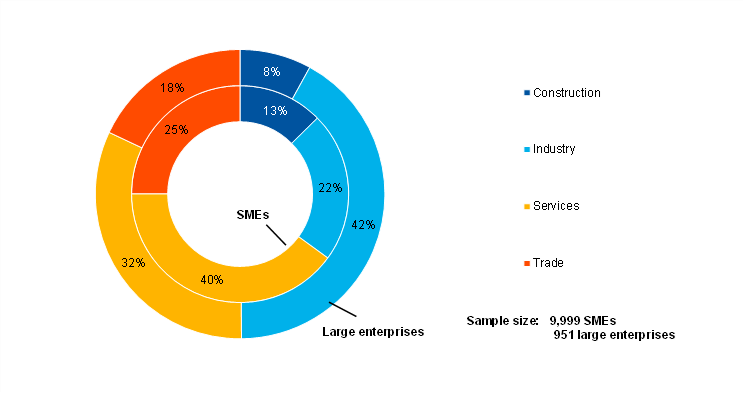
Base: The figures refer to round 26 of the survey (October 2021-March 2022).
Chart 38
Breakdown of enterprises by age
(unweighted percentages)
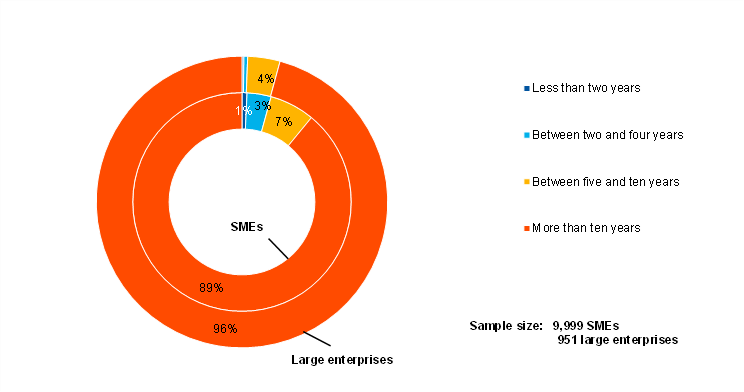
Base: The figures refer to round 26 of the survey (October 2021-March 2022).
Chart 39
Breakdown of enterprises by ownership
(unweighted percentages)
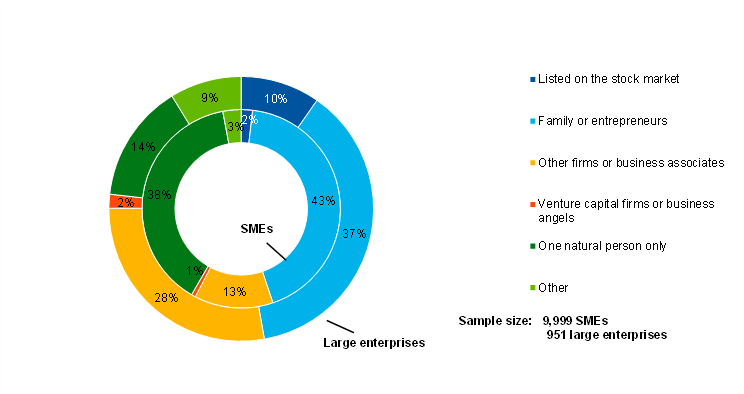
Base: The figures refer to round 26 of the survey (October 2021-March 2022).
Chart 40
Breakdown of enterprises by exports
(unweighted percentages)
Base: The figures refer to round 26 of the survey (October 2021-March 2022).
Annex 3
Methodological information on the survey
For an overview of how the survey was set up, the general characteristics of the euro area enterprises that participate in the survey and the changes introduced to the methodology and the questionnaire over time, see the “Methodological information on the survey and user guide for the anonymised micro dataset”, which is available on the ECB’s website.[9]
In this survey round, no major changes were made to the existing questions in the questionnaire.[10]
Postal address 60640 Frankfurt am Main, Germany
Telephone +49 69 1344 0
Website www.ecb.europa.eu
All rights reserved. Reproduction for educational and non-commercial purposes is permitted provided that the source is acknowledged.
The cut-off date for data included in this report was 23 November 2021.
For specific terminology please refer to the ECB glossary (available in English only).
PDF ISSN 1831-9998, QB-AP-20-002-EN-N
HTML ISSN 1831-9998, QB-AP-20-002-EN-Q
See Annex 3 for details of methodological issues relating to the survey.
The net percentages indicated in this report are defined as the difference between the percentage of enterprises reporting that something has increased and the percentage reporting that it has declined.
The financing obstacles indicator is the sum of the percentages of firms reporting the rejection of loan applications, loan applications for which only a limited amount was granted, and loan applications which resulted in an offer that was declined by the firms because the borrowing costs were too high, as well as the percentage of firms that did not apply for a loan for fear of rejection.
See https://www.ecb.europa.eu/stats/ecb_surveys/bank_lending_survey/html/index.en.html.
The indicator is one of the “principal components” derived from a factor analysis using firm-level survey replies since 2009 and is interpreted as relating to price terms and conditions. The analysis detects two other “principal components”, namely (i) the financial position of firms and (ii) non-price terms and conditions. For a detailed description of the indicator, see the box entitled “Financing conditions through the lens of euro area companies”, Economic Bulletin, Issue 8, ECB, 2021.
Vulnerable firms are defined as firms that simultaneously report lower turnover, decreasing profits, higher interest expenses and a higher or unchanged debt-to-assets ratio, while profitable firms are those that simultaneously report higher turnover and profits, lower or no interest expenses and a lower or no debt-to-assets ratio. The third (and typically largest) group consists of firms that satisfy some, but not all, conditions of the vulnerable and profitable categories. See the box entitled “Distressed and profitable firms: two new indicators on the financial position of enterprises”, Survey on the Access to Finance of Enterprises in the euro area, October 2017 to March 2018, ECB.
Only survey respondents who report that a particular financing instrument is relevant for their enterprise are asked about their need for that source of financing.
Only those survey respondents which report that a particular financing instrument (i.e. bank loans, credit lines, trade credit, leasing or hire-purchase, or other loans) is relevant for their enterprise are asked about the availability of that source of financing.
The questionnaire is available on the ECB’s website. It has been translated into various languages for the purposes of the survey.
-
1 June 2022