

A bird’s-eye view of the resilience of the European banking system: results from the new macroprudential stress test framework
A bird’s-eye view of the resilience of the European banking system: results from the new macroprudential stress test framework
Published as part of the Macroprudential Bulletin 7, March 2019.
The macroprudential stress test of the euro area banking system examines the effects of the baseline and adverse scenarios on the 91 largest euro area credit institutions across 19 countries. The analysis looks at the financial system as a whole and acknowledges the interdependencies between banks and the real economy. In particular, it takes into account banks’ reaction to changing economic conditions and to deterioration in their balance sheets. The results indicate substantial resilience of the euro area banking system at the current juncture. The macroprudential stress test predicts a lower negative impact on capital ratios, though higher capital depletion, in billions of euro, than a static balance-sheet stress test. It also shows that banks’ deleveraging tied to deteriorating capitalisation and asset quality leads to further deterioration in economic conditions in an adverse scenario.
1 Introduction
Stress testing is a method of identifying vulnerabilities of institutions or financial systems by forecasting their performance in adverse conditions. The core advantage of stress testing is its ability to evaluate risks and sensitivities of institutions with complex balance sheets and business models.
The macroprudential stress test considers the evolution of the financial system as a whole, and it extends the scope of the regular supervisory stress test for various amplification mechanisms. The macroprudential stress test starts from an adverse but plausible macroeconomic scenario, acknowledges that banks adjust their balance sheets in response to shocks, and adds feedback loops between financial and real sectors, as well as the interactions between banks and other counterparties in financial and capital markets.[2]
This article summarises the results of a macroprudential stress test of the euro area banking sector in 2018-2020, under the scenarios of the 2018 European Banking Authority (EBA) supervisory stress test.[3] The methodology of this macroprudential exercise: (i) studies dynamic adjustments of banks and economies; (ii) tests the resilience of the system as a whole rather than of individual banks; and (iii) permits the comprehensive modelling of an adverse feedback loop between the banking sector and the real economy. The core of the feedback mechanism is a link between the adjustments of banks and aggregate credit that is available to the real economy.
The macroprudential stress test is intended to achieve three objectives. First, it provides a metric to assess the resilience of the banking sector. Second, it encourages banks and regulators to think about the system-wide consequences of banks’ most likely decisions in situations of stress. Third, it can be used for counterfactual analysis to assess the reaction of the banking system to alternative macroprudential policies.
The article is structured as follows. The following section summarises our modelling approach. Section 3 comments on the baseline and adverse scenarios, while Section 4 lays out the main results for the banking sector. Section 5 compares the results with other supervisory stress tests run in 2018. Section 6 augments the adverse scenario with a feedback loop between the banking sector and the real economy. Section 7 concludes.
2 Methodology
The exercise employs a large-scale semi-structural model linking macro and bank-level data. The model features a macroeconomic block for the 19 euro area economies. It captures dynamic interdependencies of aggregate real and financial variables as well as cross-country spillovers via trade linkages. The model also includes a representation of 91 significant banks with their individual balance sheets and profit and loss accounts. Banks in the model cover broadly 70% of the euro area banking sector. Bank assets are modelled at a sufficiently granular sectoral and geographical level to reflect the main sources of heterogeneity across banks and their differential sensitivities to macroeconomic shocks. The liability side distinguishes equity, as well as wholesale and retail funding dynamics. For each bank, the development of profitability and capital is further broken down into the impact of credit and market risk, of net interest income, and of dividend payouts.[4]
The pass-through of scenarios into banks’ balance-sheet parameters is based on top-down satellite models. This contrasts with the constrained bottom-up approach employed in many microprudential exercises. The bottom-up approach gives more weight to banks’ own models and bank-specific particularities, while the top-down approach permits a counterfactual exploration of stress test results in a more standardised fashion.
The model analyses amplification effects through banks’ adjustments in the presence of solvency constraints. Estimated behavioural relationships govern banks’ behavioural responses. Banks react to changes in general economic conditions and shelter their capital targets linked to regulatory capital minimum requirements and buffers. Evidence suggests that such solvency constraints are not only enforced by the regulator but also by market discipline. In times of stress, solvency thresholds that prompt banks to adjust their balance sheets are likely to lie even significantly above regulatory minimum requirements. Other factors that shape banks’ decisions regarding lending, dividend distribution, and loan pricing include the quality of their assets, their profitability, and their funding structures.
The feedback loop between the banking system and the real economy can further aggravate the adversity of macroeconomic outcomes. Chart 1 sketches the timing and functioning of the model loop. At the beginning of each quarter, the economy is hit by a series of negative (in the adverse scenario) or favourable (in the baseline) shocks. These lead to a deterioration (in the adverse scenario) in economic conditions, reflected in e.g. lower output or inflation. Credit demand, the riskiness and quality of banks' assets, as well as the costs of funding and finally their profitability are adversely impacted by these developments. In response, banks will aim to restore their profitability and solvency by adjusting the supply of loans and the distribution of profits, and by trying to increase lending margins. The degree of this credit supply response depends on banks’ capitalisation levels. If either the initial capitalisation levels of banks are low or the adverse scenario is exceptionally severe, the credit supply response exceeds the one that would have been expected in “normal times”, when banks’ solvency targets were not strained. Under these adverse circumstances, the initial scenario conditions translate into an additional adverse credit supply shock. This shock adds to the set of adverse shocks in the next quarter.
Chart 1
Schematic illustration of the feedback loop between banks and real economy
The feedback loop between the banking system and the real economy can further aggravate the adversity of macroeconomic conditions.

3 Baseline and adverse scenarios
The baseline scenario foresees a prolonged, though fading, economic expansion. In accordance with ECB forecasts from December 2017, real GDP growth is projected to gradually slow down, from 2.4% in 2017 to 1.7% in 2020. The impact of favourable monetary policy is expected to decline gradually over the projection horizon. In addition, a deceleration in the growth rate of euro area foreign demand is expected to decelerate export growth. Unemployment rates are projected to decline further, while real estate prices continue to expand at an elevated, though gradually moderating, pace until the end of the scenario horizon in 2020.
The adverse scenario assumes the materialisation of four financial stability risks which the European Systemic Risk Board identified as representing the greatest material threats to the euro area banking sector. (i) The first of these risks is an abrupt and sizeable repricing of risk premia in global financial markets. Its materialisation spills over to the European countries though financial markets and foreign demand. (ii) The second risk relates to the decline in economic activity in the euro area. This affects in particular countries facing structural challenges in their banking sector. (iii) The third risk concerns increased political uncertainty and resurgence of public and private debt sustainability concerns. (iv) Fourth, liquidity risks in the non-bank financial sector materialise and spill over to the broader financial system.
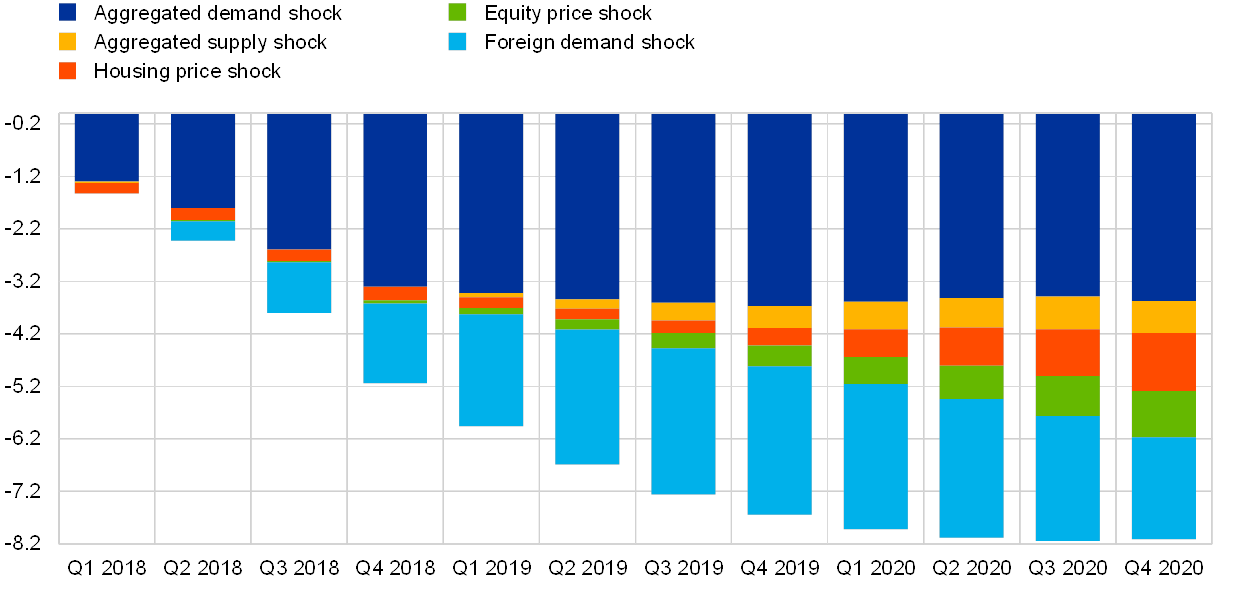
The materialisation of the four risks is expected to result in a severe recession. The strongest negative impact on economic activity is expected in 2018 and 2019, with annual GDP growth rates of -0.9% and -2%. This is 3.1 percentage points and 3.9 percentage points below the baseline projections. In 2020, the euro area is expected to experience positive growth, at a rate of 0.5% again, which still ranges 1.2 percentage points below baseline. Overall, the adverse scenario underlying the EBA exercise implies a deviation of euro area GDP from its baseline level by 7.8% in 2020 (Chart 2). Putting this in perspective, the cumulative GDP shortfall between the beginning and the trough of this recession would be 4.1% of GDP (compared with 6.1% in the last recession).
Chart 2
Adverse scenario impact on GDP
A large share of the expected reduction in GDP in the adverse scenario can be attributed to the reduction in aggregate foreign demand.
(GDP in percentage points as the deviation from the baseline)
The severity of the adverse scenario varies considerably across countries. Countries with higher trade openness and countries with vulnerabilities in the housing sector are hit relatively harder by adverse foreign demand and property price shocks, respectively. These shocks affect particularly Estonia, Lithuania, Malta, Luxembourg, Austria and Slovenia. At the same time, the higher indebted countries are assumed to experience more pronounced increases in risk premia and thus in long-term yields. This holds especially for Portugal, Greece, Italy and Spain.
4 Impact on the banking system
Banking sector profitability already deteriorates substantially at the beginning of the projection horizon. Chart 3 compares aggregated banks’ return on assets in the baseline and adverse scenarios. Most prominently, the figure shows a frontloaded impact of the adverse scenario on banks’ net returns at the beginning of 2018 already.
Chart 3
Profitablity of banks in baseline vs. adverse
Profitability is being hit immediately.
(quarterly return on assets in percentages)

The decomposition of profitability drivers in the adverse scenario reveals an immediate impact of credit risk. Chart 4 shows a decomposition of banks’ return on assets into its key components over time. Higher losses from credit risk already affect banks’ profits considerably in the first quarter of 2018. This can be attributed to two factors: first, the adverse scenario involves an abrupt deterioration of financial and macroeconomic conditions at the beginning of 2018; and second, with the introduction of IFRS 9, loan loss provisions became more forward-looking and already increase substantially in 2018.
Chart 4
Profitablity in the adverse scenario
Decomposition of return on assets illustrates its drivers
(contribution to ROA in percentage points)

In addition, a sharp fall in equity prices for most countries in 2018 leads to immediate impairments of financial assets (market risk). A widening of spreads adds to the negative impact on market risk. In the subsequent years, market risk already contributes positively to profitability as equity prices are expected to recover and interest rate spreads to narrow again. At the same time, interest rate expenses increase with the higher spreads, putting a strain on net interest income.
Net interest income (NII) is trending downward, while net fee and commission income (NFCI) provides a relatively stable source of returns. Chart 4 further reveals a downward trend in NII. Although deteriorating in the adverse scenario, NII also shrinks in the baseline scenario. This can be attributed to the high level of competition in the euro area banking system and to the low interest rate environment. In the adverse scenario, banks that have originated mainly fixed-rate loans also face a more pronounced contraction of their net interest income. Although NFCI declines somewhat under the adverse scenario conditions in 2018, it seems to generate more stable returns compared with other sources of income.
Solvency ratios are projected to decrease continuously, from 14.4% in 2017 to 11.2% in 2020 (Chart 5). Considering banking-system-wide capital in 2020, regulatory capital (CET1) decreases by €266 billion relative to 2017 or €457 billion relative to the baseline scenario.
Chart 5
Solvency of banks in baseline vs. adverse
CET1 ratios to diverge over the scenario horizon
(quarterly CET1 in percentages of RWA)

Banks’ loan origination responds endogenously to the scenario conditions. Accordingly, lending to the non-financial private sector tightens sharply in the adverse scenario. At the end of the scenario horizon, in 2020, euro-area-wide credit volumes would be expected to have contracted by 11%. This is a considerable contraction compared with an anticipated increase in the volume of loans of 9% in the baseline.
Lower credit demand and the contraction of credit supply hit sectors differently. Chart 6 shows expected loan growth by economic sector across banks for both scenarios. In particular, credit to non-financial corporates (NFCs) contracts the most in the adverse scenario. Banks also deleverage significantly on loans to financial intermediaries, while sovereign exposures increase in both the baseline and the adverse scenario.
Chart 6
Cumulative loan growth to NFC and households
Non-financial corporate credit decreases the most
(growth 2017 − 2020 in %)

Note: The box plots show the distribution of growth rates across banks. The boxes range from the 25th to the 75th percentile, with medians displayed as horizontal lines. Upper and lower values of whiskers are determined by the last values inside the range of 1.5 times the interquartile range from the boxes’ ends.
The ratio of non-performing loans (NPLs) increases substantially under the adverse scenario. Projections show a doubling of NPL ratios for the adverse scenario, in contrast to stable NPL ratios in the baseline (Chart 7). Along with the breakdown by sector, NFC loans contribute the most to the rise in NPLs in absolute terms. In relative terms, the rise in NPL ratios is the highest for consumer loans, which are usually also considered more risky. The evolution of NPLs in the baseline is also largely determined by projected cure rates. See Box 1 for an illustration of differential paths of NPLs for alternative sets of assumptions. Section 6 also shows that higher levels of legacy assets are also associated with higher vulnerability of bank-level returns under the adverse scenario.
Chart 7
NPL ratio in baseline vs. adverse
Ratio of non-performing loans to increase significantly
(NPL ratio in percentages)

5 Comparison with the 2018 constant balance sheet exercise
The results of the macroprudential stress test can be contrasted with the results derived under the constant balance sheet. Such a comparison can help to understand the role of banks’ adjustments to stress.
Comparing profitability levels, Chart 8 reveals higher sensitivity of banks’ profits in the macroprudential stress test. For the macroprudential stress test, the predicted profitability levels are higher in the baseline and lower in the adverse scenario. The outcome is strongly related to the behaviour of net interest income. System-wide net interest income increases following the expansion of banks’ balance sheets under the baseline, and drops following their contraction under the adverse scenario. In contrast, constant balance sheet results are only driven by the scenarios’ impact on spreads.
Chart 8
Change in profitability
(ROA in percentages)

The dynamic balance sheet mechanism stabilises banks’ capital ratios in the dynamic model of the macroprudential stress test. In the baseline scenario, banks’ CET1 ratios are in general higher for the macroprudential exercise (Chart 9, left). This pattern is largely explained by excess profitability levels, as well as by lower pay-out ratios. However, positive loan growth and expanding balance sheets are somewhat moderating the overall effect on capital ratios. In the same vein, banks’ CET1 ratios for the adverse scenario tend to also be higher for the macroprudential stress test. Here, the positive effect of banks’ deleveraging on their CET1 ratios even exceeds the impact of lower profitability (Chart 9, right).
Chart 9
Capital in the baseline (left) and adverse (right)

Despite higher capital ratios, the depletion of absolute system-wide capital is larger for the macroprudential stress test. When comparing total CET1 capital levels instead of CET1 capital ratios, the static exercise reveals a difference of €313 billion between the baseline and the adverse scenario. In the macroprudential stress test, the difference increases to €45 billion. Compared with the 2017 starting point, system-wide CET1 capital depletion is greater by €35 billion in the macroprudential stress test. Chart 10 presents CET1 depletion in relation to the end-2017 total risk exposure amounts (REA).
Chart 10
Comparing capital depletions
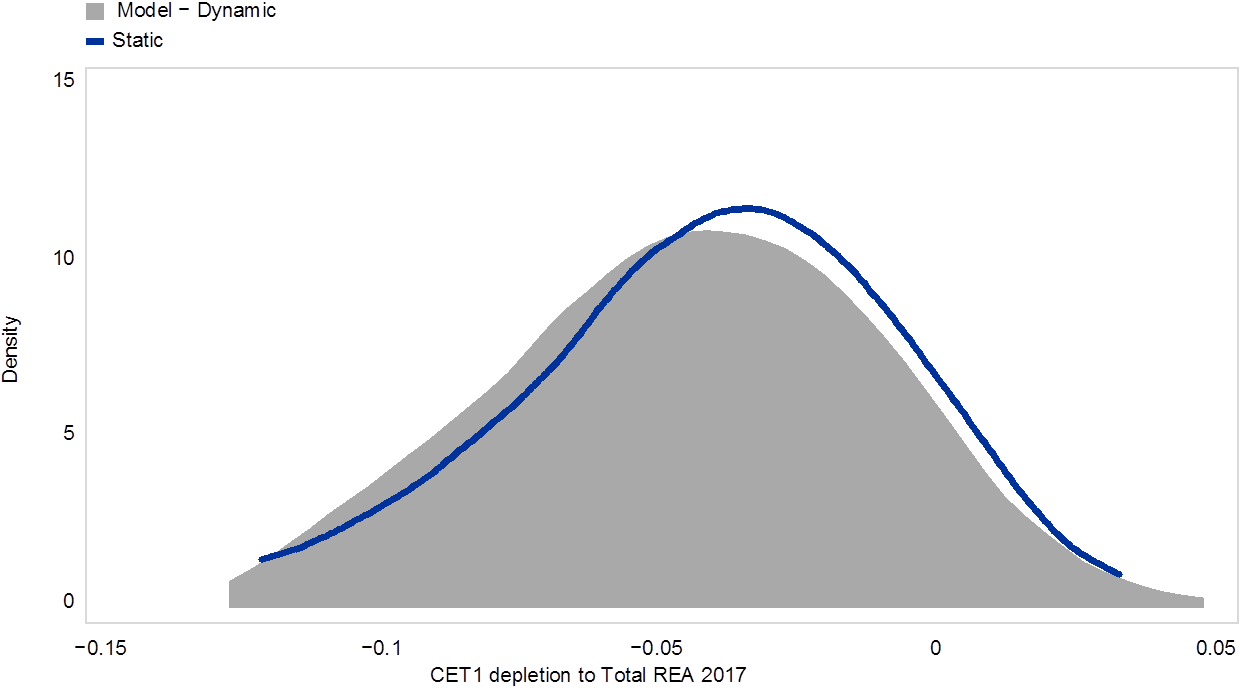
Notes: kernel = epanechnikov, bandwidth = 0.0200
The two versions of the stress test also differ with respect to the dynamic of NPL ratios. The static exercise assumes zero cure rates and no write-offs of NPLs from banks’ balance sheets. Under these assumptions, the NPL ratio also increases quite dramatically under the baseline scenario (Chart 11). The assumptions are relaxed in the macroprudential stress test. In addition, the dynamic balance sheet perspective allows growing-out of an existing NPL stock under favourable macroeconomic conditions. Chart 11 shows that the sensitivity of the NPL ratio to macroeconomic conditions is higher in the macroprudential stress test. More precisely, the NPL ratio stays almost constant under baseline conditions, while it almost doubles under the adverse scenario.
Chart 11
Comparing the increase in NPLs
(NPL ratio in percentages)

6 Augmenting the adverse scenario with a feedback loop
In addition to the standard adverse scenario underlying the EBA, one can consider a scenario augmented with a feedback loop between the banking sector and the economy. As outlined earlier, if adverse macroeconomic conditions coincide with weakly capitalised banking systems or low quality of banks’ assets, an adverse feedback loop could emerge and trigger significant adverse credit supply effects. Such a “credit crunch” could result in additional strain on the macroeconomy.
The adverse scenario underlying the EBA exercise (the “basic adverse scenario”) can be interpreted as a scenario with either full or only partial acknowledgment of this feedback mechanism. The argument for interpreting it as a scenario with only partial reflection of the feedback loop rests on the observation that such a feedback loop may involve non-linearity in the response of the macro-financial system. The models underlying the design of the basic adverse scenario were fitted on historic data representing mostly non-crisis times, and are unlikely to fully capture this non-linear mechanism.
The “augmented adverse scenario” adds an adverse feedback loop between banks and the real economy related to non-linearity in banks behaviour which is likely to emerge only in adverse economic conditions. Adding the feedback between the banking sector and the real economy increases the severity of the adverse scenario. Results for the augmented adverse scenario show considerable amplification through the real-financial feedback loop. In the aggregate figures, GDP contracts about 1.6 percentage points more by 2020 than the cumulative 2.4% GDP contraction in the “basic adverse scenario”. In the cross-country perspective, GDP contracts between 0.2% and 3.5%. The amplification mechanism is more pronounced for those countries that already show a relatively low capitalisation of their banking systems at the beginning of the scenario horizon (Chart 12). The capital shortfall is not fully reflected in the basic adverse scenario and needs to be emphasised more. The difference between the two scenarios reflects the stronger feedback mechanism.
Chart 12
GDP in scenarios with and without feedback
(cumulative GDP growth in percentages)

The effects in the basic adverse scenario can be seen as a lower bound, whereas the augmented adverse scenario with feedback can serve as an upper bound for the severity of bank-level and economy-wide outcomes. However, the considerations referred to earlier suggest that the augmented adverse scenario with feedback may be a better representation of the expected amplification mechanisms and final outcomes associated with the realisation of systemic risks.
7 Conclusion
The 2018 macroprudential stress test shows that the euro area banking system is resilient to deep simultaneous recessions in the euro area and global economies combined with large falls in asset prices. Despite facing losses that are cumulating on average to 3.6 percentage points of 2017 CET1 capital in the course of the adverse scenario, only 26% of the stress-tested significant euro area banks fall below their combined buffer requirement. And less than 10% of banks would experience problems with meeting minimum Pillar 1 and 2 capital requirements. As the latter group of banks represents only 2.8% of total assets in the sample, the resilience of the euro area banking system as a whole would not be materially impaired.
Banks experiencing a CET1 capital shortfall decrease their lending relatively more than other banks in order to meet their capital requirements. Accordingly, loan growth for banks with capital shortfalls is in most instances negative. Banks’ deleveraging hits non-financial corporations more than households. In addition, NPL ratios double on average until 2020 across all banks, from 4% to 8%, with consumer credit being the most sensitive portfolio category. Finally, most banks need to cut dividends sharply, as they are facing negative net returns.
Compared with the results derived under the constant balance sheet assumption, banks’ average capital depletion in the adverse scenario is found to be higher in the macroprudential approach. When comparing adverse system-wide CET1 capital levels in 2020 against the end-2017 starting points, the macroprudential stress test reveals capital depletion €35 billion higher than in the analogous constant balance sheet exercise. However, because of banks’ deleveraging, CET1 ratios are on average higher in the macroprudential stress test as well.
In addition to the original adverse scenario, the article introduces an augmented adverse scenario including a “credit crunch”. A credit crunch could result in additional strain on the macro economy, and the final severity of the subsequent recession could be significantly amplified compared with a counterfactual situation in which the same set of initial shocks would have hit a more resilient, e.g. a better capitalised, banking system. Against this background, the original adverse scenario could be considered as a lower bound for the severity of the subsequent recession, while the augmented adverse scenario would constitute an upper bound. Results for the adverse scenario, including an additional feedback mechanism, show a considerable amplification. In aggregate figures, GDP drops by an additional 1.6% at a euro area level. In the cross-country perspective, the amplification mechanism is more pronounced for those countries that already show relatively low capitalisation of their banking systems at the beginning of the scenario horizon.
This article is an abridged version of Budnik, K., Balatti Mozzanica, M., Covi, G., Dimitrov, I., Groß, J., Hansen, I., Kleemann, M., Reichenbachas, T., Sanna, F., Sarychev, A., Siņenko, N. and Volk, M., “Macroprudential stress test of the euro area banking system”, Occasional Paper Series, ECB, forthcoming.
In his 2015 speech V. Constancio contrasts the scope of macroprudential stress testing and that of supervisory stress test exercises along four dimensions: (i) constant versus dynamic balance sheet perspective, and accounting for (ii) banks reactions, (iii) two-way interactions between liquidity, (iv) the interactions between banks and other sectors of the economy.
In 2016 a Macroprudential Bulletin article summarised the results of the so-called “macroprudential extension” of the EU-wide stress-test (Issue 2/2016). Though the methodologies illustrated in that article differ from the approach presented here, their ambition is similar: to complement the EBA stress test results with the evaluation of the impact of banks’ endogenous behaviour and second-round effects on their own solvency and on the real economy. The models underlying the “macroprudential extension” in 2016 were later summarised in an e-book (Dees, S., Henry, J. and M. Reiner, “Stamp€: Stress-Test Analytics for Macroprudential Purposes in the Euro Area”, 2017).
For a description of the model, see Budnik, K., Balatti Mozzanica, M., Dimitrov, I., Groß, J., Kleemann, M., Reichenbachas, T., Sanna, F., Sarychev, A., Siņenko, N. and Volk, M., “Banking Euro Area Stress Test Model”, Occasional Paper Series, ECB, forthcoming.