


Trade flows with Russia since the start of its invasion of Ukraine
Published as part of the ECB Economic Bulletin, Issue 5/2022.
War-related disruptions to the production and trade of energy and agri-food commodities have raised concerns about global energy and food supply security. Russia is a top exporter of energy commodities and, like Ukraine, also a key global exporter of agricultural commodities. This box first takes stock of recent developments in the trade flows from war-affected areas since the onset of the conflict. Flows of energy and agri-food commodities are tracked using marine freight data and gas flow data, which provide a timelier assessment of recent developments than customs trade data. [1] The box then examines the evolution of Russia’s imports since the start of the war. However, as Russia stopped releasing official customs trade data as of end-February 2022, the box looks at customs data on the exports of a selection of Russia’s trading partners in order to approximate Russia’s imports. Finally, these data are used to provide a preliminary empirical assessment of the effects of sanctions on Russia´s trade flows.
The quantity of Russia’s marine oil exports has recovered to close to pre-invasion levels amid historically high discounts and some diversion of flows towards large Asian countries. Following Russia’s invasion of Ukraine, weekly oil shipments from Russia declined (-15%) at end-March 2022 compared with the previous year’s level, amid war-related disruptions and the voluntary withdrawal of some energy companies and shipping merchants. This decline was especially pronounced for the United States (-60%) and the European Union (-35%). The price of Russian oil (Ural grade) fell at the start of the war and is currently selling at a steep discount vis-à-vis Brent (-30%) (Chart A). As a result, and amid some volatility, in the first week of July oil flows stood close to their 2021 average level despite having fallen significantly in June. Russia’s share in total oil imports by China and India increased to 11% and 14% respectively at end-June, up from 6% and 2% before the war. By contrast, seaborne exports to the United States and the United Kingdom dried up shortly after the start of the war, as both countries banned oil imports from Russia, while the EU scaled back oil imports and is sourcing more oil from the Americas and Africa (Chart B). [2]
Chart A
Russian marine oil export volumes and prices relative to Brent oil
(left-hand scale: millions of barrels per week; right-hand scale: USD difference)

Sources: Refinitiv and ECB staff calculations.
Notes: The latest weekly observations are for 15 July 2022. Marine oil includes crude and fuel oil.
Chart B
Seaborne oil imports by source
(millions of barrels per week)
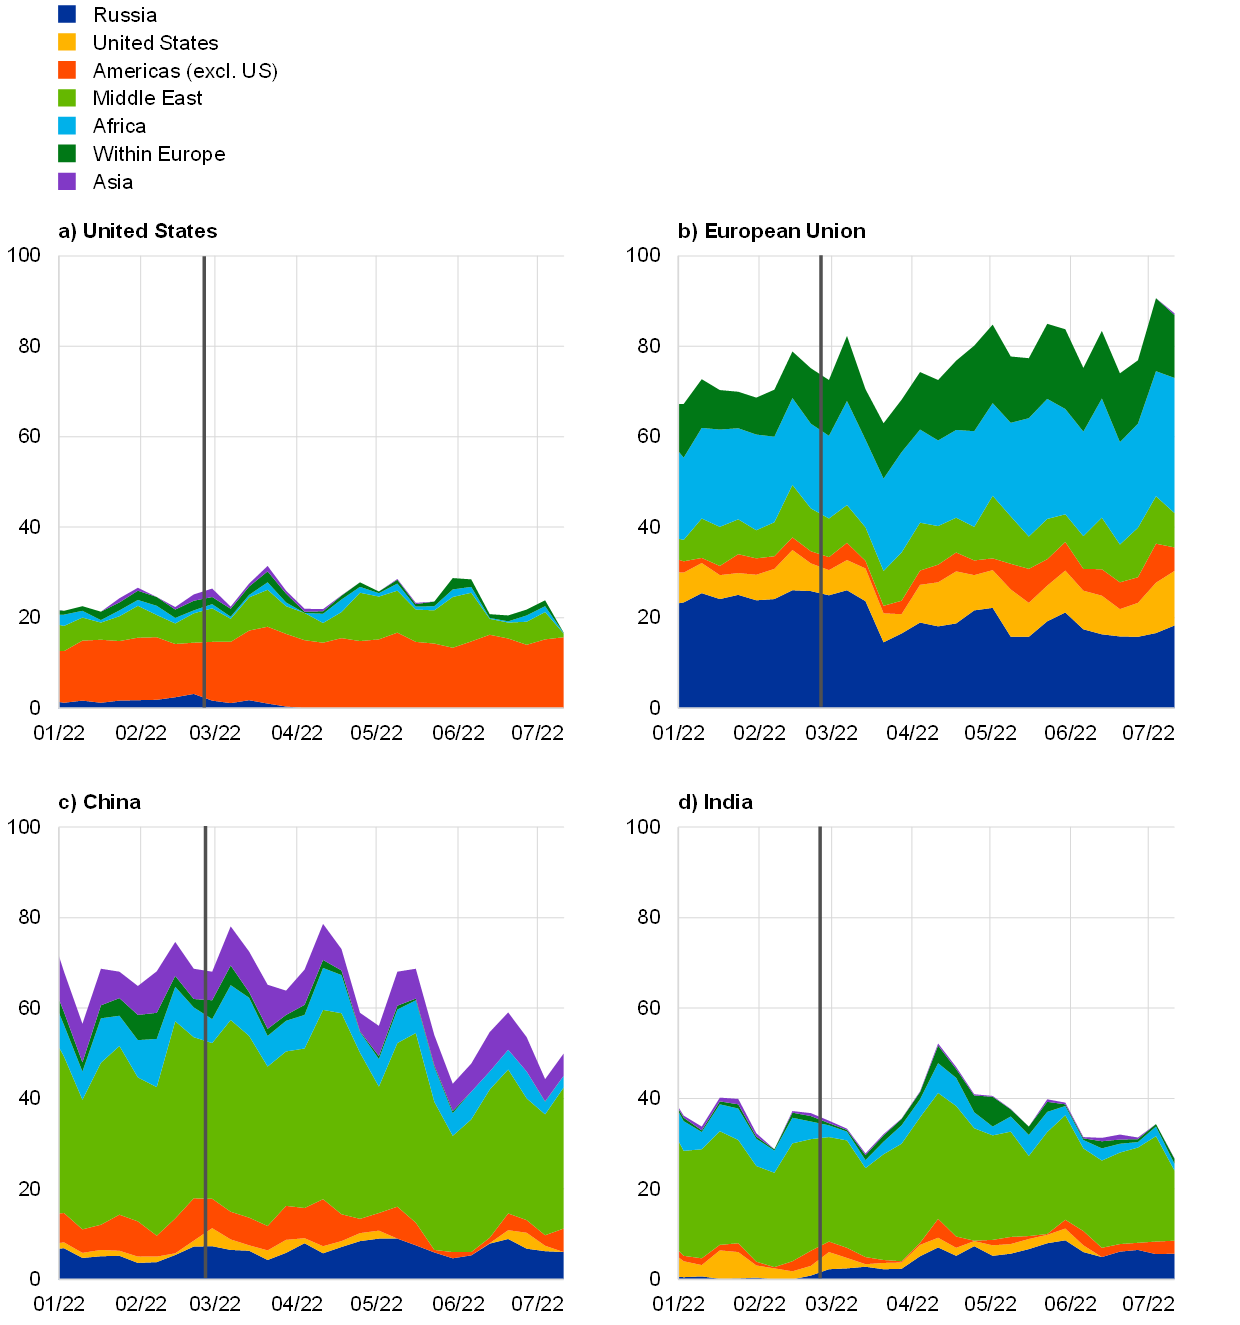
Sources: Refinitiv and ECB staff calculations.
Notes: The latest observations are for the week of 15 July 2022. For the EU, Europe includes intra-EU imports but excludes domestic flows. In all of the charts Europe refers to geographical Europe, excluding Russia. Marine oil includes crude and fuel oil.
Russian gas exports to the EU were also significantly reduced, standing at 35% of their previous year’s level in the last week of June 2022 (Chart C). At the turn of the year, Russian gas pipeline flows via central and eastern Europe dropped substantially amid the tensions with Ukraine. With the start of the war, they remained volatile until the recent complete termination of gas flows to Bulgaria, Denmark, Finland, Lithuania, the Netherlands and Poland and voluntary reductions by, or partial cut-offs towards, Austria, the Czech Republic, France, Germany, Italy and Slovakia. As a result, total EU gas imports from Russia in the final week of June decreased by 65% compared with last year. [3] Increasing imports of liquefied natural gas (LNG)[4] and non-Russian pipeline gas (Chart C) partially compensated for the shortfall, but risks for EU gas provision remain on the horizon[5] as the level of gas storage in the EU stood below the 2015-20 average in early July.[6] On the Russian side, gas is being diverted to Asian routes.
Chart C
Gas exports to the EU by source
(Million cubic metres per day)
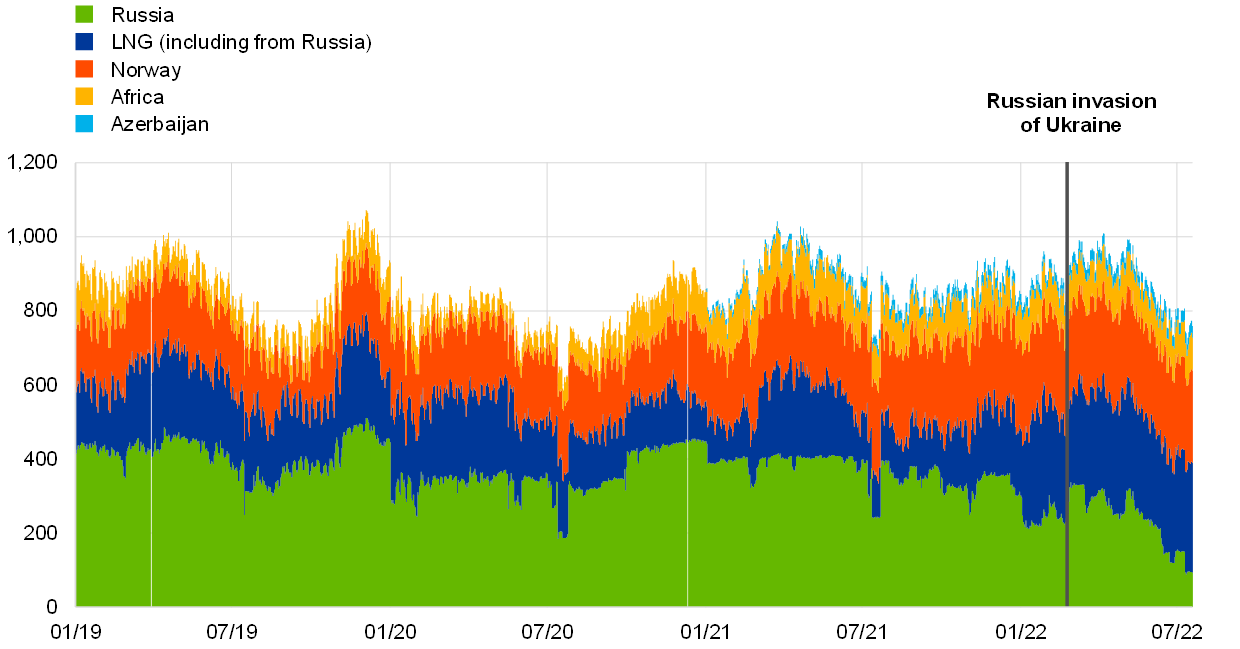
Sources: Bloomberg and ECB staff calculations.
Notes: The latest observations are for 19 July 2022. The period considered also includes a complete suspension of gas flows from Russia via Nord Stream 1 related to annual maintenance works from 14 July 2022.
Seaborne exports of agricultural commodities from Russia fell at the start of the invasion and those from Ukraine have come to a halt. Globally, Russia and Ukraine jointly accounted for 24% of wheat and 14% of maize exports in 2021.[7] Since the start of the war, Russia’s seaborne exports of wheat have experienced significant volatility, reflecting disruptions in transportation logistics, but also a counteracting move from Russia whereby its own exports of some agri-food commodities to former Soviet states in the Eurasian Economic Union were temporarily restricted in order to ensure the food security of the Russian Federation.[8] At the end of June, Russia’s weekly seaborne exports of wheat stood at 40% of the previous year’s level, amid a redirection of more shipments towards Egypt and Turkey. [9] Until recently, with the complete blockade of ports in the Black Sea, grain shipments from Ukraine had come to a halt, aggravating global food security concerns. However, to help ease this resulting global pressure, Ukraine and Russia have agreed to a set-up of safe passage for grain shipments from the Ukrainian ports that should significantly relieve the food security concerns of emerging market economies.[10]
Food security may be at risk in countries that are most dependent on Russian and Ukrainian food exports, given their limited ability to diversify suppliers in the short term. Available nominal customs trade data on global imports of agri-food products (fertilisers, soybean, maize and wheat) point to some heterogeneity across countries and regions in terms of their exposure to imports from Russia and Ukraine (Chart D). Emerging market economies, in particular countries in central Asia and Africa, are among the regions most dependent on Russia and Ukraine for their grain supply. Moreover, an index of export market diversification suggests that higher import exposure tends to be associated with a high concentration of exporters, meaning that the ability of these countries to find alternative suppliers might be limited in the short term.[11] The recently announced ban on wheat exports from India, the world’s second largest wheat producer, may further exacerbate the global food supply situation which is already curtailed by the war.[12] While the Indian ban does not affect euro area imports substantially, it contributes to an all-time high in global wheat prices.[13]
Chart D
Grain market concentration and import dependency
(y-axis: share of imports from Ukraine and Russia; x-axis: Herfindahl–Hirschman index, 2021)
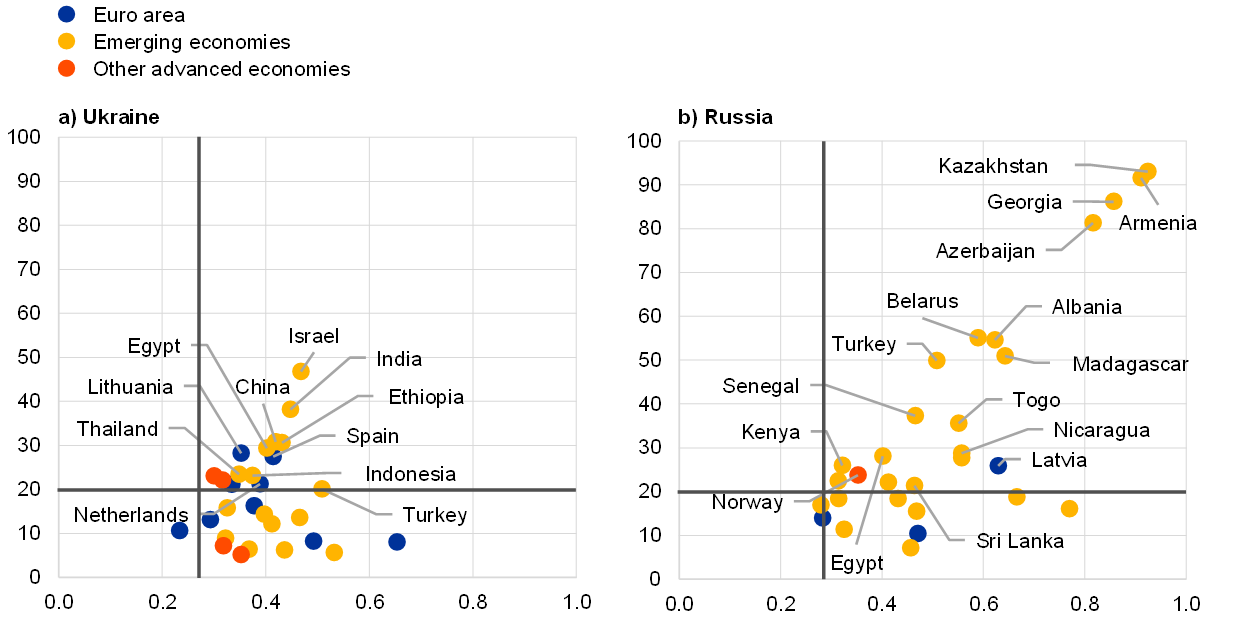
Sources: Trade Data Monitor and ECB staff calculations.
Notes: The Hirschman-Herfindahl index is a measure of the dispersion of trade value across an importer's partners. A country whose imports are concentrated in very few markets will have an index value close to 1. Similarly, a country with a perfectly diversified trade portfolio will have an index close to zero. A minimum threshold of 5% import dependency on Russia has been applied. The region to the right of the vertical line and above the horizontal line can be considered to reflect a high overall concentration of import partners and high dependence on Russia or Ukraine for imports.
Overall, Russia’s merchandise imports have significantly dropped since the start of the war, especially from sanctioning countries. Customs data show that exports to Russia have fallen significantly compared with 2021 levels, as Russia’s trade has been disrupted owing to the adverse macroeconomic and transport-related consequences of the war (Chart E, panel a). The contraction is especially pronounced for the countries imposing sanctions (-85% for the United States and ‑45% for the euro area compared with the 2021 level as of May 2022), though exports from non-sanctioning countries also remain below their 2021 level (e.g. -23% in the case of China).
Chart E
Exports to Russia
(panel a): index, 2021 = 100; panel b): euro area year-on-year percentage change in values)
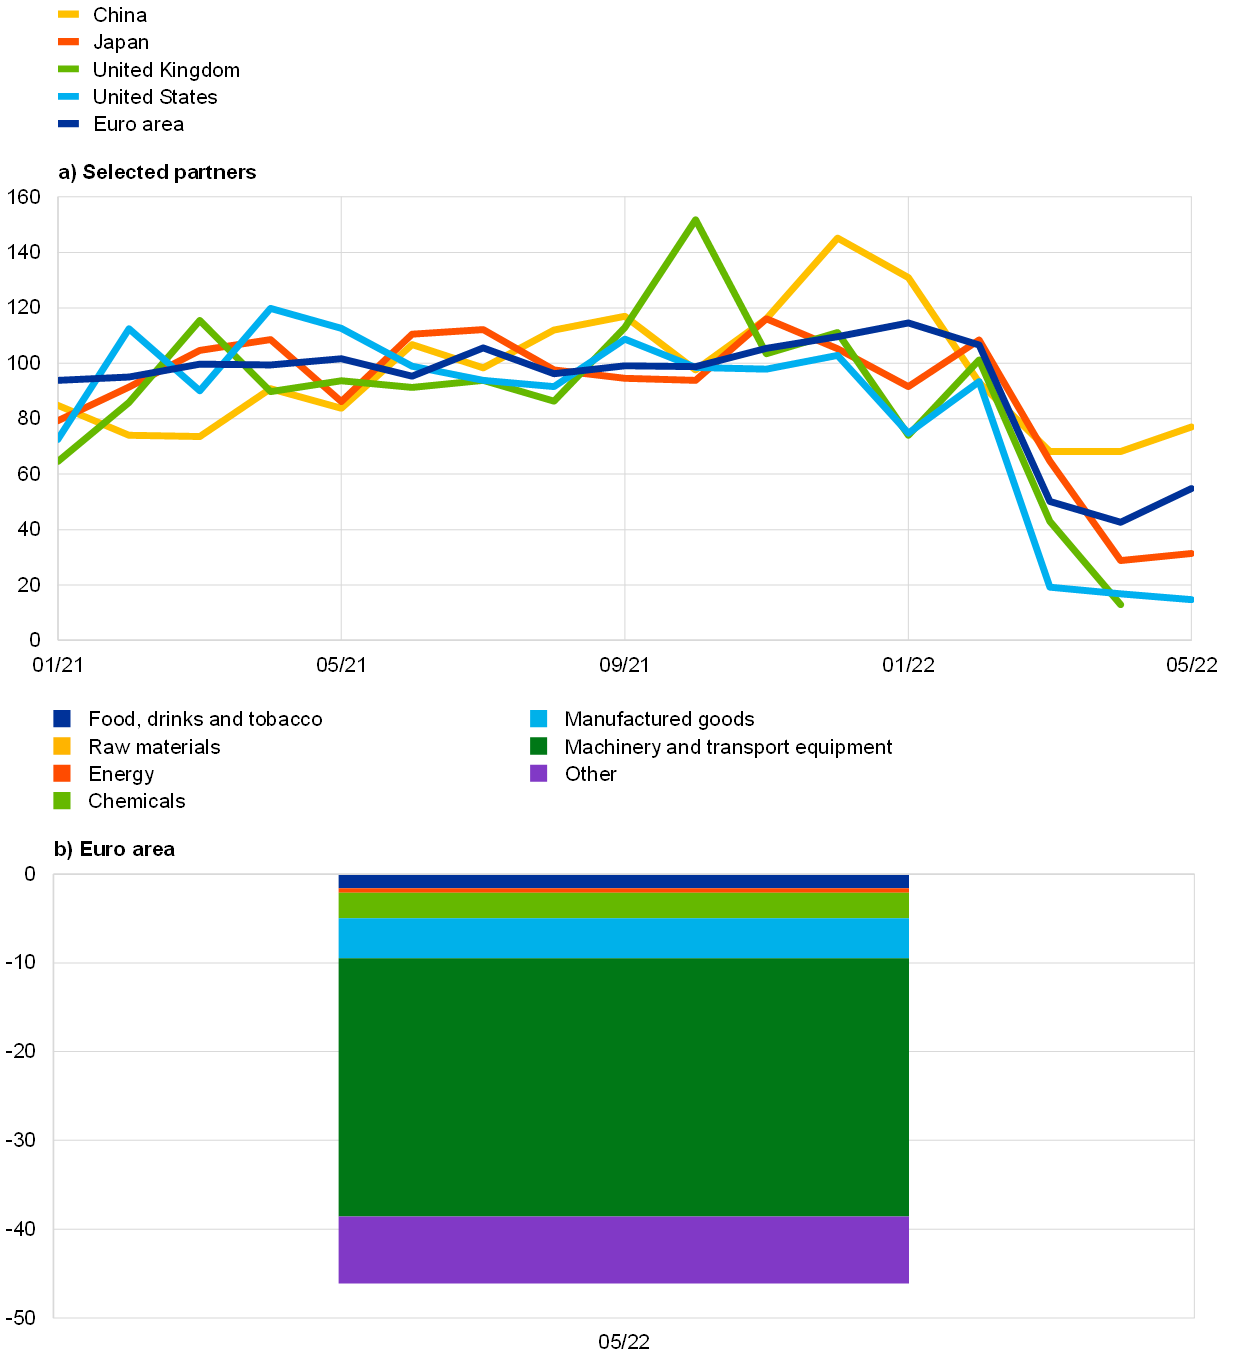
Sources: Trade Data Monitor, Eurostat and ECB staff calculations.
Notes: The latest observations in panel a) are for May 2022 (China, Japan, United States, and the euro area) and April 2022 (United Kingdom). Panel b) shows euro area exports to Russia by sector.
For the euro area, exports to Russia of goods subject to sanctions (e.g. machinery and transport equipment) are driving the overall exports contraction. Since the Russian invasion of Ukraine, the EU has issued six packages of sanctions against Russia including sanctions on individuals and restrictions on media, transport and financial sectors, and trade.[14] Initial trade measures targeted military-related goods and products that serve Russia’s military, transport and technological enhancement. More recent restrictions focus on luxury goods (both imported and exported) and other imported goods that generate revenues for Russia, including coal and oil. Looking at euro area trade flows with Russia (Chart E, panel b), machinery and transport equipment account for most of the overall fall.
An empirical analysis suggests that the first round of sanctions in March 2022 reduced Russian imports by 15%, with sanctioned products bearing the brunt. An empirical analysis − using a difference-in-differences approach based on a sample of 59 Russian trading partner countries covering around 86% of total Russian imports in 2021 − confirms that in March 2022, compared with the previous month when sanctions were not in force, the Russian imports from sanctioning countries were 20 percentage points lower than those from non-sanctioning countries. A breakdown across selected product groups suggests that Russia’s access to goods relevant for producing military equipment, such as vehicles and machinery and mechanical appliances, was impeded significantly in relative terms (Chart F). Overall, this corresponds to a drop of about 15% in total Russian imports in March due to the first round of sanctions.
Chart F
Effect of sanctions on Russian imports
(difference in differences, percentage point effect on March 2022 vs February 2022)

Sources: Trade Data Monitor and ECB staff calculations.
Notes: The difference-in-differences is obtained by subtracting from the change in Russian imports from sanctioning countries between March and February 2022 the change in Russian imports from non-sanctioning countries. For exporting countries with limited data availability, export data is at Harmonised System 2-digit level. Non-sanctioning countries are Argentina, Brazil, China, Costa Rica, Hong Kong, Iceland, India, Indonesia, Israel, Kazakhstan, Malaysia, Mexico, Norway, Peru, Philippines, Singapore, South Africa, Thailand and Turkey. Sanctioning countries are Australia, Austria, Belgium, Brunei Darussalam, Bulgaria, Canada, Chile, Colombia, Croatia, Cyprus, Czech Republic, Denmark, Estonia, Finland, France, Germany, Greece, Hungary, Ireland, Italy, Japan, South Korea, Latvia, Lithuania, Luxembourg, Malta, Morocco, Netherlands, New Zealand, Poland, Portugal, Romania, Slovakia, Slovenia, Spain, Sweden, Switzerland, Taiwan, United Kingdom and United States. Selected sectors account for approximately 60% of total Russian imports.
Marine vessel movement data is collected through an automatic identification system which records and transmits vessel locations for tracking purposes and is provided by Refinitiv, whereas gas flow data is provided by Bloomberg.
Following the sixth package of EU sanctions, the ban of oil imports covering 90% of total EU imports from Russia (with a temporary exemption of pipeline flows) is foreseen to take full effect by end-2022. However, some major European energy companies have already suspended operations and purchases of oil and oil products in the aftermath of the invasion. The EU has also announced a new maritime service ban prohibiting EU companies form offering insurance and finance to vessels carrying Russian oil, making exports to third countries more difficult.
For the effects of the war on euro area energy markets see the box entitled “The impact of the war in Ukraine on euro area energy markets”, Economic Bulletin, Issue 4, ECB, 2022.
Marine freight data by Refinitiv show that Russian LNG shipments constitute about a fifth of extra-EU import volumes of LNG with the share remaining broadly unchanged after the conflict.
For a quantification of the effects of gas shortages, see Borin, A., Conteduca, F. P., Di Stefano, E., Gunnella, V., Mancini, M. and Panon, L., “Quantitative assessment of the economic impact of the trade disruptions following the Russian invasion of Ukraine”, Occasional Paper Series, Banca d’Italia, No 700, 2022.
See “European natural gas imports”, Bruegel, 20 July 2022.
Based on customs data provided by the Trade Data Monitor.
See “Russia temporarily bans grain exports to ex-Soviet countries”, Reuters, 14 March 2022 and “Russian Federation bans exports of wheat, maize and other cereals to Armenia, Kazakhstan and Kyrgyzstan until 30 June 2022”, Food Price Monitoring and Analysis, 15 March 2022.
However, favourable weather conditions for the current crop harvesting season are expected to lead to an increase in grain shipments.
See “Russia and Ukraine sign grain deal to avert global food crisis“ Financial Times, 22 July 2022.
The elevated price of fertilisers may threaten food security by affecting crop production in 2022 and 2023. Russian invasion of Ukraine has only exacerbated the already limited supply of fertilisers, whose prices started to rose already in 2021 amid high energy prices. See: “Impacts and Repercussions of Price Increases on the Global Fertilizer Market”, USDA Foreign Agricultural Service, 30 June 2022
See “India Bans Wheat Exports Due to Domestic Supply Concerns”, USDA Foreign Agricultural Service, 19 May 2022.
See the box entitled “The surge in euro area food inflation and the impact of the Russia-Ukraine war”, Economic Bulletin, Issue 4, ECB, 2022.
For further details see “EU restrictive measures against Russia over Ukraine (since 2014)”, European Council.