
Recent developments in oil prices
Published as part of the ECB Economic Bulletin, Issue 1/2019.
Against the background of large swings in oil prices in recent months, this box assesses the key drivers of oil market developments. While demand has been relatively stable, supply factors have been the main driving force behind recent oil price volatility.
The past few months have seen a marked turnaround in oil prices accompanied by a strong increase in implied price volatility. After rising since the summer of 2017 and peaking at USD 86 per barrel in early October 2018, the Brent crude oil price has undergone a marked correction, falling by around 40% by the end of 2018 (see Chart A). A similar correction occurred four years ago. Oil prices dropped sharply in 2014 after a period in which Brent crude had traded at around USD 110 per barrel for several years. And in January 2016 prices fell to below USD 30 per barrel. These periods of oil price collapse tend to be accompanied by a high degree of uncertainty. Based on United States Oil Fund options, the Oil Volatility Index (OVX) captures expectations regarding oil price volatility in the near future. In November, uncertainty in oil markets reached levels last seen during the sharp drop in oil prices at the turn of the year 2014/15 and at the beginning of 2016.
Chart A
Oil price
(left-hand scale: USD per barrel; right-hand scale: index)
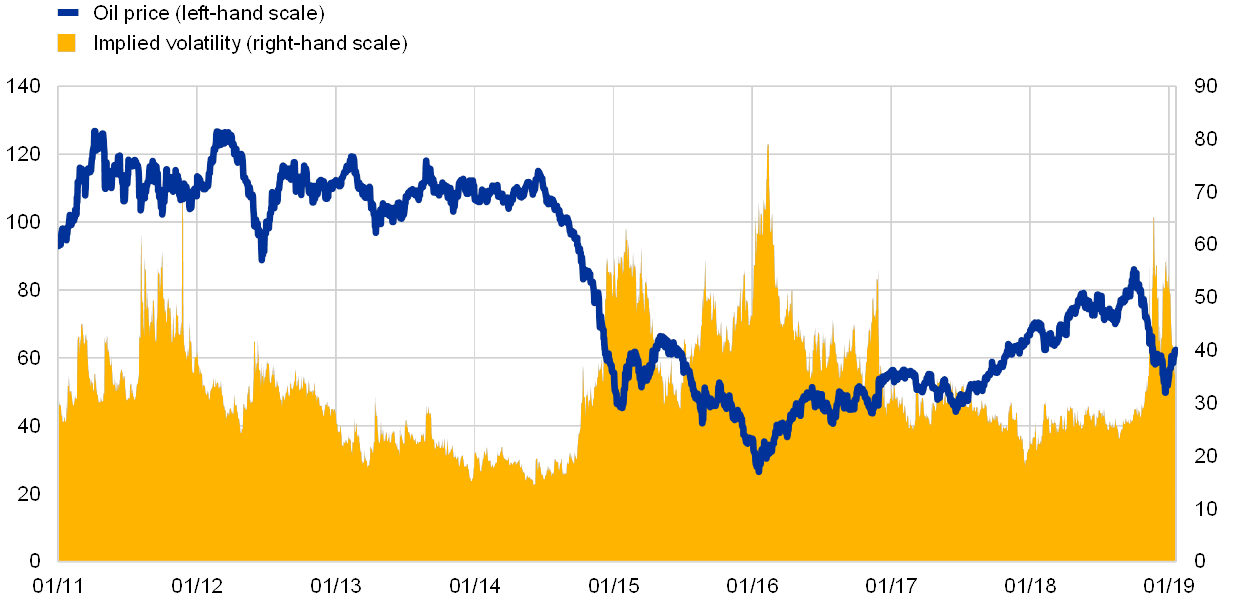
Sources: Bloomberg and Haver Analytics.
Notes: The Chicago Board Options Exchange (CBOE) Crude Oil ETF Volatility Index (OVX) measures the market's expectation of 30‑day volatility of crude oil prices by applying the VIX methodology to United States Oil Fund options spanning a wide range of strike prices. The latest observation is for 21 January 2019.
Shifts in sources of oil supply have been an important driver of oil prices following the advent of US shale oil. Since 2011 US shale oil production capacity has expanded greatly, allowing the United States to compete with two of the world’s largest oil producers, Russia and Saudi Arabia, in terms of daily extraction volumes.[1] Advances in extraction technology and investments in pipeline systems and rail capacity have allowed US producers to expand production, making the United States an important factor in global oil supply. Its share in aggregate supply increased significantly between 2011 and the summer of 2014 (see Chart B). In late 2014 members of the Organization of the Petroleum Exporting Countries (OPEC) appeared to change their strategy, abandoning production quotas in an attempt to regain market share and, according to some market analysts, crowd out US supply by driving oil prices below levels at which US shale oil producers could be profitable.[2] OPEC’s actions led only to a short-lived curtailing of shale oil production. In late 2016 it had to reconsider its approach as global demand worries led to further declines in oil prices. In addition, OPEC’s strategy had put strains on the public finances of its members and fiscal sustainability indicators deteriorated sharply between 2014 and 2016 for most OPEC countries.[3] Once oil prices started to increase again in 2017, US producers quickly regained market shares.[4]
Chart B
Market shares of oil producers
(percentages)
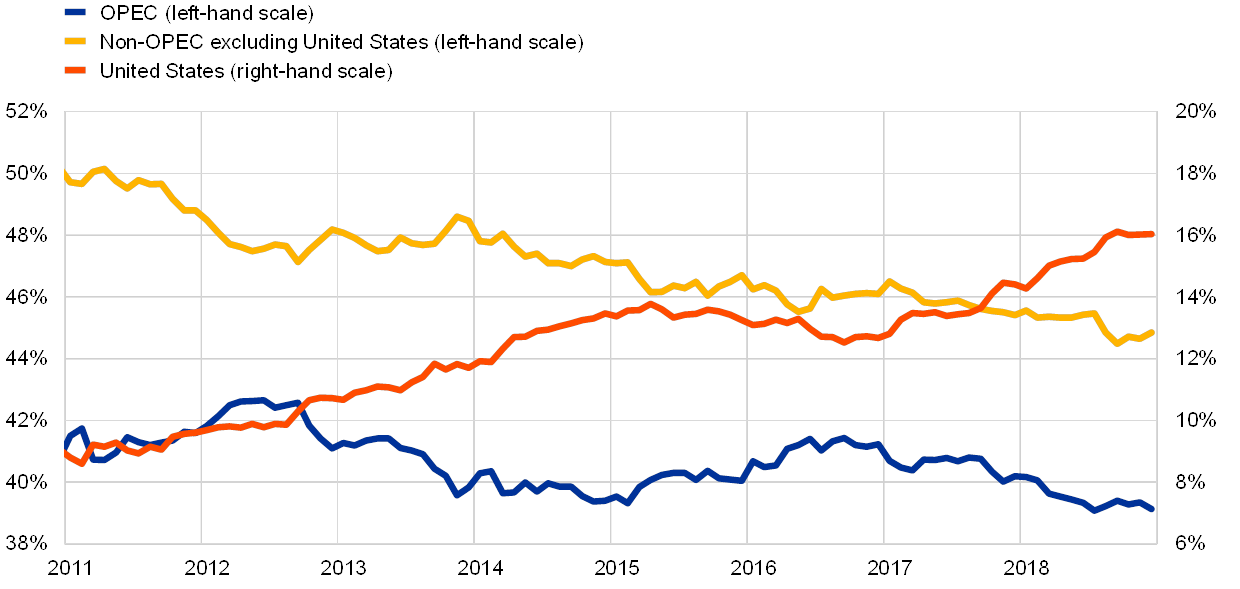
Sources: International Energy Agency and ECB staff calculations.
Note: The latest observation is for December 2018.
The most recent swings in oil prices towards the end of 2018 were also driven by significant shifts in the market’s assessment of oil supply prospects. Despite increasing US production, oil prices rose during the first three quarters of 2018 as market participants focused on falling production in Venezuela and the prospect of lower Iranian exports after the US withdrawal from the 2015 Iran nuclear agreement. In May 2018 the United States announced that it would reimpose sanctions on Iranian oil exports, starting from November 2018. By October 2018 Iranian oil exports had already decreased by about 0.35 million barrels per day.[5] At the same time, the market had been concerned about whether OPEC would react by increasing production to compensate for the loss of Iranian production in global markets. Starting in early October, however, there was a marked correction in prices. Saudi Arabia and Russia provided reassurances that they would indeed increase production if needed after the implementation of the sanctions. Further downward pressure came from the US Government’s decision to grant six-month waivers for imports of oil to key customers of Iran. Together with major non-OPEC producers, OPEC agreed on production cuts in early December 2018. However, the proposed cuts were at the lower end of what markets considered necessary to have a lasting impact on prices, while there were also doubts about the extent to which members would comply with the production cuts.[6] Consequently, the decline in oil prices did not halt until the beginning of 2019 after initial indicators for December pointed to a significant drop in OPEC production.
Growth in aggregate demand for oil has been more stable over recent years, but is expected to decline in 2019. Over the past decade, energy consumption in non-OECD countries, particularly in China, has been the main driver of global oil demand (see Chart C). However, rising demand in emerging and developing economies was balanced by slowing demand in OECD countries. More recently, with economic expansion having slowed somewhat in emerging and developing economies, there has been a degree of convergence in oil demand growth in OECD and non-OECD countries. With global economic activity expected to moderate somewhat during 2019, forecasts for oil demand growth have been revised downwards by the International Energy Agency in recent months. This has put additional pressure on prices, particularly in the second half of December, amid a broad-based correction in global financial markets.
Chart C
Oil demand
(annual percentage changes, quarterly data)

Sources: International Energy Agency and ECB staff calculations.
Note: The latest observation is for the fourth quarter of 2018.
Although diminished, the role of OPEC and the other major producers that cooperate with OPEC remains an important factor in oil price dynamics. Large conventional “swing producers” like Saudi Arabia still play an important role. For example, it is still only OPEC countries that have sufficient spare capacity to increase production in response to sudden peaks in demand.[7] Nonetheless, OPEC’s strategy of lowering oil prices in 2014 and 2015 did not succeed in permanently crowding out US shale oil production, suggesting that, over longer horizons, OPEC’s ability to stabilise prices around desired levels has diminished. While conventional extraction methods are usually less costly than shale oil production, most traditional oil-exporting countries need higher oil prices to balance their public-sector budgets.[8] However, the shale revolution has helped to limit upward pressures on oil prices, as US production tends to increase once prices rise above break-even levels. According to an energy survey conducted by the Federal Reserve Bank of Dallas, operating existing wells can be profitable in a price range of USD 25‑35 per barrel. For the exploitation of new wells, however, producers need prices to be somewhat higher (see Chart D).
Overall, the shale revolution has change the structure of the oil market. OPEC strategies now need to take into account the endogenous reaction of shale oil producers. Competition from shale oil may reduce the power of traditional oil producers to drive up prices beyond a given level over long horizons. At the same time, the process of OPEC adapting its strategies to the new source of competition has introduced some volatility in oil prices in recent years, including during the second half of 2018.
Chart D
Break-even oil price for US producers
(USD per barrel)

Source: Dallas Fed Energy Survey.
Notes: Average prices necessary to cover operating expenses for new and existing wells across regions. The reference price is the West Texas Intermediate (WTI) oil price, which trades on average 10% below the Brent crude oil price. The data are based on a survey conducted in the period 14‑22 March 2018.
- For further reflections on US shale oil production, see the article entitled “The oil market in the age of shale oil”, Economic Bulletin, Issue 8, ECB, 2017.
- For an economic interpretation of OPEC’s strategic actions, see, for example, Behar, A. and Ritz, R.A., “An analysis of OPEC’s strategic actions, US shale growth and the 2014 oil price crash”, IMF Working Papers, No 16/131, July 2016.
- See, for example, Kose, M.A., Kurlat, S., Ohnsorge, F. and Sugawara, N, “A Cross-Country Database of Fiscal Space”, Policy Research Working Paper, No 8157, World Bank, August 2017.
- In late 2018 the United States even became a net oil exporter for the first time in its history, taking into account all imports and exports of crude and refined products.
- This is less severe than in 2012 when sanctions caused Iran’s oil exports to fall by around 1 million barrels per day.
- The unity among OPEC members was further challenged by Qatar’s decision to withdraw from OPEC. Qatar, which until then had been the 11th largest oil producer in OPEC, intends to focus more on its natural gas production and no longer wants to be bound by OPEC agreements.
- The spare capacity of OPEC is estimated at between 1 million and 2 million barrels per day, i.e. it should be able to increase production by this amount within 30 to 90 days. The United State’s ability to increase supply significantly at short notice is still limited. To increase production by 0.5 million barrels per day, US producers would need six months to step up drilling activities. See Newell, R.G. and Prest, B.C., “Is the US the New Swing Producer? The Price-Responsiveness of Tight Oil”, RFF Working Paper, No 17‑15, Resources for the Future, June 2017.
- See the Statistical Appendix to the Regional Economic Outlook: Middle East and Central Asia, IMF, November 2018.