
- PRESS RELEASE
- 28 January 2020
Euro area economic and financial developments by institutional sector: third quarter of 2019
- Euro area net saving increased to €847 billion in the four quarters to the third quarter of 2019, compared with €823 billion in the four quarters to the previous quarter. Euro area net non-financial investment decreased slightly to €582 billion (from €585 billion previously), due to decreased investment by non-financial corporations, which was partly offset by increased investment by households and other sectors. Euro area net lending to the rest of the world increased to €277 billion (from €251 billion previously) in line with the higher net saving and lower net non-financial investment.
- The household debt-to-income ratio[1] stood broadly unchanged, at 93.6% in the third quarter of 2019 compared with the third quarter of 2018. Non-financial corporations' debt-to-GDP ratio (consolidated measure) increased to 78.2% in the third quarter of 2019, from 77.5% in the third quarter of 2018; the non-consolidated wider measure increased to 140.6% of GDP, from 140.4% (see Chart 2).
Total euro area economy
Euro area net saving increased to €847 billion (8.8% of euro area net disposable income) in the four quarters to the third quarter of 2019 compared with €823 billion in the four quarters to the previous quarter. Euro area net non-financial investment decreased to €582 billion (6.1% of net disposable income), due to lower investment by non-financial corporations, which was partly offset by higher investment by households and other sectors.
Euro area net lending to the rest of the world increased to €277 billion (from €251 billion previously), reflecting increased net saving and decreased net non-financial investment. Net borrowing by non-financial corporations decreased to €-44 billion (-0.5% of net disposable income) from €-56 billion, while net lending of financial corporations increased to €123 billion (1.3% of net disposable income) from €116 billion. Net lending by households increased to €286 billion (3.0% of net disposable income) from €274 billion. The increase in net lending by the total private sector was accompanied by a broadly stable net borrowing by the government sector (-0.9% of net disposable income).
Chart 1. Euro area saving, investment and net lending to the rest of the world
(EUR billions, four-quarter sums) * Net saving minus net capital transfers to the rest of the world (equals change in net worth due to transactions).
Households
The annual growth of household financial investment stood at an unchanged rate of 2.4% in the third quarter of 2019. This resulted mainly from slight increases in investment in currency and deposits as well as life insurance and pension schemes, which were compensated by increased net sales of debt securities and lower increases in investment in other financial assets.
Households were overall net buyers of listed shares in the four quarters to the third quarter of 2019. By issuing sector, they were net buyers of listed shares of MFIs and other financial institutions, as well as listed shares issued by non-euro area residents, while they were net sellers of listed shares of non-financial corporations. Households sold (in net terms) debt securities, in particular those issued by MFIs, other financial institutions and general government (see Table 1 below and Table 2.2. in the Annex).
The household debt-to-income ratio[2] stayed unchanged at 93.6% in the third quarter of 2019 as compared to the third quarter of 2018, as disposable income grew at broadly the same pace as the outstanding amount of loans to households. Similarly, the household debt-to-GDP ratio was broadly unchanged at 57.9% (see Chart 2).
Table 1. Financial investments and financing of households, main items
(annual growth rates)
Financial transactions |
|||||
2018 Q3 |
2018 Q4 |
2019 Q1 |
2019 Q2 |
2019 Q3 |
|
Financial investment* |
2.1 |
2.1 |
2.2 |
2.4 |
2.4 |
Currency and deposits |
3.7 |
4.1 |
4.8 |
4.9 |
5.3 |
Debt securities |
-6.0 |
-3.1 |
1.2 |
-2.1 |
-7.2 |
Shares and other equity |
0.5 |
0.3 |
-0.4 |
0.0 |
0.1 |
Life insurance and pension schemes |
2.4 |
2.0 |
2.1 |
2.3 |
2.5 |
Financing** |
2.9 |
3.2 |
3.5 |
3.5 |
3.9 |
Loans |
3.1 |
3.2 |
3.3 |
3.3 |
3.5 |
* Items not shown include: loans granted, prepayments of insurance premiums and reserves for outstanding claims and other accounts receivable.
** Items not shown include: financial derivatives net liabilities, pension schemes and other accounts payable.
Chart 2. Debt ratios of households and non-financial corporations
(debt as a percentage of GDP) * Outstanding amount of loans, debt securities, trade credits and pension scheme liabilities. ** Outstanding amount of loans and debt securities, excluding debt positions between non-financial corporations.*** Outstanding amount of loan liabilities.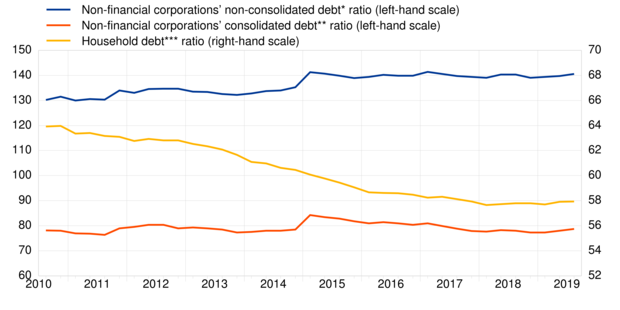
Non-financial corporations
In the third quarter of 2019 annual growth of financing of non-financial corporations stood at an unchanged rate of 1.5% compared with the previous quarter. This resulted from an acceleration in financing in the form of shares and other equity, debt securities and trade credits, which was offset by a slower growth in loans.
The annual growth rate of loan financing decreased to 1.6% (after 2.0%), reflecting a decrease in the growth rate of loans granted by MFIs and by non-financial corporations, partially offset by an increase in the growth rate of loans granted by non-MFI financial corporations (see Table 2 below and Table 3.2. in the Annex).
Non-financial corporations' debt-to-GDP ratio (consolidated measure) increased to 78.2% in the third quarter of 2019, from 77.5% in the third quarter of 2018; the non-consolidated wider measure increased to 140.6% of GDP, from 140.4% (see Chart 2).
Table 2. Financial investments and financing of non-financial corporations, main items
(annual growth rates)
Financial transactions |
|||||
2018 Q3 |
2018 Q4 |
2019 Q1 |
2019 Q2 |
2019 Q3 |
|
Financing* |
2.1 |
1.7 |
1.7 |
1.5 |
1.5 |
Debt securities |
5.4 |
4.2 |
4.2 |
4.6 |
5.2 |
Loans |
4.1 |
3.1 |
2.0 |
2.0 |
1.6 |
Shares and other equity |
0.6 |
0.2 |
0.5 |
0.5 |
0.7 |
Trade credits and advances |
6.1 |
4.3 |
4.9 |
2.7 |
2.8 |
Financial investment** |
3.2 |
2.3 |
2.3 |
1.8 |
2.0 |
Currency and deposits |
4.9 |
4.4 |
5.4 |
4.9 |
5.7 |
Debt securities |
-8.2 |
1.0 |
-2.2 |
-5.2 |
-0.5 |
Loans |
5.1 |
2.9 |
1.7 |
1.4 |
0.5 |
Shares and other equity |
1.7 |
1.4 |
1.6 |
1.6 |
1.7 |
* Items not shown include: pension schemes, other accounts payable, financial derivatives net liabilities and deposits.
** Items not shown include: other accounts receivable and prepayments of insurance premiums and reserves for outstanding claims.
Annexes
For media queries, please contact Philippe Rispal, tel.: +49 69 1344 5482.
Notes
- These data come from a second release of quarterly euro area sector accounts from the European Central Bank (ECB) and Eurostat, the statistical office of the European Union. This release incorporates revisions and completed data for all sectors compared with the first quarterly release on "Euro area households and non-financial corporations" of 14 January 2020.
- The debt-to-GDP (or debt-to-income) ratios are calculated as the outstanding amount of debt in the reference quarter divided by the sum of GDP (or income) in the four quarters to the reference quarter. The ratio of non-financial transactions (e.g. savings) as a percentage of income or GDP is calculated as sum of the four quarters to the reference quarter for both numerator and denominator.
- The annual growth rate of non-financial transactions and of outstanding assets and liabilities (stocks) is calculated as the percentage change between the value for a given quarter and that value recorded four quarters earlier. The annual growth rates used for financial transactions refer to the total value of transactions during the year in relation to the outstanding stock a year before.
- The next release of the Household Sector Report containing results for the euro area and all EU countries is scheduled for 7 February 2020.
- Hyperlinks in the main body of the press release lead to data that may change with subsequent releases as a result of revisions. Figures shown in annex tables are a snapshot of the data as at the time of the current release.
- [1]Calculated as loans divided by gross disposable income.
- [2]Calculated as loans divided by gross disposable income.
Európska centrálna banka
Generálne riaditeľstvo pre komunikáciu
- Sonnemannstrasse 20
- 60314 Frankfurt nad Mohanom, Nemecko
- +49 69 1344 7455
- media@ecb.europa.eu
Šírenie je dovolené len s uvedením zdroja.
Kontakty pre médiá