The analytical toolkit for the assessment of residential real estate vulnerabilities
Published as part of the Macroprudential Bulletin 19, October 2022.
Understanding the drivers for residential real estate (RRE) price developments, measuring house price overvaluation, monitoring trends in bank lending and borrowers’ creditworthiness is important for assessing RRE risks and informing policy responses. The ECB uses a comprehensive monitoring framework for regularly assessing RRE vulnerabilities comprising a series of core risk indicators complemented by a broad set of analytical tools. This article describes some of these tools to explain how they are employed in risk analysis.
1 Introduction
During real estate booms, vulnerabilities accumulate across different dimensions, calling for a holistic approach to effectively assess real estate risk. In housing booms, house prices and lending growth tend to be buoyant. Moreover, strong lending dynamics are often linked to overly loose credit underwriting standards (e.g. high loan-to-value (LTV) ratios). Ultimately, an unsustainable feedback loop between rising house prices and mortgage lending may emerge. A long-lasting boom[1] may therefore contribute to the accumulation of imbalances in the form of house price overvaluation and elevated household indebtedness. For risk monitoring to be effective, a comprehensive approach is required that covers all the relevant risk categories, encompassing, at the very least, real estate asset pricings, lending developments and conditions in the household sector.
The ECB regularly assesses vulnerabilities in the RRE markets based on a comprehensive risk analysis framework. The ECB regularly publishes its RRE vulnerability and risk assessments in its Financial Stability Review. It also regularly reviews its core real estate risk indicators which are grouped into three main categories, namely related to house prices, mortgage lending and household balance sheets. These core indicators are complemented by model-based analyses and an assessment of the structural features of RRE markets that might amplify or mitigate the risks. This article presents some of the tools and model-based analyses used and discusses the importance of the insights into RRE risks that are gained.[2]
2 Analytical tools for assessing price developments
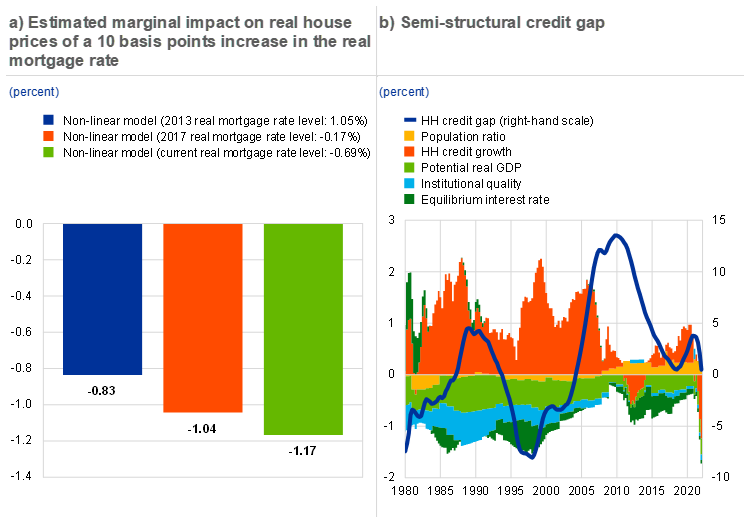
Understanding the drivers for RRE price developments and their persistence is important for assessing RRE risks and informing policy responses. Decomposing RRE price growth into various drivers like housing supply, housing demand, mortgage supply, income and monetary policy shocks is essential for an assessment of risks and policy responses in RRE markets. Understanding the key drivers of RRE price growth supports tailoring the policy response. For example, if strong house price dynamics seem to be driven by an increase in the supply of mortgage credit by banks, a macroprudential policy can be activated. Insight into the possible response of housing markets to different shocks is also important to shed light on the future vulnerability and risk trends. To gauge RRE market drivers and assess the possible RRE market response to changes in macro-financial conditions (e.g. tighter monetary policy), the ECB relies on a range of models, including an estimated Bayesian vector autoregression (VAR) model (Focus 1). The ECB also uses ad hoc models that contribute to a deeper understanding of certain aspects. One of them helps to assess the impact of interest rate changes on house prices. This model implies that changes in real interest rates have a larger effect on real house prices when interest rates are low, which is in line with asset pricing theory[3] (Chart 2, panel a).
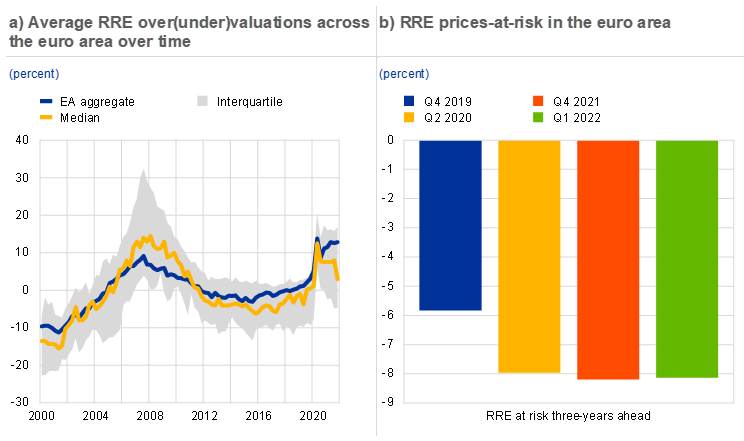
Measuring house price overvaluation is crucial to assess the potential risks and intensity of any price corrections. Price corrections may, in turn, translate into a higher loss given default for banks if loan collateral loses value. In addition, a price correction may affect consumption decisions, due to the decline in household wealth and confidence, and may have broader implications for credit supply, given that credit availability depends on the value of collateral. Finally, large price corrections may lead to defaults or to lower construction sector investment, given that a decline in RRE prices may render projects completed or planned uneconomical. In the light of these considerations, the ECB monitors closely potential overvaluation in RRE markets, employing a set of four measures: deviations from their long-term averages of the price-to-income ratio and of the price-to-rent ratio, and econometric valuation estimates using an inverted demand model and an asset pricing model (Chart 1, panel a[4]).[5] In addition, Focus 2 presents a new overvaluation model that takes housing market demand and supply into account to assess the state of house prices and housing investment relative to their long-term equilibrium.
Large and sudden downturns in RRE prices may threaten financial stability. The ECB therefore monitors the extent of downside risks to RRE prices. To do so, the ECB uses a so-called RRE price-at-risk model that brings together information derived from the valuation measures discussed above and other relevant indicators, such as the financial conditions, the level of cyclical systemic risk[6], the current RRE price growth, and consumer sentiment.[7] The key output of this model is a measure of RRE prices-at-risk, defined as the 5th percentile of the predicted RRE price growth; this provides an indication of how severe an RRE price decline could be in extreme cases (Chart 1, panel b). In the medium term (three years ahead), the key driver of downside RRE price risks is the degree of overvaluation, while at shorter horizons (one year ahead; not shown here) it is the combination of financial market conditions, economic sentiment and overvaluation that predicts RRE prices.
Chart 1
Overvaluation measures indicate the level of RRE price misalignment, and are used, together with other relevant indicators, to quantify the downside risks to RRE prices

Sources: ECB and ECB calculations.
Notes: Panel a) The overvaluation estimates are based on the average of two methods: an econometric model and house price-to-income ratio deviation from historical average. For details, see Box 3 – Tools for detecting a possible misalignment of residential property prices from fundamentals – in the June 2011 issue of the ECB Financial Stability Review, and/or Box 3 – A model-based valuation metric for residential property markets – in the November 2015 issue of the ECB Financial Stability Review. On the y-axis, a plus sign (+) indicates overvaluation and a minus sign (-) undervaluation. Panel b) Results from an RRE price-at-risk model based on a panel quantile regression on a sample of 19 euro area countries. Explanatory variables: lag of real house price growth, overvaluation (average of deviation of house price-to-income ratio from long-term average and econometric model), systemic risk indicator, consumer confidence indicator, financial market conditions indicator capturing stock price growth and volatility, government bond spread, slope of yield curve, euro area non-financial corporate bond spread, and an interaction of overvaluation and a financial conditions index. The dates were selected to capture the pre-COVID period (quarter 4, 2019), the peak COVID period (quarter 2, 2020), and the last two available predictions (quarter 4, 2021, and quarter 1, 2022).
3 Analytical tools for assessing mortgage lending dynamics and household balance sheet resilience
Analysis of household credit developments is of central importance, given that RRE booms pose greater financial stability risks if they are financed by credit. The standard indicators for monitoring potential credit excesses in RRE markets include the real mortgage credit growth rate and the household credit gap,[8] which have been found to contain useful early warning information for financial crises.[9] However, one of the challenges of such purely statistical indicators is that they cannot distinguish between “good” credit booms that are justified by changes in fundamental economic factors, and “bad” credit booms that reflect excesses. To complement the signals given by these statistical indicators, the ECB has developed a semi-structural household credit gap model that makes it possible to link observable household credit developments to changes in fundamental economic factors, such as potential GDP and the real interest rate, and thereby helps to identify periods when household credit growth is “excessive” (See Chart 2, panel b).[10] Taken together, statistical indicators and models based on economic structure provide a more robust picture of the financial stability risks stemming from household credit trends.
Chart 2
A dedicated model helps with assessing the interest rate sensitivity of RRE prices, and semi-structural credit gaps help with identifying when household credit growth is “excessive”

Sources: ECB and ECB calculations.
Notes: Panel b: Results based on the semi-structural unobserved components model set out in Lang and Welz (2018), “Semi-structural credit gap estimation”, ECB Working Paper Series, No 2194, European Central Bank, Frankfurt am Main, November . RHS stands for right-hand scale.
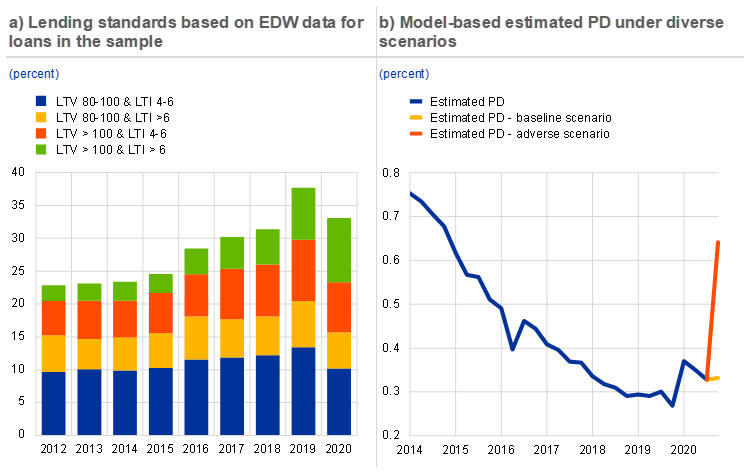
Monitoring lending standards (i.e. terms and conditions applying to new mortgage loans) is also important, given that strong credit developments are particularly concerning if they are coupled with a deteriorating risk profile of new loans. A key challenge is the fact that most of the indicators needed, such as loan-to-value and loan-to-income ratios, are not centrally collected and reported. The ECB therefore uses multiple data sources to monitor lending standards in euro area countries. First, national sources can be used, but different reporting criteria can reduce cross country comparability and some indicators can suffer from limited reporting. In the light of this, the European Systemic Risk Board has issued recommendations for closing real estate data gaps[11]. Second, the ECB uses European DataWarehouse (EDW)[12] data on securitised mortgage loans. Because the database provides loan-level information, highly granular monitoring is possible, including joint distributions of lending standards i.e. monitoring the variation in values over two or more indicators jointly (Chart 3, panel a). Finally, information from ad-hoc data collections is used, such as the collection of lending standards for new loans for the years 2016-2018 by ECB Banking Supervision from significant institutions under its direct supervision in 2019[13].
The ECB gauges households’ resilience to interest rate risk by conducting sensitivity analyses of debt service burdens. For this, the ECB uses a micro-simulation tool based on loan-level data for several euro area countries for assessing the sensitivity of loan-service-to-income (LSTI) ratios to changes in interest rates. The granularity of this data makes it possible to analyse in depth the factors impacting the strength of this sensitivity, also including the interactions between these factors. In addition, using micro data allows simulating the entire distribution of the changes in LSTIs if interest rates increase, allowing identification of possible pockets of vulnerabilities (see also Focus 3 for further details of the approach).
In addition to interest rate risk, households’ resilience to income shocks is assessed using a probability of default (PD) model. There are several alternatives for estimating PDs: one of them is using historical data of actual defaults and fitting a logistic regression. The ECB developed a pooled logistic regression model, based on loan level data and several macroeconomic indicators, to estimate one-year-ahead probabilities of default for mortgage loans. This model makes it possible to obtain out-of-sample PDs under baseline and adverse scenarios (Chart 3, panel b).
Chart 3
Monitoring lending standards at origination provides a measure of bank risk taking, and projecting household defaults helps in assessing risks in the household sector

Sources: EDW, ECB and ECB calculations.
Note: Based on data available for Belgium, Germany, Spain, France, Ireland, Italy, the Netherlands, and Portugal. These charts use information on securitised mortgage loans alone (potentially resulting in selection bias) and may not therefore be an accurate reflection of national mortgage markets. Panel a: total weighted by GDP.
Finally, country-specific institutional and structural features of housing markets may affect the severity of cyclical vulnerabilities identified. These key features include RRE market characteristics (home ownership rate, typical maturity, and the fixing of housing loans), rental market restrictions, fiscal policy and transaction costs. They may have both an amplifying and mitigating effect over the real estate cycle, and the effect often depends on interactions with other policies (e.g. monetary policy). Any increase in interest rates would, for instance, have an instantaneous and larger impact on debt service burdens for households in countries with a higher proportion of variable rate mortgages than in those where fixed rate mortgages prevail. While rising interest rates in countries with predominantly fixed rate mortgages will affect less the household debt service burden for existing borrowers, it will affect more bank profitability as funding rates might adjust faster than mortgage rates. In addition, supply-side characteristics (the price elasticity of new housing, regulation and spatial planning) and demand-side factors (demographics and changes in household structures) are also important for RRE markets. Consequently, the ECB takes these into account in assessing RRE markets, in addition to the results of the analytical tools presented above.
4 Conclusion
The complexity of RRE markets and the multiple channels through which unsustainable RRE market developments could threaten financial stability warrant the use of a suite of dedicated models. The ECB uses multiple tools covering several risk categories to get a broad understanding of the vulnerabilities stemming from RRE markets. Model-based approaches complement simpler indicator-based risk assessments and contribute to a deeper economic analysis. However, the intricacies of RRE markets mean that even the best analytical model can only be a simplification of the reality. The ECB is therefore mindful of the caveats and limitations of the models it uses and continuously refines its toolkit to reflect new best practices derived from other institutions and academic literature.
References
Alessi, Lucia and Detken, Carsten (2018), “Identifying excessive credit growth and leverage”, Journal of Financial Stability, Vol. 35, April, pp. 215-225.
Deghi, Andrea, Katagiri, Mitsuru, Shahid, Sohaib and Valckx, Nico (2020), “Predicting Downside Risks to House Prices and Macro-Financial Stability”, IMF Working Papers, International Monetary Fund, Washington, 17 January.
Dieckelmann, Daniel Hempel, Hannah, Jarmulska, Barbara, Lang, J. H. and Rusnák, Marek (2022), “House Prices and Ultra-low Interest Rates: Exploring the Nonlinear Nexus”, mimeo.
Drehmann, Mathias, Borio, Claudio, Gambacorta, Leonardo, Jimenez, Gabriel and Trucharte, Carlos (2010), “Countercyclical capital buffers: exploring options”, BIS Working Papers, No 317, Bank for International Settlements, Basel, 22 July.
European Systemic Risk Board (2019), “Methodologies for the assessment of real estate vulnerabilities and macroprudential policies: residential real estate”, Working Group on Real Estate Methodologies, Frankfurt am Main, September.
Jordà, Òscar., Schularick, Moritz and Taylor, Alan M. (2015), “Leveraged bubbles”, Journal of Monetary Economics, Vol. 76, Issue - Supplement, December, pp. S1-S20.
Lang, Jan Hannes., Izzo, Cosimo, Fahr, Stephan and Ruzicka, Josef (2019), “Anticipating the bust: a new cyclical systemic risk indicator to assess the likelihood and severity of financial crises”, Occasional paper series, No 219, ECB, Frankfurt am Main, February.
Lang, Jan Hannes, Pirovano, Mara, Rusnák, Marek and Schwarz, Claudia (2020), “Trends in residential real estate lending standards and implications for financial stability”, Financial Stability Review, Special features, Issue 1, ECB, Frankfurt am Main, May.
Lang, Jan Hannes and Welz, Peter (2018), “Semi-structural credit gap estimation”, ECB Working Paper Series, No 2194, ECB, Frankfurt am Main, November.
Lo Duca, Marco, Pirovano, Mara, Rusnák, Marek and Tereanu, Eugen (2019), “Macroprudential analysis of residential real estate markets”, Macroprudential Bulletin, Article no 7, ECB, Frankfurt am Main, 27 March.
As in Ireland up to 2007, and in Spain up to 2008.
For a description of the entire ECB and ESRB framework for assessing RRE vulnerabilities, see Lo Duca. et al. (2019) and ESRB (2019).
See Box 2 entitled “Drivers of rising house prices and the risk of reversal” in the May 2022 issue of the ECB Financial Stability Review and Dieckelmann. et al. (2022).
See the ECB Financial Stability Review for regular assessments.
For more details of the valuation measures, see Box 3 entitled “Tools for detecting a possible misalignment of residential property prices from fundamentals” in the June 2011 issue of the ECB Financial Stability Review, and Box 3 entitled “A model-based valuation metric for residential property markets” in the November 2015 issue of the ECB Financial Stability Review.
Captured by the ECB systemic risk indicator. For further details, see Lang et al. (2019).
More precisely, a panel quantile local projections model was estimated for various horizons based on a sample of 19 euro area countries over the from the first quarter of 1999- to the first quarter of 2022. For a similar approach used by the International Monetary Fund, see Deghi et al. (2020).
The household credit gap measures the deviation of the household credit-to-GDP ratio from its long-term statistical trend. As is the case in Basel III framework for the countercyclical capital buffer, household credit gaps are derived using a recursive Hodrick-Prescott filter with a smoothing parameter of 400,000.
See Lang and Welz (2018).
For ESRB Recommendations on closing real estate data gaps, see Recommendation of the European Systemic Risk Board of 31 October 2016 on closing real estate data gaps (ESRB/2016/14) (OJ C 31, 31.1.2017, p. 1) and Recommendation of the European Systemic Risk Board of 21 March 2019 amending Recommendation ESRB/2016/14 on closing real estate data gaps (ESRB/2019/3) (OJ C 271, 13.8.2019, p. 1).
The EDW is a statistical data warehouse set up as part of the ECB’s loan-level data initiative establishing information requirements for asset-backed securities (ABSs), including residential mortgage-backed securities (RMBSs). EDW contains loan-level data on the loans underlying such ABSs, including, in the case of RMBSs, RRE loans.
For more details, see Lang et al. (2020).


