
The ECB Survey of Professional Forecasters - First quarter of 2021
Summary
In the ECB Survey of Professional Forecasters (SPF) for the first quarter of 2021, respondents continued to cite the coronavirus (COVID-19) pandemic as the main factor affecting the overall macroeconomic outlook.[1] Shorter-term inflation expectations were largely unchanged at 0.9%, 1.3% and 1.5% for 2021, 2022 and 2023 respectively. Longer-term inflation expectations (for 2025) averaged 1.7%, confirming the signs of stabilisation reported in the previous round and possibly indications of a slight uptick. There were opposing revisions to the real GDP growth outlook. While the better than expected outcome in the third quarter of 2020 led to an upward revision (of 0.6 percentage points) for 2020 as a whole, the further wave of coronavirus infections and lockdowns at the end of the year resulted in a downward revision for 2021 (by 0.9 percentage points to 4.4%). However, in part owing to the roll-out of vaccines, respondents anticipated stronger growth in 2022 than they did in the previous round (3.7%, up by 1.1 percentage points). The level of real GDP is expected to exceed its 2019 level during 2022. While respondents continue to expect an increase in the unemployment rate in 2021 with a steady decline thereafter, they revised down their unemployment expectations for all horizons.
Table 1
Results of the SPF in comparison with other expectations and projections
(annual percentage changes, unless otherwise indicated)
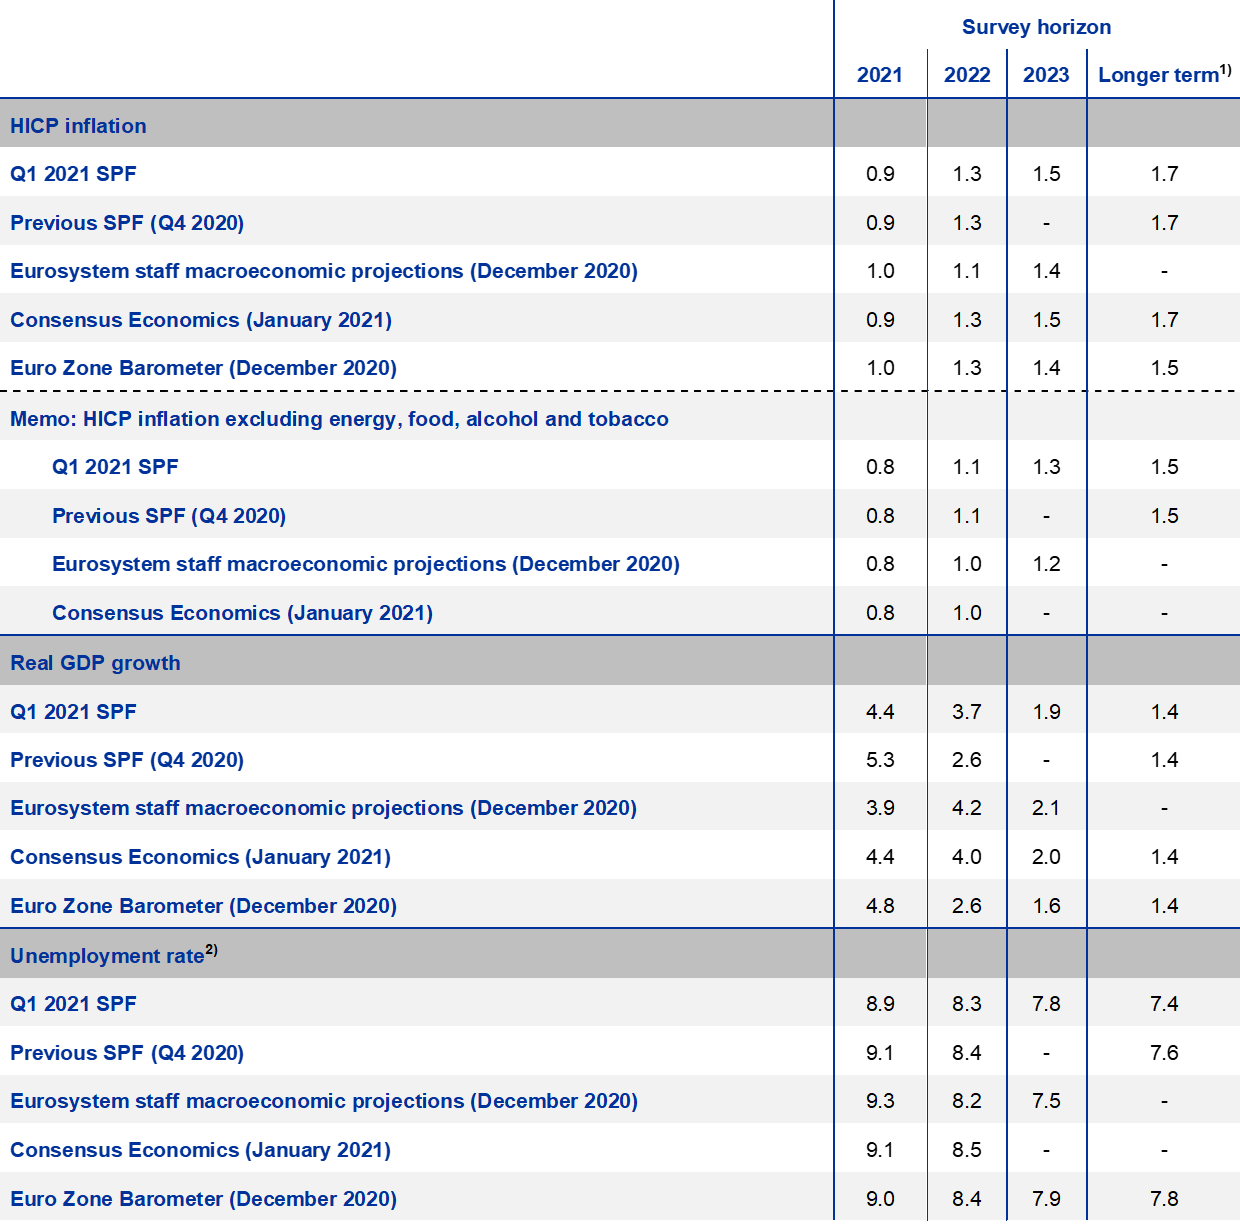
1) Longer-term expectations refer to 2025 in the SPF and the Consensus Economics survey and to 2024 in the Euro Zone Barometer. Euro Zone Barometer expectations for 2022-24 are from the October 2020 survey.
2) As a percentage of the labour force.
1 Shorter-term HICP inflation expectations largely unchanged
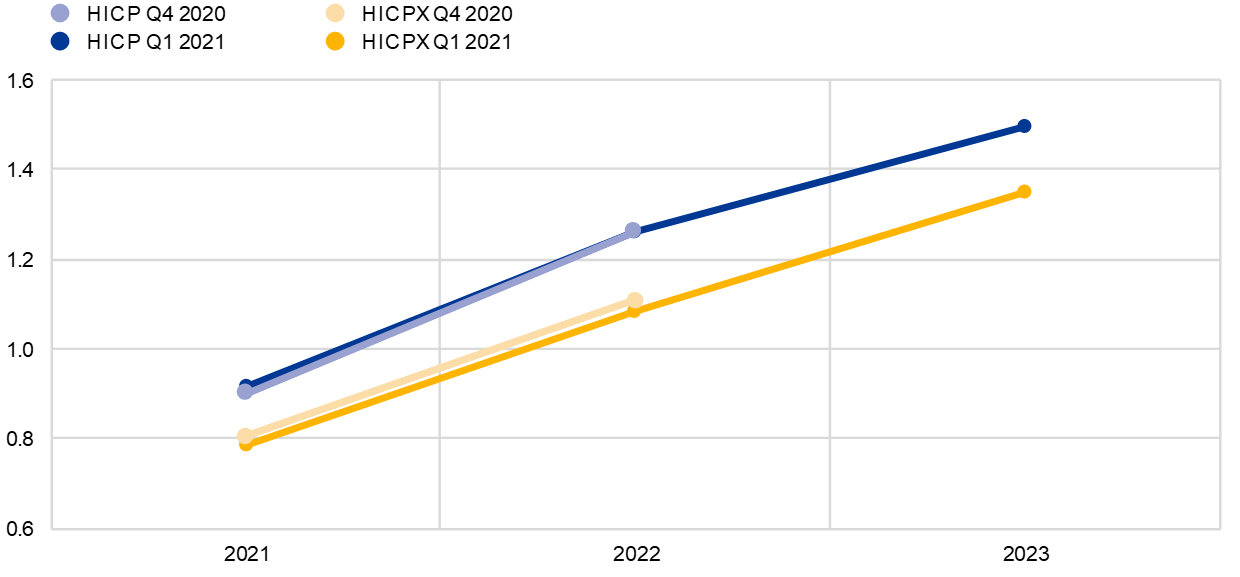
SPF respondents’ inflation expectations for the current and next calendar year were, on average, unchanged from the previous round (see Chart 1). Inflation expectations for 2021, 2022 and 2023 were 0.9%, 1.3% and 1.5% respectively. Expectations for 2023 were not surveyed in the previous round, i.e. in the fourth quarter of 2020. Compared with the December 2020 Eurosystem staff macroeconomic projections, SPF respondents’ inflation expectations were slightly lower for 2021 but slightly higher for 2022 and 2023 (see Table 1).
The impact of the coronavirus (COVID-19) pandemic was still the main factor cited in conjunction with the overall macroeconomic outlook, but oil price dynamics and reversal of the temporary VAT reduction in Germany were mentioned as supporting the expected pick-up in inflation in 2021. Respondents highlighted the further wave of coronavirus infections and associated lockdowns as factors holding back economic activity and consequently inflation. They believed that, on balance, the downward impact of weaker demand would outweigh any possible (upward) effects of supply-side restrictions. In addition, they considered that downward impacts were likely to be most visible on services prices (such as package holidays and restaurants) and specific consumer goods categories (such as clothing). On the other hand, the recent increases in oil prices (as well as upward base effects reflecting the “dropping-out” of past declines in oil prices from the year-on-year rates of change) were frequently referred to as key factors behind the expected pick-up in inflation in the near term. A number of respondents also noted the impact of the reversal, from January 2021, of the temporary VAT reduction in Germany as a factor supporting inflation in 2021. The stronger USD/EUR exchange rate was cited as exerting a dampening influence on shorter-term inflation forecasts.
SPF respondents continued to expect a gradual upward movement in inflation excluding energy, food, alcohol and tobacco (HICPX) (see Chart 1). Expectations for HICPX inflation were largely unchanged for both 2021 and 2022. In addition to the reversal of the temporary reduction in VAT in Germany, respondents expected the anticipated easing of coronavirus restrictions later in 2021 and the recovery in economic activity to support the pick-up in HICPX inflation. The profiles of HICP and HICPX inflation were largely similar over all horizons, although the expected rate of HICPX inflation was around 0.1-0.2 percentage points lower than that for HICP at each horizon. The SPF forecasts for HICPX inflation were in line with those in the December 2020 Eurosystem staff macroeconomic projections for 2021 and higher for 2022 and 2023.
Chart 1
Inflation expectations: overall HICP inflation and HICP inflation excluding energy, food, alcohol and tobacco
(annual percentage changes)
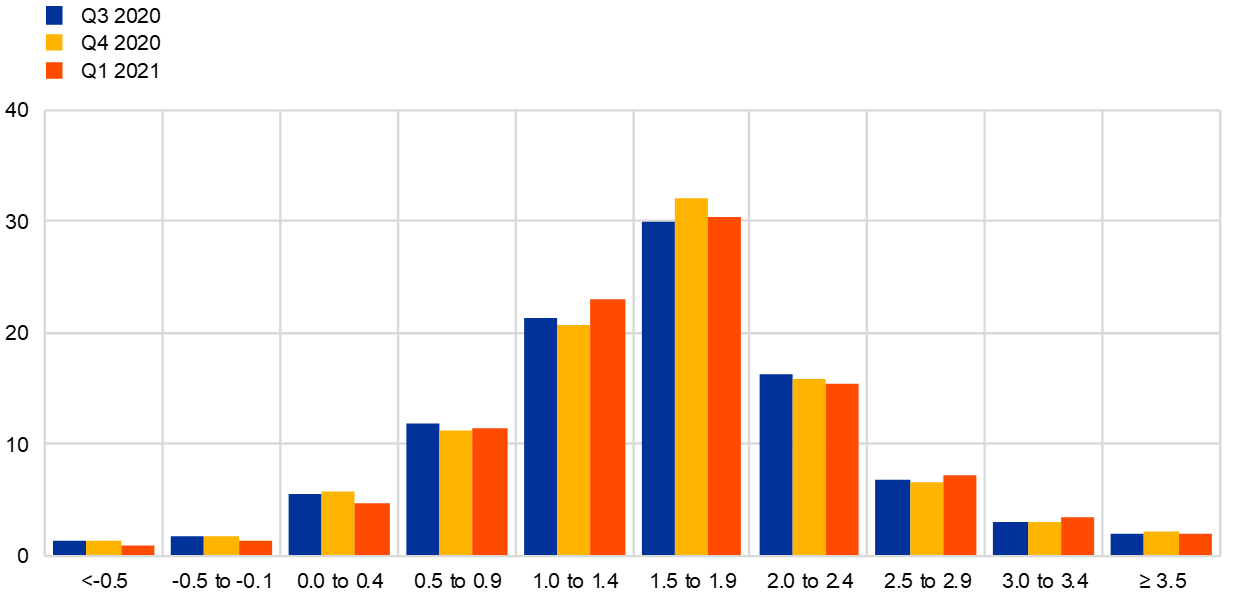
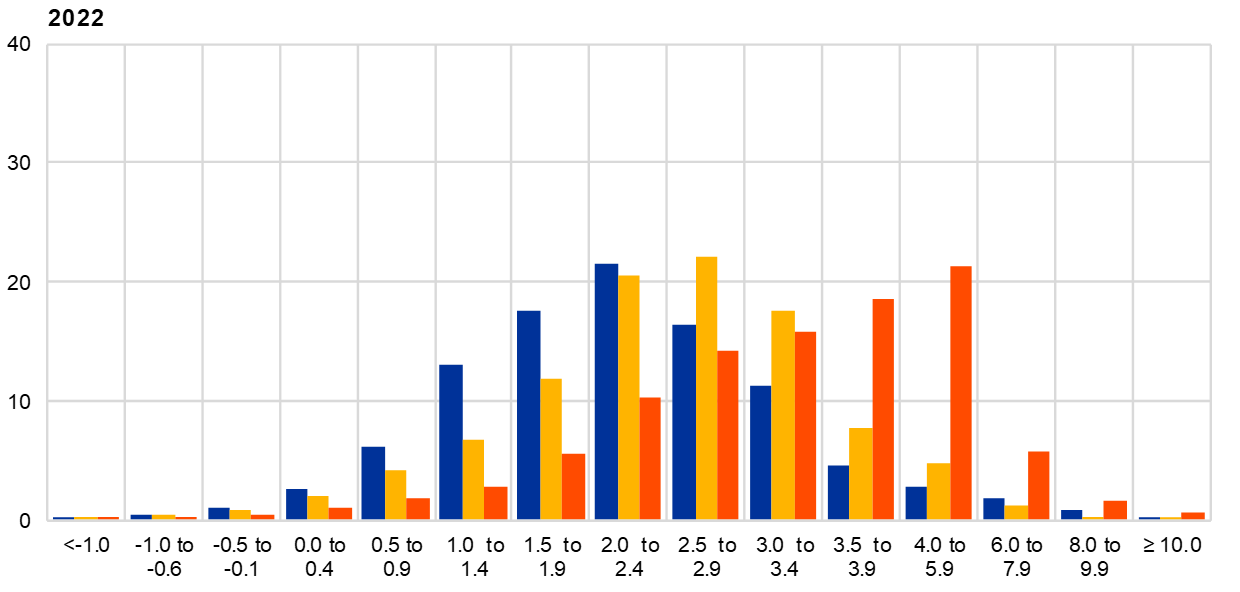
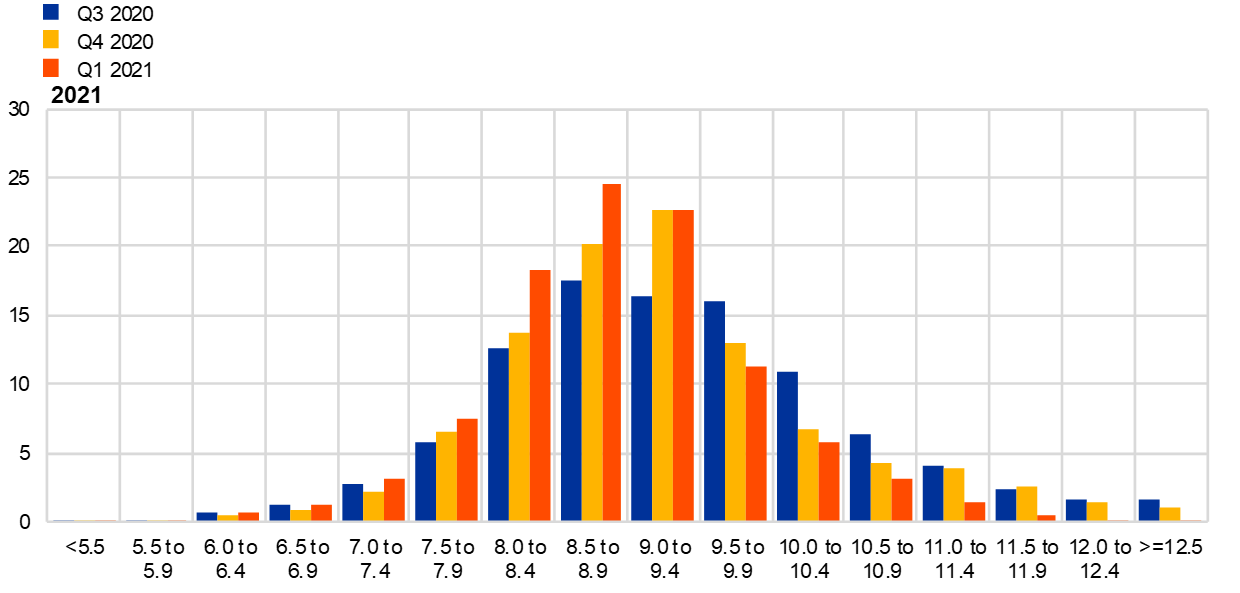
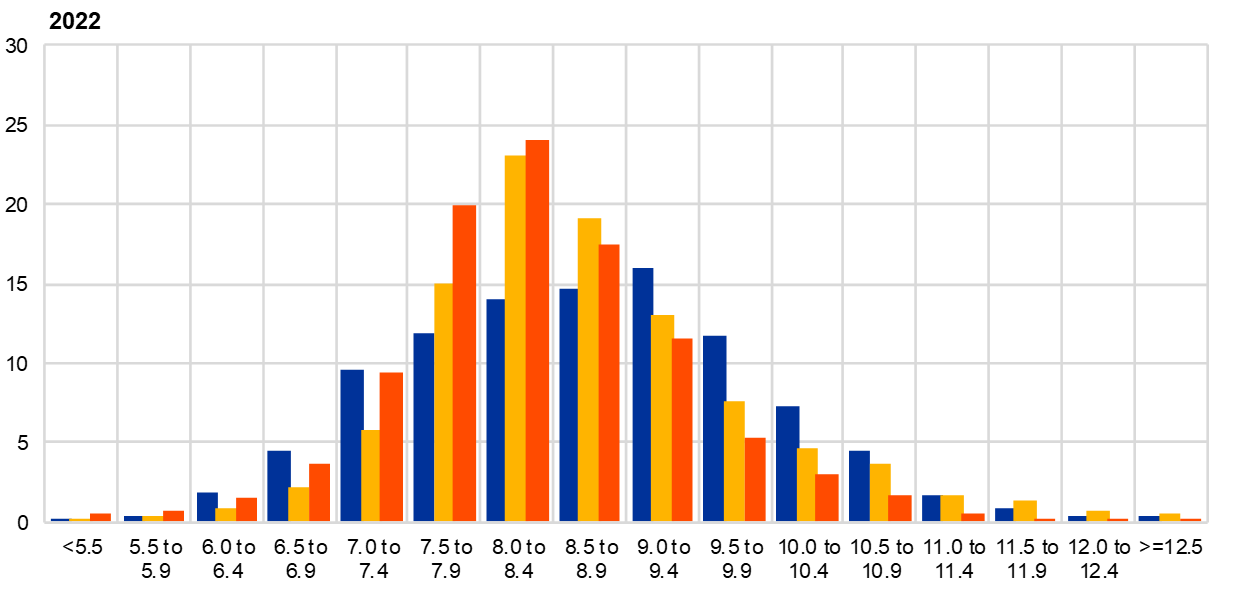
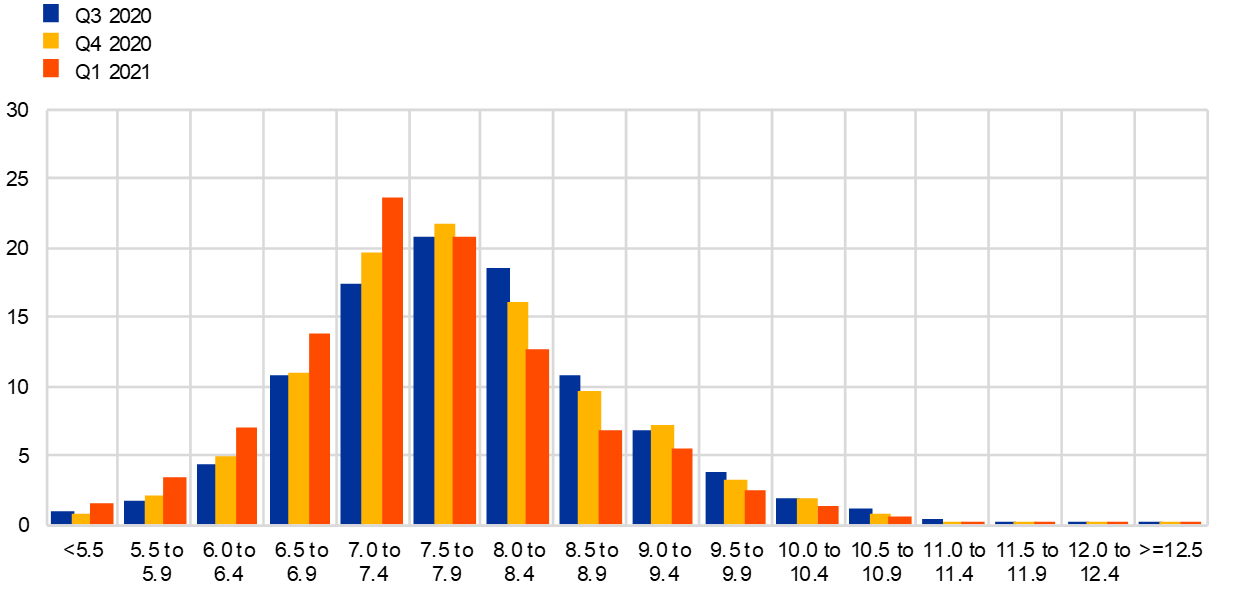
Respondents reported that the overall uncertainty surrounding the outlook for inflation remained elevated with substantial counteracting downside and upside risks. The coronavirus continued to be the main source of the elevated uncertainty. Respondents mentioned possible negative economic impacts in the near term but also possible upward impacts should vaccination roll-out efforts prove successful and pent-up demand be released. Quantitative indicators of uncertainty for inflation derived from the reported probability distributions eased somewhat but remained relatively elevated by historical standards. The width of the reported probability distributions indicates the perceived degree of uncertainty, whereas the asymmetry of the distributions indicates whether that uncertainty is more concentrated on higher or lower outturns, i.e. it measures the perceived balance of risks.[2] The aggregate probability distributions for the calendar years 2021-23 are presented in Chart 2. For 2021, the modal bin range (i.e. the one with the largest associated probability) shifted to 0.5-0.9% (from 1.0-1.4%), while the probability mass in the modal bin range for 2022 (1.0-1.4%) increased.
Chart 2
Aggregate probability distributions for expected inflation in 2021, 2022 and 2023
(x-axis: HICP inflation expectations, annual percentage changes; y-axis: probability, percentages)
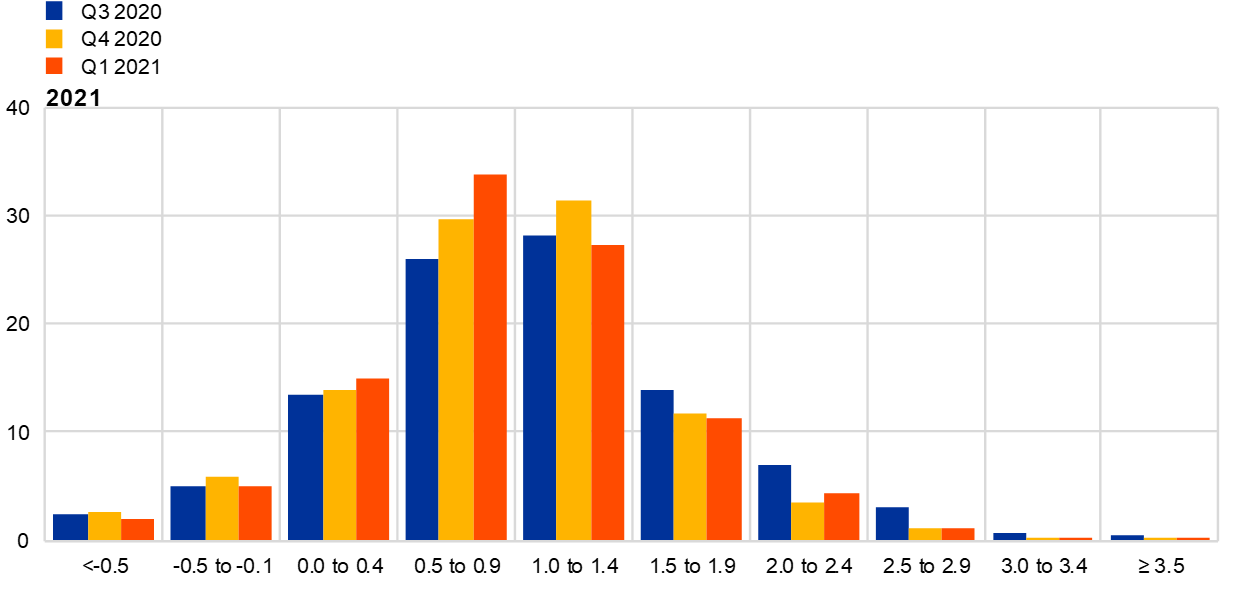
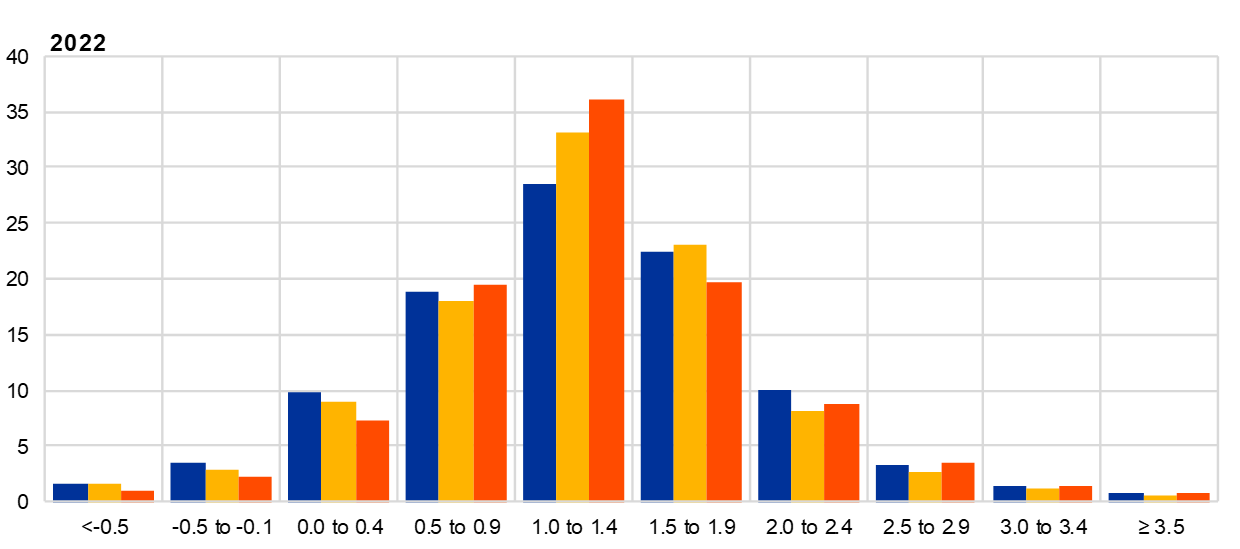
Notes: The SPF asks respondents to report their point forecasts and to separately assign probabilities to different ranges of outcomes. This chart shows the average probabilities they assigned to different ranges of inflation outcomes in 2021, 2022 and 2023.
2 Longer-term inflation expectations unchanged at 1.7%
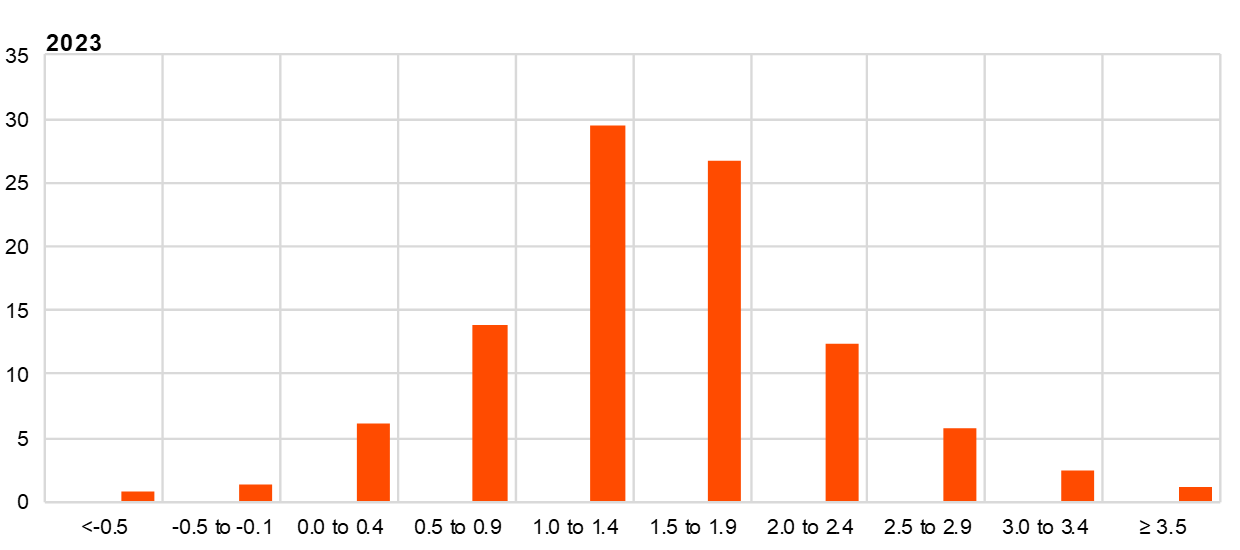
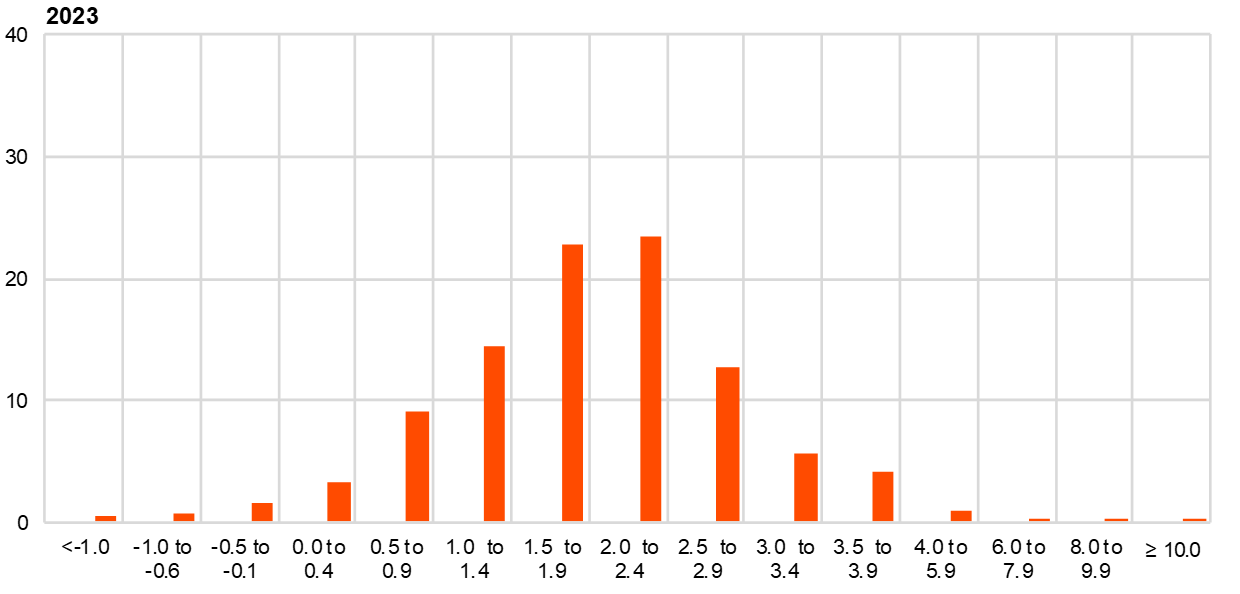
Longer-term inflation expectations averaged 1.7% for 2025, unchanged from the previous round. The outcome implied a small upward revision beyond the first decimal. Taking a slightly longer perspective, following four rounds of downward revisions during 2019 by a cumulative 0.2 percentage points and having remained at historical low levels in a narrow range (1.64-1.67%) during 2020, average longer-term expectations in this round of the SPF confirmed the earlier signs of stabilisation and possibly indications of a slight upward dynamic. In terms of other summary statistics, the median point forecast was revised up by 0.1 percentage points to 1.7%. While the estimated mean of the aggregate probability distribution remained at 1.6% when rounded, it was also revised up slightly beyond the first decimal (see Chart 3). The peak of the distribution of individual point forecasts was largely similar to that observed since the first quarter of 2019, with the modal response unchanged at 1.6% (see Chart 4). However, an increased number of respondents reported longer-term inflation expectations slightly above 2%.
The average longer-term expectations for HICP inflation excluding energy, food, alcohol and tobacco (HICPX) also showed some signs of a slight upward dynamic. When rounded they remained at 1.5% for 2025, unchanged from the previous SPF round, but the median longer-term point expectations for HICPX was revised up to 1.55% from 1.50%. The evolution of longer-term expectations for HICP and HICPX inflation has been broadly similar since the fourth quarter of 2016, i.e. the period for which the data are available, although the former have been slightly higher, by 0.1 percentage points on average (the difference was 0.14 percentage points in the SPF for the first quarter of 2021).
Chart 3
Longer-term inflation expectations
(annual percentage changes)
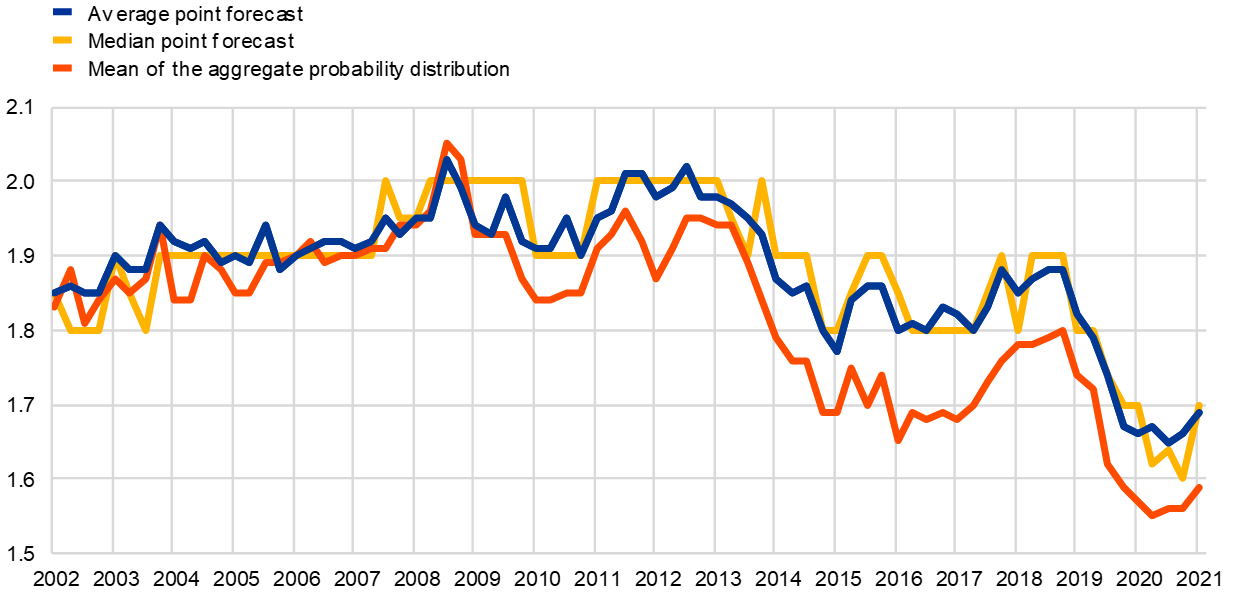
Chart 4
Distribution of point expectations for HICP inflation in the longer term
(x-axis: longer-term HICP inflation expectations, annual percentage changes; y-axis: percentages of respondents)
Notes: The SPF asks respondents to report their point forecasts and to separately assign probabilities to different ranges of outcomes. This chart shows the spread of point forecast responses.
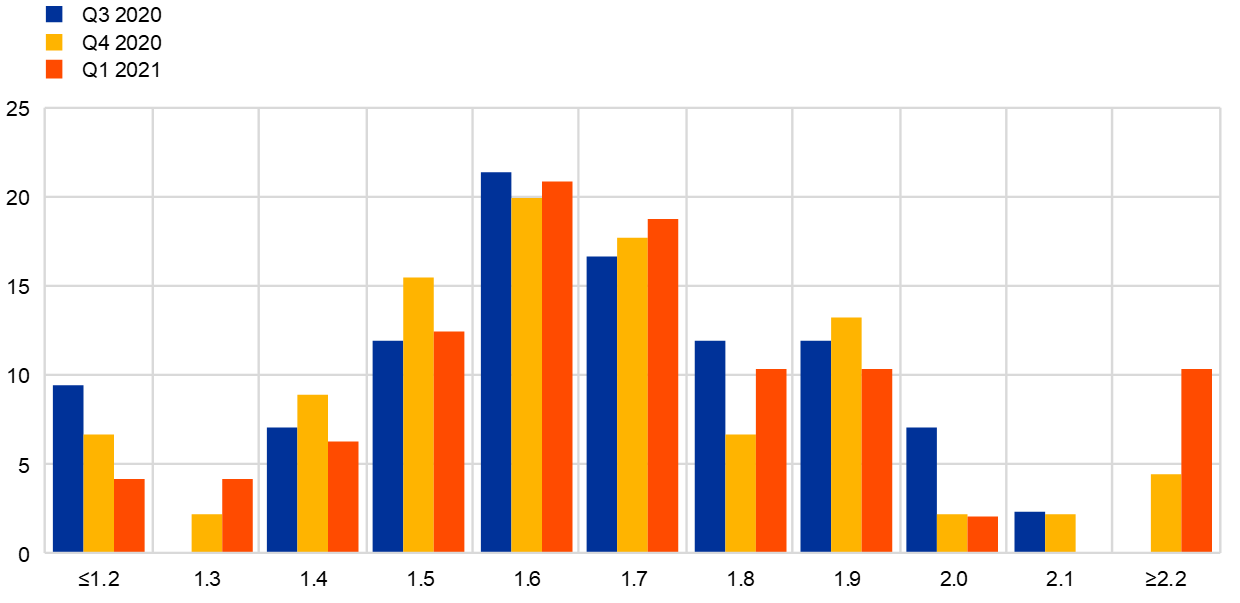
Although uncertainty surrounding longer-term inflation expectations moderated slightly, it remained elevated and the balance of risks stayed clearly to the downside. In line with uncertainty indicators for shorter horizons, there was some moderation in the standard deviation of the aggregate probability distribution (although it remained at a relatively high level by historical standards). The balance of risks also remained clearly to the downside. The probability associated with longer-term inflation being negative eased slightly to 2% from 3% in the previous round (see Chart 5).
Chart 5
Aggregate probability distribution for longer-term inflation expectations
(x-axis: HICP inflation expectations, annual percentage changes; y-axis: probability, percentages)
Notes: The SPF asks respondents to report their point forecasts and to separately assign probabilities to different ranges of outcomes. This chart shows the average probabilities they assigned to different ranges of inflation outcomes in the longer term.
3 Opposing revisions to real GDP growth expectations
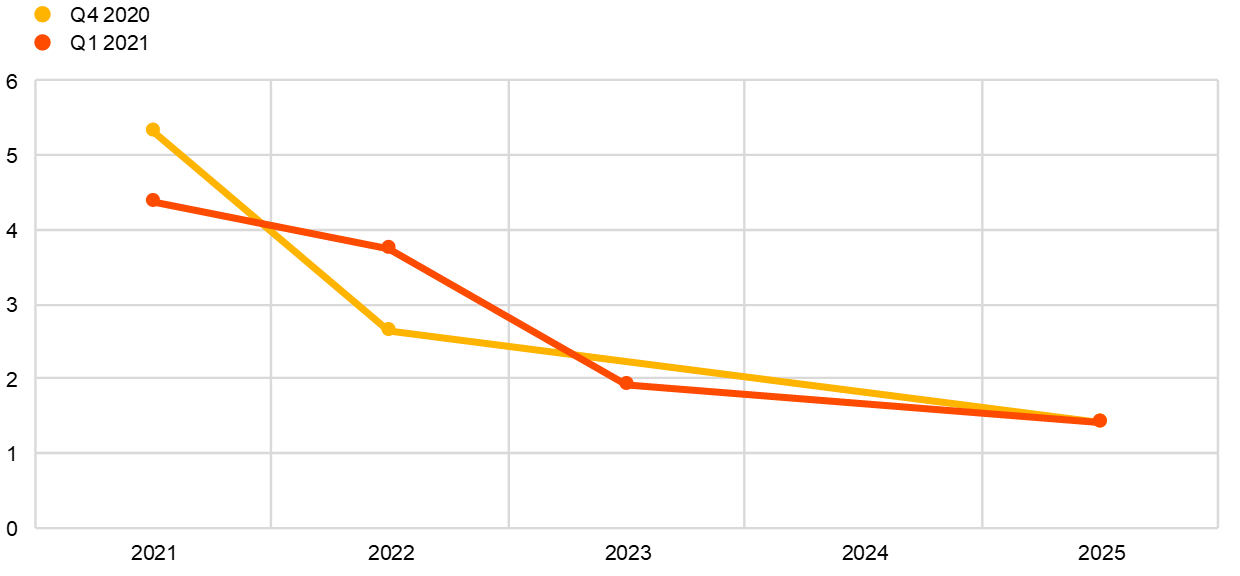
In the SPF for the first quarter of 2021, GDP growth expectations stood at +4.4% for 2021, +3.7% for 2022 and +1.9% for 2023 (see Chart 6). These imply opposing revisions compared with the previous round – a downward revision of 0.9 percentage points for 2021 and an upward revision of 1.1 percentage points for 2022 (see Table 1). Although GDP growth expectations for the calendar year 2020 were not surveyed, responses to the special question on the expected profile of quarter-on-quarter GDP growth rates enable a forecast to be calculated for 2020. This suggests that the average growth expectations for 2020 were revised up by 0.6 percentage points to -7.2% (from -7.8%). The respondents mainly flagged the recent resurgence of new infections and the associated lockdown measures as the reasons to revise downwards their forecasts for 2021. They now assumed that a normalisation of the economy would only happen later in the year and prolonging the recovery well into 2022. Compared with the December 2020 Eurosystem staff projection exercise, the average SPF point forecasts were somewhat higher for 2021, but somewhat lower for 2022 and 2023.
Chart 6
Expectations for real GDP growth
(annual percentage changes)
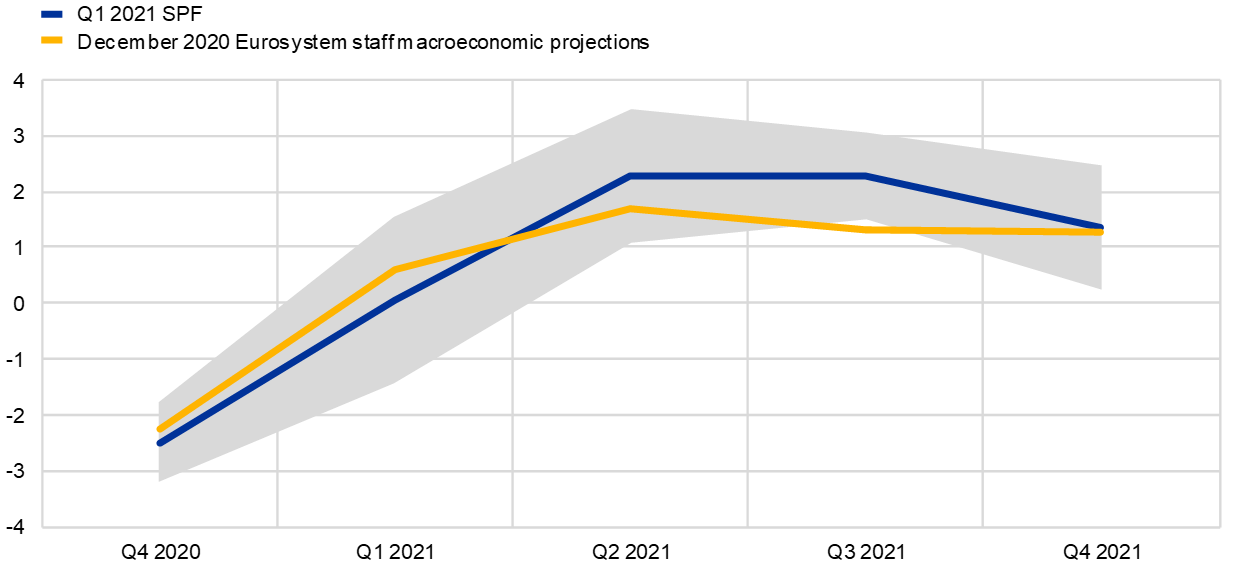
Respondents provided information on the assumptions related to the coronavirus pandemic and its impact on the short-term GDP growth outlook. While some respondents stated that the roll-out of vaccines did not materially affect their expectations as this had already been a feature of their baseline in the previous survey round, others said that the vaccines increased the confidence that the pandemic would eventually be over towards the end of 2021. Around 20 respondents further provided their expected profile of quarter-on-quarter GDP growth for the period Q4 2020-Q4 2021. These respondents, on average, expected real GDP to have declined by 2.5% in the fourth quarter of 2020 and to have zero growth in the first quarter of 2021 (see Chart 7). For the second and third quarters of 2021, they expected a strong pick-up with quarter-on-quarter growth of above 2% (which is equivalent to around 10% if annualised) before a moderation to just above 1% in the fourth quarter of 2021. Compared with the December 2020 Eurosystem staff projection exercise, SPF respondents were somewhat more pessimistic until the second quarter of 2021 and more optimistic thereafter.
Chart 7
Expected profile of quarter-on-quarter GDP growth
(quarter-on-quarter percentage changes)
Notes: Grey area indicates one standard deviation (of individual expectations) around average SPF expectation
The SPF growth expectations imply a return in the level of GDP to above its 2019 level during 2022 (see Chart 8). Notwithstanding the decline in activity expected in the fourth quarter of 2020, the growth outturn in the third quarter of 2020 was sufficiently stronger than previously anticipated so that the expected level of GDP in 2020 as a whole was higher (by 0.6 percentage points) than expected in the previous round. However, owing in part to the carry-over from the weaker fourth quarter of 2020, the level of GDP was expected to be lower for 2021 on average (by 0.3 percentage points). Given the expected rebound in growth during 2021 and thereafter, the level of GDP is expected to exceed its 2019 level by 2022 and then stand higher (by 0.8 percentage points) than anticipated in the previous survey round. However, this is still 3 percentage points lower than the forecast for 2022 in the SPF for the first quarter of 2020, i.e. before the coronavirus outbreak in Europe. Longer-term growth expectations (which refer to 2025) remained stable at 1.4%.
Chart 8
Forecast profile of real GDP level
(2019 = 100)
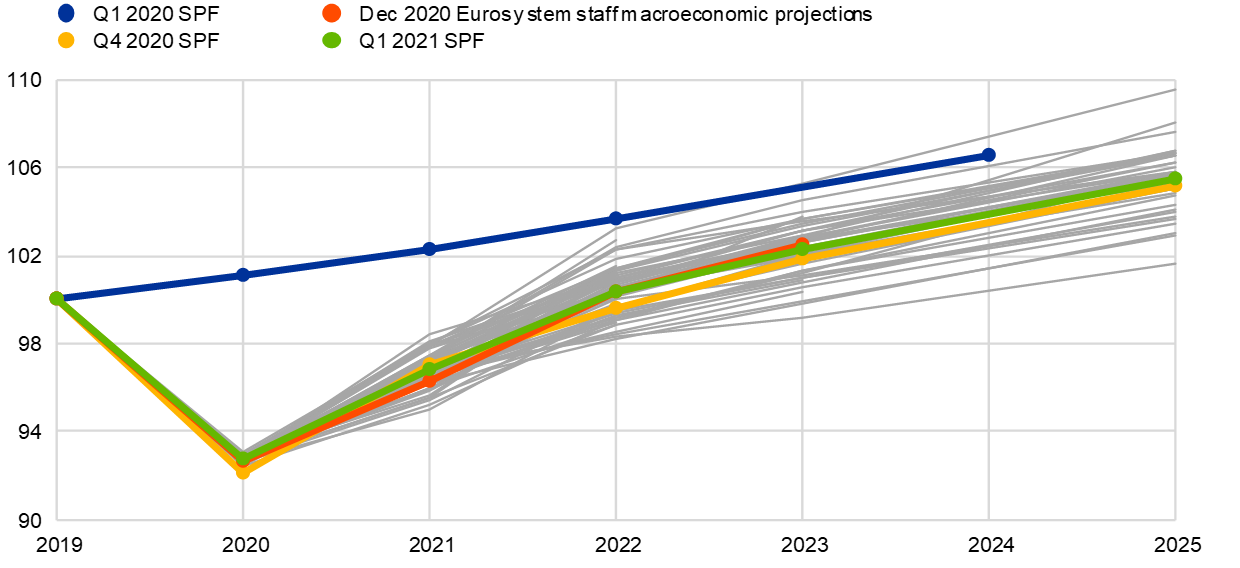
Notes: Growth expectations for years not surveyed have been interpolated linearly. Grey lines denote individual forecaster profiles in the Q1 2021 round.
The increase in new infections as well as the recent emergence of virus mutations were mentioned as key concerns and risk factors for growth. Nonetheless, the disagreement among forecasters decreased, in particular for the near term, although it still remained sizeable by historical comparisons. The most cited downside risk to growth continued to be that of a further worsening of the pandemic and the vaccination roll-out moving too slowly, with current lockdowns being extended well into the second quarter of the year. A number of respondents also cited the risk of a delay in the implementation of the Next Generation EU (NGEU) package and of withdrawal of fiscal support by national governments. Upside risks related mainly to a stronger than assumed release of pent-up consumer demand once the containment measures are gradually lifted. Several respondents also mentioned that the EU-UK agreement had reduced one source of uncertainty and, more globally, that the risk of trade disputes had been reduced. Chart 9 and Chart 10 present the aggregate probability distributions for GDP growth for the years 2021-23 and in the longer term (2025) respectively.
Chart 9
Aggregate probability distributions for GDP growth expectations for 2021, 2022 and 2023
(x-axis: real GDP growth expectations, annual percentage changes; y-axis: probability, percentages)
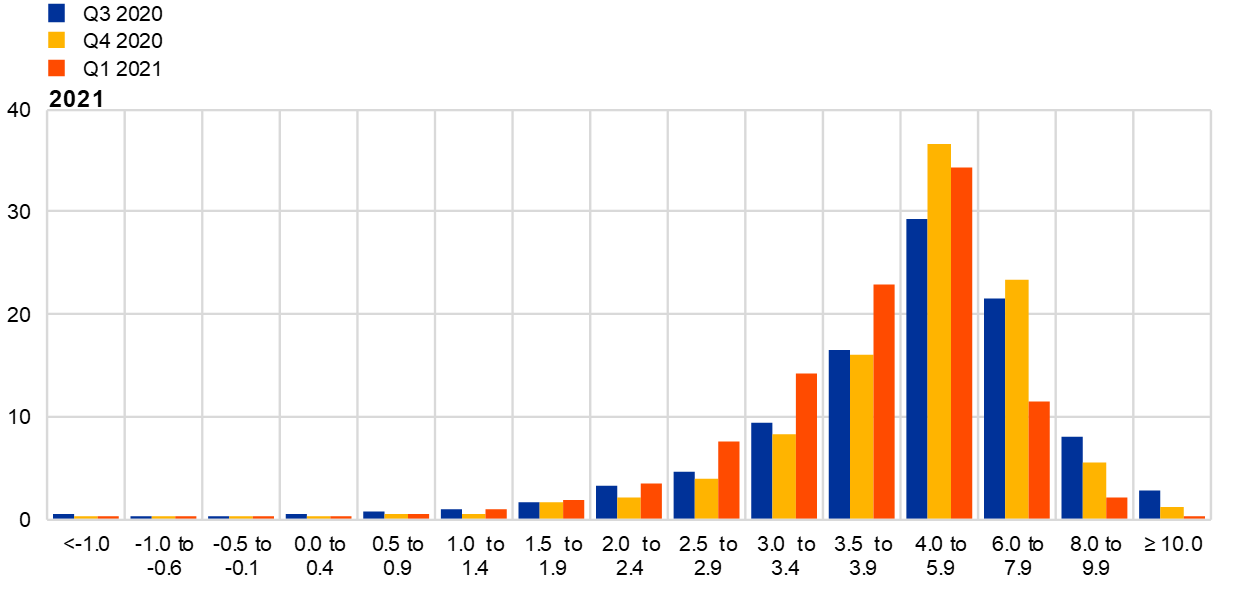
Notes: The SPF asks respondents to report their point forecasts and to separately assign probabilities to different ranges of outcomes. This chart shows the average probabilities they assigned to different ranges of real GDP growth outcomes in 2021, 2022 and 2023. For outcomes above 4%, bins are 2 percentage points wide.
Chart 10
Aggregate probability distribution for longer-term GDP growth expectations
(x-axis: real GDP growth expectations, annual percentage changes; y-axis: probability, percentages)
Notes: The SPF asks respondents to report their point forecasts and to separately assign probabilities to different ranges of outcomes. This chart shows the average probabilities they assigned to different ranges of real GDP growth outcomes in the longer term.
4 Unemployment rate expectations revised down across all horizons
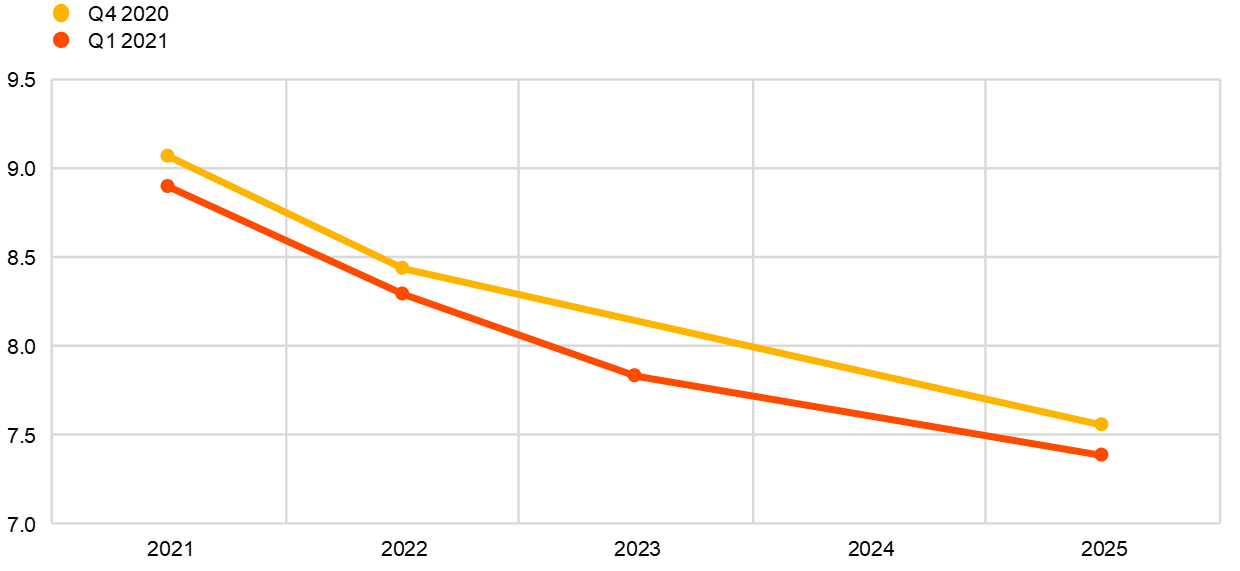
The average SPF point forecasts for the unemployment rate were 8.9%, 8.3% and 7.8% for 2021, 2022 and 2023 respectively (see Chart 11). Given that the forecast for the year 2021 was higher than that indicated by the latest available data (8.3% in November 2020), this implies that respondents continued to expect an increase in the unemployment rate in the near term. However, in line with the anticipated recovery in economic activity, this was expected to reverse and give rise to a steady decline in the euro area unemployment rate to 7.4% by 2025. This expectation of a downward trajectory was broadly unchanged compared with the previous round but embedded marginal downward revisions across all horizons. The slight reduction for 2021 seemed to be the result of lower than expected realised data at the end of 2020 and the early start of vaccine roll-outs. However, the pandemic was expected to be the main factor driving job-market developments over the coming months, and further reductions in the unemployment rate were expected to occur only in the second half of 2021. Although many respondents expected fiscal policy to support job retention in the short term, they considered that this might result in official unemployment rate statistics understating the true extent of labour market slack. Some respondents expected job losses should governments withdraw current support measures and some businesses close or seek to reduce labour costs. Nonetheless, a decline in the unemployment rate over the longer-term was still expected owing to a renewed momentum in economic activity along with a reduction of people in the working-age population.
Chart 11
Expectations for the unemployment rate
(percentages of the labour force)
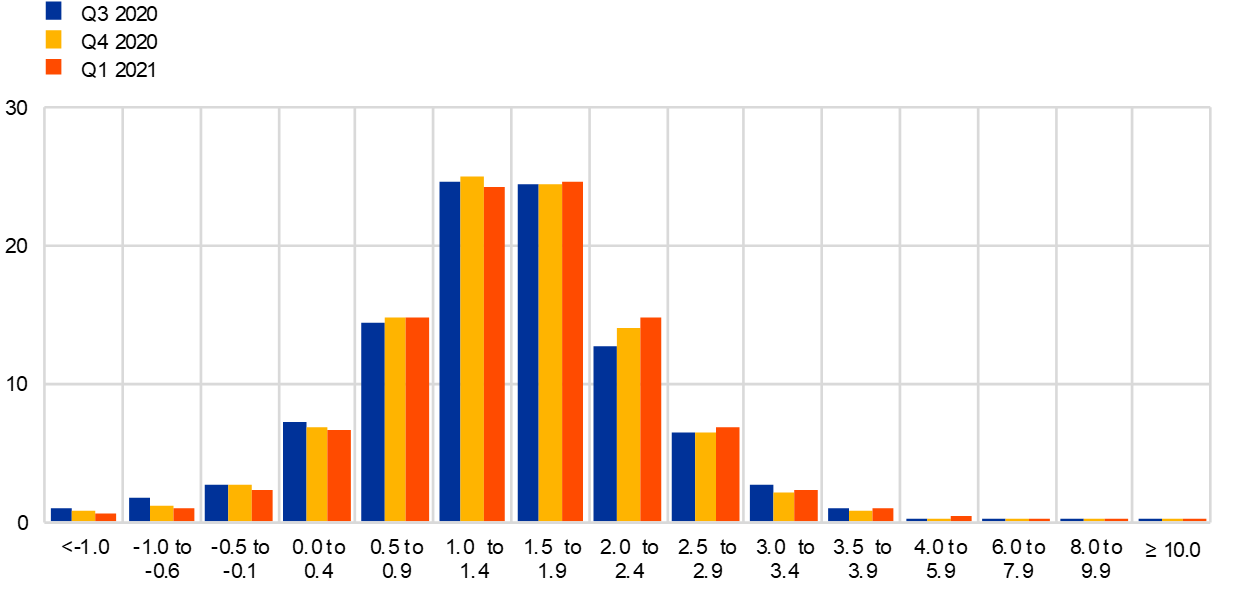
Uncertainty surrounding unemployment rate expectations declined for short-term horizons but remained at very high levels, while risks were more neutral compared with the previous round. Forecasters’ uncertainty about the future unemployment rate (as measured by the average width or standard deviations of the reported probability distributions) declined over short-term horizons (see Chart 12). However, it still stood at historically high levels. On balance, the probability distributions were broadly neutral for the shorter horizons but remained slightly skewed to the upside for the longer horizon (see Chart 13).
Chart 12
Aggregate probability distributions for the unemployment rate in 2021, 2022 and 2023
(x-axis: unemployment rate expectations, percentages of the labour force; y-axis: probability, percentages)

Notes: The SPF asks respondents to report their point forecasts and to separately assign probabilities to different ranges of outcomes. This chart shows the average probabilities they assigned to different ranges of unemployment rate outcomes for 2021, 2022 and 2023.
Chart 13
Aggregate probability distribution for the unemployment rate in the longer term
(x-axis: unemployment rate expectations, percentages of the labour force; y-axis: probability, percentages)
Notes: The SPF asks respondents to report their point forecasts and to separately assign probabilities to different ranges of outcomes. This chart shows the average probabilities they assigned to different ranges of unemployment rate outcomes in the longer term.
5 Expectations for other variables
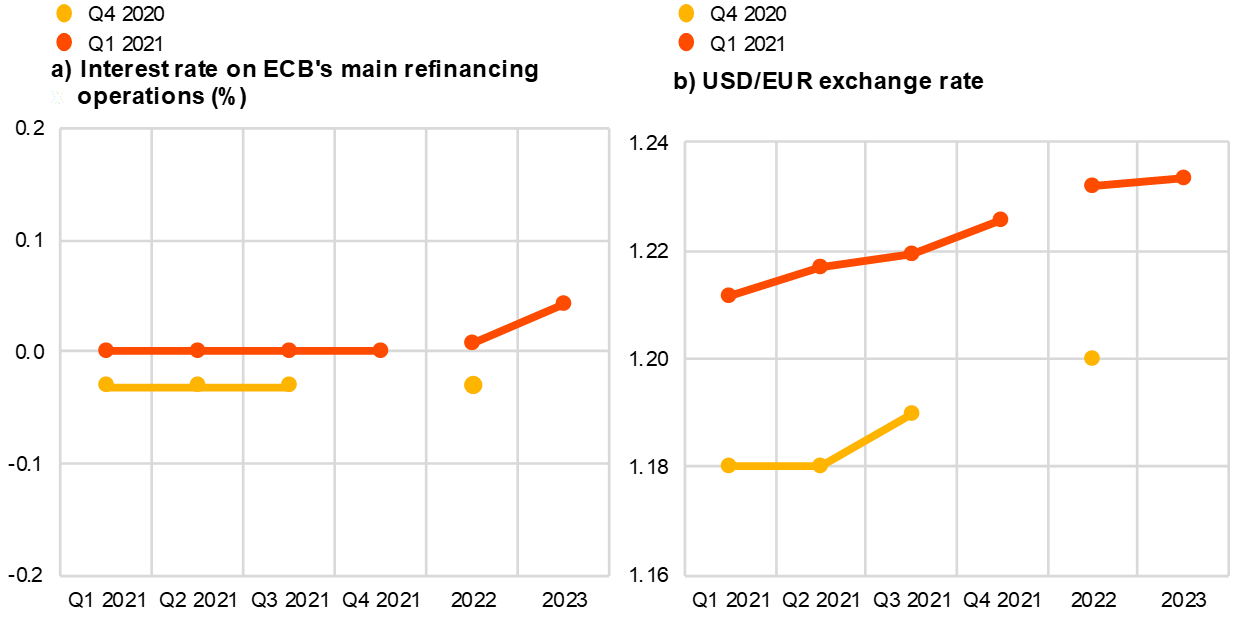
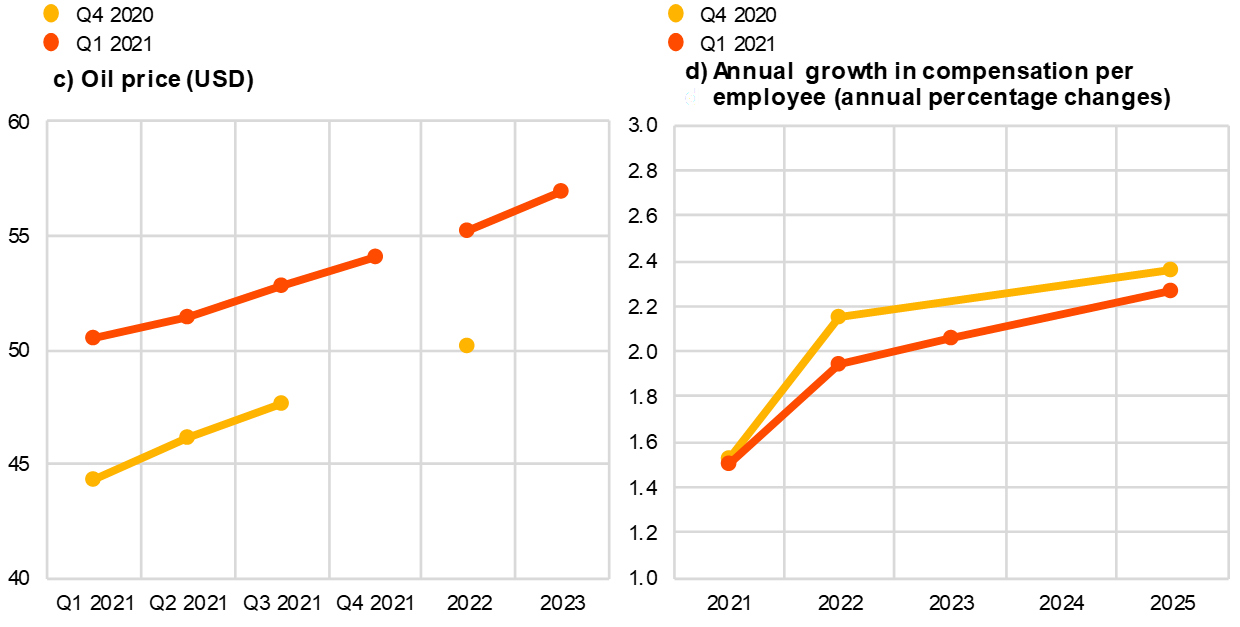
Respondents expected: (i) the ECB’s main policy rates to remain unchanged until at least 2023; (ii) the euro to appreciate very moderately against the dollar until 2023; (iii) oil prices to rise gradually from an average price of around USD 52 per barrel in 2021 to around USD 57 by 2023; and (iv) nominal wage growth to increase throughout the entire forecast horizon from around 1.5% in 2021 to 2.3% by 2025.
The median (and majority) expectation for the rate on the ECB’s main refinancing operations was for it to remain at 0% until at least 2023. A few respondents expected some increase in 2022 (5%, or 3 out of 51) or by 2023 (around 20%, or 9 out of 41). Overall, interest rate expectations were essentially unchanged from the previous round (see panel (a) of Chart 14).
The average USD/EUR exchange rate was expected to appreciate very marginally from around 1.21 in the first quarter of 2021 to 1.23 in the fourth quarter of 2021 and thereafter. This profile was slightly higher compared with the previous SPF round (see panel (b) of Chart 14).
Compared with the previous round, the level of expected US dollar-denominated oil prices (per barrel) was higher, by around USD 5, across all horizons from the first quarter of 2021 to 2023 – see panel (c) of Chart 14. Oil prices were expected to increase steadily during 2021, from USD 50.5 per barrel in the first quarter to USD 54.1 in the fourth quarter, and then grow at a slower pace to reach USD 56.9 by 2023. Given the expectation for the USD/EUR exchange rate, this implies that the profile for the oil price in euro was somewhat higher (by 7-11%) compared with the previous round.
The profile of the average expectation for the annual growth in compensation per employee was largely unchanged from the previous round and was expected to follow an upward sloping trajectory. Average point forecasts were 1.5% in 2021, 2.0% in 2022 and 2.1% in 2023 – see panel (d) of Chart 14. For 2025, it was expected to be 2.3%, around 0.1 percentage points lower than in the previous round.
Chart 14
Expectations for other variables
6 Annex (chart data)
Excel data for all charts can be downloaded here.
© European Central Bank, 2021
Postal address 60640 Frankfurt am Main, Germany
Telephone +49 69 1344 0
Website www.ecb.europa.eu
All rights reserved. Reproduction for educational and non-commercial purposes is permitted provided that the source is acknowledged.
For specific terminology please refer to the ECB glossary (available in English only).
PDF ISSN 2363-3670, QB-BR-21-001-EN-N
HTML ISSN 2363-3670, QB-BR-21-001-EN-Q
- The survey was conducted between 7 and 11 January 2021 with 66 responses received. Participants were provided with a common set of the latest available data for annual HICP inflation (December 2020 flash estimates: overall inflation, -0.3%; underlying inflation, 0.2%), annual GDP growth (third quarter of 2020, -4.3%) and unemployment (November 2020, 8.3%).
- Regarding uncertainty, it can be shown that the width (or standard deviation) of the aggregate probability distribution (i.e. “aggregate uncertainty”) is a function of the average width (or standard deviations) of the individual probability distributions (i.e. “individual uncertainty”) and standard deviation of the individual point forecasts (i.e. “disagreement”).