
Results of the third special questionnaire for participants in the ECB Survey of Professional Forecasters
Introduction
Since 2008 the ECB has conducted a special survey every five years, exploring the forecast processes and methodologies underlying the contributions made to the regular quarterly survey of professional forecasters (SPF). A distinguishing feature of the quarterly SPF is that, for each horizon, it asks for point forecasts as well as probability distributions, which provide a quantitative assessment of risk and uncertainty. The special survey therefore investigates how both point forecasts and probability distributions are generated. Not only is this very helpful in that it offers a better understanding of how aggregate SPF results are built up, it also provides an important stocktake of current forecasting practices and how these have evolved over time.
The 2018 survey[1] repeated some questions from previous special surveys, for example those regarding the different economic models used by forecasters and the role of judgement in transforming a model’s output into the final forecast as submitted to the regular quarterly SPF. The results show that forecasters often use multiple models, reflecting not only the differing comparative advantages across economic variables and horizons, but also the importance of cross-checking and expert judgement. At the same time, the survey also asked new questions, probing in particular, the extent to which forecasts for pairs (or a higher number) of variables were made jointly, in accordance with economic relationships such as Okun’s law and the Philips curve. This turned out to be very relevant for the point forecasts, but less so for probability distributions. The questionnaire used in this special survey, with counts of all the responses received, can be found in the annex.
Responses were received from 53 institutions (although not every respondent answered every question), which is broadly comparable with the number of responses typically received for the regular quarterly survey. The proportions of respondents quoted in the discussion of the individual results are the proportions of respondents that actually answered the specific question referred to.
Note: throughout this report “short term” refers to a forecast horizon of up to one year, “medium term” refers to a horizon of between one and three years ahead, and “long term” refers to a horizon of between four and five years ahead.
1 Forecast processes
Forecasters typically conduct a comprehensive update of their economic forecasts for the next three years every quarter, although longer-term views tend to be reassessed less frequently (see Chart 1). In the question, a “full forecast update” was defined as reassessing all (for example) month-on-month or quarter-on-quarter changes. For both short and medium-term forecasts, a majority of respondents indicated that they did this every quarter. However, a significant minority of respondents also reported that they conducted a full update of their short-term forecasts on a monthly basis, especially for HICP inflation and the unemployment rate (for which new data are released every month). On the other hand, approximately half of the respondents indicated that they only fully reassess their longer-term views annually.
Chart 1
How often do you normally conduct a full update of your forecasts?
(percentages of responses)
Such comprehensive updates are typically conducted according to institutions’ own internal timetables, although for short-term forecasts, data releases are also an important trigger (see Chart 2). In answer to the question “What typically determines the timing of your full forecast updates?” an average of 73% of respondents, across forecast horizons, responded “Internal timetable (not directly data release driven)”. Many forecasters, however, reported that the release of new data on HICP inflation and real GDP growth was also an important trigger of a full update of their forecasts – especially their short-term forecasts. Some respondents also provided qualitative comments explaining that if new data (which could include other indicators beyond those surveyed in the SPF) materially affected their view on the economy, they would react by updating their forecasts sooner than their regular timetable might imply.
Chart 2
What typically determines the timing of your full forecast updates?
(percentages of responses)

Note: Respondents were able to select multiple answers and, therefore, percentages do not necessarily sum to 100.
Nevertheless, most of the forecasts submitted to the regular, quarterly survey incorporate the latest data available, often as a mechanical update (see Table 1). The questionnaire for the regular, quarterly survey is usually distributed to survey participants in the first week of each quarter, soon after the flash HICP release for the preceding month and the unemployment rate release for the month before that. In response to a question on the extent to which the forecasts submitted to the quarterly SPF incorporate these new data, 31% of respondents replied that they provide a full forecast update while 56% answered that they provide a mechanical update. In other words, they update the starting point of their forecasts, but do not reassess subsequent period-on-period changes except, perhaps, to layer on a standard rule-of-thumb adjustment to account for changes in the assumed path of oil prices and the exchange rate. Qualitative comments made by those who selected neither a full nor a mechanical update included explanations such as: whether an update is full or mechanical depends on the interaction between the SPF schedule and the institution’s own internal forecast timetable; the inflation forecasts are fully updated whereas the unemployment projection is only mechanically updated; and the SPF submission represents the institution’s latest published forecasts.
Table 1
What type of forecast update do you contribute to the regular, quarterly SPF?

The magnitude of mechanical adjustments made to account for changes in the assumed path of oil prices and the exchange rate, however, was quite heterogeneous (see Charts 3 and 4). Further insight into the perceived impacts of shocks used in mechanical updates was provided by some respondents in the form of quantitative information on how much, all else being equal, their forecasts would be affected by a permanent 10% shock to the level of the dollar oil price and, similarly, by a permanent 10% shock to the EUR/USD exchange rate. The average impact would suggest some persistent effects, particularly on HICP inflation. This question, however, was less widely answered than the others, and answers were numerically very disperse. The median impact, which is more robust to outliers in a small sample, shows most shock impacts fading over a three-year horizon.
Chart 3
What would be the impact on your forecasts of a permanent 10% increase in oil prices (in US dollars)?
(percentage points)

Note: Solid lines denote mean impact, across individual responses, while dashed lines denote median impact.
Chart 4
What would be the impact on your forecasts of a permanent 10% increase in the EUR/USD exchange rate?
(percentage points)

Note: Solid lines denote mean impact, across individual responses, while dashed lines denote median impact.
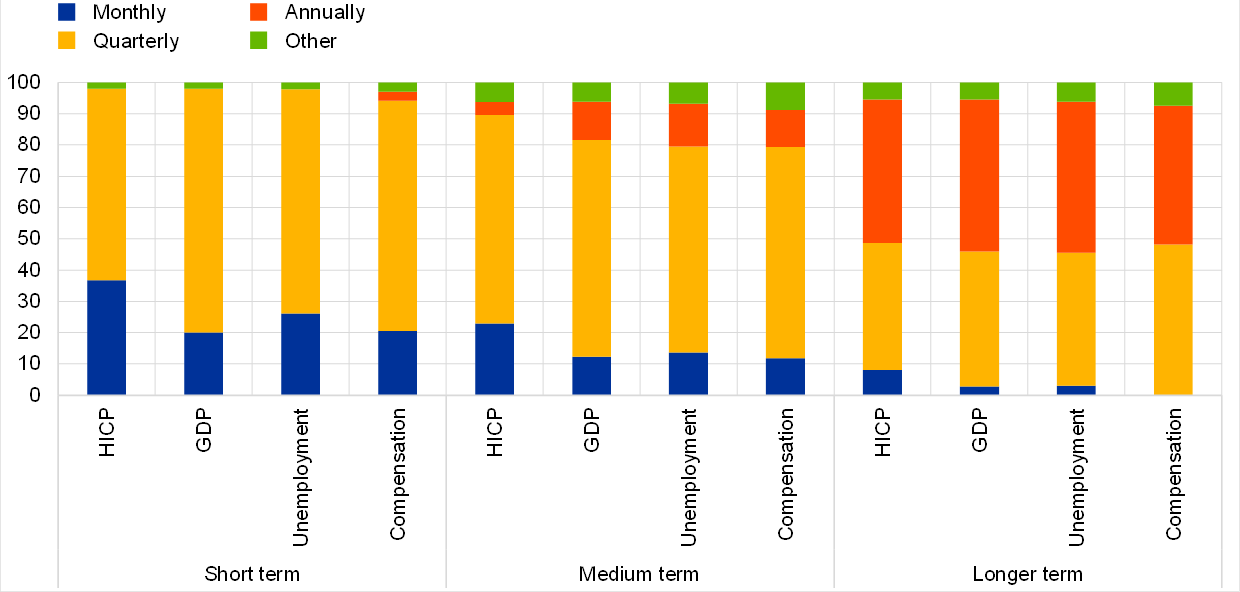
The frequency of the variables in respondents’ forecasts tends to decline as the forecast horizon becomes longer (see Chart 5). A majority of respondents based their short-term forecasts for HICP on monthly data, while for medium-term forecasts there was a more even split between those using monthly and those using quarterly data, with longer-term forecasts being based mostly on annual values. Similarly, for real GDP growth, quarterly data (the highest frequency published) were typically used for short and medium-term forecasts, while longer-term forecasts were, again, mostly based on annual data. For the two labour market variables, the picture is slightly different. Even though the unemployment rate is published at a monthly frequency, a majority of respondents indicated they their short-term forecasts are based on quarterly data. Similarly, approximately one-third of respondents indicated that even their short-term forecasts for annual growth in compensation per employee are based on annual data. This is consistent with the SPF survey, in that for this variable, the questionnaire only asks for calendar year expectations.
Chart 5
For the variables below, what is the highest frequency in your forecasts?
(percentages of responses)

2 Forecast models and the role of judgement
Forecasters use a variety of different models to inform point forecasts across variables and horizons (see Chart 6). Respondents indicated that reduced-form models were the predominant tool they used for short and medium-term forecasts, while models with an economic structure were more widely used for longer-term forecasts. On average across variables, 80% of respondents indicated that they use reduced-form models for their short-term forecasts, compared with 60% for longer-term forecasts. Models with an economic structure are used by 40% of respondents for longer-term forecasts, but by only 20% for short-term forecasts.
Chart 6
If you use models for forecasting, which type(s) do you use?
(percentages of responses)

Note: Respondents were able to select multiple answers and, therefore, percentages do not necessarily sum to 100.
The use of multiple models reflects not just different comparative advantages across economic variables and horizons, but also the role played by cross-checking. Two-thirds of the respondents to a question asking for their reasons for using multiple models replied that they did so because of the comparative advantages offered by different models at different horizons, and a similar proportion pointed to the comparative advantages offered by different models for different economic variables. In addition, half of the respondents to the question used multiple models to cross check results.
Expert judgement is an important element of the forecasts and its role increases with horizon length (see Charts 7 and 8). Expert judgement is embodied in a large majority of point forecasts: on average, only around 10% of respondents indicated that judgement played no role in their point forecasts, which were, instead, essentially model based. However, the particular role played by expert judgement tended to change across horizons. At the short-term horizon judgement is primarily used to complement model output, but as the forecast horizon increases, so too does the proportion of forecasts that are essentially judgement based, rising from about 20% for the short term to about 50% for the longer-term horizon. For expected probability distributions, on the other hand, across both variables and horizons, approximately three-quarters of respondents indicated that these were essentially based on expert judgement.
Chart 7
To what extent are your point forecasts model or judgement based?
(percentages of responses)

Chart 8
To what extent are your reported probability distributions model or judgement based?
(percentages of responses)

Forecasters regularly review the accuracy of their point forecasts, and react to the results. Overall, three-quarters of respondents indicated that they routinely conduct evaluations of their point forecasts – half of these respondents did this on a quarterly basis and the other half on an annual basis. Those who evaluated point forecast performance quarterly would, typically, revise the degree of judgement applied as well as re-estimate their models, while the comments of those who conducted annual reviews tended also to include re-specifying the underlying equations, e.g. in terms of the set of input variables used. Very few respondents, however, indicated that they routinely evaluated the accuracy of their probability distribution functions.
In particular, the low-inflation period beginning in 2013 has had an effect on how, in practice, models are used for forecasting. In response to a question on whether the period since 2013, when inflation was low, had affected how their models were applied, 60% of respondents indicated that this had led to changes in the overall forecast process. The most common response, reported by three-quarters of the respondents who indicated that this period had led to changes, had been to complement the model output with a higher degree of judgement, while about a third of respondents indicated that they now make more use of additional cross-check models, and a similar proportion again indicated that they place more emphasis on model parameters estimated from more recent data. For other forecasters, however, their models may have already been sufficiently dynamic to adapt automatically, without requiring explicit manual interventions. In response to another question on the impact of any potential structural change in economic relationships on their forecasts, a third of respondents noted that their forecasting models allow for non-linearities, e.g. by incorporating structural breaks or utilising time-varying parameters.
3 Relationships between economic variables
Forecasters tend to carefully consider economic relationships between variables, e.g. the Philips curve or Okun’s law, when making their point forecasts (see Chart 9). A large majority of respondents indicated that, across four pairs of economic variables, their point forecasts were jointly determined. This was predominantly implemented informally, e.g. through judgements applied to model outputs, although a third of respondents (both to this question and overall) indicated that their real GDP growth and unemployment forecasts were jointly determined within one model (i.e. in accordance with Okun’s law).
Chart 9
Are your point forecasts for the following pairs of variables jointly determined?
(percentages of responses)
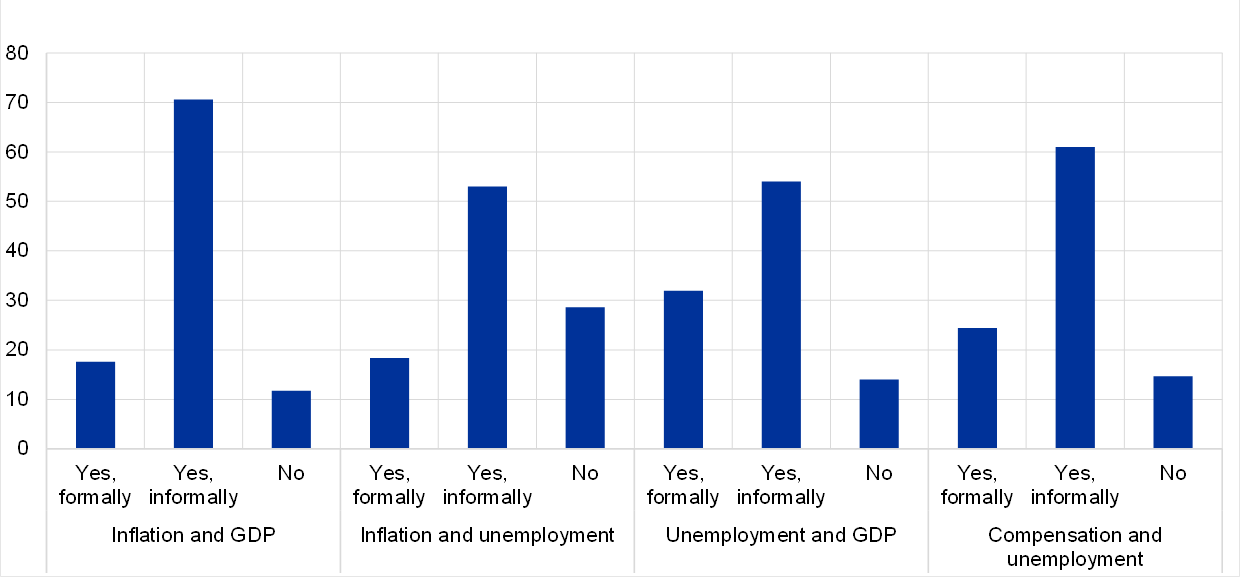
Note: In this context “formally” means within one model and “informally” means, for example, through the judgements applied to model outputs.
Economic relationships between variables seem most relevant when updating point forecasts at the medium-term horizon (see Chart 10). This is consistent with idiosyncratic shocks to individual variables being more relevant in the short term while longer-term views may be influenced more by an assessment of the structural parameters of the economy. When asked about interpreting longer-term real GDP growth and unemployment forecasts, about 40% of respondents indicated that these always corresponded to their view on potential output and the NAIRU, respectively (see Chart 11). However, a slightly larger proportion took a more nuanced view: their longer-term forecasts sometimes corresponded to structural parameters, but the possibility that some shocks may persist for up to five years was not excluded.
Chart 10
Are updates to your point forecasts for the following pairs of variables dependent on one another?
(percentages of respondents)
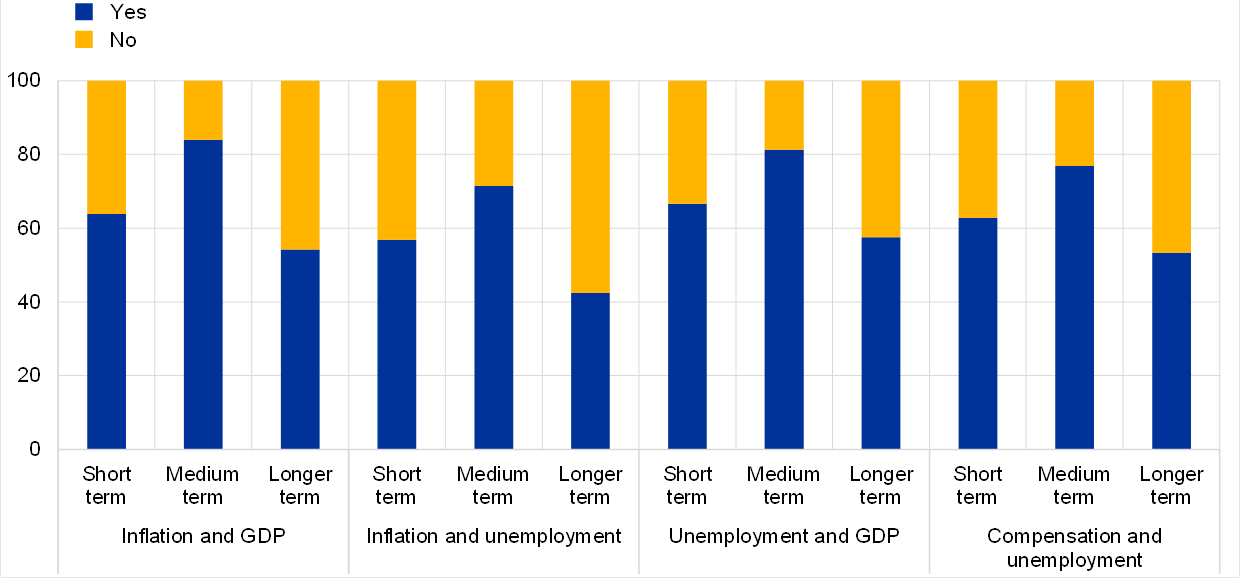
Chart 11
Can your longer-term forecasts of real GDP growth and the unemployment rate be interpreted, respectively, as your estimates of potential output growth and a structural unemployment rate (e.g. the NAIRU) at that horizon?
(percentages of responses)

For probability distributions, however, economic relationships between variables play a lesser role (see Charts 12 and 13). In contrast to the results for point forecasts, significantly fewer respondents indicated that their probability distributions were jointly determined across pairs of variables, or evolved in a way that made them dependent on one another. Nevertheless, there were some similarities between the two sets of results. First, to the extent that probability distributions for pairs of variables were jointly determined, this was, just as for point forecasts, mostly done informally, i.e. through expert judgement. Second, when considering how probability distributions were updated across the different horizons, joint dependency was again most relevant at the medium-term horizon.
Chart 12
Are your probability distributions for the following pairs of variables jointly determined?
(percentages of responses)

Chart 13
Are updates to your probability distributions for the following pairs of variables dependent on one another?
(percentages of responses)

4 Other expectations
Expectations for oil prices, exchange rates and the interest rate on the ECB’s main refinancing operations are formed in a variety of different ways (see Chart 14). The regular, quarterly SPF also collects expectations for the oil price (in US dollars), the euro-dollar exchange rate and the interest rate on the ECB’s main refinancing operations. Oil prices were, typically, expected to follow the path implied by financial market futures prices, while exchange rate expectations were generally based on either the average of recent prices or a combination of model output and expert judgement. Expectations for the ECB’s main refinancing rate, on the other hand, tended to be based more on judgement.
Chart 14
How do you form your expectations for oil prices, the exchange rate, and the interest rate on the ECB’s main refinancing operations?
(percentages of responses)

Note: Respondents were able to select multiple answers and, therefore, percentages do not necessarily sum to 100.
Annex 1Survey questionnaire and responses
A copy of the questionnaire, with counts of the responses received for the answers to each question, can be downloaded here.
Annex 2Chart data
Excel data for all charts can be downloaded here.
© European Central Bank, 2019
Postal address 60640 Frankfurt am Main, Germany
Telephone +49 69 1344 0
Website www.ecb.europa.eu
All rights reserved. Reproduction for educational and non-commercial purposes is permitted provided that the source is acknowledged.
For specific terminology please refer to the ECB glossary.
PDF ISSN 2363-3670
HTML ISSN 2363-3670
- The survey was conducted between 22 August and 14 September 2018.
-
7 February 2019
-
7 February 2019