

Published as part of the ECB Economic Bulletin, Issue 6/2022.
This box describes the ECB’s monetary policy operations and liquidity developments during the third and fourth reserve maintenance periods of 2022. Together, these two maintenance periods ran from 20 April 2022 to 26 July 2022 (the “review period”).
Average excess liquidity in the euro area banking system rose by €34.1 billion during the review period, reaching a record level of €4,523.1 billion. The overall increase was mainly driven by net asset purchases conducted under the asset purchase programme (APP) and was partially offset by an increase in net autonomous factors. The increase mainly took place in the third maintenance period, while average excess liquidity declined during the fourth maintenance period, primarily owing to TLTRO III repayments and APP net purchases coming to an end as of 1 July 2022.
Liquidity needs
The average daily liquidity needs of the banking system, defined as the sum of net autonomous factors and reserve requirements, increased by €25.3 billion to €2,602.8 billion during the review period. This increase was due almost entirely to a rise in net autonomous factors by €21.6 billion to €2,443.7 billion (see the section of Table A entitled “Other liquidity-based information”), while minimum reserve requirements increased by only €3.7 billion to €159.1 billion.
Liquidity-absorbing autonomous factors rose during the review period by €63.4 billion to €3,385.3 billion, owing to increases in other autonomous factors and banknotes in circulation. Other autonomous factors (see Table A below for further information) increased during the review period by €42.3 billion to €1,145.7 billion. Banknotes in circulation increased by €33.6 billion to €1,596.9 billion, indicating a return to pre-pandemic patterns. The increased precautionary demand in some jurisdictions following the Russian invasion of Ukraine levelled off at the end of the second maintenance period. This meant that the average of the first and second maintenance period did not follow its typical seasonal pattern, which is usually characterised by the return of banknotes following the Christmas period and the end of the year. Government deposits decreased only slightly by an average of €12.4 billion and remained at an average of €642.7 billion. This contrasts with the record high average of €749.0 billion in the sixth maintenance period of 2020, when euro area governments increased their precautionary liquidity buffers in response to the outbreak of the coronavirus (COVID-19) pandemic and heightened uncertainty over revenues and expenditures.
Liquidity-providing autonomous factors increased by €42.0 billion to €942.0 billion. This increase mainly reflects a €38.1 billion rise in net foreign assets. Overall, the rise in liquidity-absorbing autonomous factors more than offset these developments, so that net autonomous factors contributed to a decrease in excess liquidity.
Table A provides an overview of the autonomous factors[1] discussed above and their changes.
Table A
Eurosystem liquidity conditions
Liabilities
(averages; EUR billions)

Source: ECB.
Notes: All figures in the table are rounded to the nearest €0.1 billion. Figures in brackets denote the change from the previous review or maintenance period.
1) Computed as the sum of the revaluation accounts, other claims and liabilities of euro area residents, capital and reserves.
2) Memo item that does not appear on the Eurosystem balance sheet and therefore should not be included in the calculation of total liabilities.
3) Exempted and non-exempted excess reserves are explained on the ECB’s website.
Assets
(averages; EUR billions)

Source: ECB.
Notes: All figures in the table are rounded to the nearest €0.1 billion. Figures in brackets denote the change from the previous review or maintenance period.
Other liquidity-based information
(averages; EUR billions)

Source: ECB.
Notes: All figures in the table are rounded to the nearest €0.1 billion. Figures in brackets denote the change from the previous review or maintenance period.
1) Computed as the sum of net autonomous factors and minimum reserve requirements.
2) Computed as the difference between autonomous liquidity factors on the liability side and autonomous liquidity factors on the asset side. For the purposes of this table, items in the course of settlement are also added to net autonomous factors.
3) Computed as the sum of current accounts above minimum reserve requirements and the recourse to the deposit facility minus the recourse to the marginal lending facility.
Interest rate developments
(averages; percentages)
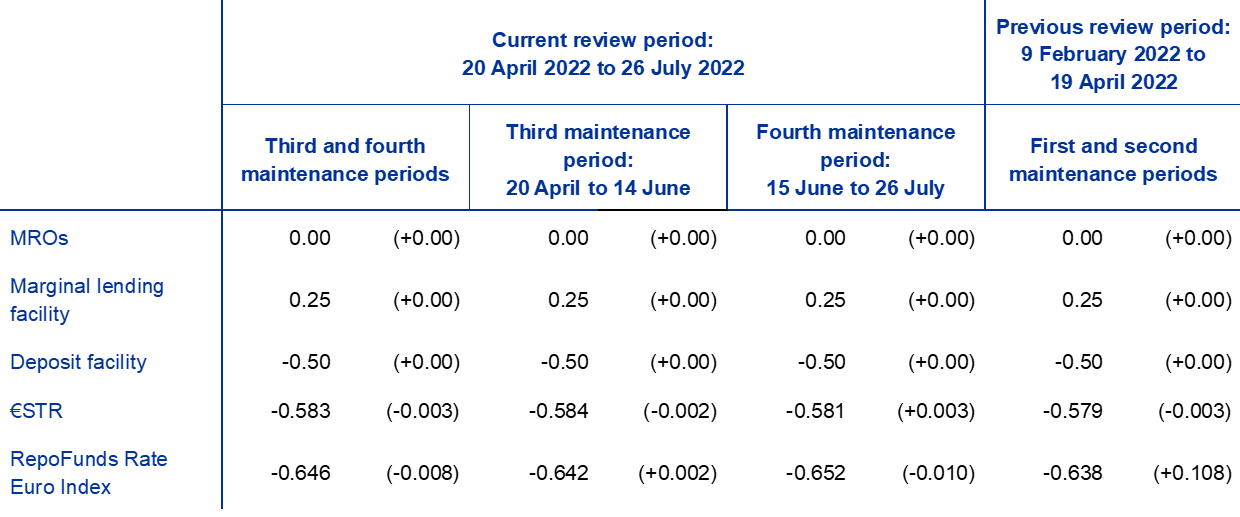
Sources: ECB and CME Group.
Note: Figures in brackets denote the change from the previous review or maintenance period.
Liquidity provided through monetary policy instruments
The average amount of liquidity provided through monetary policy instruments increased by €59.5 billion to €7,125.9 billion during the review period (Chart A). This increase mainly took place during the third maintenance period and was due to continued APP net purchases. During the fourth maintenance period net purchases under the APP ended on 1 July and voluntary repayments under TLTRO III were settled, resulting in a decline in excess liquidity.
Chart A
Evolution of liquidity provided through open market operations and excess liquidity
(EUR billions)

Source: ECB.
Note: The latest observations are for 26 July 2022.
The average amount of liquidity provided through credit operations decreased by €22.5 billion during the review period. This decrease was mostly the result of voluntary TLTRO III repayments of €74.1 billion made at the end of June, the full effect of which on review period averages will only become apparent in the next maintenance period. The main refinancing operations (MROs) and three-month longer-term refinancing operations (LTROs) continued to play only a marginal role, with the average recourse increasing slightly to €0.4 billion and €0.2 billion respectively compared with the previous review period.
At the same time, outright portfolios increased by €82.0 billion to €4,947.6 billion owing to net purchases under the APP. The APP developments were mainly driven by net purchases under the public sector purchase programme, which increased on average by €54.2 billion to €2,579.8 billion. Net purchases under the corporate sector purchase programme increased on average by €14.5 billion to €341.1 billion. The other programmes under the APP saw only marginal changes. Average holdings in the pandemic emergency purchase programme (PEPP) stand at €1,696.6 billion. Although net purchases under the PEPP were discontinued at the end of March 2022, reinvestments of maturing principal amounts continue. Maturing securities held in non-active programmes, including the Securities Markets Programme and the first and second covered bond purchase programmes, reduced their aggregate size by €1.4 billion.
Excess liquidity
Average excess liquidity increased by €34.1 billion, reaching a new record high of €4,523.1 billion (Chart A). It reflects the difference between the total liquidity provided to the banking system and banks’ liquidity needs. Banks’ current account holdings in excess of minimum reserve requirements (excess reserves) grew by €84.3 billion to €3,843.0 billion, while the average recourse to the deposit facility decreased by €50.2 billion to €680.2 billion. Daily excess liquidity peaked on 14 June, the last day of the third maintenance period, at €4,622.4 billion.
Excess reserves exempt from the negative deposit facility rate under the two-tier system[2] increased by €19.1 billion to €942.2 billion. Non-exempt excess liquidity, which includes the deposit facility, increased slightly by €7.4 billion to reach €3,573.4 billion. The aggregate utilisation rate of the maximum exemption allowance, i.e. the ratio of exempted reserves to the maximum exempted amount[3], has remained above 98% since the third maintenance period of 2020. During the current review period it was marginally lower at 98.7%, compared with 99.0% in the previous review period. The share of exempted excess reserves in total excess liquidity stood at 20.8%, compared with 20.6% in the previous review period.
Interest rate developments
The average €STR remained broadly unchanged at -58.3 basis points during the review period. Owing to the high level of excess liquidity, the €STR continues to be relatively inelastic, even in response to substantial fluctuations in liquidity. The ECB policy rates – the rates on the deposit facility, MROs and the marginal lending facility – were left unchanged during the review period. The 50-basis point hike in the ECB policy rates only came into effect after the review period ended, and its influence will be reviewed in the next box on liquidity conditions.
The average euro area repo rate, measured by the RepoFunds Rate Euro Index, also remained broadly unchanged at -64.6 basis points. Despite the average level remaining largely unchanged, the end-of-quarter pattern was particularly pronounced at the end of June, when the RepoFunds Rate Euro Index recorded a level of -1.145% – the lowest, excluding year-ends, since October 2014.
For further details on autonomous factors, see the article entitled “The liquidity management of the ECB”, Monthly Bulletin, ECB, May 2002.
More information about the two-tier system for remunerating excess reserve holdings is available on the ECB’s website.
The maximum exempted amount is measured as the sum of the minimum reserves and the exemption allowance, which is equal to six times the minimum reserves amount.