
Understanding post-referendum weakness in UK import demand and UK balance of payments risks for the euro area
Published as part of the ECB Economic Bulletin, Issue 3/2021.
1 Introduction
The UK referendum on EU membership in 2016 has set the course for the most significant change to the relationship between the United Kingdom and its closest trading partners for decades. The primary interest from the ECB’s perspective is to understand the likely impact on trade of the departure of the United Kingdom from the European Union, as the United Kingdom has long been one of the euro area’s major export markets.
This article reviews the development of UK import demand and balance of payments since the referendum in order to assess the likely implications for euro area foreign demand.[2] It focuses on early insights into factors which have affected UK imports in the period between the referendum and the start of the coronavirus (COVID-19) pandemic. The departure of the United Kingdom from the EU could potentially result in some disruption to euro area export growth in the coming years if, for instance, UK import demand is reduced or diverted as a consequence of Brexit.
The United Kingdom has long been a major trading partner for the euro area, accounting for around 14% of euro area foreign demand over the period 2016-18 (Chart 1). Until the mid-2010s, when the 2015 general election paved the way for the referendum, the United Kingdom had been the euro area’s largest single trading partner – even ahead of the United States. Developments in foreign demand are a major determinant of euro area GDP growth as non-euro area imports and exports of goods and services amount to around half of euro area GDP.
Chart 1
Euro area export destinations
(share of exports of goods and services, 2016-18 average)
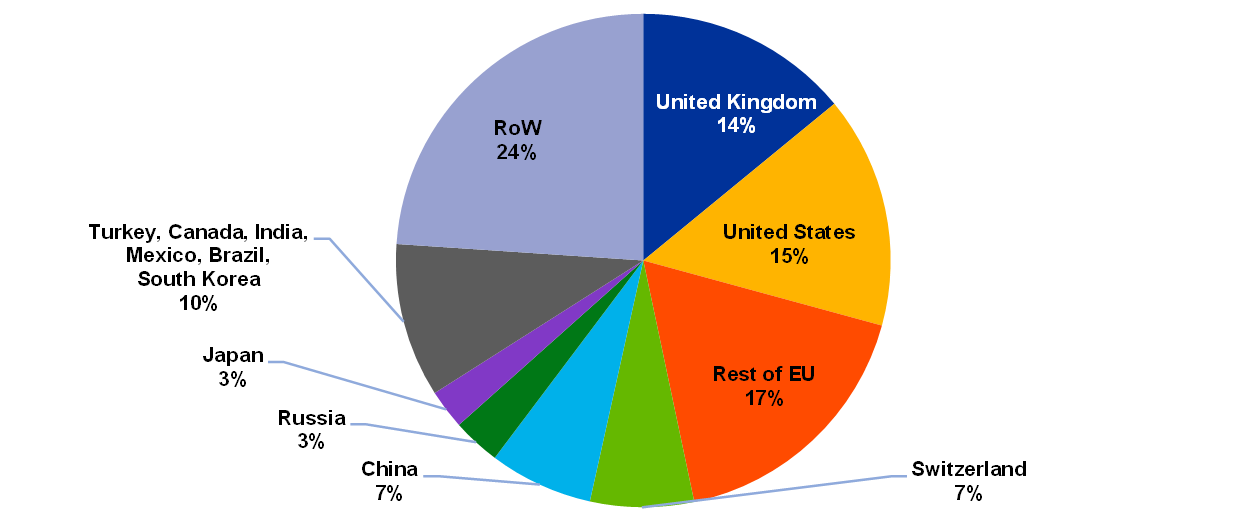
Source: ECB staff calculations.
Note: RoW stands for the rest of the world.
Since the 2016 referendum, the UK’s share of euro area foreign demand has fallen somewhat, largely reflecting a notable slowdown in the growth of UK imports from the EU and, correspondingly, a sizeable drag on euro area exports (Chart 2). A marked deceleration in the growth of UK import demand since the end of 2017 has exacerbated a broader slowdown in the growth of non-euro area foreign demand, which has weighed on euro area export growth. In addition, uncertainties surrounding the various Brexit deadlines throughout much of 2019 and 2020 resulted in considerable quarterly volatility in the UK component of euro area foreign demand.
Chart 2
Euro area exports to non-euro area countries
(annual percentage changes of three-month moving averages, monthly data)
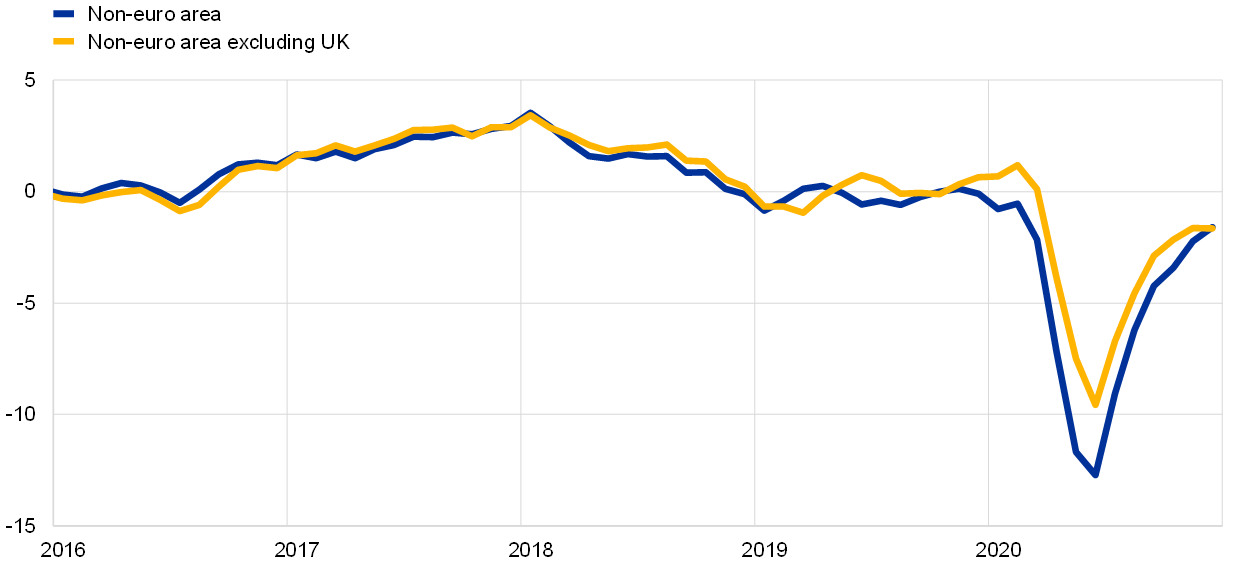
Sources: Eurostat and ECB staff calculations.
Notes: Exports of goods and services. The latest observation is for December 2020.
2 Key features of UK trade dynamics
The UK’s import propensity has almost trebled since the end of the Second World War, a trend that is particularly clear following the UK’s accession to the European Economic Community (later the European Union) (Chart 3). Notable increases in the UK import propensity are evident following the country’s accession to the European Economic Community in the early 1970s and more especially following the creation of the single European market in the early 1990s. Over this period, UK imports rose from a share of just under 14% of GDP in the early 1970s to around 20% in 1991 (on the eve of the creation of the single market), with a further marked increase to just under 30% by 2007 – largely on account of strong growth in imports of EU goods. The increase over this period was also reflected in a tangible rise in UK exports, resulting in a higher degree of UK trade openness. The share of total foreign trade (exports and imports) in GDP went on to expand from around 20% to around 60% by the mid-2010s. From a euro area perspective, UK imports rose as a proportion of euro area foreign demand, from around 12% at the time of Economic and Monetary Union in 1999 to almost 16% – the largest single recipient – at its peak in 2006.
Chart 3
UK trade openness since 1950
(real exports and imports as a % of UK GDP)

Sources: Bank of England (dataset “A millennium of macroeconomic data for the UK”), Eurostat and ECB staff calculations.
Note: The latest observation is for 2019 (Bank of England data updated from 1995 from national accounts data).
UK import growth slowed markedly following the worldwide disruption to international trade during the global financial crisis. UK import growth has almost halved since the global financial crisis, with the annual rate averaging just over 3% over the period from 2011 to 2019 compared with just over 6% between 1992 and 2007 (Chart 4). As a result, by the end of 2019 the share of imports in UK GDP was almost unchanged from pre-crisis levels – albeit subject to considerable temporary volatility around episodes associated with Brexit-related deadlines in 2019 (Box 1). These aspects have demonstrably weighed on euro area export growth (Chart 2).
Chart 4
Real UK import growth since 1950
(annual percentage change)

Sources: Bank of England (dataset “A millennium of macroeconomic data for the UK”) and ECB staff calculations.
Note: The latest observation is for 2019 (Bank of England data updated from 1995 from national accounts data).
Leaving aside the volatility of 2019-20, the marked slowdown in pre-pandemic UK import growth seen since the referendum was particularly strong for EU and euro area goods. A breakdown of UK imports over the past two decades shows that the recent deceleration has largely concerned imports of goods from the EU (Chart 5).
Chart 5
UK imports by source and category
(GBP billions)

Sources: Eurostat, Office for National Statistics and ECB staff calculations.
Notes: RoW stands for the rest of the world. The latest observation is for 2019.
Since mid-2015, the growth in UK imports of goods from the EU and the euro area has been on a consistently downward curve, in marked contrast to more volatile developments from the (non-EU) rest of the world (Chart 6). While some of the difference can be traced to the high volatility associated with non-EU trading in non-monetary gold, the clear and almost monotonic decline in euro area/EU imports over this period warrants a timely assessment of recent UK import developments and their likely drivers.
Chart 6
UK imports and selected sub-groups
(volumes, annual percentage changes of three-month moving averages)

Sources: Eurostat, Haver Analytics and ECB staff calculations.
Notes: Annual percentage changes of three-month moving averages from monthly data. The latest observation is for January 2020.
Box 1
The volatility of UK import growth since 2019 and the role of stockbuilding
UK import growth was erratic in 2019 – driven in part by firms stockpiling in response to heightened fears of a no-deal Brexit in advance of various (missed) Brexit deadlines. This box explores the linkages between UK imports and Brexit-related stockpiling in the run-up to Brexit deadlines.
Survey indicators of UK inventory dynamics have consistently signalled Brexit-related stockpiling in 2019 and 2020. The PMI stockbuilding indicator[3] offers timely insights into Brexit-related stockpiling. At the most prominent point, fears of an imminent no-deal Brexit in the run-up to the original 29 March 2019 Brexit deadline led to a surge in UK inventories. As shown in Chart A, this caused the PMI stockbuilding indicator to surge to unprecedented levels, even from an international perspective. Similar developments also look to have been underway in the final quarter of 2020 in advance of the end of the transition period, although the picture is somewhat clouded by pandemic-related disruptions.
Chart A
PMI stockbuilding indicator
(diffusion index)

Sources: Haver Analytics and ECB staff calculations.
Notes: The shaded area refers to the range of monthly values recorded for 2008-18 in the United Kingdom and 2008-20 in France, Germany, Ireland, Italy, Japan, the Netherlands, South Korea, Spain, Switzerland and the United States. The latest observation is for March 2021.
UK imports rose markedly ahead of the original 29 March 2019 Brexit deadline, in line with the sharp increase in Brexit-related stockpiling of goods from the EU. In consequence, UK imports surged, increasing by almost 7% quarter on quarter – an almost 40-year high. This resulted in a record (nominal) trade deficit in the first quarter of 2019. Chart B shows that the volatility in UK imports over the course of 2019 was heavily concentrated in imports of goods from the EU, leading to an almost direct correspondence between the two series.
Chart B
UK import growth and stockbuilding
(quarterly percentage change for import growth, quarterly percentage point changes in indicator)

Sources: Eurostat, Office for National Statistics and ECB staff calculations.
Notes: RoW stands for the rest of the world. The changes in the PMI stockbuilding indicator are given as the difference in the three-month averages of the indicator.
The marked increase in UK imports from the EU in the first quarter of 2019 was followed by an equally sharp decrease in the following quarter. This pattern was repeated to varying extents around the various Brexit deadlines (Chart C). With the end of the Brexit transition period approaching in the final months of 2020, survey data again showed a marked surge in inventory build-up for the final quarter of the year. As Chart C demonstrates (on a month-on-month basis), the PMI stockbuilding indicator rose markedly in November 2020 – i.e. one month ahead of the end of the Brexit transition period and somewhat out of step with the typical stockpiling patterns seen in advance of other Brexit deadlines (where the bulk of stockbuilding had usually occurred only in the month preceding the deadline) – which the PMI compilers noted “was almost exclusively attributed to Brexit uncertainty and a subsequent build-up of critical inputs before the end of the transition period”[4] and not simply a reaction to pandemic-related disruptions earlier in the year.
Additional pandemic-related disruptions in the second half of December seem likely to have dampened final stockbuilding efforts at the end of 2020, while the January offset was particularly sharp, leading to a contraction in imports of goods from the euro area in that month, as seen around earlier Brexit deadlines. While the pandemic continued to cause disruption at this time, the initial data on euro area exports in the first quarter of 2021 suggest a clear disconnect in UK-euro area trading patterns at the start of the year. Exports of euro area goods to the United Kingdom fell by almost a third month on month in January, while imports more than halved. By contrast, intra-euro area goods exports grew strongly, most likely as a direct consequence of diverted trade flows, particularly to Ireland.
Chart C
Evolution of the PMI stockbuilding indicator ahead of Brexit deadlines
(monthly percentage point change in diffusion index, t=0 at month of expected Brexit deadline)

Sources: Haver Analytics and ECB staff calculations.
Notes: Following the passing of the “Benn Act” in late September 2019, the 31 October 2019 Brexit deadline was subsequently postponed to 31 January 2020, immediately reducing the need for further stockpiling in October 2019. The latest observation is for March 2021.
3 Recent drivers of UK import demand
As UK real GDP growth has slowed progressively since the referendum, imports have also declined, adversely impacting euro area foreign demand. The United Kingdom fell from being one of the G7’s best performers in advance of the referendum to its worst performer by 2020.[5] The post-referendum decline in GDP growth is evident across most expenditure components (Chart 7), particularly private consumption and investment, while sterling’s depreciation since the referendum has helped to bolster net exports.
Chart 7
UK real GDP growth and contributions
(annual percentage changes and percentage point contributions)
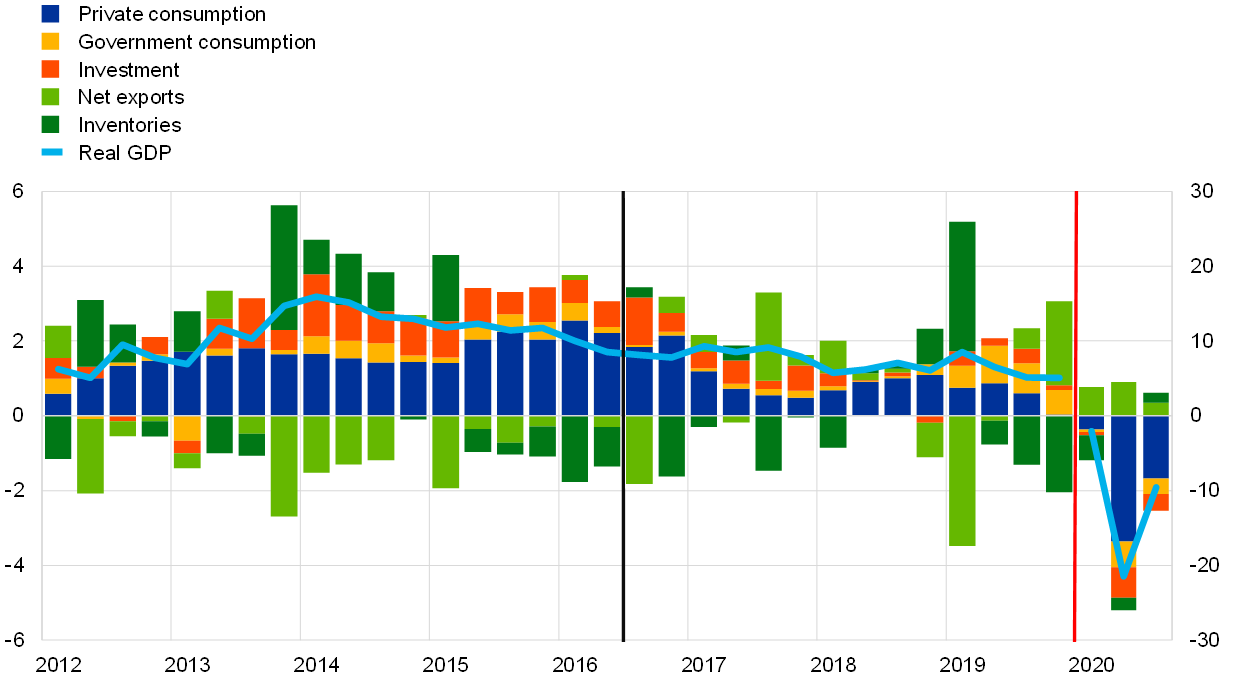
Sources: Eurostat and ECB staff calculations.
Notes: Beyond the red line, the scale is on the right-hand axis; the black line indicates the Brexit referendum date. The latest observation is for the third quarter of 2020.
The very swift and marked depreciation of sterling likely goes some of the way to explaining the marked slowdown in import growth.[6] After several years well above its long-term average, sterling depreciated sharply – particularly against the euro – from mid-2015, as the prospect of a referendum on EU membership became a reality. A further, stronger depreciation followed the referendum result, with sterling weakening against all major currencies, and particularly the euro. This led to a rising import bill in terms of nominal imports as a share of GDP (Chart 8). While this measure has been co-moving with the nominal effective exchange rate (NEER-38) over the last 20 years, this is not the case for real imports as a share of GDP. A decline in the purchasing power of British consumers after mid-2015 has been a major transmission channel of pound sterling to the economy.
Chart 8
UK imports and NEER-38
(left-hand scale: percentages of GDP, four quarter moving averages; right-hand scale: index: 1999-2014 average = 100)

Sources: Bank of England, Eurostat and ECB staff calculations.
Notes: The nominal effective exchange rate (NEER-38) is a trade-weighted average of nominal bilateral rates between the pound and a basket of 38 foreign currencies. NEER indexed in relation to its 1999-2014 average, lagged two quarters. The latest observations are for the fourth quarter of 2020 for NEER-38 and the third quarter of 2020 for imports.
UK consumption growth decelerated markedly as the strong depreciation of sterling quickly fed through to domestic inflation. The import deflator has been strongly correlated with the exchange rate against the euro (Chart 9). In particular, the depreciation of sterling in 2016 led to immediate movements in the import deflator. It has also been the major driver of CPI inflation, with higher import prices accounting for around two-thirds of the annual increase in the Consumer Price Index (CPI).[7] The negative effects from terms of trade squeezed household incomes, resulting in both a reduction in import demand and a notable deceleration of consumption growth.
Chart 9
UK nominal exchange rate and inflation
(left-hand scale: annual percentage changes, right-hand scale: exchange rate)

Sources: Bank of England, Eurostat and ECB staff calculations.
Note: The latest observation is for the fourth quarter of 2020.
A marked slowdown in UK investment may also be a factor behind the lower rate of UK import growth since the referendum. Elevated uncertainty in the post-referendum period resulted in a marked slowdown in UK investment – particularly business investment – which fell from annual growth rates of 3.8% between 2011 and 2015 to an annual average of 1.7% over the period from 2017 to 2019. This exacerbated the deceleration in UK import growth, given the typically higher import intensity of investment compared to other expenditure components. From a euro area perspective, the slowdown evident in UK investment since the referendum is of particular concern. The typically high (40%) share of capital goods in total UK goods imports from the EU (and from the euro area in particular) had been a substantial source of export growth over previous decades.
The post-referendum decline in UK import growth comes despite a considerable rise in UK export growth, particularly to the euro area (Chart 10), supported by a depreciating currency. While value chain effects had led UK exports to drive imports in advance of the referendum, this effect appears to have been limited in the post-referendum period.[8]
Chart 10
UK import and export growth
(annual percentage changes)

Source: National accounts.
Notes: RoW refers to rest of the world. Chain-linked volumes of goods and services, quarterly data. The latest observation is for the third quarter of 2020.
Internal ECB estimates suggest initial signs of UK import propensity falling since the referendum. We use an error correction model (ECM) for UK import volumes to assess the significance of the notable reduction in real import volume growth. This entails regressing UK imports against the remaining total final expenditure (TFE[9]) components (weighted by their share in imports given input-output tables) and relative prices of imports versus domestic prices (see Box 2 for details). The estimation period encompasses a subsample covering the period from the second quarter of 1995 to the second quarter of 2015, when the general election in the United Kingdom paved the way for the referendum. Using the parameter estimates from this model to project imports based on the actual values of the remaining TFE components and relative prices results in a significant gap between predicted and actual UK import volumes in 2017 and 2018 on the basis of an in-sample forecast (Chart 11). The path of real imports is significantly lower than implied by the model specification – at least, before the gap closes as a result of the strong stockpiling seen in advance of the original 29 March 2019 Brexit deadline.
Chart 11
UK real imports and model prediction based on weighted GDP components and relative prices
(GBP billions in 2015 prices, quarterly)

Source: ECB staff calculations.
Notes: MTR (total real imports) refers to real imports into the United Kingdom. MTRF (forecast total real imports) refers to an in-sample forecast based on an error correction model in which import volumes are regressed on the remaining components of total final expenditure, relative import versus domestic prices and an error correction term. The vertical black line indicates the Brexit referendum date. The latest observation is for the second quarter of 2019.
From a sectoral perspective, vehicles and pharmaceutical products have largely driven the deceleration in UK import growth – particularly from its EU and euro area trading partners. Machinery/transport and chemicals/pharma imports have dropped significantly in the post-referendum period (Chart 12). In particular, vehicles and pharmaceutical products, which had accounted for some 12% and 6% respectively of exports from the euro area to the United Kingdom on the eve of the referendum, have fallen from stable double-digit positive growth to double-digit negative growth. Both categories of goods together have an adverse impact of around 4 percentage points on UK import growth from peak (mid-2016) to trough (mid-2018). The marked deceleration in import growth driven by a substantial reversal of these two categories may account for the gap between demand-implied and realised real import growth and can be traced to Brexit-related drivers.
Chart 12
UK goods imports by sector and source
(volumes; annual percentage change of three-month moving averages and percentage point contributions)

Sources: Office for National Statistics and ECB staff calculations.
Notes: RoW stands for the rest of the world. Beyond the red line, the scale is on the right-hand axis. Goods imports excluding unspecified. “Machinery/transport” includes cars and vehicle components. “Food/beverages” includes live animals, tobacco, fats and vegetable oils. Quarterly data, seasonally adjusted. Disaggregated at classification of products by activity (CPA) 2-digit level. The latest observation is for the fourth quarter of 2020.
Vehicles and chemicals have long been held to be particularly vulnerable to Brexit. This is due to the potential impact of additional frictions in EU-UK trade and value chains following the end of the transition period.[10] EU countries with high sectoral shares of vehicles (most notably Germany, as well as the countries in central and eastern Europe linked to German value chains) and chemicals (including Ireland, Denmark and Slovenia) are likely to be disproportionately affected by Brexit disruptions in the short term. Further ahead, however, euro area foreign demand will hinge on the impact of the new trading regime on the UK’s ability to substitute EU imports with domestic production and imports from the rest of the world together with the impact on UK purchasing power.
Box 2
An error correction model for UK import demand
This box describes an error correction model (ECM) for UK real imports. This involves regressing UK imports against the remaining final expenditure components over the subsample from the first quarter of 1995 to the second quarter of 2015.
Estimation of long-run and dynamic relationships
We define the variable WER as the real expenditure components weighted by their average shares in real imports in input-output tables in 2013-14.
The estimated equation suggests a long-term relationship of the form:
where WER refers to real weighted expenditure, MTR to real imports, PCR to real private consumption, GCR to real government consumption, ITR to real investment, XTR to real exports and MTD/YED to the ratio of the import deflator to the GDP deflator.
The error term from the long-run equation is employed as RESID_MTR, yielding a dynamic relationship[11] as:
where RESID_MTR refers to the residual of the long-run equation.[12]
In-sample projection
The projection has been performed as an in-sample projection (Q3 2015-Q2 2019) with the respective realised values for the variables entering the dynamic equation for changes in MTR. This reflects the information from the demand components and the error correction term. The residual from the long-term equation is employed for the projection.
4 The impact of Brexit on the UK balance of payments
Prior to the initial Brexit deadline of 29 March 2019, the UK current account had seen a persistent and widening deficit for more than a decade (Chart 13). Over the same period, however, the UK’s trade deficit had been broadly stable despite some recent volatility. The secondary income account had also displayed a constant deficit. By contrast, movements in the primary income deficit had emerged as the main driver in the current account.
Chart 13
Current account balance
(percentage of GDP, cumulated over previous four quarters)

Sources: Haver Analytics, Office for National Statistics and ECB staff calculations.
Notes: The latest observation is for the fourth quarter of 2020. The black line indicates the Brexit referendum date.
The UK trade deficit had long been driven by net trade developments with the EU (Chart 14), with a similar pattern involving the euro area also evident. At the same time, the UK trade balance with the rest of the world had been positive for a considerable period. Between 2012 and the Brexit referendum, the trade deficit with the EU widened. It narrowed again thereafter, before stockpiling ahead of various 2019 Brexit deadlines drove UK trade deficits with the EU and the euro area to record levels. While the deficit broadly stabilised at around 5% of GDP in the aftermath of the global financial crisis, Brexit-related (and more recently also pandemic-related) disruptions have resulted in greater volatility since the middle of the 2010s.[13]
Chart 14
Trade balance
(percentage of GDP, cumulated over previous four quarters)
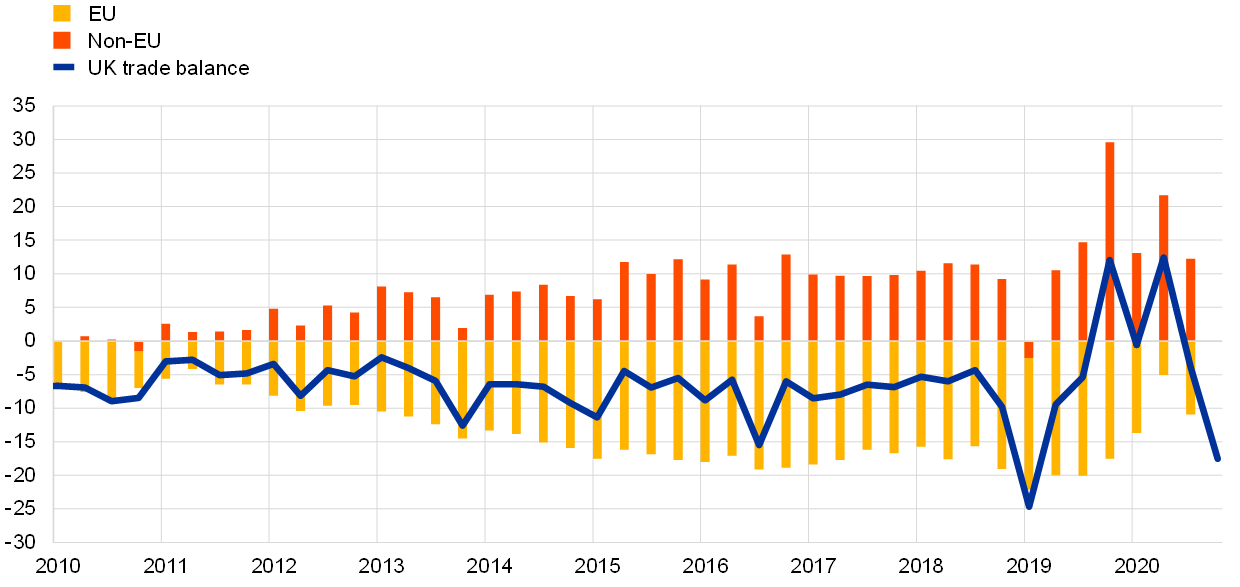
Sources: Eurostat, Office for National Statistics and ECB staff calculations.
Note: The latest observations are for the second quarter of 2020 for the EU and non-EU breakdown and the third quarter of 2020 for the UK trade balance.
Direct Brexit-related effects in the current account balance are likely to play an important role going forward, given that around half of the UK’s deficit in its secondary balance is due to net contributions to EU institutions. The secondary balance has been in deficit for a long time. The United Kingdom’s departure from the EU means that it has ceased to contribute to the common EU budget, which can be expected to reduce the deficit in its secondary income account. For the euro area as a whole, this means a reduction of net flows into the secondary account.
In just over a decade, the UK’s primary income account has moved from balance into a marked deficit (Chart 15) that even surpasses the trade deficit. While other earnings categories, such as net earnings on debt securities, have typically remained relatively stable, the sharp decline in net earnings on foreign direct investment (FDI) was a major factor behind the deterioration in the UK primary income balance measured between 2011 and 2015.[14]
Chart 15
Breakdown of the primary income balance into net earnings by category
(percentage of GDP, cumulated over previous four quarters)

Sources: Haver Analytics, Office for National Statistics and ECB staff calculations.
Note: The latest observation is for the third quarter of 2020.
The depreciation in sterling following the referendum had a short-run positive effect on the UK’s primary balance. In 2016 the primary income balance showed some signs of improvement. The sharp depreciation in sterling which accompanied Brexit-related concerns around the time of the referendum, increased net FDI earnings, while payments on debt securities were hardly affected, resulting in a short-run positive effect on the balance of payments from 2016 to 2018. Movements in net FDI earnings were strongly correlated with the GBP/EUR exchange rate after 2009 – with a correlation coefficient of 97%. This stems from the fact that domestic currency depreciation boosts income from abroad due to compositional effects. Valuation gains have materialised in net foreign assets thanks to the depreciation of sterling.
FDI net inflows into the financial account have fallen since the referendum.[15] FDI net inflows did not see an immediate negative reaction in 2016, as evidenced by a lag in the reversal of such flows. They eventually declined in the course of 2017 and 2018 on the back of increased uncertainty surrounding the UK’s long-term economic prospects.
In the longer run, the UK’s capacity to continue running trade deficits with the EU and the euro area at current levels will depend on steady inflows into the financial account. The new trading environment set by the EU-UK Trade and Cooperation Agreement could result in lower demand for the UK’s financial assets – possibly due to its former EU partners turning towards financial centres in other EU member states. At the same time, the ability of the United Kingdom to fund its current account deficit at the levels seen over the past decade could be reduced. By contrast, some argue that a weaker pound could attract global FDI investors in search of undervalued assets, potentially causing FDI inflows to increase in the longer run following the large depreciation of sterling. Such FDI inflows may precede export surges.[16] So far, no sustained increase in exports has been evident – although this could be due to the short period since the end of the Brexit transition arrangements together with pandemic-related distortions. However, it could be that this will not occur further out, given that Brexit might well lead to EU demand being redirected towards other EU countries. With potentially more limited options in terms of the financial account offsets to its current account deficits following Brexit, the United Kingdom would need to reduce its trade deficit through either higher exports to, or lower imports from, its main trading partners. This raises risks for EU and euro area foreign demand.
5 Concluding remarks
Considerable uncertainty surrounds the longer-term consequences of Brexit for both UK trade and euro area foreign demand. Large-scale distortions to UK trading patterns – from Brexit-related stockpiling and also pandemic-induced supply chain disruptions throughout 2020 – have made it hard to discern the initial signs of longer-term trends. Nevertheless, some indications of weakening demand for imported goods from EU sources have been evident since the referendum. This is probably in part a consequence of the sharp depreciation of sterling. Sectoral import data provide some evidence that Brexit is already having a strong impact in some areas, most notably the automotive and pharmaceutical industries. This is likely to have affected UK import demand from EU countries – even in advance of any material change in the trading environment up until the end of 2020. The sustainability of the trade deficit with the EU/euro area will also likely depend in part on steady positive net inflows into the UK’s financial account. Ultimately the impact on euro area foreign demand and broader growth will depend on the extent to which the United Kingdom can move away from euro area suppliers over the longer term and the extent to which alternative (and perhaps internal) euro area networks can be established to provide those services mainly sourced from the United Kingdom in the past.
- We would like to thank Florian Forsthuber for data assistance and Andrejs Semjonovs (now Latvijas Banka) for earlier input.
- We focus on the impact on euro area foreign demand. For data availability reasons, where necessary we refer to EU figures.
- PMI manufacturers’ additions (or otherwise) to stocks for the purpose of selling on or using in production.
- See Markit, News Release for Flash UK PMI (16 December 2020). A survey by the Bank of England’s Agents suggests that stockpiling was planned only for the final months of the year (Bank of England, Monetary Policy Report (November 2020), pp. 38-42).
- See also Born, B.G., Müller, G.J., Schularick, M. and Sedláček, P., “The Costs of Economic Nationalism: Evidence from the Brexit Experiment”, The Economic Journal, Vol. 129, Issue 623, October 2019, pp. 2722-44.
- The June 2016 referendum led to an immediate and pronounced depreciation of sterling against the currencies of the UK’s main trading partners, but particularly against the euro. The financial markets first showed clear signs of concern about a possible Brexit vote in 2015, immediately after the Conservatives’ general election victory. Having peaked at levels somewhat above its long-run (1999-2014) average early in 2015, sterling fell by around 10% by the eve of the referendum, before remaining around 15% below its 2015 peak in the four and a half years following the referendum. Considerable volatility emerged from the end of 2018 in response to growing fears of a disorderly no-deal outcome in advance of the various Brexit deadlines until agreement was finally reached just days before the end of the transition period.
- See the Bank of England Inflation Report (November 2017), particularly the discussion around Charts 2.10 and 4.5-4.6.
- This episode differs markedly from sterling’s depreciation seen over the course of the 2008-09 global financial crisis, when export and import dynamics were largely synchronised.
- Total final expenditure of private consumption, government consumption, investment expenditure and exports.
- Bailey, D. and Rajic, I., “UK manufacturing welcomes the deal in as far as it goes”, Commentary, UK in a Changing Europe, 29 December 2020.
- All parameter estimates are significant at the 99% level.
- R-squared = 0.62, DW = 2.01.
- The movement in the trade balance ranges from a record deficit in the run-up to the original 29 March 2019 Brexit deadline to a surplus of around 15% in the second quarter of 2020, when a pandemic-related national lockdown and severe supply chain disruptions caused UK import volumes to contract sharply. The trade balance has also been significantly impacted since the start of the pandemic by the collapse in trade in travel services, a sector in which the United Kingdom has been the single most significant contributor to the euro area’s net trade surplus; see the box entitled “Impact of the COVID-19 lockdown on trade in travel services”, Economic Bulletin, Issue 4, ECB, 2020.
- This development can be attributed to a reversal in the underlying net FDI position and a reduction in the income yield differential between FDI assets and FDI liabilities. See Lane, P.R., “A financial perspective on the UK current account deficit”, National Institute Economic Review, Vol. 234, November 2015, F67-72.
- As a counterpart to the current account deficit, the financial account is in surplus. The United Kingdom is a global financial centre that draws in foreign capital, and this access to external financing has helped it to finance its current account deficit. Portfolio investment and FDI inflows have been positive drivers of the UK financial account.
- See Lederman, D., “Large devaluations, foreign direct investment and exports: A speculative note”, Policy Research Working Papers, World Bank Group, 2011.