
Multinational enterprises, financial centres and their implications for external imbalances: a euro area perspective
Multinational enterprises, financial centres and their implications for external imbalances: a euro area perspective
Published as part of the ECB Economic Bulletin, Issue 2/2020.
This article analyses how the operations of large multinational enterprises (MNEs) affect the external account of the euro area and, in general, financial centres. The increased ease of moving intangible assets, profits and headquarters across borders poses challenges to the current framework of international statistics and economic analysis. First, the article shows how MNE operations are recorded in cross-border statistics, as well as the challenges in measuring such data. Second, the article highlights evidence of the impact that MNEs have on the external account of the euro area – this is most evident in current account balances and foreign direct investment in euro area financial centres, often involving special-purpose entities (SPEs). Third, the article looks at the tendency of financial centres to report current account surpluses that may be tentatively attributed, in part, to the activity of MNEs. Multilateral initiatives could help to improve the transparency of MNE operations and ensure an exchange of information across borders for statistical and tax purposes.
1 Introduction
The rise of large, profitable, global firms and the mobility of intangible assets[1] have increased the relevance of firms’ profit-shifting activities, posing challenges to the current framework of international statistics. The balance sheets of large multinational enterprises (MNEs)[2] have become very sizeable. The assets of the largest listed companies in major advanced economies, amounting to a value of several hundred billions of US dollars, are roughly equal to the gross domestic product of many small open economies. In order to reduce their tax burden, MNEs carry out a range of activities: these include shifting profits to low-tax jurisdictions by manipulating transfer pricing[3] and shifting intra-company positions – often this involves complex financial structures and the creation of SPEs in low-tax, or no-tax, jurisdictions. These activities are extremely difficult to track. The novelty of some activities – in particular the growth in intellectual property products and improved opportunities to strategically choose their location – poses significant challenges for the existing framework of national and international statistics, which is based on the concept of residence[4].
International tax avoidance by MNEs is not a novel phenomenon but its rapid growth increasingly attracts the attention of academics and policy makers.[5] Global firms respond to tax incentives when recording worldwide income among affiliates. A recent survey of this literature finds that a decrease by one percentage point in the statutory corporate tax rate translates into a 1% expansion of before-tax income for global firms.[6] Importantly, this study shows that the estimated impact appears to be increasing over time. Transfer pricing and licensing seem to be the main channels of tax avoidance – these appear to be more important than financial planning.[7] International taxation may also alter the geography of foreign direct investment (FDI): a higher statutory tax rate in a target investment country discourages the acquisition of firms in that country, while lower tax burdens may attract FDI related to profit-shifting activities.[8] Another area of research focuses on the implications of these tax-avoidance activities for the measurement of the external wealth of nations and the diminished ability of governments when it comes to taxing the corporate profits of global firms.[9]
A number of policy initiatives at the international level have been launched to counteract the intensification of tax avoidance. The Organisation for Economic Co-operation and Development (OECD) estimates that 240 billion US dollars in tax revenues are lost globally every year as a result of tax avoidance by MNEs. As a result, the OECD and the G20 sponsored the Base Erosion and Profit Shifting (BEPS) Project, including an action plan that identifies 15 actions intended to limit international tax avoidance.[10] This initiative currently involves over 135 countries, including the European Union (EU) Member States. The EU built on the BEPS Project’s recommendations by adopting two Anti-Tax Avoidance Directives, which entered into force between 2019 and 2020. The EU reform package includes concrete measures to reduce tax avoidance, boost tax transparency and move towards a level playing field for all businesses in the EU, but also new requirements for MNE financial reporting (see Box 1).[11]
Box 1 Tax avoidance and transparency: policy initiatives at the international and EU level
At the international level, the OECD, with the support of the G20, championed work on limiting tax avoidance. The OECD/G20 BEPS Project, finalised in 2015, proposes measures to reduce tax avoidance; it also includes new requirements for MNE financial reporting, in particular for country-by-country reporting by 2025. Many of the recommendations of the OECD/G20 BEPS Project have been transposed at the EU level via the European Commission’s broad Anti-Tax Avoidance Package.[12] This package also includes the revision of the Administrative Cooperation Directive, proposing country-by-country reporting between Member States' tax authorities on key tax-related information concerning multinationals operating in the EU.
Statistical compilers need to closely cooperate internationally to ensure that MNE activities are recorded consistently from country to country. This means that they have to share confidential data on MNEs and their subsidiaries across borders. The GNI pilot project, launched by the European Statistical System Committee in 2018, takes steps in this direction; it aims to jointly assess the consistency of statistical recording among national statistical authorities, using a sample of 25 MNEs in Europe.
Moreover, some national statistical authorities have set up large case units to monitor the activities of MNEs nationally. However, no formal coordination exists yet at the international level. Further development of legal entity identifiers and business registers would also be instrumental in improving national accounts and b.o.p. statistics.[13]
The traces of MNE operations are particularly apparent in the external statistics of financial centres. Since the euro area hosts some significant financial centres, this article discusses the dynamics of their external accounts. We adopt a standard operational definition of financial centres on the basis of the size of their stock of foreign liabilities relative to GDP. These are therefore economies where financial activities tend to dominate domestic economic activity. In particular, financial centres are defined as the ten advanced economies with the largest ratios of foreign liabilities to GDP in a large sample of more than 60 countries. These ten financial centres include six euro area economies (Belgium, Cyprus, Ireland, Luxembourg, Malta and the Netherlands) and four non-euro area economies (Hong Kong SAR, Singapore, Switzerland and the United Kingdom).[14] Chart 1 shows the ratio of foreign liabilities to GDP for three groups of countries: advanced economies (excluding financial centres), financial centres and emerging market economies. In contrast to the effect it had on other advanced economies, the global financial crisis in 2008 does not appear to have dented the rise in the international financial integration of financial centres. In financial centres the median value of foreign liabilities increased, from around seven times GDP before the global financial crisis, to almost 11 times GDP at the end of 2018; the dispersion of the distribution of this statistic – foreign liability to GDP – markedly increased over the same period.
Chart 1
Ratio of total foreign liabilities to GDP
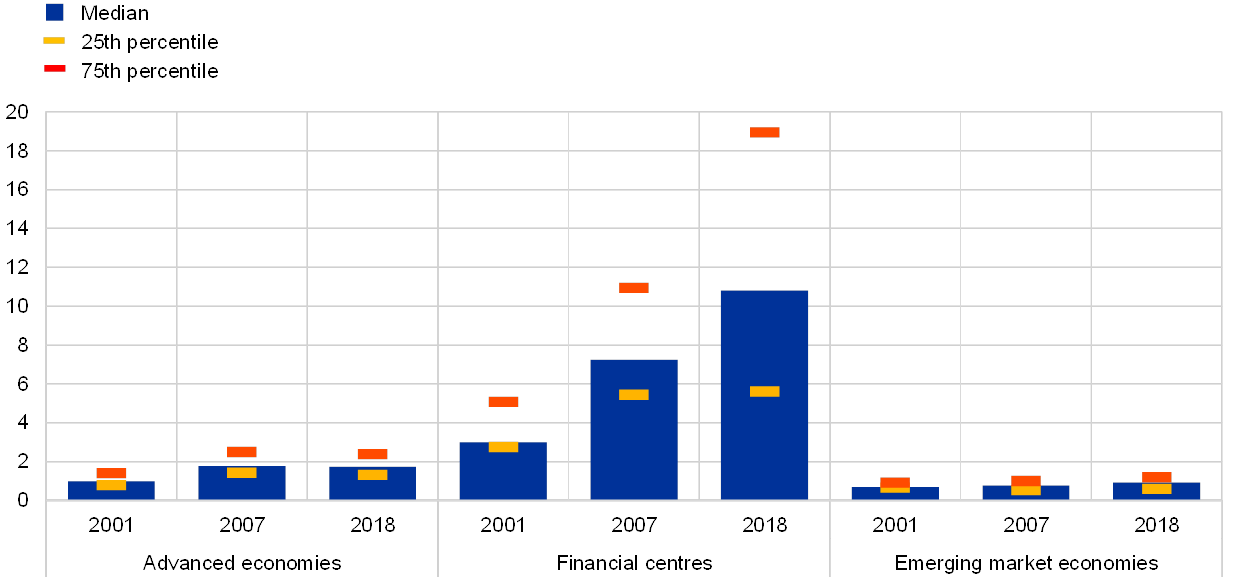
Sources: IMF Balance of Payments Statistics and ECB staff calculations.
The importance of MNEs within the global economy has increased over time – as has the role of financial centres. It is worth considering whether this has an impact on current account imbalances, particularly on those of large financial centres. Financial centres tend to record large current account surpluses: eight out of the ten financial centres, as defined in this article, had a current account surplus over the past two decades on average. However, each one has its own business model, which is reflected in the diverse composition of their current accounts. Chart 2 shows the breakdown of the current accounts of these economies into their main subcomponents since 2010, when the stock of FDI liabilities started to grow rapidly. For the first group of economies – Singapore, Switzerland, the Netherlands and Ireland – the current account surplus is mainly the outcome of a large surplus in the balance of goods. As explained in Section 2 and Section 3, the activities of MNEs (such as merchanting and contract manufacturing) may boost the goods balance of financial centres. For a second group of economies – Luxembourg, Malta and Hong Kong – the surplus is mostly due to the service balance, in turn driven by the financial services sector.
Chart 2
Average current account balances of financial centres between 2010 and 2018
(percentage of GDP)

Sources: IMF Balance of Payments Statistics and ECB staff calculations.
The correct measurement of external statistics, such as those discussed in this article, is important for central banks. Large external imbalances may raise concerns about the sustainability of economic growth and about financial stability, which can affect monetary policy and macroprudential policies. For instance, central banks monitor external accounts to assess the equilibrium value of exchange rates, while noting potential misalignments – this is because abrupt and significant corrections in exchange rates may influence inflation developments. A distorted representation of aggregate current account imbalances could provide flawed signals to policy makers.
This article is structured as follows. Section 2 explains how typical operations by MNEs are recorded in balance of payments (b.o.p.) and international investment position (i.i.p.) statistics; it also highlights relevant challenges faced when measuring these statistics. Section 3 aims to gauge the quantitative relevance of MNE operations for the external accounts of euro area countries, in particular distinguishing financial centres from other euro area economies, and focusing on aspects of trade and the composition of euro area FDI. Section 4 summarises and concludes the article.
2 Recording multinational enterprise operations in balance of payments statistics
2.1 The origins of measurement challenges
The operations of large MNEs affect national accounts statistics and, in particular, external accounts, thus creating challenges for statistical compilation and economic analysis.[15] This section reviews how typical MNE operations are captured in b.o.p. and i.i.p. statistics; it also highlights some of the associated measurement challenges. MNE tax planning strategies mainly affect b.o.p. data in three ways: (i) by shifting profits to affiliates in low-tax jurisdictions, which can involve moving IPPs or manipulation of transfer prices on intra-firm trade; (ii) by shifting intra-firm debt obligations and capital linkages; (iii) by redomiciling headquarters and legal incorporations to financial centres with favourable tax arrangements. This section also shows why these activities have different implications for the current account and i.i.p. of countries hosting MNEs and their affiliates.
Measurement challenges are caused by friction between residence-based national statistics methodologies and the global activities and ownership structures of large MNEs. B.o.p. and national accounts statistics, and their associated data collection processes, are based on the residency concept, according to which each institutional unit[16] is resident of one economic territory: the place where they have their centre of predominant economic interest. However, MNEs tend to organise their production chains and corporate structures across the globe involving numerous legal entities, including SPEs (see Box 2).[17] Data on these entities are recorded in the national b.o.p. statistics for the economy of the country where they reside. Consequently these data are not consolidated across borders with the home country of their parent MNE.[18]
Box 2 Towards a recording of special-purpose entities in cross-border statistics
The use of SPEs by MNEs has increased rapidly in recent years.[19] According to a recent Task Force of the Balance of Payments Committee (BOPCOM) at the International Monetary Fund (IMF), an SPE is: (i) a formally registered or incorporated legal entity that is resident in an economy and recognised as an institutional unit with little or no employment (up to a maximum of five employees), little or no physical presence, and little or no physical production activities in the host economy; (ii) directly or indirectly controlled by non-residents; (iii) established to obtain specific advantages provided by the host jurisdiction; (iv) transacting almost entirely with non-residents with large parts of the financial balance of a cross-border nature.[20] The IMF BOPCOM Task Force proposed this internationally agreed definition of SPEs with the aim of collecting comparable cross-country data that separately identify SPEs in cross-border statistics. This is because the size of SPE-related cross-border financial flows and positions often tends to be outsized relative to a country’s domestic economy, blurring the analysis of macroeconomic statistics in the affected countries.
There is a high presence of SPEs in a number of euro area countries. This group of countries includes Cyprus, Ireland, Luxembourg, Malta and the Netherlands, which are all part of the financial centres group shown in Chart 1. In these economies SPEs have a significant impact on the i.i.p. and cross-border transactions, mainly affecting FDI but also portfolio and other investment. Moreover, in some cases, SPEs have non-financial assets (such as IPPs) on their balance sheet.
EU economies with SPE presence tend to a have a well-developed legal, financial and consulting services sector.[21] MNEs may set up SPEs to organise their internal financing arrangement, which requires the availability of highly specialised service providers such as lawyers, tax consultants and financial sector experts in the economies that are hosting SPEs. Tax-avoidance strategies, for instance, often involve the establishment of complex corporate structures involving SPEs across several EU countries.
The IMF BOPCOM Task Force’s definition of SPEs would be helpful in ensuring the availability of internationally consistent external sector statistics with a separate breakdown for SPEs. The IMF BOPCOM aims to publish data that separately identify SPEs in cross-border statistics by the end of 2021. Achieving this goal would require further practical guidance on the application of the definition of SPEs in the light of their heterogeneous nature and their cross-border activities.
Measurement challenges are exacerbated by digitalisation and the increasing importance of IPPs, which are particularly relevant for financial centres. Over time the corporate structures of MNEs have become increasingly dynamic as a result of the redomiciling of headquarters and the increased relevance of intangible assets (such as patents and copyrights), which can be moved across borders with greater ease than physical assets, such as factories. These phenomena can have large effects in terms of magnitude and volatility of statistical indicators, which become especially visible in those economies where MNE transactions and balance sheets are large relative to the size of the domestic economy.
2.2 MNEs and current account balances
To trace the impact that MNE operations have on external accounts, various components of the b.o.p. need to be looked at separately.[22] According to the b.o.p. identity, it holds that
(1)
where CA stands for the current account balance, KA for the capital account balance (comprising mainly transfers of capital and non-produced non-financial assets), EO for errors and omissions (capturing any statistical discrepancy), and FA for the financial account balance.[23]
MNE operations affect various items of a country’s current account balance, the key variable measuring trade, and income and transfer flows vis-à-vis non-residents. The current account consists of the trade balances in goods and services as well as cross-border factor income (primary income) and transfers (secondary income), with the first three being directly affected by the actions of MNEs:
(2)
Cross-border production arrangements and merchanting activities related to MNEs can affect the trade-in-goods component of the current account. This might involve foreign subsidiaries of MNEs (in what is known as offshoring) or an unrelated foreign company (i.e. outsourcing). B.o.p. statistics are based on the concept of change in economic ownership. Which means, in contrast to international trade statistics that measure all goods crossing a country’s border, trade in goods recorded in b.o.p. statistics also includes contract manufacturing and merchanting. In contract manufacturing, an MNE hires a foreign company to produce a good. During the production process, the ownership of the inputs remains with the MNE and hence no trade flows are recorded in the b.o.p. (with the exception of an import by the MNE of manufacturing services from the foreign company that is producing the good). However, the b.o.p. does include the sale of the final products to third countries, which is consistent with the change in ownership principle. Merchanting is the process whereby a company purchases a good from an entity resident abroad, and subsequently sells it to a buyer in a third country without the good crossing the border of the country where the merchant is based.[24] If such transactions involve foreign entities belonging to the same group, their pricing has a decisive impact on the amount and location of profits booked, which is in line with the well-established concept of transfer pricing.[25]
MNE business operations affect trade in services, reflecting the rise of the knowledge economy and digitalisation. As IPPs can often be easily moved across borders within an MNE group, possibly involving SPEs, they affect exports and imports. [26] IPPs are hard to value at market prices and, therefore, MNEs may use them to avoid taxation. For example, one entity of an MNE might own the group’s IPP assets, while other entities in the same group pay licence fees and royalties for its use.
The primary income balance, which is dominated by investment income flows, is another component of the current account affected by MNE operations.[27] Investment income reflects the receipts and payments generated by an economy’s external assets and liabilities (such as dividends and interest), and can be further decomposed into functional categories of the b.o.p. (FDI, portfolio investment, other investment and reserve assets).
MNE operations are particularly visible in FDI income.[28] Income on FDI comes from its equity and debt components. Equity income can be further decomposed into dividends (profits distributed to the direct investor) and reinvested earnings (profits retained in the foreign affiliate). Crucially, the direct investor’s decision to reinvest earnings (i.e. to keep them in a foreign subsidiary) is recorded twice in offsetting ways in the b.o.p. – once as income on FDI, and once as a reinvestment of equal size in the financial account. In practice, MNEs can use complex corporate structures to optimise their tax burden – for example, by concentrating reinvested earnings in certain jurisdictions and by organising intragroup debt obligations. Apart from FDI, the cross-border ownership of MNEs may also affect portfolio investment in equity. In portfolio investment equity, only dividend payments are recorded in the income account, while non-distributed profits are not included.[29]
The MNE operations described in this article mainly affect the composition of a country’s current account balance, while leaving the level of the current account balance unchanged. For instance, let’s first assume that a company residing in “country A” manufactures a pharmaceutical product and exports it to “country B”. This will generate a trade surplus in “country A” and a trade deficit in “country B”. Now, assume that the company resident in “country A” decides to move production offshore to a subsidiary, which is resident in “country C” (a financial centre economy) and subsequently the goods are sold to “country B”. This implies, all other things being equal, that the current account of “country A” records a profit – from the subsidiary in “country C” – equal in size to the net exports recorded before the decision to move production offshore. Thus, the value of the current account balance of “country A” is the same in either scenario, but the composition is altered in the second scenario because an investment income surplus replaces a trade surplus.
In contrast, MNE redomiciliation strategies – i.e. relocating their headquarters to another country – may have a significant impact on headline current account balances.[30] Even if the redomiciliation of an MNE is not associated with additional economic activity in the economy of residency, the current account balance may be affected in several ways (e.g. due to attribution of net exports resulting from contract manufacturing or IPP related services trade). Primary income may be affected due to the differing treatment of reinvested earnings in FDI and portfolio equity. The country hosting the redomiciled global firm will record an improvement in the net FDI position and deterioration in the net portfolio equity position, to the extent that its shareholders are located outside the economy that hosts the new headquarters, which is typically the case for a small FDI hub. However, these two offsetting positions produce two different income streams. Reinvested earnings from foreign subsidiaries are recorded as income receipts and boost the recorded current account balance, whereas profits payments to foreign MNE shareholders are only recorded if they are distributed as dividends (in portfolio investment).
2.3 MNEs and cross-border financial and national accounts
Mirroring the current account, MNE operations also affect the financial account of the b.o.p. and external assets and liabilities. Changes to a country’s net i.i.p. can be broken down into net financial transactions as captured in the financial account (FA), revaluations due to changes in exchange rates and other asset prices (REV) and other volume changes (OVC).[31]
(3)
MNEs have a particularly large impact on FDI, both in the i.i.p. and the financial account. All FDI transactions (such as withdrawals of equity and reinvestment of earnings) are recorded in the financial account and hence affect the i.i.p. as shown in equation (3). Redomiciliations, which imply cross-border movements of MNE balance sheets, may give rise to OVC as defined in equation (3) and can thereby substantially change a country’s i.i.p.
Finally, it should be noted that MNE activities not only impact cross-border statistics but also affect the broader national accounts. A case in point is Ireland, where investment income flows, related to redomiciled MNEs, the depreciation of IPPs and aircraft leasing, had a large impact on Irish GDP and GNI.[32] As a result, Ireland’s Central Statistics Office publishes a number of modified economic indicators (such as GNI* and a modified current account CA*) that exclude these phenomena and thereby provide a more focused view of domestic economic developments.
3 How do multinational enterprise activities affect the euro area balance of payments?
MNE operations affect the external accounts of the euro area, though their impact varies markedly across the 19 euro area countries. The aggregate b.o.p. of the euro area masks the varied impact of MNE activities on the external statistics of each individual country. Euro area countries can be classified into two groups, which present marked differences in their external accounts: six economies that are specialised in providing financial services[33] and another 13 economies that are not.
The size, composition and volatility of the current account and financial account balances of euro area financial centres are significantly affected by MNE transactions. Section 3.1 presents stylised facts on the euro area b.o.p. related to the activity of specialised subsidiaries, such as SPEs in financial centres, whose location is primarily determined by tax-related, financial and regulatory considerations. Section 3.2 then focuses on the impact that SPEs have on FDI.
3.1 Euro area current account
When comparing the composition and size of the current accounts of financial centres with those of other economies in the euro area, five key features stand out.
First, financial centres in the euro area share a similar current account composition: they exhibit large trade surpluses that are partly counterbalanced by income deficits. This is shown in Chart 3 and corroborated by the empirical evidence in Box 3 based on a larger sample of the top ten global financial centres. The trade surpluses of financial centres often reflect exports with large value added, such as those related to licences in the field of information and communications technology. The literature on global value chains (GVCs) has established that value added is mainly created in very upstream activities (e.g. research and development, design and financial services) or very downstream activities (e.g. merchanting, logistics, royalties from licences, branding and marketing) – financial centres appear to have comparative advantages in several of these activities.[34] If production is fragmented across borders, the allocation of value added across the firm’s network may result in financial centres appropriating a significant part of the value added on a global level. Income deficits can also reflect the practice of booking profits in financial centres.
Box 3 Financial centres and current account imbalances
This box provides an empirical assessment of the size of current account imbalances in financial centres compared with other countries. As noted throughout this article, MNE activities widen the gross external positions and the current accounts of financial centres, while also affecting their composition. Moreover, financial centres tend to report current account surpluses. To a large extent, these observed patterns may be ascribed to the concentration of financial activities in a limited number of financial centres, which may not exclusively reflect MNE activities, but also those of banks, other financial intermediaries and individual investors resident in financial centres. It is, therefore, important to widen this analysis to the various subcomponents of financial centre current accounts, including the goods balance, the services balance and the investment income balance.
Empirical evidence confirms that the current account surpluses of financial centres, after controlling for other potential determinants of current account balances, are particularly large from a global perspective. Current account balances and their main subcomponents, across a panel of more than 60 economies since the early 2000s, are regressed on a number of traditional drivers, such as the net foreign asset position, GDP growth, terms of trade, the oil trade balance and per capita GDP. Table A reports the regressions results for the dummy variable identifying financial centres. Notably, this variable is positive and statistically significant in the first two columns of Table A. This confirms that, everything else being equal, financial centres tend to have larger current account surpluses and trade in goods surpluses – the latter is potentially the outcome of MNE merchanting and contract manufacturing activities. Financial centres post particularly large surpluses in the services balance (see column (3) of Table A), possibly related to financial activities that are not necessarily related to MNEs. In contrast, financial centres tend to report larger deficits in the investment income balance because the dummy in column (4) is negative and statistically significant, providing further support to the finding related to the income balance of euro area economies in Section 3.1. Finally, further analysis – not included here – suggests that the positive relationship between the status of financial centres and the current account (and the negative relationship between financial centres and investment income) has become stronger in recent years.
Table A
Drivers of the current account and financial centres
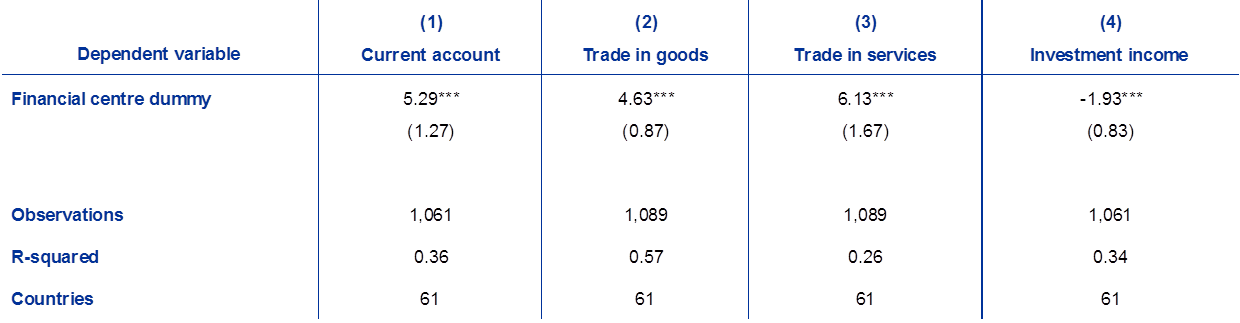
Source: ECB staff calculations.
Notes: The dependent variables are measured as a percentage of GDP using annual data from the period 2001-2018. The model for the current account in column (1) includes the net foreign asset position, GDP growth, terms of trade, the oil trade balance and per capita GDP as control variables. The model for trade in goods and services in columns (2) and (3) includes the same regressors as in (1), excluding the net foreign asset position. The model for the investment income balance in column (4) includes only the oil trade balance and the net foreign asset position as control variables. Pooled regressions estimated with Prais-Winsten heteroskedastic panels corrected standard errors (reported in parenthesis) and controlling for panel-specific autocorrelation of the residuals.
Second, the negative income balances recorded by euro area financial centres partly reflect the redistribution of profits to foreign shareholders. The sum of the income deficits in financial centres was 5% of their cumulated GDP in 2018, whereas the primary surplus in the other euro area economies stood at 1.6% of GDP. The global value added retained in financial centres is ultimately owned by foreign investors that receive an after tax profit which is recorded as income deficits. In practice, however, while aggregate income deficits are very common in euro area financial centres, not all arise from FDI income. They may also be driven by portfolio income, as in the case of Luxembourg and Cyprus. Heterogeneity in income balance composition reflects specific business models, i.e. different net direct investment and portfolio investment asset positions, as well as their position in the global capital network and in relation to other financial centres.
Third, the practice of moving value added to low-tax euro area jurisdictions may also inflate their trade surpluses, while producing the opposite effect in higher-tax economies. This is suggested by the different scale of the vertical axes in Chart 3. MNEs pursue several strategies aimed at avoiding taxes that, while vested differently, ultimately boil down to value added being shifted across borders; these strategies affect the trade balances of euro area countries.
Chart 3
Current account balances of financial centres and other economies in the euro area
(as a percentage of GDP)
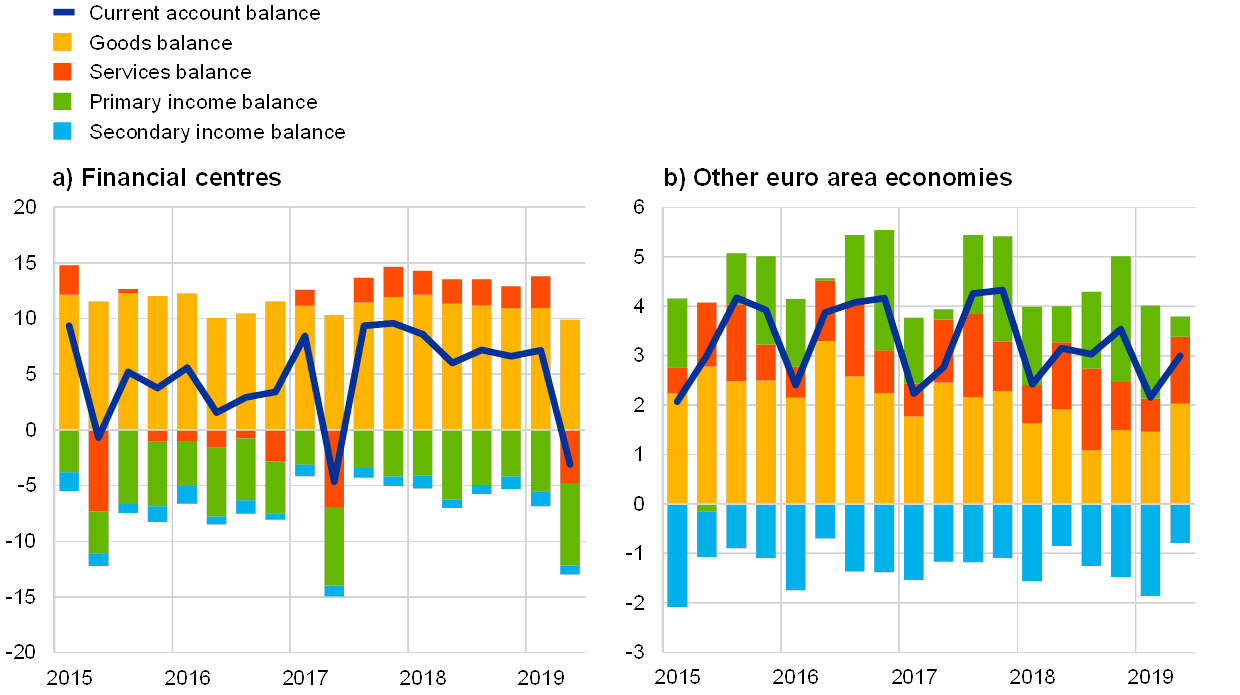
Source: ECB and Eurostat.
Notes: Financial centres refer to Ireland, Belgium, Luxembourg, the Netherlands, Malta and Cyprus. The financial accounts of the two groups of countries are not netted out for intragroup flows. This chart is based on quarterly data. The last available observation is from the second quarter of 2019.
Available evidence shows that, as a result, the trade surplus of euro area financial centres stood at 13% of their combined GDP at the end of 2018. As shown in Chart 3, this contrasts with a surplus of less than 3% in the average of other euro area economies. Moreover, the surplus recorded by financial centres has tripled over the past decade, mirroring the growth in FDI recorded in the financial account of the b.o.p.
Fourth, contract manufacturing and merchanting conducted by entities resident in financial centres have generated a growing discrepancy between b.o.p. statistics and international trade statistics for euro area financial centres. Different concepts underlying the compilation of b.o.p. data with that of international trade statistics lead to some differences (see Section 2.2). In the euro area the gap between these two sources has been growing over time, in particular since 2015 (see Chart 4). Among euro area countries, financial centres account for the bulk of the growing discrepancy, whereas the discrepancy has remained stable for the other economies. This may be partly driven by MNE practices such as change of domicile and outsourcing of merchanting activities to specialised subsidiaries located in financial centres.
Chart 4
Euro area goods trade balance: the growing gap between b.o.p. and international trade statistics
(EUR millions)
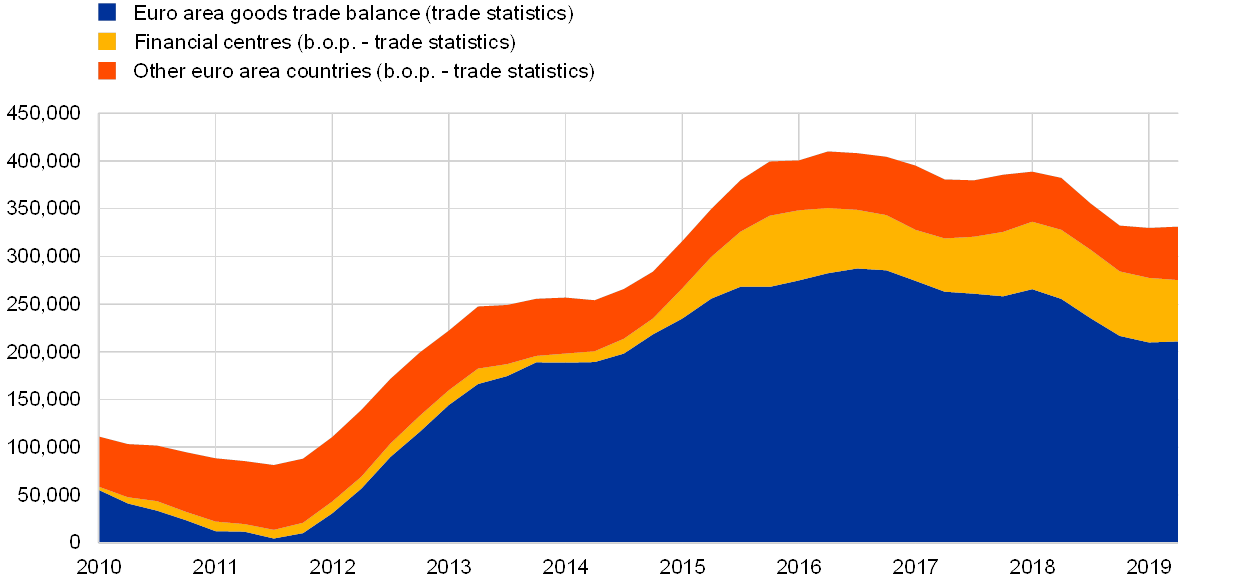
Source: ECB and Eurostat, authors’ calculations.
Notes: The blue area is the net exports of the euro area as recorded in national trade statistics. The yellow and the orange areas depict the difference between b.o.p. and trade statistics in financial centres and other euro area economies, respectively. The group of financial centres includes Ireland, Belgium, Luxembourg, the Netherlands, Malta and Cyprus. This chart is based on quarterly data. The last available observation is from the second quarter of 2019.
Fifth, the trade surplus of financial centres is mainly driven by value added that is produced elsewhere (i.e. foreign value added) and then re-exported. This contrasts with the group of other euro area economies, whose cumulated trade surplus primarily reflects domestic value added that is traded with final consumers. For a more detailed discussion of this feature, see Box 4.
Box 4 A representation of trade balances in terms of value added: financial centres versus other euro area economies
The goods and services we buy are composed of inputs from various countries from around the world. As a result, the trade balance of each country can be decomposed in terms of (i) the value added that the exporting country itself has produced in every relevant transaction, and (ii) the value added produced by its partner economies in every relevant transaction. The former is called domestic value added (DVA). The latter is known as foreign value added (FVA). An additional useful distinction can be made between transactions directly involving the country that absorb the production (DIR) and transactions related to the intermediate stages of GVCs. This taxonomy helps better understand the mechanisms generating the large surpluses of financial centres in the euro area as well as their contribution to the creation of global value added.[35]
Financial centres usually present large trade surpluses in value added derived from other countries, which cross the borders of these financial centres before reaching final consumers abroad (FVA-DIR). In other words, while financial centres import very little FVA that is absorbed domestically, they re-export large amounts of FVA directly to the final consumers in other countries, see Chart A – the green bars. This is not the case elsewhere. In particular, in the other euro area economies the trade surpluses reflect primarily domestic value added that is directly traded with the final consumers (DVA-DIR), as shown in Chart B – the blue bars.
Chart A
Trade balance in value added for euro area financial centres
(as a share of GDP)
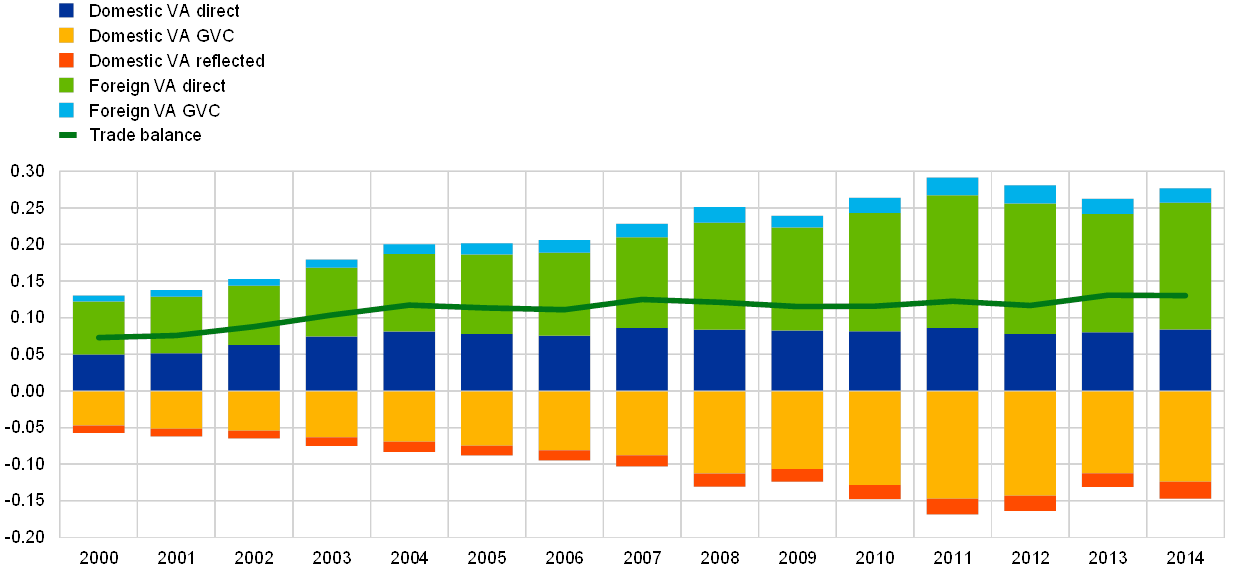
Chart B
Trade balance in value added for other euro area economies
(as a share of GDP)
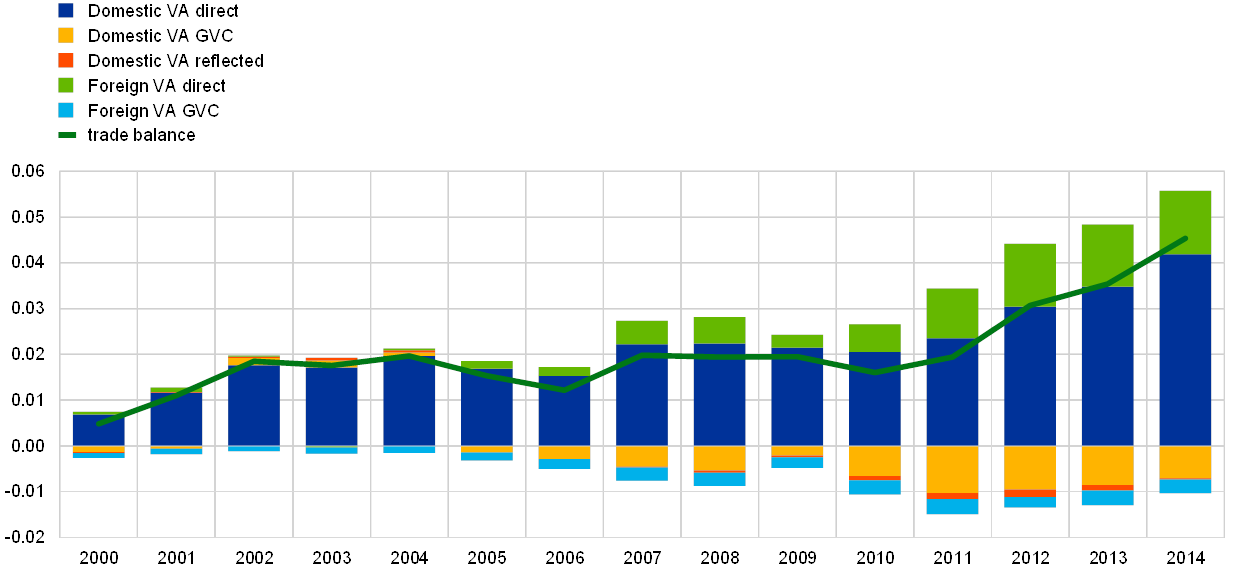
Source: WIOD data and authors’ calculations.
Notes: Financial centres include the Netherlands, Belgium, Ireland, Luxembourg, Malta and Cyprus.
Financial centres also typically present large deficits in the balance of domestic value added that is further re-exported (DVA-GVC). This reflects the fact that financial centres tend to occupy the very last stage(s) in the production chain as they are located more downstream – i.e. they are closer to the final consumers – than any other participants in the global production network.
While domestic value added exported to final consumers (DVA-DIR) is the dominant component in the trade balance of other euro area economies, it is interesting to observe that the same component measures however more than twice the size in financial centres (see blue bars in Charts A and B). Financial centres’ domestic contribution to the multi-stage production of goods and services is primarily in intangibles – the value of these is added at the very last stage and constitutes the difference between the final price and the factory price of a product.
If tax avoidance is one of the main factors shaping the trade balances in financial centres, then one should expect such balances to primarily reflect bilateral balances with higher tax, non-financial centres. Practices that manipulate trade prices mostly concern the bilateral trade relationships between financial and non-financial centres (i.e. low and higher taxation economies), thus resulting in selective trade surpluses. As a result, a more granular decomposition of the bilateral trade balances, expressed in terms of value added content, shows that financial centres hold large trade surpluses only in relation to higher taxation jurisdictions, especially euro area economies (whereas the positions in relation to other financial centres are more balanced).
In conclusion, the dissection of the trade balance in value added shows that financial centres are also conduits for real transactions. A tiny fraction of their total trade is for their own domestic consumption, whereas a significant share of their trade responds to different objectives, including escaping profit taxation.
3.2 Euro area foreign direct investment
FDI is a very significant component of the euro area’s financial account. In recent years it has gained prominence as a result of the striking expansion of gross transactions channelled by euro area financial centres (see Chart 5). The increase in gross FDI flows in turn reflects MNE activities, as discussed in this subsection.
The size of gross FDI flows going through financial centres is so large that they drive the aggregate developments of gross FDI in the euro area as a whole. FDI transiting through financial centres is, on average, between two and three times higher than that recorded by the other euro area economies. It is also three times more volatile. On a net basis, however, the FDI flows of the other euro area economies are more important in determining the aggregate net external position of the euro area (see Chart 5).
Chart 5
Financial account balances
Gross assets and liabilities (reverse scale)
(percentage of euro area GDP)
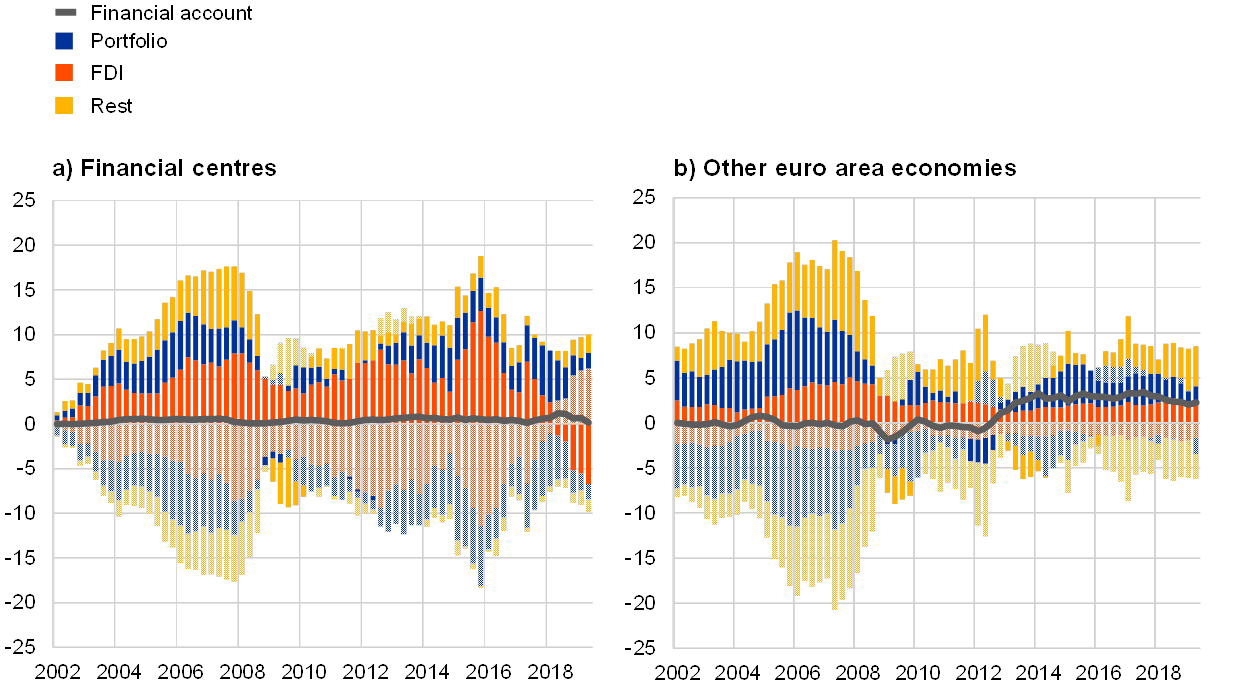
Source: ECB and authors’ calculations.
Note: Financial centres refer to Ireland, Belgium, Luxembourg, the Netherlands, Malta and Cyprus. Liabilities are reported in reverse scale on the negative values of the vertical axis and they are identified by the bars of the same colour as assets but in a lighter shade. The financial accounts of the two groups of countries are not netted out for intragroup flows. For the Netherlands data are available from 2003, for Malta from 2004, for Cyprus from 2008. Charts are based on quarterly data. The latest observations are for the second quarter of 2019.
As a result of MNE activity, gross FDI transactions in the euro area have become less stable and less predictable compared with when FDI mostly consisted of mergers and acquisitions and greenfield investment.[36] Furthermore, the volatility of gross FDI flows in the euro area, once considered a stable source of external financing, rose above that of other financial flows in the post-crisis period (see Chart 5). Conversely, over the same period the volatility of gross FDI flows in the other euro area economies declined compared to pre-crisis values.
Another defining feature of FDI is the strong positive correlation between gross assets and liabilities, especially in financial centres. The very large degree of co-movement of FDI inflows and outflows is determined by capital passing through financial centres en route to other destinations (Chart 5).[37] Complex international investment schemes have been engineered to take advantage of favourable corporate tax and legal conditions; this makes financial centres highly interconnected while also allowing them to preserve their own business models.
The bulk of FDI transactions in financial centres are carried out by financial subsidiaries or holding companies of MNEs, including SPEs. In fact, other financial institutions’ transactions (which include these entities) dominate the size and dynamics of FDI in financial centres, whereas NFCs drive gross asset and liabilities flows in the other euro area economies (see Chart 6). According to the dedicated IMF Task Force (see Box 2), SPEs are set up by MNEs specifically to access capital markets or sophisticated financial services; isolate owner(s) from financial risks; and/or reduce regulatory and tax burden; and/or safeguard confidentiality of their transactions and owner(s).[38] Euro area financial centres offer many of these advantages. In particular, they have developed sophisticated financial instruments, such as securitised products. The SPEs located in euro area financial centres typically hold MNE equities, manage corporate MNE debt-issuance, and allocate financing across parent and subsidiaries.[39]
Chart 6
Gross FDI flows in euro area financial centres vs. other economies in the euro area, by resident sector
Gross assets and liabilities (reverse scale)
(percentage of euro area GDP)
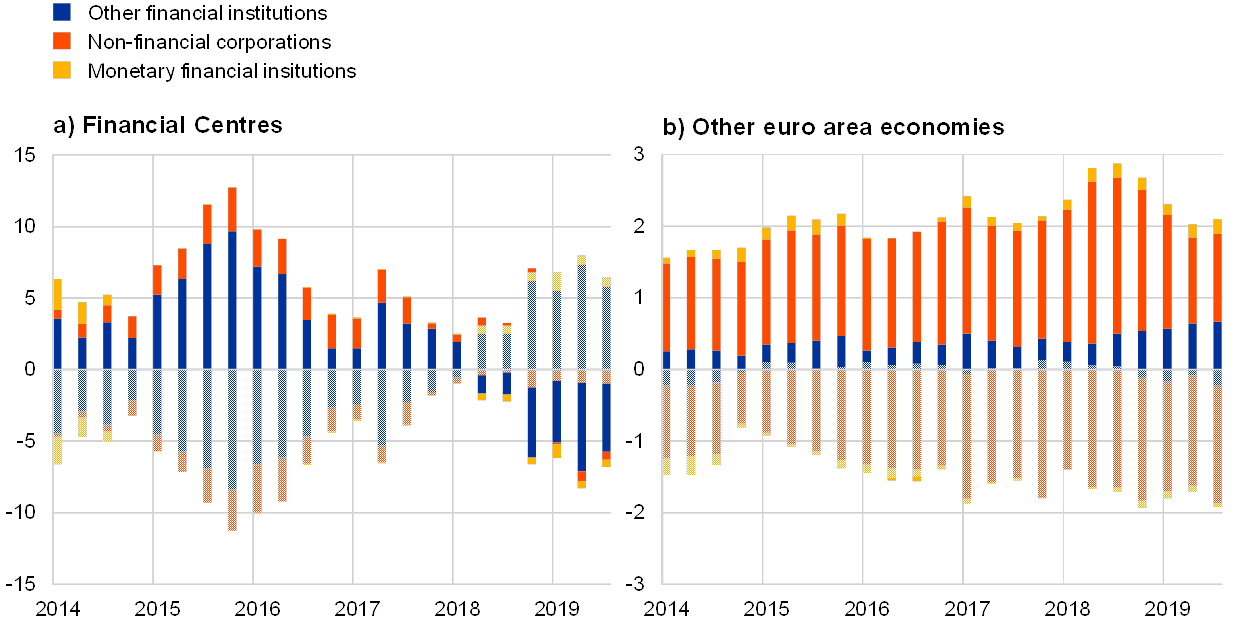
Source: ECB and authors’ calculations.
Notes: euro area financial centres refer to Ireland, Belgium, Luxembourg, the Netherlands, and Cyprus (Malta excluded due to data availability). Liabilities are reported in reverse scale on the negative values of the vertical axis and they are identified by the bars of the same colour as assets but in a lighter shade.
SPEs channel European and global capital around the world, also involving securitisation schemes. Some SPEs operate by pooling parent company debts and often transferring asset backed securities to a third subsidiary entity that is legally separate and possibly resident in another financial centre within or outside the euro area. This set of within-group financial transactions accounts for part of the earnings of SPEs and other subsidiaries in financial centres and represents another potential profit-shifting channel. Finally, to the extent that these securitisation schemes consist of within-group financial operations, neither the assets nor the risk underlying the securitised assets are shifted off the balance sheet consolidated at group level.
MNEs not only exert a significant impact on the size of gross FDI flows, but can also be a source of asymmetries in the measurement of bilateral external positions. These asymmetries are particularly pronounced for bilateral FDI income recorded in US and euro area b.o.p. (see Box 5).
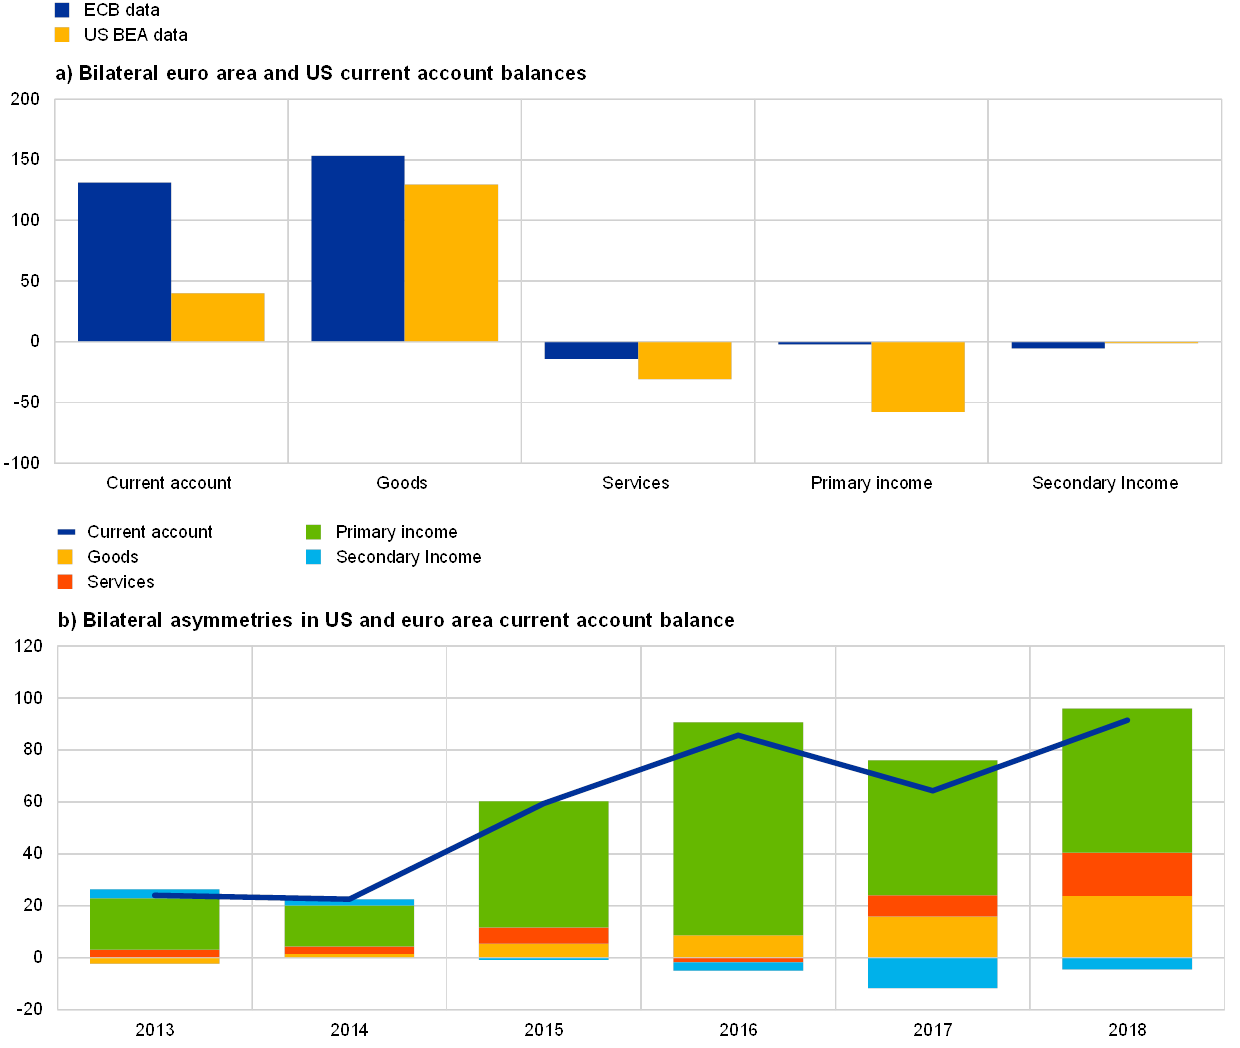
Box 5 Euro area-US current account asymmetries: the role of foreign direct investment income in the presence of multinational enterprises
In the context of recent discussions on trade policies between the United States and its trading partners, bilateral current account balances have received growing attention from policy makers and the media. However, the interpretability of bilateral current account statistics may be affected by the existence of bilateral asymmetries.[40]
In 2018 the euro area recorded a bilateral current account surplus of €131 billion vis-à-vis the United States, according to ECB data, while the euro area surplus amounted to only €40 billion in US Bureau of Economic Analysis (BEA) data (see panel (a) of Chart A).[41] The euro area surplus was around €90 billion smaller according to BEA data, due to a €23 billion smaller area goods surplus and larger euro area deficits for services and primary income (by €17 billion and €55 billion, respectively).[42] Panel (b) of Chart A reveals that the current account asymmetry has increased over time, largely due to the primary income balance, in particular in FDI.
The divergence in recording FDI income is particularly pronounced. In 2018 a paradoxical situation arose, in which both the euro area (according to ECB data) and the United States (according to BEA data) recorded positive income balances vis-à-vis each other (see panel (a) of Chart B). A large difference is observable for FDI income paid to US investors on their investments in the euro area, with the ECB recording a value around €85 billion lower than the corresponding figure reported by the BEA. In contrast, the income euro area residents earned on their FDI investment in the United States was relatively consistent in 2018 (diverging by around €18 billion).[43] The large discrepancy in FDI income paid by the euro area to the United States arises primarily from data on US FDI investment in the Netherlands, Luxembourg and Ireland.
Chart A
Bilateral euro area-US current account balances
(panel (a): EUR billions; 2018; panel (b): EUR billions)
Source: ECB and BEA.
Notes: Bilateral asymmetries are calculated as ECB data minus mirror BEA data – a positive value indicates that the euro area balance reported by the ECB is larger than the corresponding figure reported by the BEA.
Chart B
FDI between the euro area and the United States
(panel (a): EUR billions; panel (b): proportion to the total; 2018)
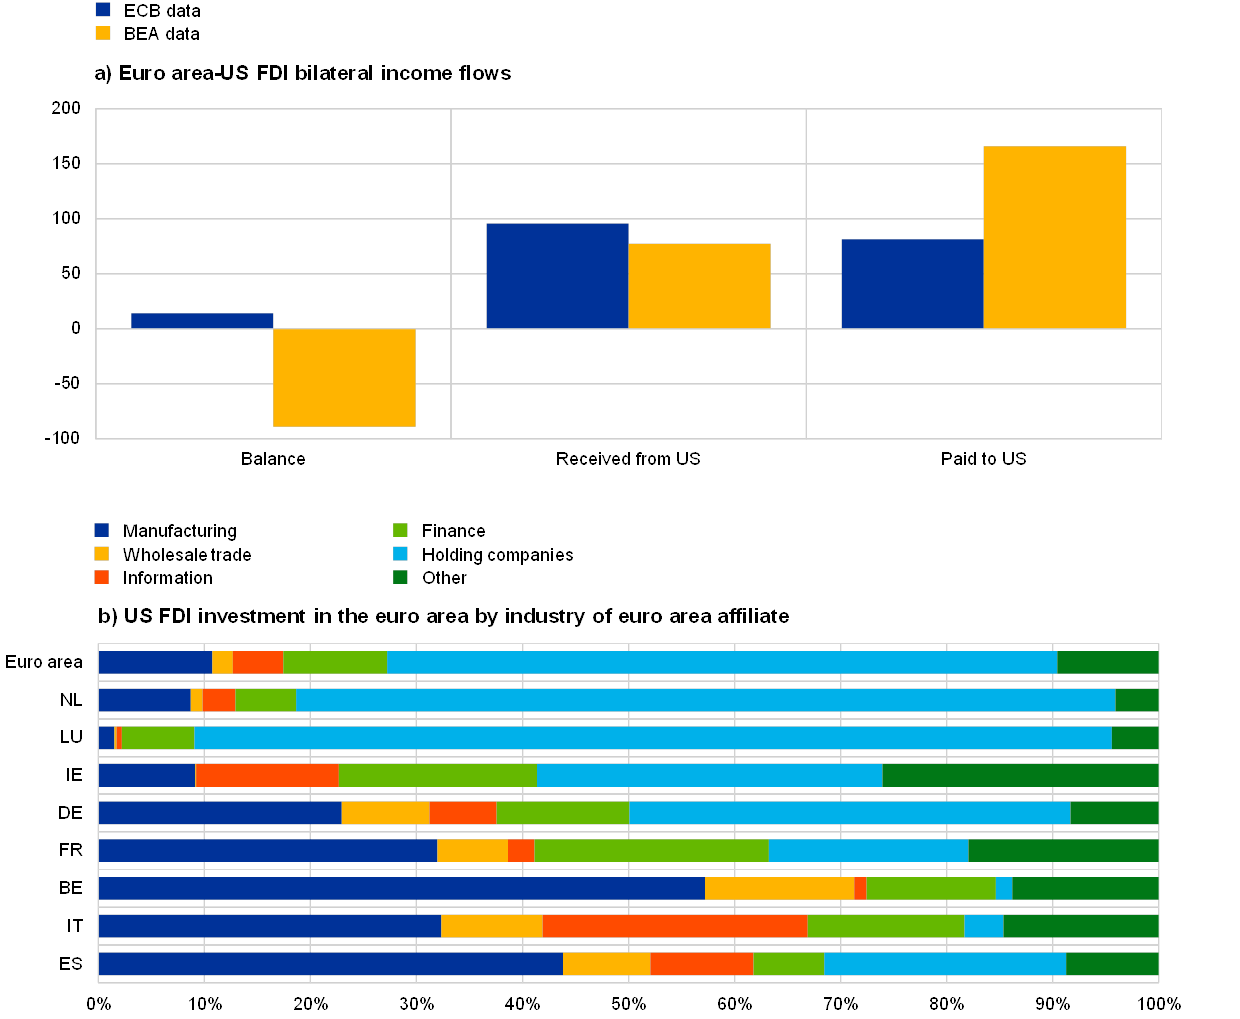
Source: ECB and BEA.
Notes: Positive balance values indicate a surplus for the euro area in panel (a). “Other” includes mining, depository institutions, professional and technical services, other industries, and unallocated industries in panel (b). Euro area in panel (b) is based on BEA data available for Austria, Belgium, Finland, France, Germany, Greece, Ireland, Italy, Luxembourg, the Netherlands, Portugal and Spain.
US MNEs often resort to complex chains of ownership – involving multiple FDI relationships in several euro area countries – which complicate the estimation of FDI income. According to BEA data (see panel (b) of Chart B), more than 60% of US FDI in the euro area is invested in holding companies, while only around 10% directly reaches euro area manufacturing entities. Holding companies – which are often SPEs – may serve as the first links between US MNEs and their euro area subsidiaries. Crucially, the income of these holding companies also includes the profits earned from other entities in MNE ownership chains (known as indirectly owned affiliates). [44] Recording such income – in particular for retained earnings – is challenging for statisticians because it requires comprehensive access to MNE balance sheets and their ownership links. Differences in the information available on US MNEs may partly explain why FDI income paid to US investors is lower in European statistics compared to US statistics.
Differences in the identification of the immediate counterpart country may also contribute to the observed asymmetries in FDI income. The complexity of MNE corporate structures makes it difficult for statisticians to attribute linkages to the correct counterpart countries. There is some evidence pointing to differences between the United States and the euro area, as euro area countries attribute sizeable parts of FDI income paid to immediate counterparts in offshore financial centres (in line with international statistical standards). Subsequently, these income flows are likely to be passed through to the United States. [45] The BEA may partly attribute such income as directly received from the euro area (rather than from offshore centres).
Several work streams are active between b.o.p. compilers, monitoring and analysing the observed asymmetries of euro area countries vis-à-vis the United States – in particular in the context of FDI income flows.
4 Conclusions
This article analysed how the operations of large multinational enterprises (MNEs) are affecting the external accounts of the euro area and, in general, financial centres. First, the article presented how MNE operations are recorded in cross-border statistics, as well as the related measurement challenges. Second, this article showed the impact of MNEs on the external accounts of the euro area, which is most evident in the current account balances and in foreign direct investment of euro area financial centres, often involving special-purpose entities. Third, financial centre economies generally report current account surpluses that may be attributed, in part, to the activity of MNEs.
Multilateral initiatives to improve the transparency of MNE operations are necessary to ensure exchanges of information across borders both for tax and statistical purposes. Such initiatives should help national authorities to take action against tax avoidance. Moreover, close international cooperation between statistical compilers – including sharing of potentially confidential information – would help to ensure consistent cross-border recording of MNE activities, thereby improving the quality and consistency of macroeconomic statistics. In particular, such initiatives could help to ensure clarity by disentangling the transactions conducted by SPEs in the context of FDI in the b.o.p.
- Intangible assets include non-physical items such as goodwill items, brand recognition products and intellectual property products (IPPs). IPPs, such as licenses and patents, result from varying combinations of research, development, investigation and innovation that lead to knowledge; using this knowledge is restricted by laws or other means of protection (see European system of accounts - ESA 2010). Research and development leading to assets of intellectual property are recorded as gross fixed capital formation.
- Multinational enterprises are enterprises producing goods or delivering services in more than one country. MNE headquarters are rarely located in more than one country (the home country). However they operate in a number of other countries (the host countries).
- Transfer pricing refers to the rules and methods for pricing transactions within and between enterprises under common ownership or control.
- See Avdjiev, S., Everett, M., Lane, P.R. and Shin, H.S., “Tracking the international footprints of global firms”, BIS Quarterly Review, March 2018.
- See, for example, Tørsløv, L., Wier, L. and Zucman, G., “The Missing Profits of Nations”, NBER working paper, No 24701, August 2018.
- See Beer. S. de Mooij, R and Liu, L., “International corporate tax avoidance: A review of the channels, magnitudes, and blind spots”, Journal of Economic Surveys, Special issue, January 2019, pp. 1-29.
- See Heckemeyer, J. H., Overesch, M., “Multinationals’ profit response to tax differentials: Effect size and shifting channels”, Canadian Journal of Economics/Revue canadienne d'économique, Vol. 50, No 4, 2017.
- See Arulampalam, W., Devereux, M.P. and Liberini, F., “Taxes and the location of targets, Journal of Public Economics, Vol. 176, 2019, pp. 161-178.
- See Zucman, G., “Taxing across Borders: Tracking Personal Wealth and Corporate Profits”, Journal of Economic Perspectives, fall, Vol. 28, No 4, 2014, pp. 121-148.
- See OECD BEPS 2015 Final Reports.
- See Directive (EU) 2016/1164 of 12 July 2016 laying down rules against tax avoidance practices that directly affect the functioning of the internal market (OJ L 193, 19.7.2016, p. 1) and Directive (EU) 2017/952 of 29 May 2017 amending Directive (EU) 2016/1164 as regards hybrid mismatches with third countries (OJ L 144, 7.6.2017, p. 1).
- See the European Commission’s Anti-Tax Avoidance Package.
- Initiatives in this field include the LEI (Legal Entity Identifier), the Register of Institutions and Affiliates Database (RIAD) – which is a business register, operated by the European System of Central Banks (ESCB) – and the Eurogroup’s Register (EGR), which is used for statistical purposes on MNEs in the EU and operated by the European Statistical System.
- These economies (with the exception of the United Kingdom) are also the largest hubs in terms of the stock of foreign direct investment (FDI) to GDP. FDI is a component of the balance of payments (b.o.p.) and international investment position (i.i.p.) that is closely related to the activities of MNEs. In this article, to identify financial centres and exclude oil producing countries that tend to report large gross foreign asset positions, we focus on gross foreign liabilities instead of the sum of assets and liabilities, using IMF Balance of Payments Statistics. The activities of small off-shore financial centres fall outside the scope of this article. This is because detailed b.o.p. statistics are not always available. Moreover, the huge size of the external balance sheet of offshore centres relative to their GDP would distort some of the results shown in the article. It should be noted that advanced economies classed as financial centres are not necessarily considered to be tax havens for corporate taxation purposes. In general, these financial centres have relatively low corporate tax rates, but this is not necessarily always the case. For instance, the statutory corporate tax rates of Belgium, the Netherlands and Malta are above the average rate of all other economies in our sample.
- See Stapel-Weber, S. et al., “Meaningful Information for Domestic Economies in the Light of Globalization - Will Additional Macroeconomic Indicators and Different Presentations Shed Light?”, NBER Working Paper, No 24859, 2018.
- The following qualify as institutional units: households, corporations, non-profit institutions, government units and legal or social entities recognised by law or society, or other entities that may own or control them.
- The UNCTAD World Investment Report 2015 shows that larger MNEs are associated with a greater complexity of their internal ownership structures. The top 100 MNEs in UNCTAD’s Transnationality Index have on average more than 500 affiliates across more than 50 countries, with seven hierarchical levels, involving 20 holding companies.
- The BIS provides accounts for international banking groups consolidated to their home country (in the locational banking statistics by nationality). In a similar vein, Tissot 2016 (“Globalisation and financial stability risks: is the residency-based approach of the national accounts old-fashioned?” BIS Working Papers, No 587, 2016) argues that large MNE groups should be consolidated with the home country. This would require the sharing of confidential data across borders, as statistical data collection is also organised according to the residency principle.
- See Lane, P.R. and Milesi-Ferretti, G.M., “International Financial Integration in the Aftermath of the Global Financial Crisis”, IMF Economic Review, 66, 2018, pp. 189–222.
- See the IMF Committee on Balance of Payments Statistics (BOPCOM)’s Final Report of the Task Force on Special Purpose Entities, 2018.
- See Jellema, T., Pastoris, F. and Picon-Aguilar, C., “A European perspective to observing and reporting on SPEs”, ISI World Statistics Congress, 2019, and Galstyan, V., Maqui, E., McQuade, P., "International debt and Special Purpose Entities: evidence from Ireland", ECB Working Paper Series, No 2301, ECB, Frankfurt am Main, July 2019.
- Lane, P.R., “Risk Exposures in International and Sectoral Balance Sheet Data", World Economics, Vol. 16, Issue 4, 2015, pp. 55-76.
- The financial account balance is defined in terms of net financial outflows, i.e. the net purchases of foreign assets by domestic residents minus the net incurrence of liabilities by domestic residents vis-à-vis foreign residents.
- The difference between revenues from the sale and purchase of the good (net of any expenses incurred to finance, insure, store and transport the good) is recorded as net exports of merchanting in the goods balance of the country where the company resides.
- In many countries tax authorities apply what is known as the arms-length principle to transfer pricing (i.e. the rules for pricing intra-group transactions). According to this principle, intra-group transactions need to be priced in the same way as transactions with unrelated firms.
- Trade in IPPs is included in the other business services category of the b.o.p., while the royalties and fees for use of these assets are recorded as charges for the use of intellectual property. Non-produced intangible assets are recorded in the b.o.p.’s capital account.
- Primary income also includes compensation of employees and other primary income.
- An FDI relationship exists when a foreign direct investor holds equity that entitles it to 10% (or more) of the voting power in the direct investment enterprise. Once the FDI relationship is established between two entities, all financial transactions between them are recorded as FDI.
- The asymmetric treatment of reinvested earning in FDI and portfolio investment equity is seen, in some studies, as creating biases in the current account. See, for example, Thomas J. Jordan’s speech at the University of Basel from the 23 November 2017, which notes an upward bias for the Swiss current account surplus as the FDI profits (distributed and retained) earned by Swiss MNEs are included in the Swiss current account. As these MNEs are to a large extent owned by non-Swiss residents via portfolio equity investments only dividend payments “leave” Switzerland via the income account. While not recorded in the current account, the non-distributed profits should increase the market value of the Swiss MNEs and hence increase the portfolio equity liabilities in the i.i.p. of Switzerland.
- For a numerical example on the impact of redomiciliation on the current account, see Avdjiev et al., “Tracking the international footprints of global firms”, BIS Quarterly Review, March 2018.
- Other volume changes include, for example, reclassifications, write-downs, breaks arising from changes in sources and methods, and changes in the residency of companies.
- See Lane, P.R., “Notes on the treatment of global firms in national accounts”, Economic Letter Series, Vol. 2017, No 1, Central Bank of Ireland, 2017.
- This first group includes Cyprus, Luxembourg, Ireland, the Netherlands, Malta and Belgium. They are defined as financial centres according to the size of their foreign liabilities to GDP, as described in Section 1 of this article.
- See Cheng, K., Rehman, S., Seneviratne, D., Zhang, S., “Reaping the benefits from Global Value chains”, IMF, 2015; “Mapping Global Value Chains”, OECD, 2013; “Interconnected Economies: benefiting from Global Value Chains”, OECD, 2013.
- The evidence presented in this box is based on the World Input-Output Database (WIOD) that employs b.o.p. statistics as an underlying source. The decomposition follows the methodology used in Borin, A. and Mancini, M., “Follow the value added: bilateral gross export accounting”, Temi di discussione (Economic working papers), No 1026, Bank of Italy, July 2015. The exercise focuses on four main components of the trade balance: i) the domestic value added absorbed by the direct importer (DVA direct); ii) the domestic value added exported and further re-exported as foreign value added in the GVC chain (DVA GVC); iii) foreign value added exported directly to the final consumer country (FVA direct); iv) foreign value added that is further exported by third countries in the GVC (FVA GVC), which only indirectly reaches the final absorbing economy. The trade balance of domestic value added exported abroad is a residual category, which is reflected and absorbed at home (DVA reflected).
- The coefficient of variation was computed separately based on groupings of countries (euro area financial centres and other euro area economies) for the pre-crisis and post-2009 periods. An increase could be identified only in the volatility of transactions of SPE affiliates resident in financial centres. This finding is not driven by one specific financial centre but it emerges as a common pattern of FDI in this group of economies.
- See Blanchard, O. and Acalin, J., “What Does Measured FDI Actually Measure?”, Peterson Institute for International Economics Policy Brief 16-17, October 2016.
- See “Final Report of the Task Force on Special Purpose Entities” IMF, 2018.
- SPEs engineer different forms of corporate debt securitisations such as collateralised debt obligation where debt is backed by other assets compensating the investor for the risk of default or by high-yield bonds (collateralised bond obligations) or through credit default swaps where investors are compensated in case of debt default. See Hira, A., Gaillard, N., Cohn, T. H., The failure of Financial Regulation: Why a Major Crisis Could Happen Again, Palgrave, 2019.
- Bilateral asymmetries arise when reported exports of “country A” to “country B” are not mirrored by the reported imports of “country B” from “country A”.
- For this analysis the data reported by the BEA were converted from US dollar to euro, using the average exchange rate over the respective time period.
- The euro area’s secondary income deficit was €15 billion smaller according to BEA data, thereby slightly reducing the overall current account balance discrepancy.
- Bilateral FDI income data from the BEA are recorded on a directional basis and thus organised according to whether the income derives from outward investment (US direct investment abroad) or inward investment (foreign direct investment in the United States). Bilateral FDI income data from the ECB are recorded on the basis of an asset/liability principle, classifying income as assets or liabilities. This difference in recording principles is not relevant for the income balance.
- When a direct investment ownership chain with more than one hierarchical FDI link exists, direct investment earnings should reflect income from direct and indirect enterprises. Income earned along the chain of ownership needs to be recorded in the directly-owned direct investment enterprise.
- See for example explaining Ireland's FDI Asymmetry with the United States and Howell, K, et al., Current Account Asymmetries in EU-US Statistics, Eurostat and BEA, March 2019.