
Trends and developments in the use of euro cash over the past ten years
Published as part of the ECB Economic Bulletin, Issue 6/2018.
1 Developments in the circulation of euro banknotes
1.1 Overall developments in circulation
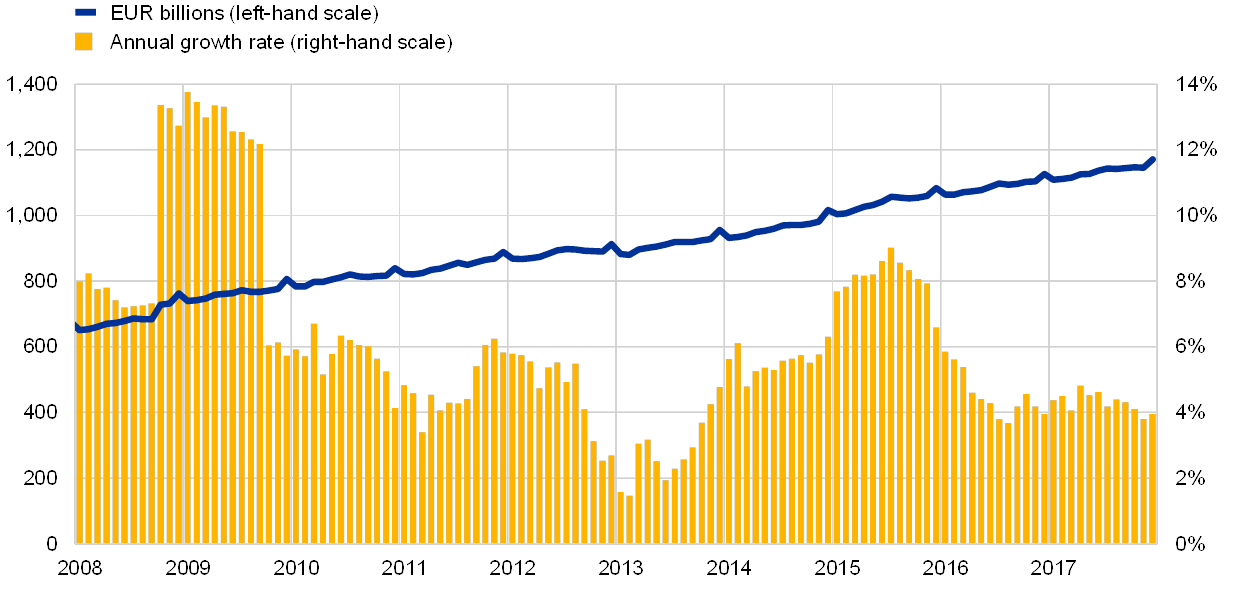
The value of euro banknotes in circulation grew continuously during the period from January 2008 to December 2017, with an average annual growth rate of 6.1%. At the end of 2017, the total value of euro banknotes in circulation was €1,171 billion, with an annual growth rate of 4.0%. Seasonal patterns in circulation can be observed especially during summer holidays and the Christmas period (see Chart 1). The ratio of banknotes in circulation to nominal gross domestic product (GDP) has increased from 7.9% to 10.5% over the past ten years, indicating that, while in line with the GDP growth trend (see Chart 2), the value of euro banknotes in circulation has been growing faster than the overall economy and that other factors have therefore been contributing to this increase. Some of these factors are described in more detail in the present article.
Chart 1
Euro banknote circulation
(annual percentage change, monthly data, EUR billions)
Source: ECB Currency Information System.
Note: The latest observations are for 31 December 2017.
Chart 2
Euro banknote circulation and GDP
(in percentages)

Sources: ECB Currency Information System and Statistical Data Warehouse.
Notes: Annual growth rates calculated at the end of the year. Nominal GDP at market prices.
During the period under review, the euro was successively adopted by Cyprus and Malta (2008), Slovakia (2009), Estonia (2011), Latvia (2014) and Lithuania (2015). The effects of the euro’s introduction in these countries on the total number and value of euro banknotes in circulation has, however, been very limited. Two months after their respective introductions of the euro, these countries’ contributions to the total value of euro banknotes in circulation ranged between 0.03% and 0.35%.
Apart from the introduction of the euro in the aforementioned six Member States, euro banknote circulation over the period from 2008 until the end of 2017 was characterised by four main events.
The Lehman Brothers crisis – Between January and September 2008 the average annual growth rate of the value in circulation was 7.6%. Following the bankruptcy of Lehman Brothers on 15 September 2008 the net issuance of euro banknotes increased by €43.7 billion in October, of which net shipments of euro banknotes to regions outside the euro area amounted to €13.7 billion, the highest value since the introduction of the euro. From October 2008 until the end of September 2009, the value of banknotes in circulation continued to rise, with an average annual growth rate of 13.0%. Over this period the value in circulation increased by €83.3 billion, as compared to only €46.6 billion for the period from October 2007 to the end of September 2008. From this it can be inferred that the additional growth of the value in circulation due to the crisis amounted to around €37 billion. The €50, €100 and €500 denominations, which accounted for 18.4%, 17.5% and 56.9% of the additional increase, respectively, provided the greatest contribution.
The sovereign debt crisis – Autumn 2009 marked the beginning of the European sovereign debt crisis, whose effects on banknote demand lasted until the end of 2013. In an environment of uncertainty on the financial markets, lack of trust in government debt and low GDP growth in the euro area, demand for euro banknotes decelerated and the annual growth rate of the value in circulation reached its all-time low of 1.5%. Nevertheless, for the entire period from October 2009 to the end of 2013, the annual increase in the value in circulation was still relatively strong, averaging 4.6%.
The economic recovery in the euro area – Together with low interest rates (see Box 3), this resulted in an acceleration in banknote circulation growth from the beginning of 2014. In December 2014, the depreciation of the Russian rouble against the euro led to a remarkable increase in purchases of euro banknotes from regions outside the euro area, primarily Russia. Net shipments in December 2014 amounted to €6.5 billion, marking the highest monthly volume observed since the 2008‑2009 financial crisis. The average annual growth rate during the period from January 2014 to January 2016 was 6.8%.
The Governing Council decision on the €500 – On 4 May 2016 the Governing Council decided to discontinue production of the €500 banknote with immediate effect and to stop its issuance around the end of 2018. The circulation of €500 banknotes has continuously declined since the first discussions on the topic were reported in the media in February 2016, although this decline has levelled off since April 2017. At the end of 2017 the value of €500 banknotes in circulation amounted to €256.8 billion, compared to €306.8 billion at the end of 2015. At the same time, the demand for €200, €100 and €50 denominations increased more than in previous years. This increase to a large extent offset the decline in €500 circulation. On average, from February 2016 to December 2017 annual circulation growth was 4.4%.
1.2 Denominational structure of the banknote
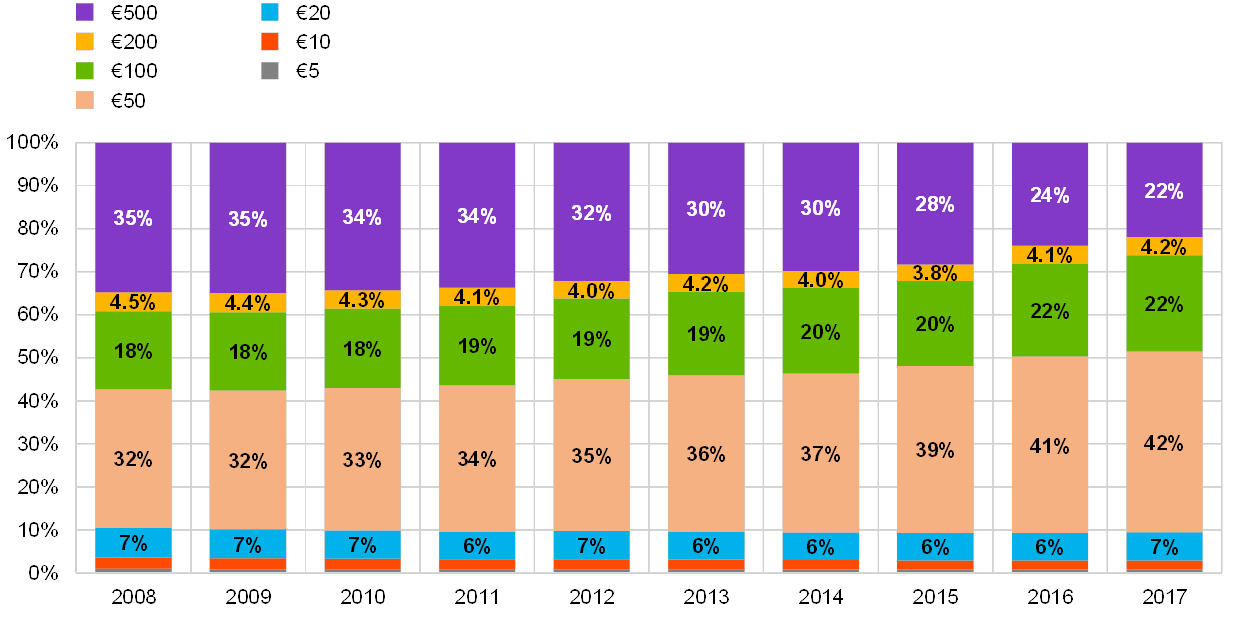
The €50 is by far the most circulated banknote. The €500 was the denomination with the highest share of banknotes in circulation in terms of value until April 2012, after which point the €50 became the most important denomination. At the end of 2017, the €50 accounted for 42% of the total value in circulation (see Charts 3 and 4). The popularity of the €50 can be attributed to the fact that this denomination is used both for transaction purposes and as a store of value. As a consequence of the Governing Council decision to stop issuing the €500, the increase in the total value of €50 and €100 banknotes in circulation accelerated further from February 2016. In October 2017, the €100 overtook the €500 as the second most important denomination in circulation in terms of value. The total value of €200 banknotes in circulation showed only slightly higher growth after the €500 decision. The combined share of the three highest euro denominations at the end of 2017 amounted to 48.5%. In comparison, the $100 banknote had a share of 79.7% of the total value of US dollar banknotes in circulation at that time. By contrast, since January 2008 the three lowest denominations (€5, €10 and €20), which are mainly used for transaction purposes, have had relatively steady shares of the value in circulation, totalling 10.5% at the end of 2008 and 9.5% at the end of 2017.
Chart 3
Euro banknotes in circulation by denomination
(value, EUR billions)

Source: ECB Currency Information System.
Note: The latest observations are for 31 December 2017.
Chart 4
Share by denomination of euro banknotes in circulation
(value, share)
Source: ECB Currency Information System.
Note: The latest observations are for 31 December 2017.
Looking at the contribution of each denomination to the share of the banknote value in circulation as a percentage of GDP (see Chart 5), it is clear that the €50 and €100 banknotes in particular contributed to the increase in the cash to GDP ratio. The ratio of €500 banknotes to GDP increased to 3% during the first year after the Lehman Brother crisis, after which it began to decline. This trend accelerated with the announcement of the decision to stop issuing the €500 banknote, with the ratio reaching 2.3% at the end of 2017. By contrast, the ratio of €200 banknotes to GDP has seen only a very marginal increase over the past ten years and the ratios of €5 and €10 banknotes to GDP have remained stable, confirming that these banknotes are typically used for transaction purposes. Surprisingly, the ratio of €20 banknotes to GDP increased faster than the size of the euro area economy, indicating that factors other than the increase in the number of transactions have also contributed to the demand for this denomination. Chart 5(a) shows the development of the ratios for the high and middle denominations, i.e. €50 to €500, and Chart 5(b) for the three low denominations, i.e. €5, €10 and €20.
Chart 5
Ratio of banknotes in circulation to nominal GDP
(percentage of nominal GDP)

Sources: ECB Currency Information System and Statistical Data Warehouse.
Note: Nominal GDP at market prices.
2 The different drivers of euro banknote circulation
2.1 The use of cash for domestic transactions
Euro banknotes are used as payment instruments by 340 million European citizens for their daily private or professional transactions. The determinants of cash held and used for private transactions at points-of-sale (POS) were described in detail in a recent ECB study.[1] Cash is also held by merchants and in vending, ticketing and gaming machines as well as stored by monetary financial institutions (MFIs) for distribution via bank counters or ATMs (see Box 3).
Box 1 The use of cash at POS, insights from a survey
Additional insights from the survey on the use of cash by households in the euro area
The ECB Occasional Paper “The use of cash by households in the euro area” revealed that, across the euro area in 2016, an average of 79% of all POS transactions were carried out using cash. In terms of the value of transactions, cash accounted for a share of 54%.[2] The average value of a transaction made using any means of payment was €18.10. The average value of a cash transaction was €12.38. Indeed, as already shown in the study, approximately two-thirds of all payments were for less than €15, of which 88% were made in cash. In other words, cash is generally used for small-value transactions. At the same time, only 8% of all POS transactions involved amounts of €50 or more and only 2% of the number of all POS transactions involved amounts of €100 or more. When looking at the value of transactions, however, the picture is different. In value terms, in 2016 only 20% of all POS transactions involved amounts less than €15, and those involving amounts of €50 or more represented 43% of the total value of POS transactions, as shown in Chart A.
Chart A
Use of payment instruments at POS, by value range
(value of transactions, shares)

Sources: ECB, Deutsche Bundesbank and De Nederlandsche Bank.
Note: This survey was conducted in 2016.
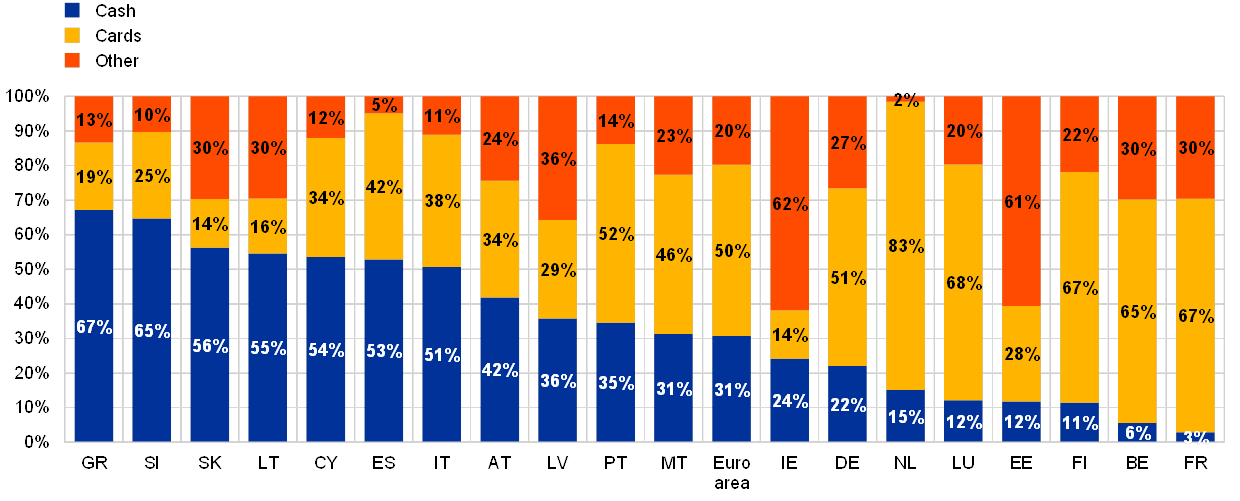
Higher-value transactions are mainly carried out using payment cards, but more than one-third of POS transactions involving amounts greater than €100 are still made in cash. Nevertheless, in line with the other findings of the study, there are large differences across the euro area in the use of cash for payments, including for amounts greater than €100. Chart B shows that in seven euro area countries more than 50% of POS payments, in terms of value, were in cash, while in other countries such as France and Belgium the share of high-value transactions using cash was relatively minor.
Chart B
Transaction values by instrument and country for POS transaction amounts greater than €100
(percentage of total POS transactions > €100; value of transactions)
Sources: ECB, Deutsche Bundesbank and De Nederlandsche Bank.
Note: This survey was conducted in 2016.
Chart A shows that the larger the amount the consumers have to pay, the less likely it is that they will pay with cash. However, not all consumers behave similarly in terms of the thresholds at which they pay with cash, cards or other means: only 49% of the respondents in the 17 euro area countries in which the question was asked responded that their choice of payment instrument depended on the amount to be paid, with roughly one-third of respondents stating that they typically paid amounts less than €20 using cash (see Chart C). In contrast, 50% of respondents said that their payment behaviour is not normally dependent on the amount to be paid, 23% reported that they always paid with cash, and 27% normally always paid with cards. The results by country are in line with expectations based on other results of the survey. More than 50% of the respondents in Estonia and in Finland stated that they typically used cards, irrespective of the amount, while in Cyprus, Malta, Greece, Italy and Austria, less than 20% of respondents typically did so.
Chart C
Threshold amount below which cash is preferred
Question: When shopping in shops, what is the amount below which you would typically pay with cash instead of other payment methods?
(percentages; based on 20,772 respondents from the euro area)

Source: ECB.
Note: Results not comparable for the Netherlands and not available for Germany. This survey was conducted in 2016.
The future of cash used for transaction purposes
The results of recent payment behaviour surveys are presented in Chart D. Consumer payment behaviour in the countries in question is heterogeneous, with Germany and Switzerland being primarily cash-based countries and Sweden almost a cashless society. Cash usage in the euro area as a whole is comparable to that in Germany. Interestingly, the United Kingdom and the Netherlands have followed almost the exact same pattern of declining cash usage. All of the countries that have conducted surveys over time have found that the use of cash as a percentage of total transactions has fallen, albeit at different rates, and while its speed cannot be predicted, a similar decline in the use of cash can be expected for the euro area as a whole as well.
Chart D
Cash transactions as a percentage of POS transactions or all transactions
(percentages, number of transactions)

Sources: ECB, Danmarks Nationalbank, Deutsche Bundesbank, De Nederlandsche Bank, UK Finance (UK Payment Markets Summary 2018), Swiss National Bank and Sveriges Riksbank.
Notes: The surveys are based on different scopes (e.g. focus on POS transactions or all transactions) and methodologies. The data for Sweden are taken from the Swedish survey question: How did you pay the last time you paid for something?
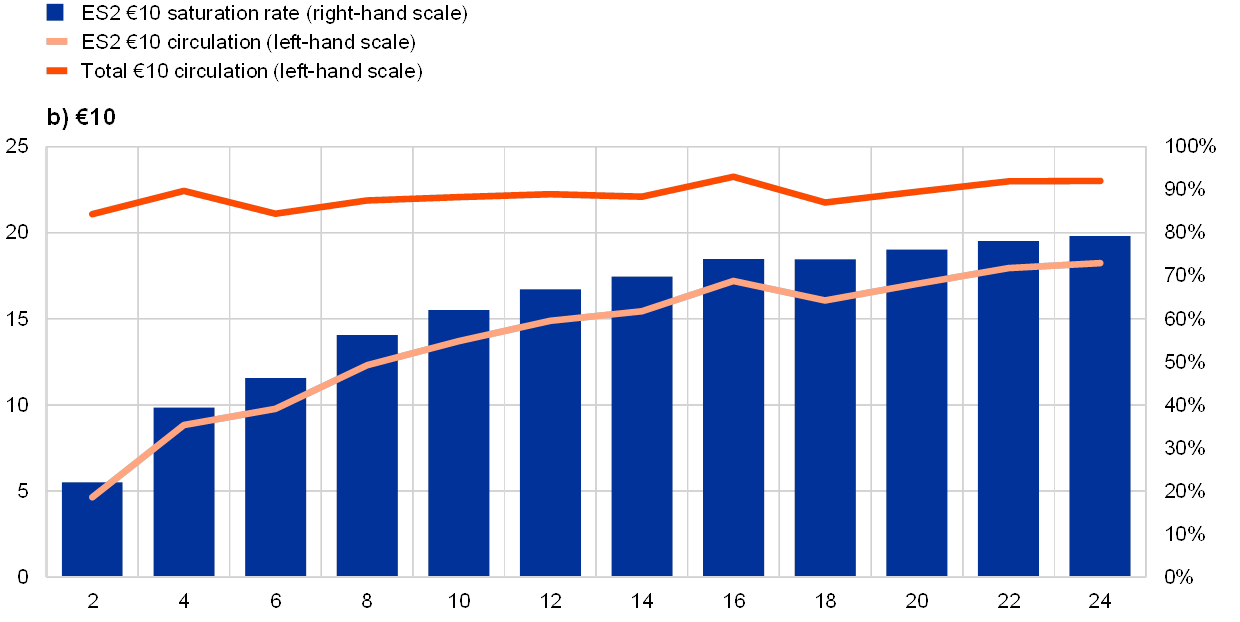
The introduction of the second series of euro banknotes (i.e. the Europa series) provides a unique opportunity to estimate the percentage of banknotes in circulation used for domestic transaction purposes. The €5 to €50 denominations of the Europa series have been introduced successively since 2013.[3] The pace of the replacement of first series banknotes in circulation by second series banknotes within a defined period of time may provide an indication of the percentage of banknotes in circulation used for payment transactions.[4] First series banknotes returning from circulation after this defined period may indicate that they were used as a store of value or held abroad. However, estimates based on this method have several limitations. First, both series were issued in different ways across denominations and countries. For example, each country had a different period during which first series banknotes of a certain denomination were still issued by the central bank following the introduction of the new series. Second, although the ECB has stated that the first series banknotes will retain their status as legal tender, the announcement of the launch of the second series may have, to a certain extent, triggered the use of first series banknotes which would otherwise have been kept as a store of value. Third, the minimum period after which a returned banknote can be considered to have been used as a store of value cannot be accurately determined.
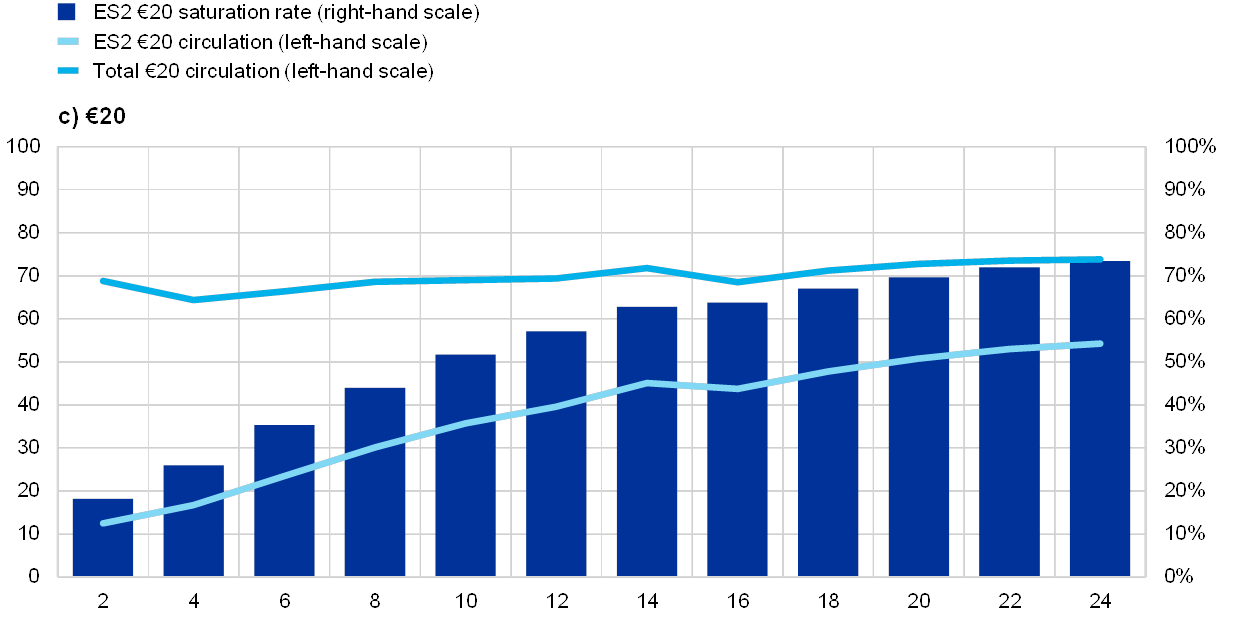
Charts 6(a) to (d) show that after 12 months the percentages of second series banknotes out of the total in circulation were 57% for the €5 and the €20, 67% for the €10 and 31% for the €50. Assuming that these saturation rates represent the active part of the €5 to €50 banknotes in circulation, it can be estimated that the value in circulation of €5 to €50 banknotes being used for transaction purposes is around €220 billion, i.e. slightly less than 20% of that of all denominations at the end of 2017. However, considering that the saturation had not fully stabilised after 12 months, the active circulation of these denominations is probably somewhat higher. Furthermore, the total share of cash in circulation used for transactions would be higher if the transaction values of the €100, €200 and €500 denominations were also taken into account.
As also shown in Charts 6(a) to (d), two years after the introduction of the Europa series, 27% of €5 and €20 and 21% of €10 banknotes of the first series have still not returned from circulation. The total value of all non-returned €5 to €20 banknotes as at the end of 2017 amounted to €24 billion. Some of these non-returned banknotes may have been lost, taken abroad or stored somewhere and forgotten. In any case all first series euro banknotes can continue to be used.[5]
Chart 6
Introduction of the second series of euro banknotes
(value, EUR billions)

Source: ECB calculations based on Currency Information System data.
Notes: The horizontal axis shows the number of months after the initial issuance of the second series banknote.

The return frequency of banknotes also provides an indication of their usage. Another method to estimate active circulation is based on the return frequency of banknotes, i.e. the number of times a banknote comes back to the central bank or a commercial bank designated by the central bank to hold banknotes on its behalf, within one year.
A low return frequency indicates that a denomination is kept in circulation for a long period of time. This could be an indicator of its function as a store of value. According to data for 2017, across the euro area €5, €10 and €20 banknotes came back to central banks an average of two to three times per year, whereas the €50 returned on average only once per year. Higher denominations, meanwhile, return only every two to four years. Considering the €10 as a pure transaction note[6] and applying its return frequency to all other denominations provides an estimate of their usage for transactional purposes. Based on this method, it can be estimated that the value in circulation of all denominations used for transaction purposes is approximately €280 billion, which represents a quarter of the total value in circulation as at the end of 2017.
Table A
Total value of cash used for transactions by denomination based on return frequency
(value, EUR billions)

Source: ECB calculations based on Currency Information system data.
Notes: €10 circulation based on second series circulation.
From an empirical point of view, it is difficult to clearly define the line between transaction and saving purposes. Both of the methods described above provide only very rough indications of the percentage of banknotes in circulation used for transactions. They both assume a clear distinction between cash that is used for transaction purposes and cash that is used as a store of value, which is of course never really the case. Since the intention of the holder is unknown, the question is whether cash should be considered a store of value after one month, three months, one year, etc. Some people, for example, tend to withdraw a large amount of cash at once and then replenish their wallets gradually from the banknotes stored at home. Furthermore, some of the cash that is hoarded for a long time may ultimately be used to make purchases.
2.2 The use of euro banknotes outside the euro area
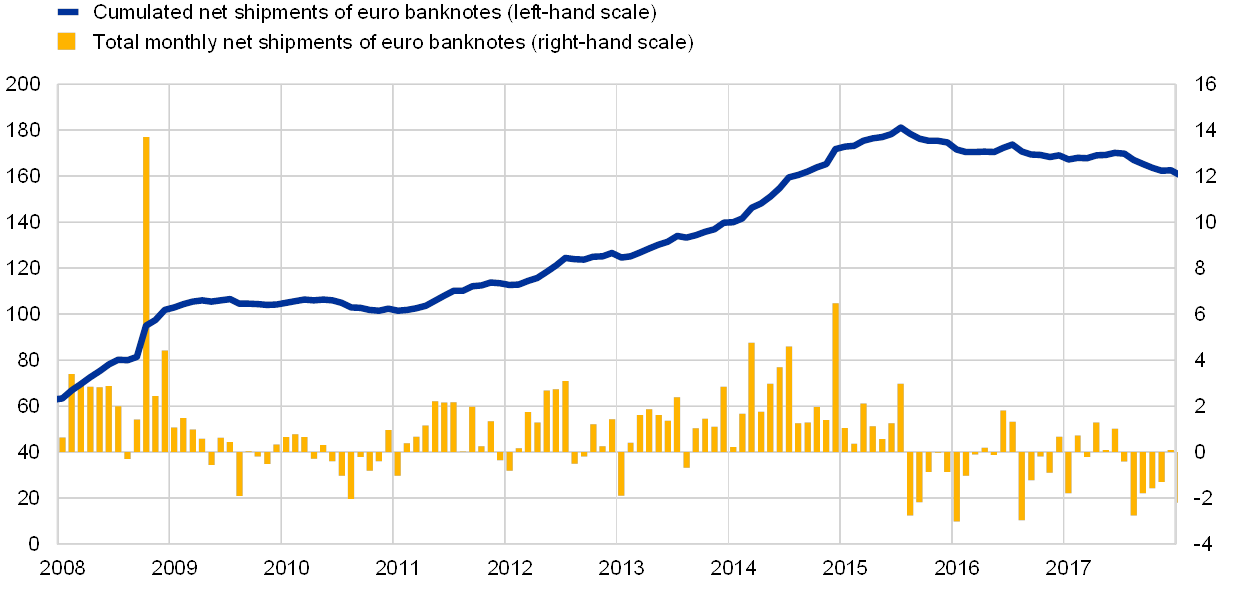
International demand for the euro is strong, although it has levelled off since the middle of 2015. Euro banknotes are also held outside the euro area for transaction purposes (e.g. euroisation[7], cross-border shopping, travel for leisure or business) and as a store of value (e.g. savings, currency reserves and asset portfolio management). Non-euro area demand is partially captured in the net shipments data, which cover registered flows of euro banknotes between central banks and MFIs in the euro area, on the one hand, and any legal persons outside the euro area, on the other. As at the end of 2017 the total cumulated net shipments (i.e. exports minus imports) of euro banknotes to regions outside the euro area amounted to €162.5 billion, which represented 13.9% of the total value in circulation (see Chart 7).
Monthly net shipments of euro banknotes have shown significant volatility during the period under review. The highest peaks in demand for euro banknotes occurred in October 2008, following the bankruptcy of Lehman Brothers, and when the EUR/RUB exchange rate jumped from 57.5 at the end of November 2014 to 70.3 by the end of the next month. Cumulated net shipments began to fall in August 2015.
Chart 7
Net shipments of euro banknotes to/from regions outside the euro area
(value, EUR billions)
Source: ECB Statistical Data Warehouse.
Notes: The latest observations are for 31 December 2017.
The fall in net shipments as of August 2015 can be attributed to a combination of factors. The perception of declining geopolitical uncertainty and increasing stability in regions bordering the euro area (e.g. Russia) as well as the Governing Council decision on the €500 may have driven down exports of €500 banknotes, while efforts by local authorities to promote the use of domestic currencies in euroised countries (i.e. the Western Balkans) may have led to increased imports of euro banknotes.[8] This is supported by the figures in Charts 8 and 9. The decline in net shipments can be attributed both to the fall in euro banknote exports (especially of the €500) and to the increase in imports (mainly of the €50).[9] More information on the circulation of euro banknotes outside the euro area can be found in the section on sales and purchases of euro banknotes by region (Box 2).
The €100 banknote is the preferred denomination on the international market. In more general terms, since February 2016 the €100 banknote has been the preferred denomination on the international market, overtaking the €500. The €50 is the most imported banknote, with total cumulated imports greater than total cumulated exports. This can be seen as a sign that more €50 banknotes leave the euro area unregistered and return via official channels than the other way around. This could, for example, occur when remitters take cash back to their home country or to countries in which their families live, when euro area tourists use euro banknotes in neighbouring countries where it is accepted (e.g. Turkey or Bulgaria) and, probably to a much lesser extent, when non-euro area tourists or business travellers leave the euro area and take euro banknotes with them. Low-denomination and €200 banknotes play a minor role in overseas demand. Nevertheless, it is worth noting that a large percentage of exported €200 banknotes is not reimported (between January 2013 and the end of 2017 the value of exported and imported €200 banknotes reached €20.9 billion and €4.6 billion, respectively).
Chart 8
Monthly exports of euro banknotes
(value, EUR billions)

Source: ECB Statistical Data Warehouse.
Chart 9
Monthly imports of euro banknotes
(value, EUR billions)

Source: ECB Statistical Data Warehouse.
A large percentage of the total number of euro banknotes in circulation may be held abroad. It is very difficult to estimate the amount of cash held outside the euro area. A method published on the ECB website[10] proposes calculating the minimum and maximum value of banknotes circulating outside the euro area on the basis of net shipments data (with a correction for the negative net shipments of €50), on the one hand, and a coins to banknotes ratio, taking into account the relative changes in the value of coins and banknotes in circulation, on the other hand. This method relies on the assumption that coin circulation abroad is negligible and that the increase in the value of coins in circulation is entirely the result of transaction needs within the euro area. The final estimate is given by the average of the two boundaries. Based on this method, it is estimated that around 30% of the total value in circulation (approximately €350 billion) was held outside the euro area at the end of 2017.
Box 2 Sales and purchases of euro banknotes to/from regions outside the euro area
Banknote wholesalers act as intermediaries between national central banks (NCBs) and commercial banks, bureaux de change and central banks in regions outside the euro area. They are responsible for most of the transactions included in the monthly net shipments statistics. The ECB has been collecting euro banknote trade data from these international banknote wholesalers, of which around ten operate globally or at least in certain regions of the world, on an annual basis. In terms of value, from 2008 to 2017 sales by wholesalers (euro banknote exports) decreased by around 30% while their purchases (euro banknote imports) increased by around 40%. In 2017 overall sales amounted to €52 billion and overall purchases to €55 billion. Charts A and B show sales and purchases by region from 2008 to 2017. Chart A illustrates the volatility of the Russian market, which represents a large share of eastern European (non-EU) sales.
Chart A
Time series of sales of euro banknotes by region
(EUR billions)

Source: Wholesalers’ reports.
Chart B
Times series of the purchases of euro banknotes by region
(EUR billions)

Source: Wholesalers’ reports.
Charts C and D indicate that, in 2017, around two-thirds of the value of all euro banknote shipments of wholesale banks related to purchase and sale transactions with European countries, including Russia and Turkey. On the sales side (see Chart C) exports to Switzerland, which is included in western Europe (non-EU), dominated, accounting for 28% of all euro banknote sales in 2017. Euro banknotes are dispensed by many ATMs in Switzerland and used for shopping in the surrounding euro area countries. 20% of all sales went to eastern Europe (non-EU), mostly to Russia, where euro banknotes serve predominantly as a store of value. The EU, in this case primarily the United Kingdom, accounted for 15% of all sales. That demand can be linked to tourism, in the form of British residents withdrawing euro banknotes before going abroad. On the purchase side (see Chart D), eastern non-EU countries, especially Turkey, predominated in 2017 and accounted for 30% of all banknote purchases. These euro banknotes were either carried to Turkey by Turkish workers in the euro area (remittances) or by tourists. Similarly, the high share of purchases from EU countries (28%) can be explained by remittances.
Chart C
Exports of euro banknotes by region in 2017
(percentages)

Source: Wholesalers’ reports.
Chart D
Imports of euro banknotes by region in 2017
(percentages)

Source: Wholesalers’ reports.
Asia & Australia, the Middle East and Africa, in this case primarily sub-Saharan Africa, were responsible for roughly equal shares of the sales to regions outside the euro area. On the purchase side, China and the United Arab Emirates dominated thanks to their roles as international marketplaces where goods are traded using international currencies. The significant purchases from Africa, in this case primarily northern Africa, can be explained by remittances and tourism. Euro banknote transactions with the Americas have traditionally been negligible due to the prevailing role of the US dollar in those regions.
2.3 The use of cash as a domestic store of value
In line with the Keynesian approach to the demand for money, speculation and precautionary motives are the two other motives for holding cash. As seen in previous sections, financial or currency crises affecting currencies in regions neighbouring the euro area have the potential to increase demand for euro banknotes as a precautionary measure. At the same time, a lack of trust in the euro can have a negative impact on demand for euro banknotes. In terms of speculation, the main determinant of cash demand relates to the opportunity costs of holding cash. The low interest rates of the past ten years mean that the opportunity costs of holding cash have been reduced for consumers and firms. Meanwhile, some banks have used cash to avoid the negative interest rates on the ECB’s deposit facility or on their current accounts with central banks (see Box 3).
Box 3 The cash holdings of monetary financial institutions in the euro area
The interest rate on the ECB deposit facility was lowered to 0% on 11 July 2012. It was then lowered by a further 0.10 percentage point on 11 June 2014, on 10 September 2014 and again on 9 December 2015. These decisions did not have a noticeable impact on the amount of cash held by MFIs (i.e. in their vaults and in cash dispensers, referred to as vault cash) until 16 March 2016, when the Governing Council decided to lower the interest rate on the ECB deposit facility to ‑0.40%. This decision represented a pivotal point for some MFIs, after which they decided to convert part of their liquidity into cash, as illustrated in Chart A. For these MFIs, the costs of cash (i.e. costs associated with cash storage and handling) were obviously less than the losses resulting from the negative yields from the ECB deposit facility and current accounts held at NCBs. An average of €50.1 billion was held as vault cash by MFIs between January 2008 and March 2016. Between March 2016 and December 2017 the amount of vault cash held by MFIs increased by €21.1 billion and reached €76.8 billion, i.e. 6.6% of the total value in circulation. The increase in vault cash was mostly driven by German MFIs (69.4% of the increase) and, to a lesser extent, by Italian, French, Austrian and Spanish MFIs.
Chart A
Vault cash held by MFIs and interest rates
(value, EUR billions)

Source: ECB Statistical Data Warehouse.
Notes: The latest observations are for 31 December 2017. Deposit facility rates shown are the rates at the end of each month.
This increase in vault cash has, however, remained limited. Logistical constraints such as storage capacities or maximum amounts covered by insurance are the most likely limitations on MFIs holding larger amounts of cash.
There are several methods to estimate the share of cash used as a store of value, including direct methods (by means of surveys) and indirect methods. Surveys tend to underestimate the use of cash as a store of value, as respondents are often not comfortable disclosing to research companies that they store cash at home or in another safe place. Moreover, respondents may not be willing to disclose the real amount of their savings, especially if such amounts are substantial. The questions in the “The use of cash by households in the euro area” study which focused on cash held at home by the respondents as precautionary reserves provide some insights into hoarding behaviour across the euro area in 2016. Results show that almost 25% of respondents have at least some cash outside a bank account, either at home or in a safe place. Of those, 78% stated that they keep less than €1,000 in total, 12% that they keep more than €1,000 and 10% refused to answer (see Chart 10). Those respondents hoarding more than €1,000 in total may have a noticeable impact on the average amount used as a store of value, but as there is no indication of the exact value no estimate can be made on the basis of these results. Nevertheless, the results show that people do store cash, and that some even store considerable amounts.
Chart 10
Precautionary cash reserves
Question: Could you provide an approximate amount of cash that you keep outside a bank account as a precautionary reserve or as an alternative way of saving?
(percentages, based on 7,611 respondents from the euro area)

Sources: ECB and De Nederlandsche Bank.
Notes: German results excluded given lack of available data. This survey was conducted in 2016.
A simple indirect method to estimate the share of cash used as a store of value is to assume that domestic hoarding is the residual of the circulation being used for transaction purposes, held by MFIs or held abroad. In this case, it can be inferred from the previous sections that more than one-third of total euro banknote circulation may currently be in use as a store of value within the euro area. Considering the numerous assumptions made, however, these estimates should be viewed with a significant degree of caution.
Box 4 Growth in euro coin circulation over the last ten years
Unlike the issuance of euro banknotes, the issuance of euro coins is a national competence. NCBs are responsible for the physical distribution of euro coins in nearly all euro area countries, although the ECB is responsible for approving the annual volume of coins that euro countries may issue.
In a manner similar to banknote circulation, the value of euro coin circulation grew continuously during the period from 2008 to 2017, at an average annual rate of 4.0%. Overall, the total value of euro coins in circulation at the end of 2017 was €28 billion (see Chart A). In addition to coins intended for circulation, each country may also issue collector coins. The total value in circulation of the latter at the end of 2017 was €4 billion. Of the eight coin denominations, the €2 has the highest share of the value in circulation followed by the €1, with 43.4% and 25.7%, respectively, at the end of 2017 (see Chart B). 1, 2 and 5 euro cent coins together accounted for only 6.7% of the total value in circulation, although they made up 64.1% of the number of coins in circulation. The high production requirements for the 1 and 2 euro cent coins compared to their limited active use in circulation has led to the introduction of rounding rules in some euro area countries.[11]
Chart A
Circulation of euro coins
(value, EUR billions)

Source: ECB Currency Information System.
Notes: The latest observations are for 31 December 2017.
Chart B
Share by denomination of euro coins in circulation
(value, share)

Source: ECB Currency Information System.
Notes: The latest observations are for 31 December 2017.
In order to better understand how the 1 and 2 cent coins are used, the ECB included a question on what people do with 1 and 2 euro cent coins received as change in the 2016 survey on the use of cash. The results are illustrated in Chart C. According to these results, 37% of the respondents reported that they don’t use these coins when they receive them as change, with most of them putting them in a jar or box at home. Slightly less than two-thirds of the respondents (63%) stated that they use them for subsequent payments. As with all aspects of payment behaviour, the use of 1 and 2 cent coins varies greatly from country to country. Logically, in those countries in which rounding rules have been introduced fewer people tend to use the 1 and 2 cent coins if they happen to receive them.
Chart C
Use of 1 and 2 euro cent coins by country
Question: What do you usually do when you receive 1 and 2 cent coins as change?
(percentages; based on 23,544 respondents from the euro area)

Sources: ECB and De Nederlandsche Bank.
Note: Results not available for Germany. This survey was conducted in 2016.
3 Conclusions
In recent years, euro banknote circulation has shown robust average growth above GDP. The demand for banknotes is determined by various factors, one of which is the use for transaction purposes. The results of a study on payment behaviour in 2016 showed that cash was still the most frequently used method of payment at POS in the euro area. Transaction demand, however, appears to only partially explain the growth in banknote circulation. The demand for banknotes has also been impacted by various additional factors such as the financial and sovereign debt crises, geopolitical uncertainties, exchange rate developments and policy decisions
Cash can be expected to remain an important means of payment at POS in most euro area countries for the foreseeable future. Nevertheless, the rapid rise in the use of contactless cards and mobile payments, the increase in online shopping and the development of instant payments, on the basis of which new retail payment solutions may emerge, can all be expected to have a noticeable impact on the use of cash for transaction purposes. Although the speed of a subsequent decline in the use of cash for transaction purposes cannot be predicted, it seems obvious that it will occur. As described in this article, however, the use of cash for transaction purposes is only one driver of banknote demand.
Most euro banknotes in circulation are used as a store of value in the euro area or held abroad. Considering that the opportunity costs of holding cash are currently low, if interest rates increase some of the stored euro banknotes can be expected to return. The fall in net shipments of euro banknotes to countries outside the euro area shows that some of the cash that was held abroad for various reasons is very gradually coming back. However, as shown by developments over the past ten years, the store of value function is determined not only by interest rates, but also by external events which cannot be predicted. While future developments may, therefore, lead to an increase or decrease in the use of cash as a store of value depending on users’ trust in the euro, current developments suggest that euro banknotes are considered a reliable means of holding liquidity and storing wealth, both within the euro area and abroad. Households and firms both inside and outside the euro area obviously value the fact that euro banknotes allow them to store part of their assets in central bank money.
- See Esselink, H. and Hernandez, L., “The use of cash by households in the euro area”, Occasional Paper Series, No 201, ECB, Frankfurt am Main, November 2017.
- The study was based on a payment diary survey in 17 euro area countries. The results of separate surveys in Germany and the Netherlands, carried out in 2014 and 2016, respectively, were integrated to show the share of cash in POS transactions across the entire euro area. In February 2018 the Deutsche Bundesbank published the results of a payment diary study entitled “Payment behaviour in Germany in 2017 – Fourth study of the utilisation of cash and cashless payment instruments”. The results showed a decrease in the share of cash payments in Germany by 5 percentage points in number and 6 percentage points in value compared with the 2014 survey, suggesting that the euro area results on cash use would have been slightly lower if German results for 2016 had been available for the euro area study.
- Launch dates of the second series: €5 on 2 May 2013, €10 on 23 September 2014, €20 on 25 November 2015 and €50 on 4 April 2017.
- See also “The demand for euro banknotes at the Bundesbank”, Monthly Report, Deutsche Bundesbank, March 2018, pp. 44‑49, and Bartzsch, N., “Transaction balances of small denomination banknotes: findings from the introduction of ES2”, in International Cash Conference, Deutsche Bundesbank, 2017, pp. 288‑311.
- The ECB may decide to withdraw their legal tender status at some point, following a timely announcement. However, all euro banknotes will always retain their value because it will always be possible to exchange them at the national central banks of the Eurosystem.
- Although the €5 is typically a transaction denomination, it was not chosen as the reference for the estimate because its return frequency is lower than that of the €10 and €20 banknotes. This can be explained by the fact that this denomination is not widely distributed via ATMs and that it is recirculated between merchants and consumers and less-frequently channelled back to a central bank or commercial bank designated by the central bank to store cash on its behalf.
- Montenegro and Kosovo use the euro as a currency without a formal arrangement.
- “The international role of the euro – Interim report”, ECB, June 2018, pp. 24‑25.
- The collection of data on imports and exports of banknotes started in January 2013.
- See “Estimation of euro currency in circulation outside the euro area”, ECB, April 2017.
- In Ireland (since October 2015), in the Netherlands (since September 2004) and in Belgium (since 2014), retailers are free to decide whether they wish to round cash payments to the nearest 5 cents, although they are reluctant to apply it in the third country. In Finland, the rounding rule has been mandatory since the launch of the euro. In Malta, the implementation of a rounding rule is being examined. The Italian Mint discontinued the production of 1 and 2 cent euro coins in January 2018.