
- PRESS RELEASE
- 28 November 2019
Monetary developments in the euro area: October 2019
- Annual growth rate of broad monetary aggregate M3 stood at 5.6% in October 2019, unchanged from previous month (revised from 5.5%)
- Annual growth rate of narrower monetary aggregate M1comprising currency in circulation and overnight deposits, increased to 8.4% in October from 7.9% in September
- Annual growth rate of adjusted loans to households stood at 3.5% in October, compared with 3.4% in September
- Annual growth rate of adjusted loans to non-financial corporations increased to 3.8% in October from 3.6% in September
Components of the broad monetary aggregate M3
The annual growth rate of the broad monetary aggregate M3 stood at 5.6% in October 2019, unchanged from the previous month, averaging 5.6% in the three months up to October. The components of M3 showed the following developments. The annual growth rate of the narrower aggregate M1, which comprises currency in circulation and overnight deposits, increased to 8.4% in October from 7.9% in September. The annual growth rate of short-term deposits other than overnight deposits (M2-M1) decreased to 0.6% in October from 1.2% in September. The annual growth rate of marketable instruments (M3-M2) was -2.4% in October, compared with -1.1% in September.
Monetary aggregates
(annual growth rates)
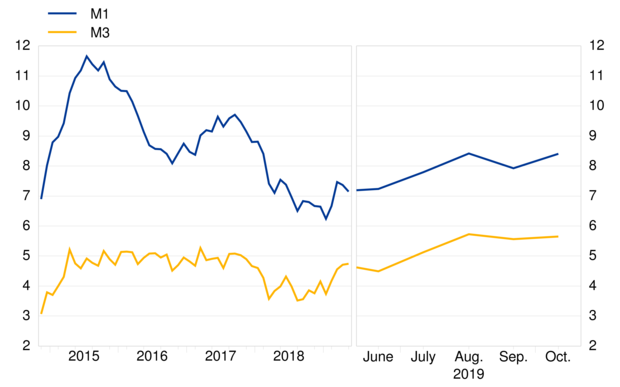
Looking at the components' contributions to the annual growth rate of M3, the narrower aggregate M1 contributed 5.6 percentage points (up from 5.3 percentage points in September), short-term deposits other than overnight deposits (M2-M1) contributed 0.2 percentage point (down from 0.3 percentage point) and marketable instruments (M3-M2) contributed -0.1 percentage point (as in the previous month).From the perspective of the holding sectors of deposits in M3, the annual growth rate of deposits placed by households stood at 6.2% in October, compared with 6.3% in September, while the annual growth rate of deposits placed by non-financial corporations increased to 7.2% in October from 6.3% in September. Finally, the annual growth rate of deposits placed by non-monetary financial corporations (excluding insurance corporations and pension funds) increased to 4.3% in October from 3.7% in September.
Counterparts of the broad monetary aggregate M3
As a reflection of changes in the items on the monetary financial institution (MFI) consolidated balance sheet other than M3 (counterparts of M3), the annual growth rate of M3 in October 2019 can be broken down as follows: credit to the private sector contributed 3.5 percentage points (as in the previous month), net external assets contributed 3.0 percentage points (up from 2.8 percentage points), credit to general government contributed -0.5 percentage point (down from -0.4 percentage point), longer-term financial liabilities contributed -0.8 percentage point (up from -1.0 percentage points), and the remaining counterparts of M3 contributed 0.5 percentage point (down from 0.7 percentage point).
Contribution of the M3 counterparts to the annual growth rate of M3
(percentage points)

Credit to euro area residents
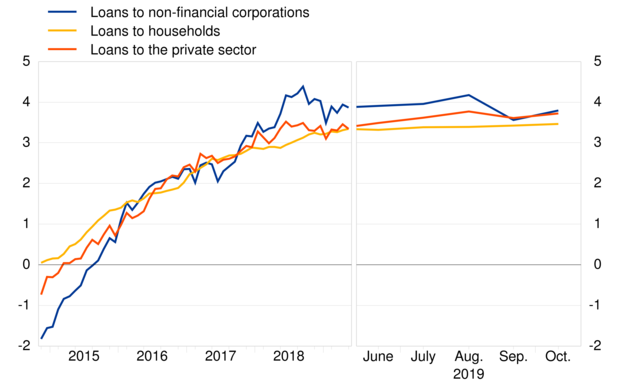
As regards the dynamics of credit, the annual growth rate of total credit to euro area residents stood at 2.0% in October 2019, compared with 2.1% in the previous month. The annual growth rate of credit to general government was -1.4% in October, compared with -1.1% in September, while the annual growth rate of credit to the private sector stood at 3.2% in October, unchanged from the previous month.The annual growth rate of adjusted loans to the private sector (i.e. adjusted for loan sales, securitisation and notional cash pooling) stood at 3.7% in October, compared with 3.6% in September. Among the borrowing sectors, the annual growth rate of adjusted loans to households stood at 3.5% in October, compared with 3.4% in September, while the annual growth rate of adjusted loans to non-financial corporations increased to 3.8% in October from 3.6% in September.
Adjusted loans to the private sector
(annual growth rates)
Annex
Table: Annex to the press release on monetary developments in the euro areaNotes:
- Data in this press release are adjusted for seasonal and end-of-month calendar effects, unless stated otherwise.
- "Private sector" refers to euro area non-MFIs excluding general government.
- Hyperlinks in the main body of the press release and in annex tables lead to data that may change with subsequent releases as a result of revisions. Figures shown in annex tables are a snapshot of the data as at the time of the current release.
Ευρωπαϊκή Κεντρική Τράπεζα
Γενική Διεύθυνση Επικοινωνίας
- Sonnemannstrasse 20
- 60314 Frankfurt am Main, Germany
- +49 69 1344 7455
- media@ecb.europa.eu
Η αναπαραγωγή επιτρέπεται εφόσον γίνεται αναφορά στην πηγή.
Εκπρόσωποι Τύπου