Foreword

Welcome to a revamped Financial Stability Review (FSR). Ever since the FSR was launched in 2004 by my late colleague Tommaso Padoa-Schioppa, the publication has continued to evolve and improve. The present issue introduces a number of new features, both in substance and in form. First, the Overview has been redesigned with the aim of offering a more thematic and comprehensive view of the key vulnerabilities for euro area financial stability, mirroring the discussion in the main chapters of the Review.
Second, the scope of the policy considerations presented in the Overview has been expanded beyond financial regulation to also include a section on Recommendations and policy considerations dedicated to issues relevant for financial stability in the euro area. Areas covered in this issue include housing markets, bank business models and non-performing loans, cybersecurity and the asset management sector.
Third, two new important systemic risk indicators are introduced which can be used as predictors of the consequences of financial instability for the real economy. The financial stability risk index (FSRI) predicts the near-term recessionary effects of financial stress, while the cyclical systemic risk indicator (CSRI) anticipates the medium-term consequences of financial instability (see Special Features A and B). The new systemic risk indicators will improve our ability to detect near to medium-term risks to financial stability in terms of “GDP-at-risk”. Other uses of these new indicators in calibrating the impact of macroprudential measures will be explored in the future, as the traditional credit-to-GDP gap has become less reliable. The methodology for assessing “GDP-at-risk” is fully in line with our definition of systemic risk. Systemic risk materialises when the ability of the financial system to provide essential financial products and services to the real economy is impaired to a point where economic growth and welfare may be materially affected.
Fourth, the scenario analysis in the chapter on Euro area financial institutions has been significantly changed. Previously, the section focused on measuring the impact on the solvency of banks and insurance companies of the various categories of identified risks in isolation. The main risks have now been mapped into two broad and internally coherent adverse scenarios to assess the resilience of the euro area banking sector. The chapter also includes the assessment of the non-bank financial sector, comprising euro area insurers and investment funds.
Fifth, a new chapter discusses developments in the Regulatory framework of the whole financial system in an all-encompassing manner. Financial regulation is the foundation of macroprudential policy because it deals with the design and calibration of instruments and the basic rules that impact the overall resilience of the financial system.
With analytical tools and recommendations, the FSR continues to fulfil its role in assessing developments relevant for financial stability, including identifying and prioritising the main sources of systemic risk and vulnerabilities for the euro area financial system – comprising intermediaries, markets and market infrastructures. It does so to promote awareness of these systemic risks among policymakers, the financial industry and the public at large, with the ultimate goal of promoting financial stability. The FSR also plays an important role in relation to the ECB’s microprudential and macroprudential competences, including the power to top up national macroprudential measures. By providing a financial system-wide assessment of risks and vulnerabilities, the Review provides key input to the ECB’s macroprudential policy analysis. Such a euro area system-wide dimension is an important complement to microprudential banking supervision, which is more focused on the soundness of individual institutions. While the ECB’s roles in the macroprudential and microprudential realms rely primarily on banking sector instruments, the FSR focuses on the risks and vulnerabilities of the financial system at large, including – in addition to banks – shadow banking activities involving non-bank financial intermediaries, financial markets and market infrastructures.
In addition to its overview of current developments relevant for euro area financial stability, this Review includes eight boxes and three special features aimed at deepening the ECB’s financial stability analysis and broadening the basis for macroprudential policymaking.
The Review has been prepared with the involvement of the ESCB Financial Stability Committee, which assists the decision-making bodies of the ECB in the fulfilment of their tasks.
Vítor Constâncio
Vice-President of the European Central Bank
Overview
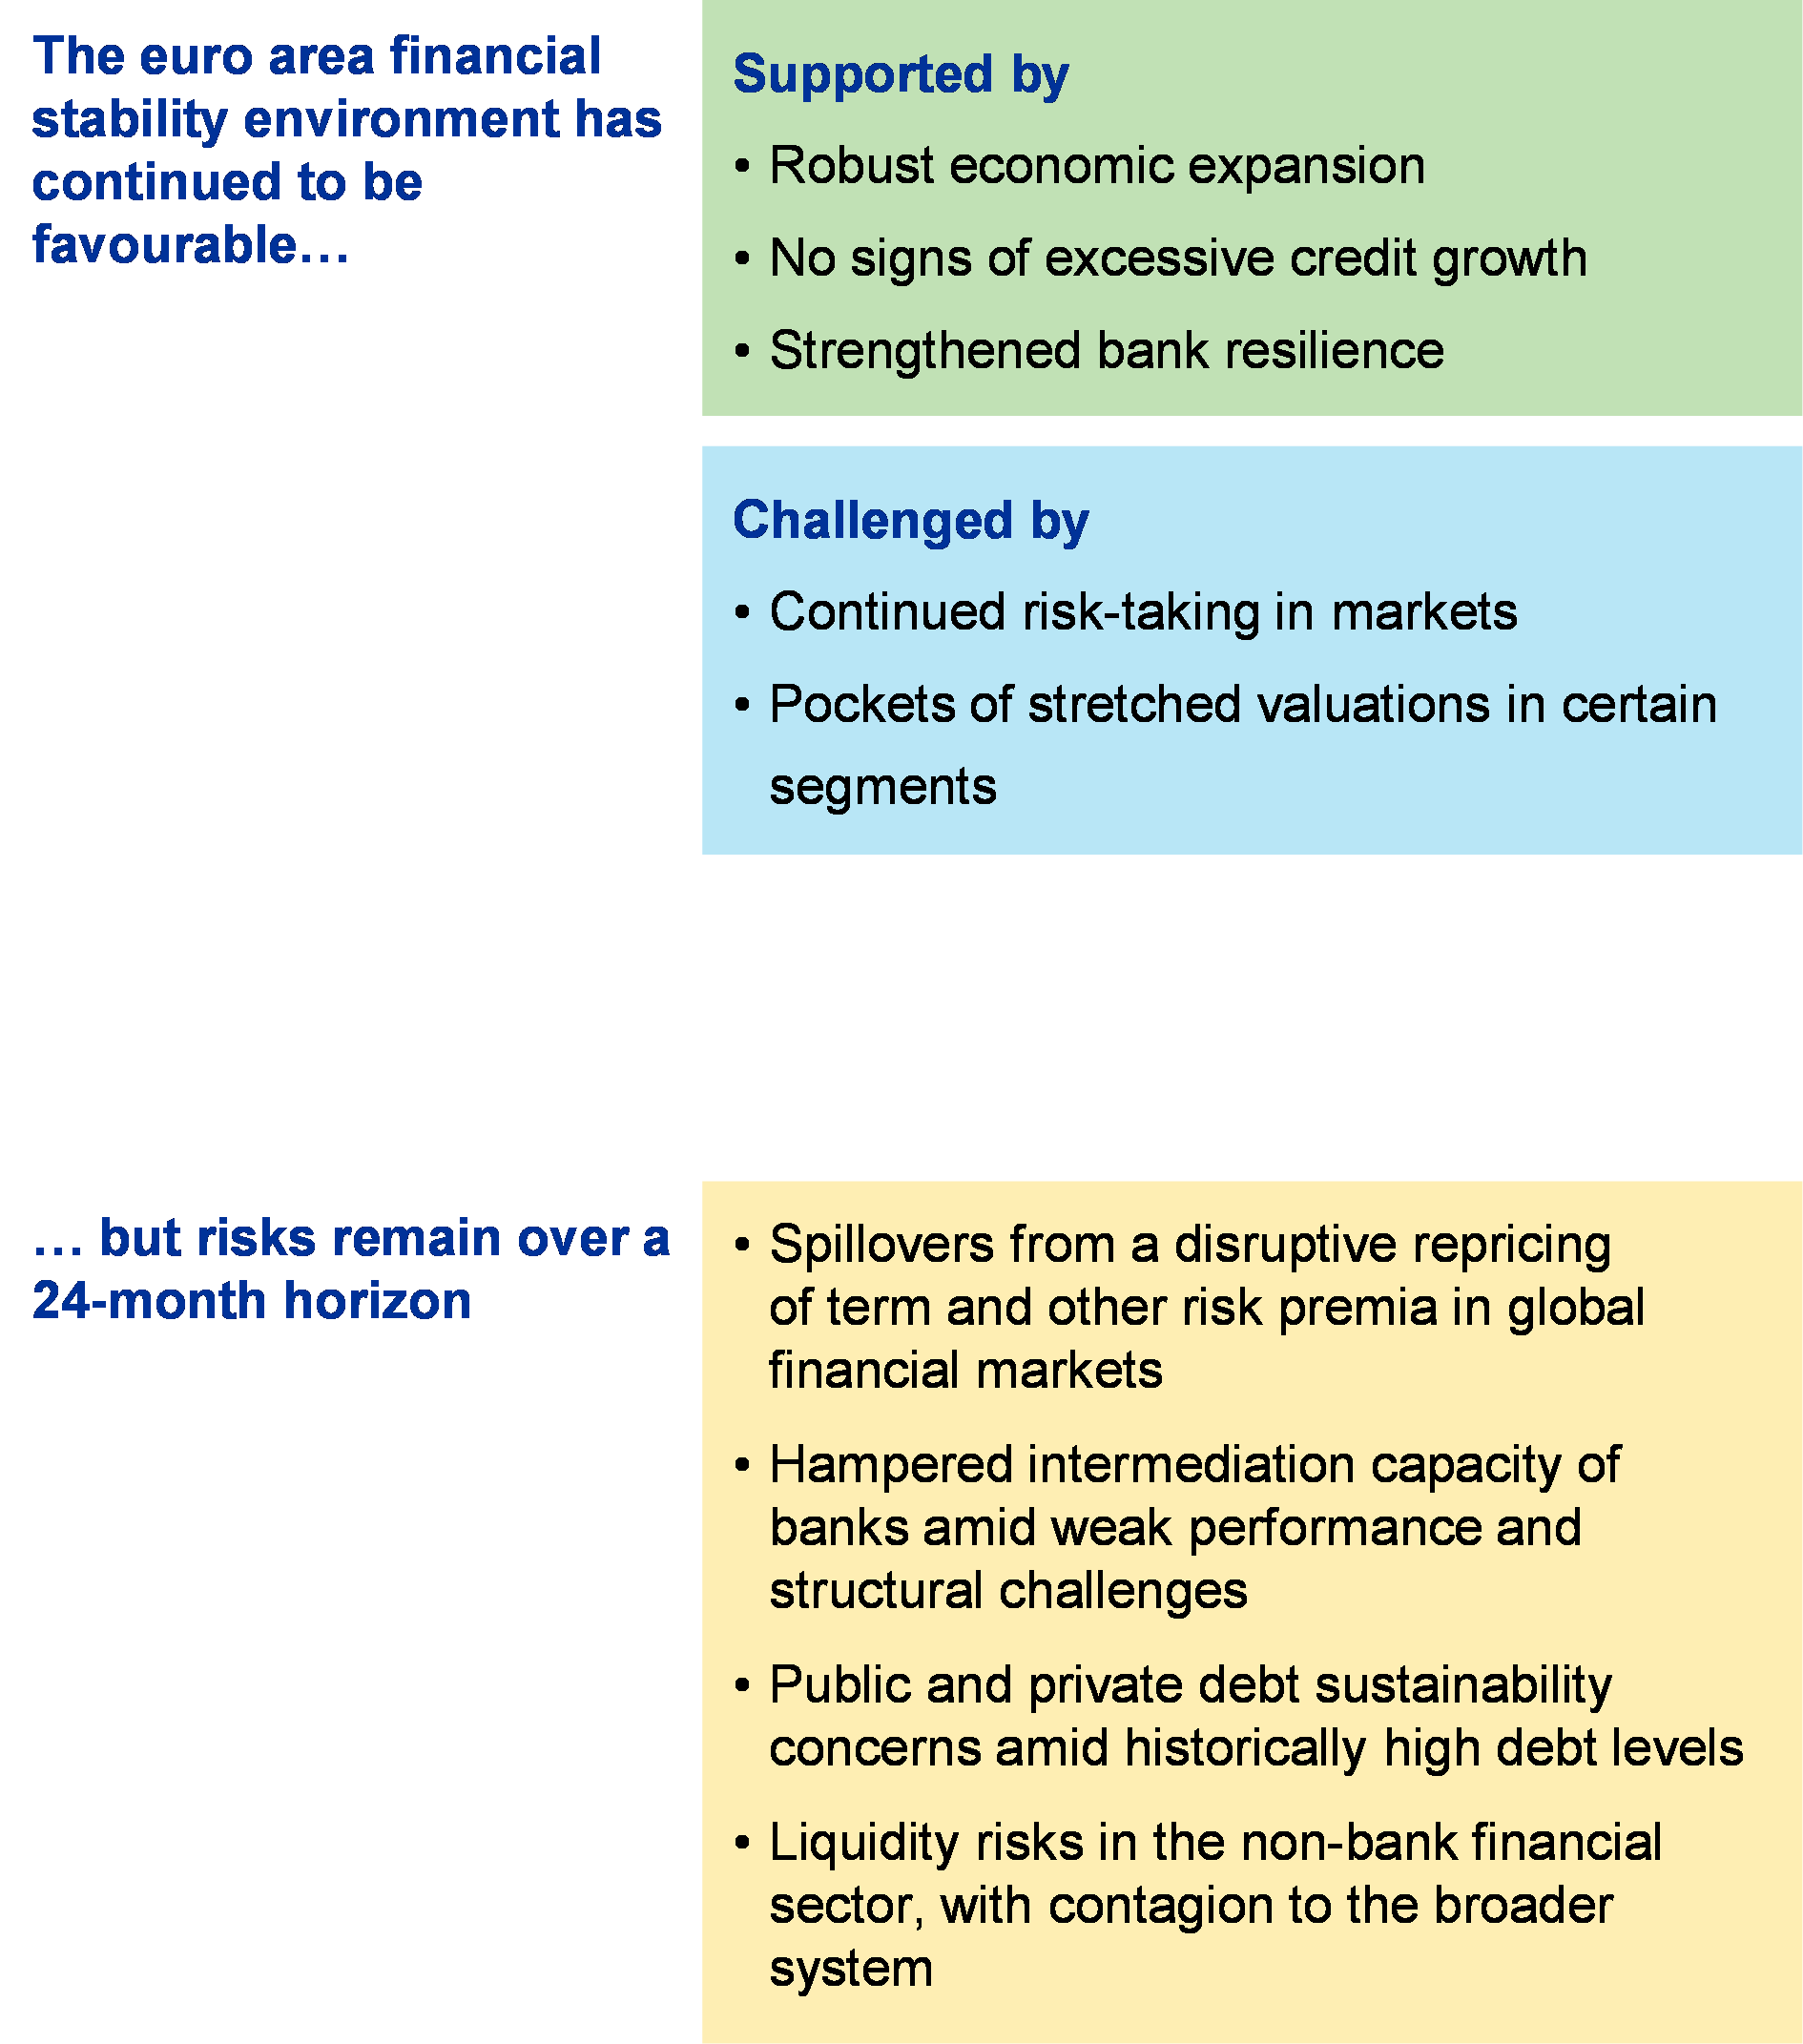
The financial stability environment in the euro area has remained favourable over the past six months. On the one hand, the economic expansion in the euro area has continued. As a result, the debt-servicing and loss-absorption capacities of sovereigns, firms, households and financial institutions have strengthened. The improvement in economic growth has also supported a moderate, albeit not excessive, pick-up in credit origination, which will support bank profitability. On the other hand, developments in asset prices require close monitoring as risk-taking continues to gain momentum in financial markets. At this stage no broad-based asset price misalignments can be observed across euro area financial and tangible assets. Some pockets of stretched valuations are, however, building up, particularly for lower-rated bonds and in certain real estate markets.
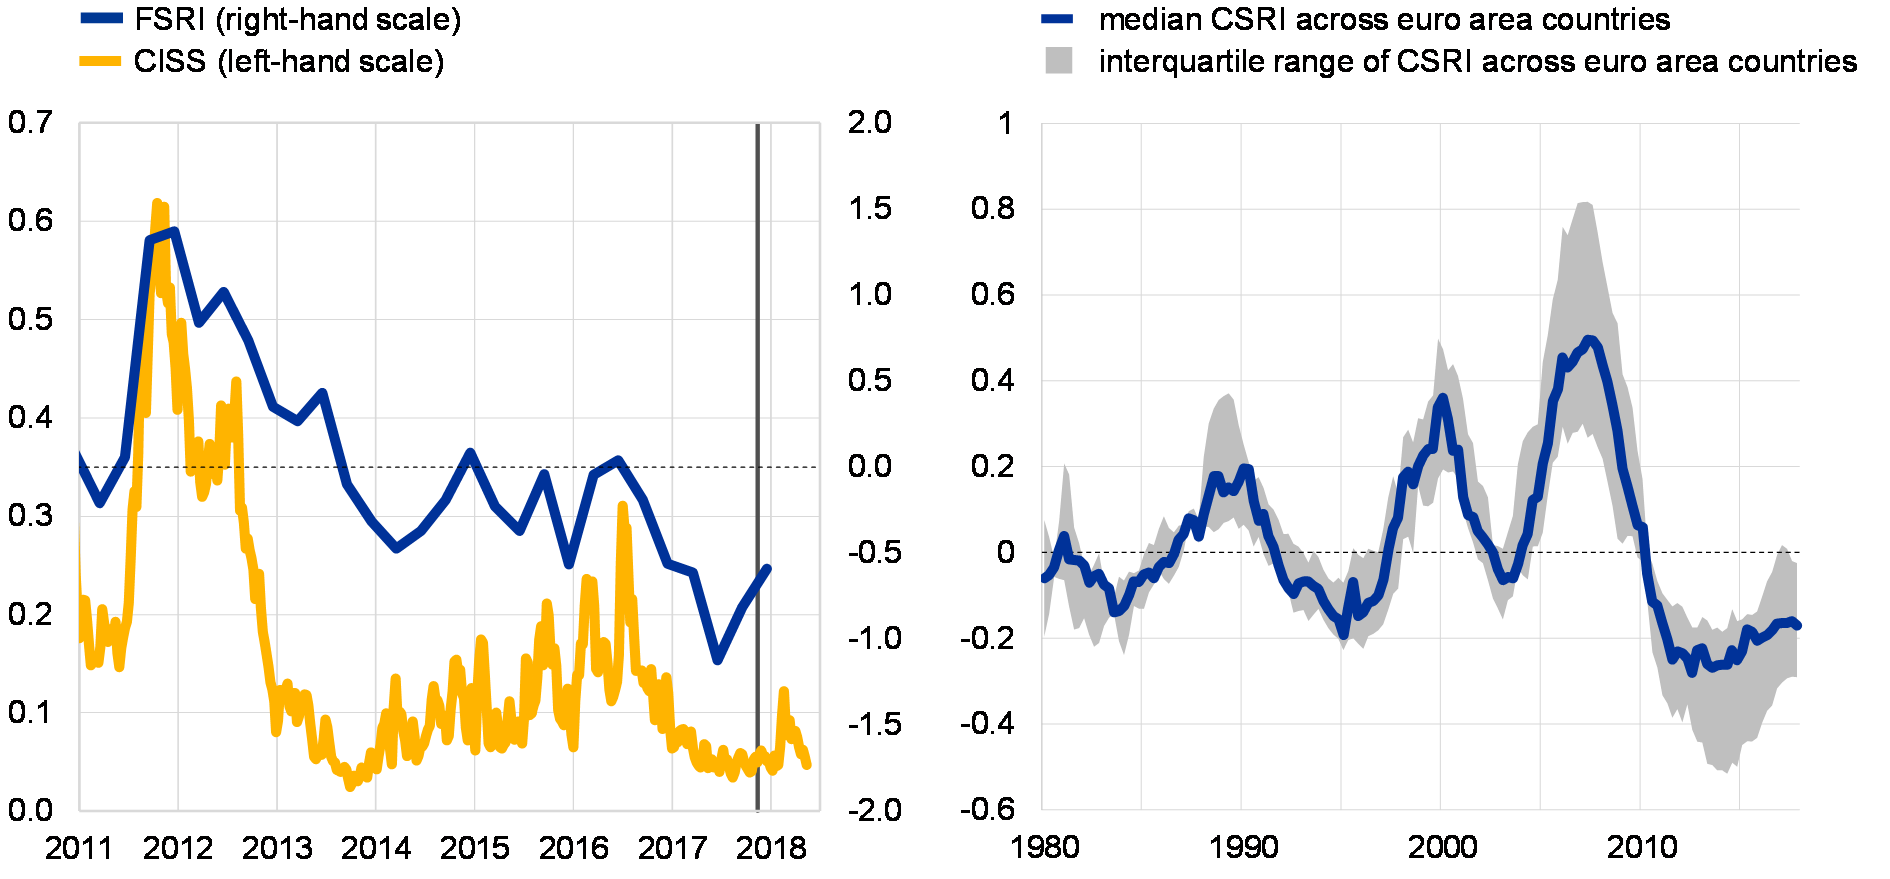
Summary indicators of systemic risk confirm a favourable financial stability environment. The composite indicator of systemic stress in financial markets (CISS) continues to signal that financial system stress is currently low, although it picked up slightly in February following the turmoil in stock markets. This issue of the FSR introduces new indicators for gauging near and medium-term risks to euro area financial stability (for details, see Special Feature A and Special Feature B). The first is a composite financial stability risk index (FSRI) aimed at predicting large adverse shocks to the real economy in the near term (see Chart 1 – left panel). The second is a composite cyclical systemic risk indicator (CSRI) designed to signal risks of a financial crisis over the medium term (see Chart 1 – right panel). Both indicators have fluctuated at low levels in recent quarters, implying a low likelihood of systemic risks to the euro area materialising in the near-to-medium term. While recent readings have increased somewhat, they come at a time of upward revisions to consensus expectations for GDP growth.
Chart 1
Economy-wide and financial market indicators of near-term and medium-term systemic risk remained contained
Financial stability risk index for the euro area economy and composite indicator of systemic stress in financial markets (left panel) and median of cyclical systemic risk indicator across euro area countries (right panel)
(left panel: Jan. 2011 – May 2018; Q1 2011 – Q4 2017; right panel: Q1 1980 – Q4 2017, median and interquartile range)
Sources: Bloomberg, ECB, Eurostat and ECB calculations.
Notes: For details on the FSRI, see Special Feature A. The scale in the left panel measures deviation from the historical mean expressed in multiples of the historical standard deviation. The CISS is normalised to lie between 0 and 1. FSRI: quarterly frequency; CISS: weekly frequency, two-week moving averages. The vertical line in the left panel represents the publication of the previous FSR on 29 November 2017. For details on the CSRI, see Special Feature B. The scale in the right panel measures deviation from the historical median expressed in multiples of the historical standard deviation.
This FSR identifies four key risks to euro area financial stability over the next two years. The first risk relates to spillovers from a disruptive repricing of term and other risk premia in global financial markets. The second risk concerns a potential hampering of banks’ intermediation capacity amid weak financial performance compounded by structural challenges. The third risk highlights public and private debt sustainability concerns amid historically high debt levels. Finally, the fourth risk relates to liquidity risks that could emerge in the non-bank financial sector, with contagion to the broader system. All four of these risks are intertwined and the materialisation of any one of them could potentially trigger the materialisation of the others.
Improved economic prospects
Since the November 2017 FSR, global economic growth prospects have further strengthened, but downside risks remain. The macroeconomic environment outside the euro area has improved overall, supported by favourable financing conditions and strengthening labour markets. Confidence indicators suggest that the global economic outlook will continue on its positive trajectory in the near term. Downside risks to the global macro outlook could, however, materialise via a number of channels. First, growth could deteriorate if uncertainties surrounding the fiscal and monetary policy mix in the United States increase. Second, a significant escalation of trade tensions risks derailing the ongoing expansion in global trade and activity. Third, abrupt changes in market sentiment and repricing in asset markets could lead to a real economic downturn via confidence and balance sheet channels.
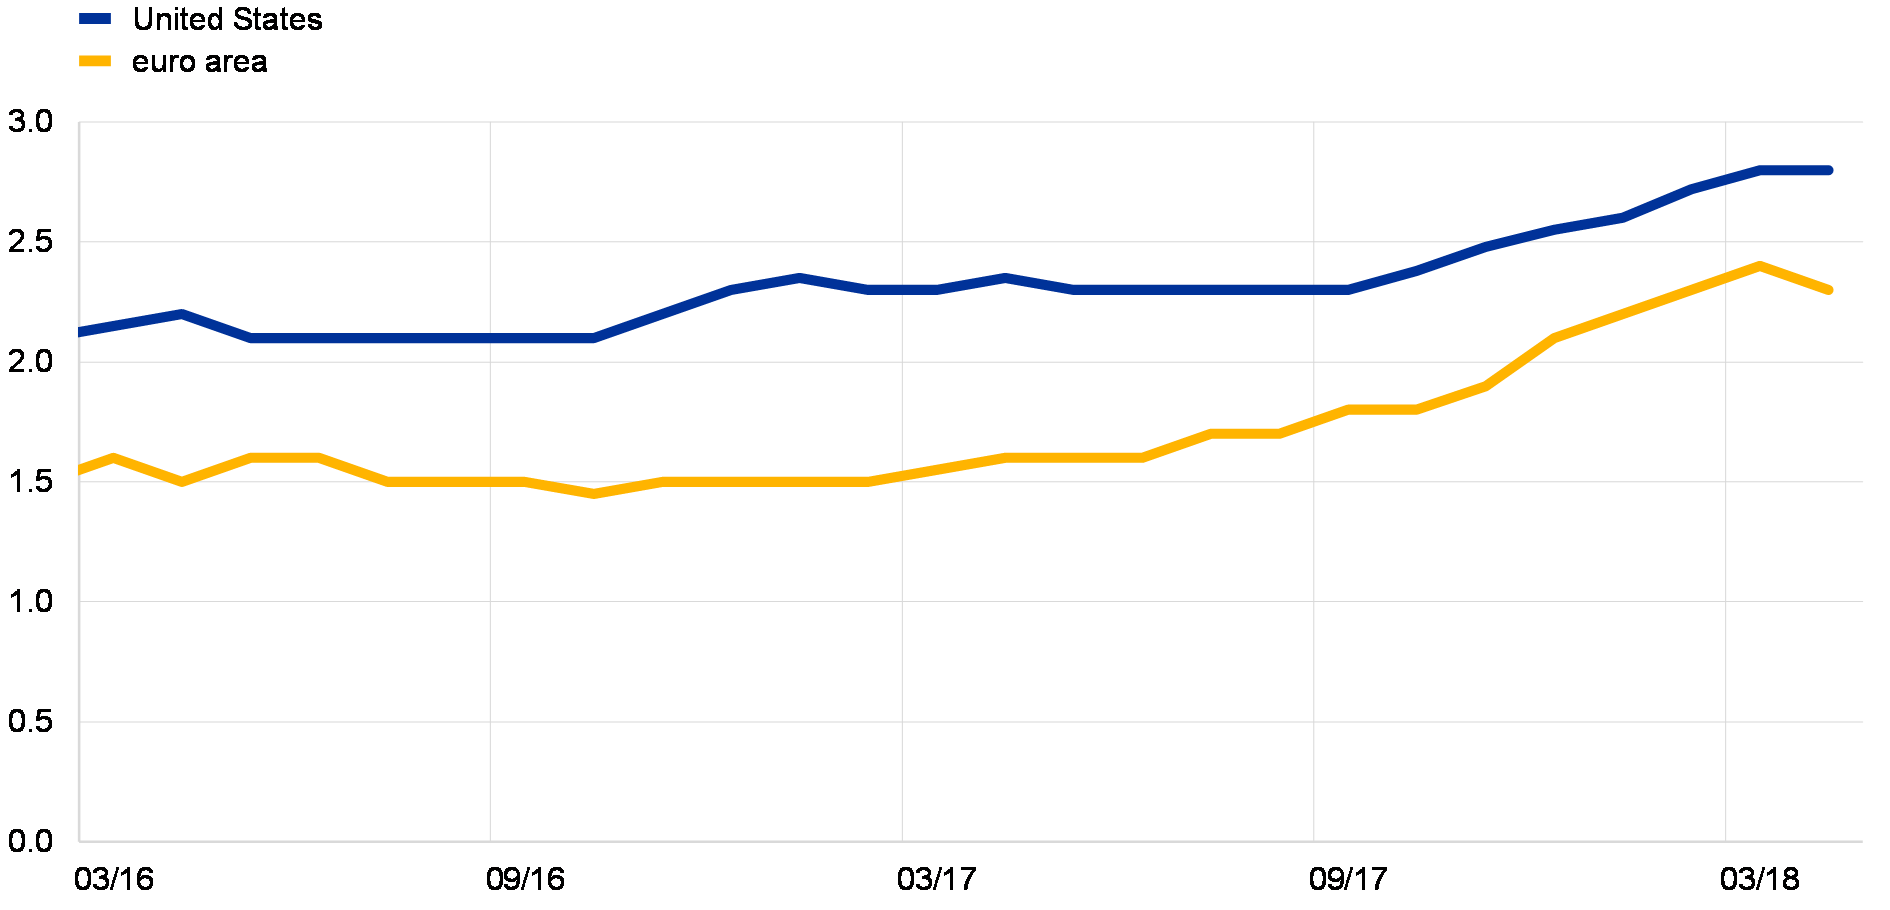
Financial stability in the euro area continues to benefit from a robust growth outlook (see Chart 2). Recent readings for the euro area confirm a solid and broad-based expansion of the euro area economy. Real GDP growth is expected to remain above potential until 2020. Downside risks to euro area real GDP growth continue to relate primarily to global factors, including developments in foreign exchange and other financial markets.
Chart 2
Improved economic growth prospects
US and euro area real GDP growth expectations for 2018
(Mar. 2016 – Apr. 2018; annual percentages)
Source: Bloomberg.
Note: Expectations of market analysts as surveyed by Bloomberg.
The resilience of the euro area economy has improved. Almost all euro area countries previously under stress in the crisis now have budget deficits below 3% of GDP. A broad-based improvement in primary balances can be observed, which has strengthened sovereigns’ shock-absorption capacity. Current account deficits have turned into surpluses owing to both structural and cyclical factors. All in all, the euro area is more resilient and better prepared to weather possible financial shocks coming from the international environment.
High indebtedness across sectors in a number of countries poses risks to financial stability
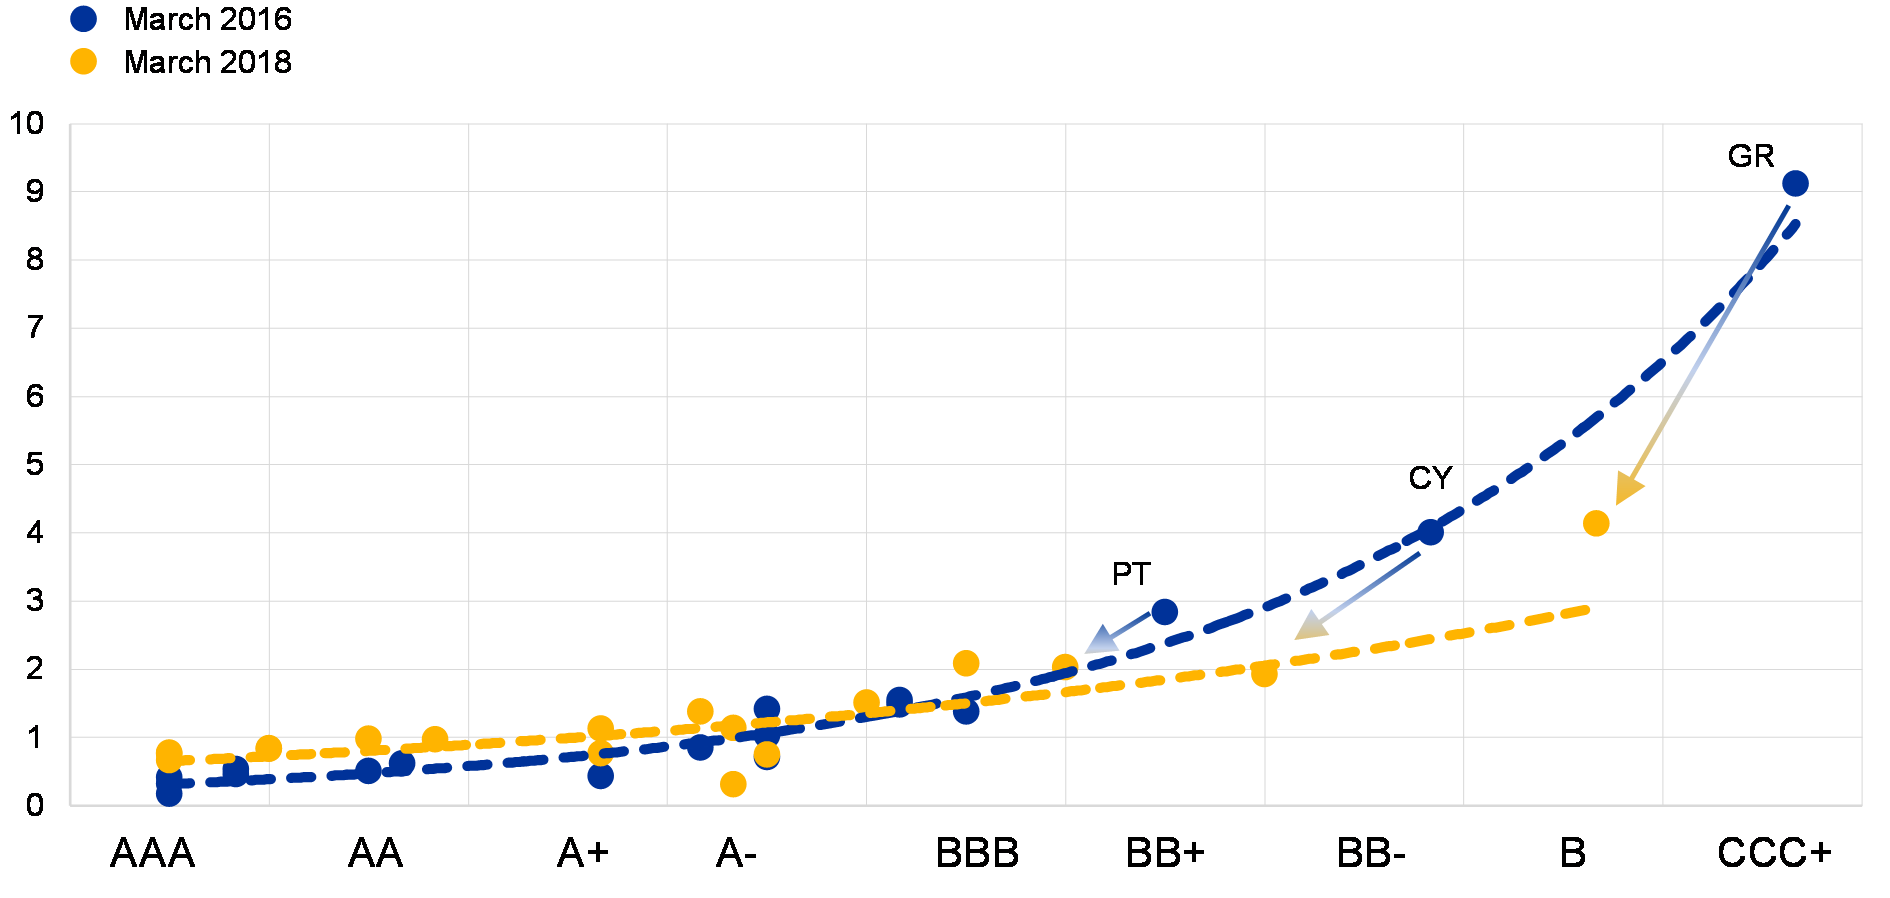
The improved macro outlook has benefited euro area sovereign financing costs. The creditworthiness of euro area sovereigns has improved, as confirmed by a number of rating upgrades. The brighter economic conditions, coupled with the overall favourable market sentiment, have contributed to lower financing costs across a number of euro area jurisdictions (see Chart 3).
Chart 3
Favourable financing costs for euro area sovereigns
Ten-year government bond yields and credit ratings of euro area sovereigns
(ratings; percentages per annum)
Sources: Standard & Poor’s, Moody’s, Fitch, ECB and ECB calculations.
Notes: The rating score represents the average rating by the three major rating agencies, Moody’s, Standard & Poor’s and Fitch. The bond yields indicate the long-term interest rate for convergence purposes (secondary market yields of government bonds with maturities of ten, or close to ten, years).
Despite the overall favourable developments in recent quarters, some euro area sovereigns remain vulnerable. Headline fiscal balances and the level of indebtedness across euro area countries are expected to improve over the coming years, strongly supported by the advantageous cyclical conditions. Some progress has been made across the euro area in reducing public debt levels, but in some countries they are still fairly elevated, highlighting the need to continue to maintain primary surpluses (see Chart 4). Going forward, risks mainly relate to a deterioration in the growth environment that could have a pronounced impact on the fiscal outlook and, by extension, on market sentiment towards some euro area sovereigns. Debt sustainability concerns may also be triggered by a possible rise in (geo)political risks. Uncertainties regarding the finalisation of the Brexit negotiations and possible adverse trade implications stemming from protectionist tendencies in advanced economies have the potential to challenge the economic outlook, which may push sovereign credit risk premia higher. These vulnerabilities and potential triggers notwithstanding, debt sustainability concerns for the euro area sovereign sector are currently assessed to be lower than they were at the time of the November 2017 FSR.
Chart 4
Sovereign debt levels have come down in recent years amid cyclical tailwinds, but sovereign indebtedness remains elevated in some euro area countries
General government debt-to-GDP ratios across the euro area
(percentages of GDP)
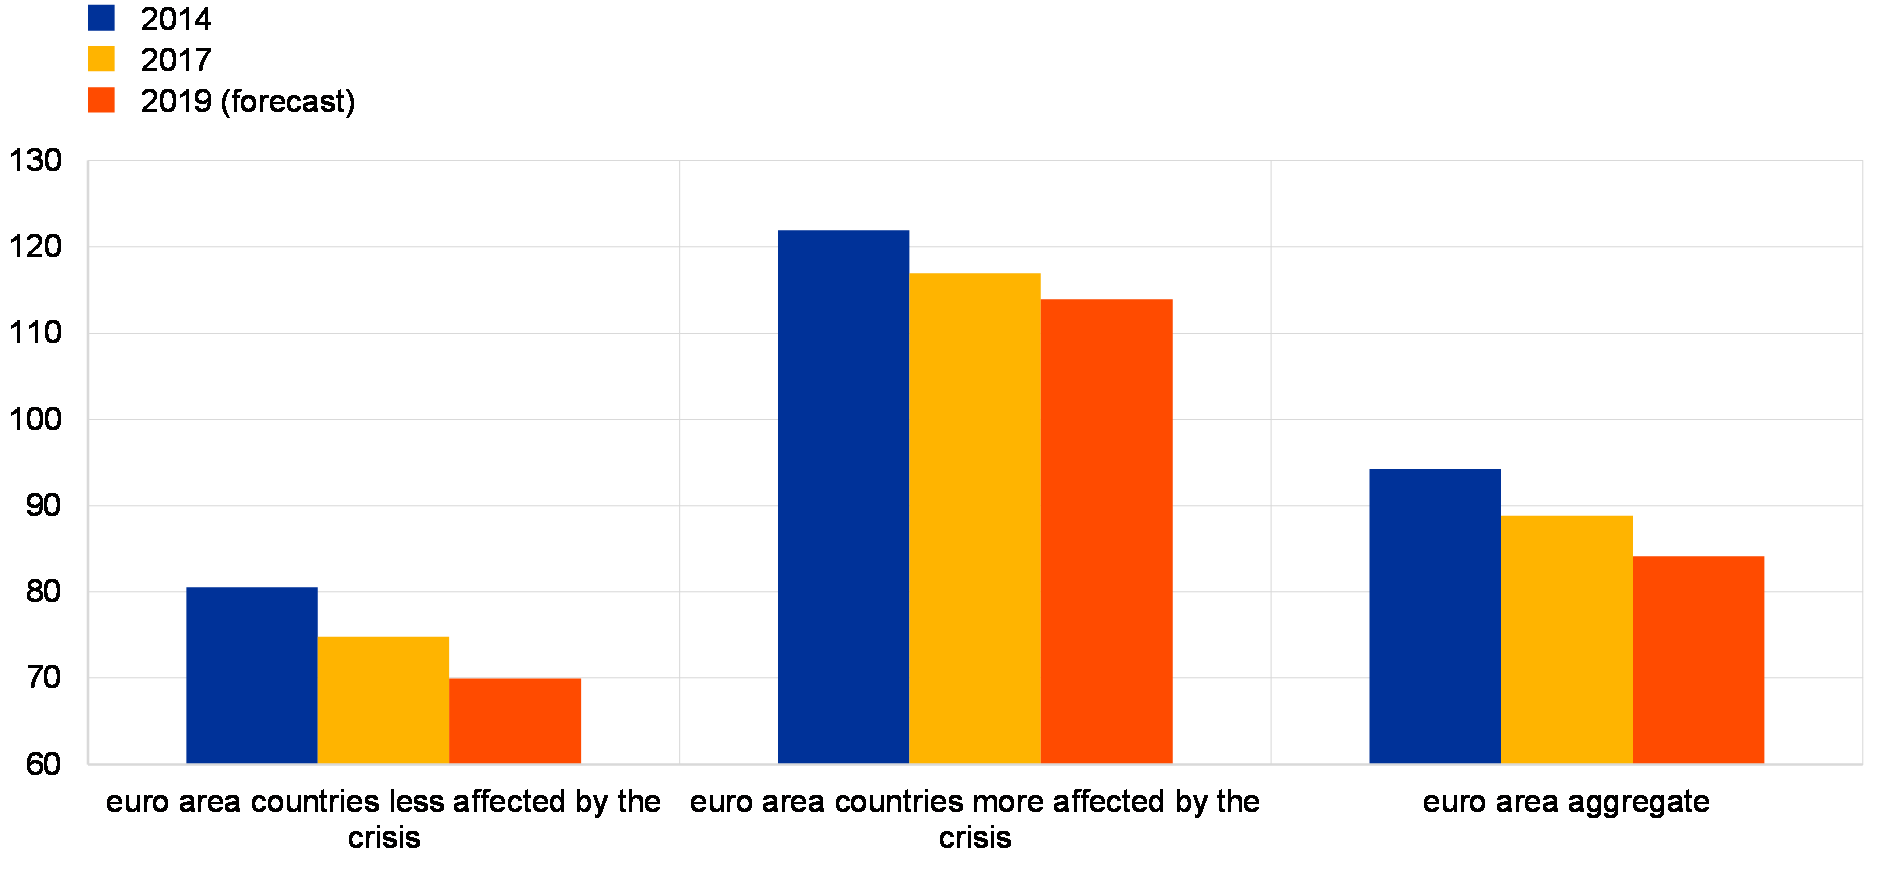
Sources: European Commission (AMECO Database) and ECB calculations.
Note: Euro area countries more affected by the crisis include Cyprus, Greece, Ireland, Italy, Portugal, Spain and Slovenia.
The private sector has also benefited from the favourable macroeconomic conditions, with credit flows recovering at a moderate pace. Bank lending to the corporate sector remains on a recovery path, reflecting supportive financing conditions, strong business confidence and the ongoing economic expansion. On the supply side, lending terms and conditions have continued to ease, albeit with some cross-country heterogeneity. In particular, bank lending conditions for firms continue to be tighter in most of the countries in which both firm indebtedness and non-performing loan (NPL) ratios are high. The household sector has also continued to take on more debt in an environment of favourable financing conditions, rising house prices and a further improvement in labour markets. The rate of growth in consumer credit has been particularly pronounced. In euro area mortgage markets, a rising volume of repayments of older loans – reflecting ongoing deleveraging of households in some countries – has been concealing an increasing dynamism in new loan origination over the past two years. The strength in the origination of new loans for house purchase is closely correlated with the buoyant house price dynamics observed in recent years.
High indebtedness of households, firms and governments in a number of countries poses risks to financial stability. Deleveraging in the sovereign and non-financial private sectors has been relatively slow. As a result, debt-to-GDP ratios across sectors remain high relative to standard benchmarks in a number of countries, even in a context of contained credit growth (see Chart 5). Corporate indebtedness in particular remains high at the aggregate euro area level by both historical and international standards. The high indebtedness may lead to renewed debt sustainability concerns, especially in the event of a rapid worsening of growth prospects. Furthermore, there are risks that an intensification of vulnerabilities in one sector could spill over to other sectors, with negative repercussions for the banking system. That said, the introduction of the Bank Recovery and Resolution Directive (BRRD), which has strengthened banks’ loss-absorbing capacity, has reduced the likelihood of one possible spillover channel materialising – namely that between banks and sovereigns.
Chart 5
High indebtedness across households, non-financial firms and governments in several euro area countries
Indebtedness of the sovereign and non-financial private sectors
(Q4 2017; percentages of GDP)
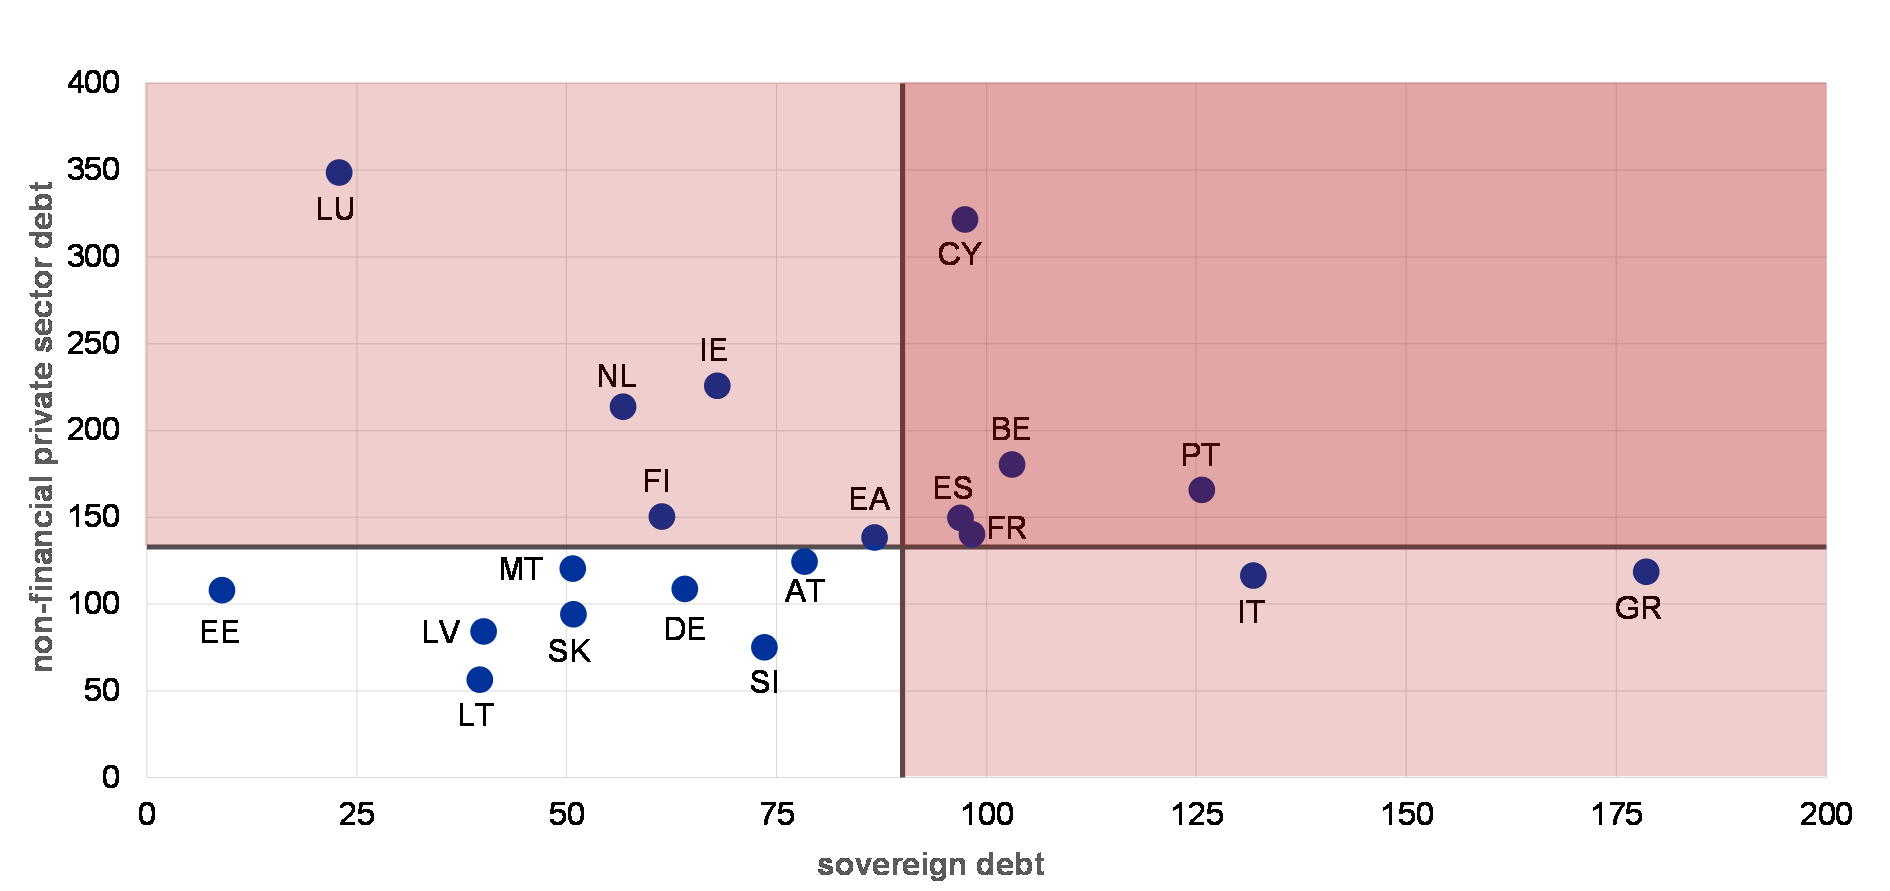
Sources: ECB and ECB calculations.
Notes: The non-financial private sector comprises households and non-financial corporations, including debt relating to special-purpose entities (SPEs). Non-financial private sector debt figures are on a consolidated basis. The horizontal line represents the threshold of 133% of GDP for non-financial private sector debt based on the European Commission’s MIP Scoreboard. The vertical line represents the threshold of 90% of GDP for sovereign debt and is based on findings in the empirical literature. See, for example, Checherita, C. and Rother, P., “The impact of high and growing government debt on economic growth – an empirical investigation for the euro area”, Working Paper Series, No 1237, ECB, 2010. Consolidated non-financial corporate debt figures also include cross-border inter-company loans, which tend to account for a significant part of debt in countries where a large number of foreign entities, often multinational groups, are located (e.g. Belgium, Cyprus, Ireland, Luxembourg and the Netherlands). In the case of Ireland, GDP may not be the most representative scaling variable given the activities of foreign-owned multinational enterprises resident in the country. Alternative metrics that are more related to the domestic economy, such as the Modified Gross National Income (GNI*) or Modified Domestic Demand, would yield considerably higher levels of sovereign and non-financial private sector indebtedness.
Vulnerabilities are building up in some euro area national housing markets
Some national real estate markets have experienced rapid price increases, exposing households and firms to vulnerabilities. In a number of countries and large cities, real estate prices have increased at a faster pace than household incomes. Indeed, prices in euro area residential real estate markets appear to be slightly above fundamental values (see Chart 6). Furthermore, prices in some euro area commercial real estate markets reached new highs, indicating potential misalignments vis-à-vis historical norms. Households and firms exposed to the real estate markets cannot expect past price performance to be a consistent indicator of future price developments. Thus, the build-up of vulnerabilities in the euro area real estate markets warrants careful monitoring with respect to the attendant financial stability risks in affected countries.
Chart 6
Euro area residential real estate prices slightly above those suggested by fair-value estimates amid measurement uncertainty
Residential property prices at the euro area level: deviations from estimated fair value
(Q1 2003 – Q4 2017; percentages, average valuations, minimum-maximum range across valuation estimates)
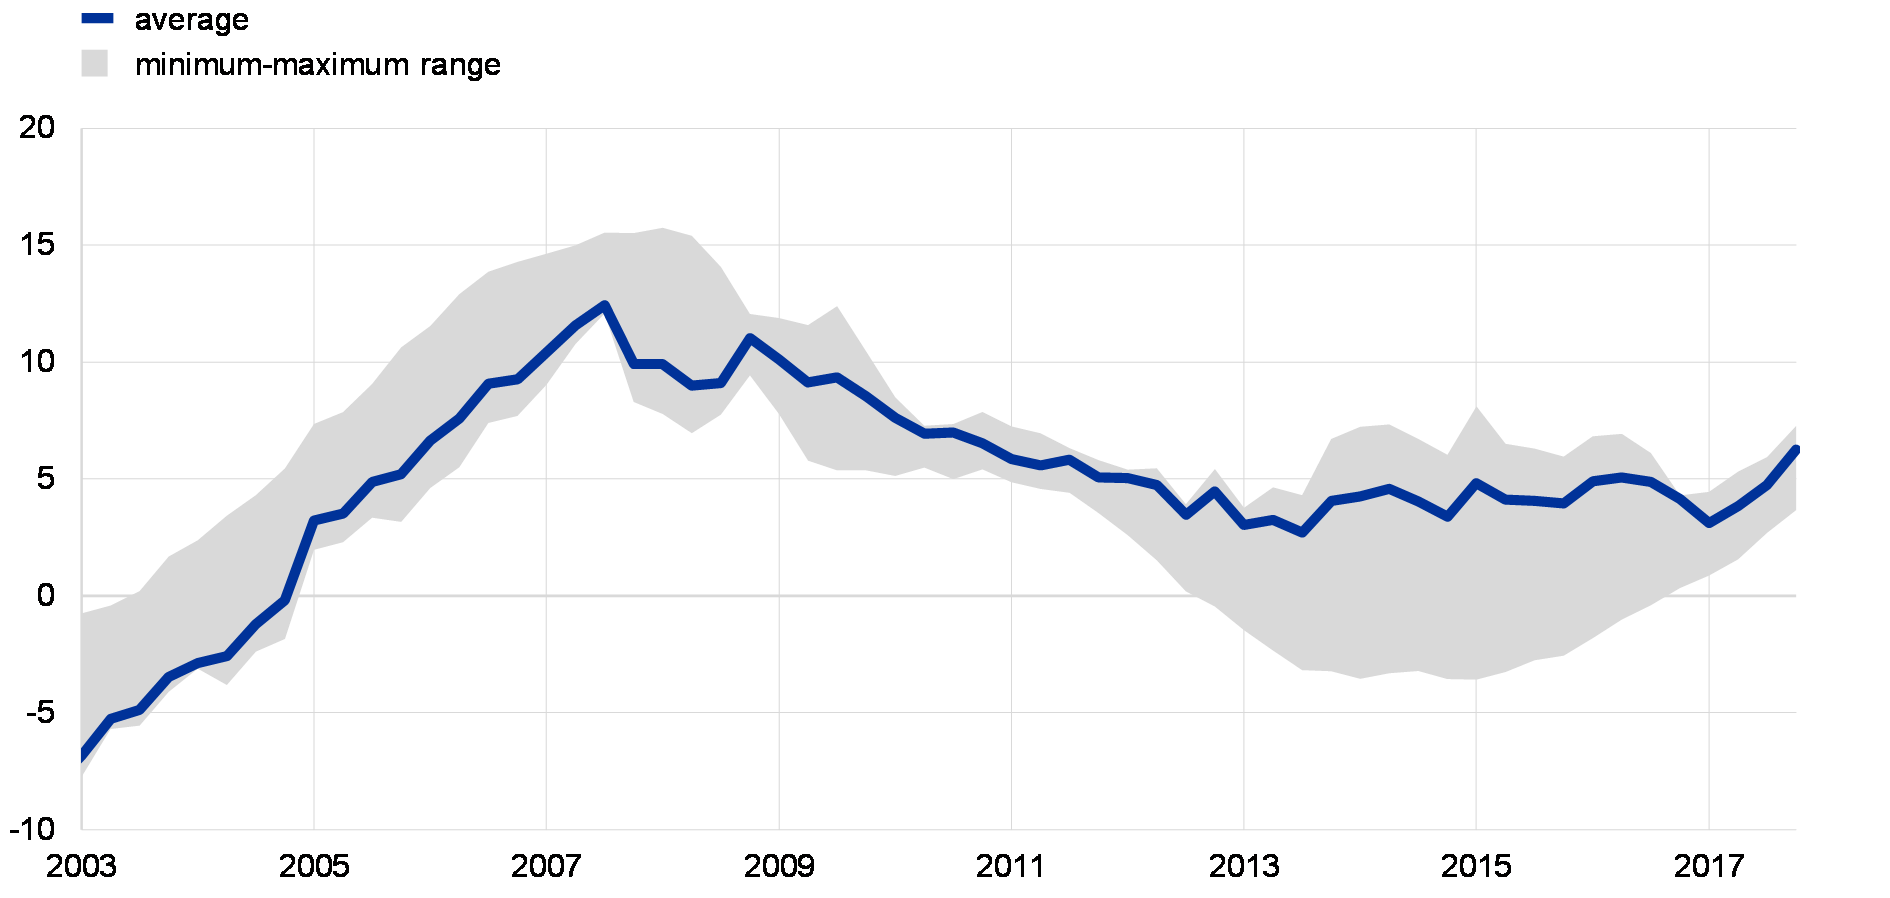
Sources: ECB and ECB calculations.
Notes: The fair-value estimations are based on four different methods: the price-to-rent ratio, the price-to-income ratio and two model-based methods, i.e. an asset pricing model and a new model-based estimate (Bayesian vector autoregression or BVAR). The average is based on the price-to-income ratio and the new model-based method. For details of the methodology, see Box 3 in Financial Stability Review, ECB, June 2011, and Box 3 in Financial Stability Review, ECB, November 2015.
Higher risk-taking in global financial markets
Developments in financial markets continue to signal growing optimism about the economic outlook, but vulnerabilities are building up in global markets. Long-term government bond yields in advanced economies increased in late 2017 and early 2018 on the back of solid growth prospects and news concerning the US tax reform (see Chart 7). US and euro area stock markets have experienced bouts of volatility over the past six months. Stock prices on both sides of the Atlantic benefited from overall robust earnings growth. At the same time, concerns about elevated US stock market valuations, upward revisions in monetary policy rate expectations and US trade policies contributed to slightly higher global equity risk premia. Overall, however, risk tolerance in global financial markets remains high. This is particularly noticeable in the riskier segments of the bond markets. For instance, non-investment-grade corporate bond spreads in advanced economies continue to hover at levels well below historical averages.
Chart 7
US and euro area bond yields edged up, while the upward trend in stock prices came to a halt
Ten-year sovereign bond yields, stock prices and BBB corporate bond spreads in the United States and the euro area
(Jan. 2017 – May 2018; left panel: percentages per annum; middle panel: index: 29 November 2017 = 100; right panel: basis points)
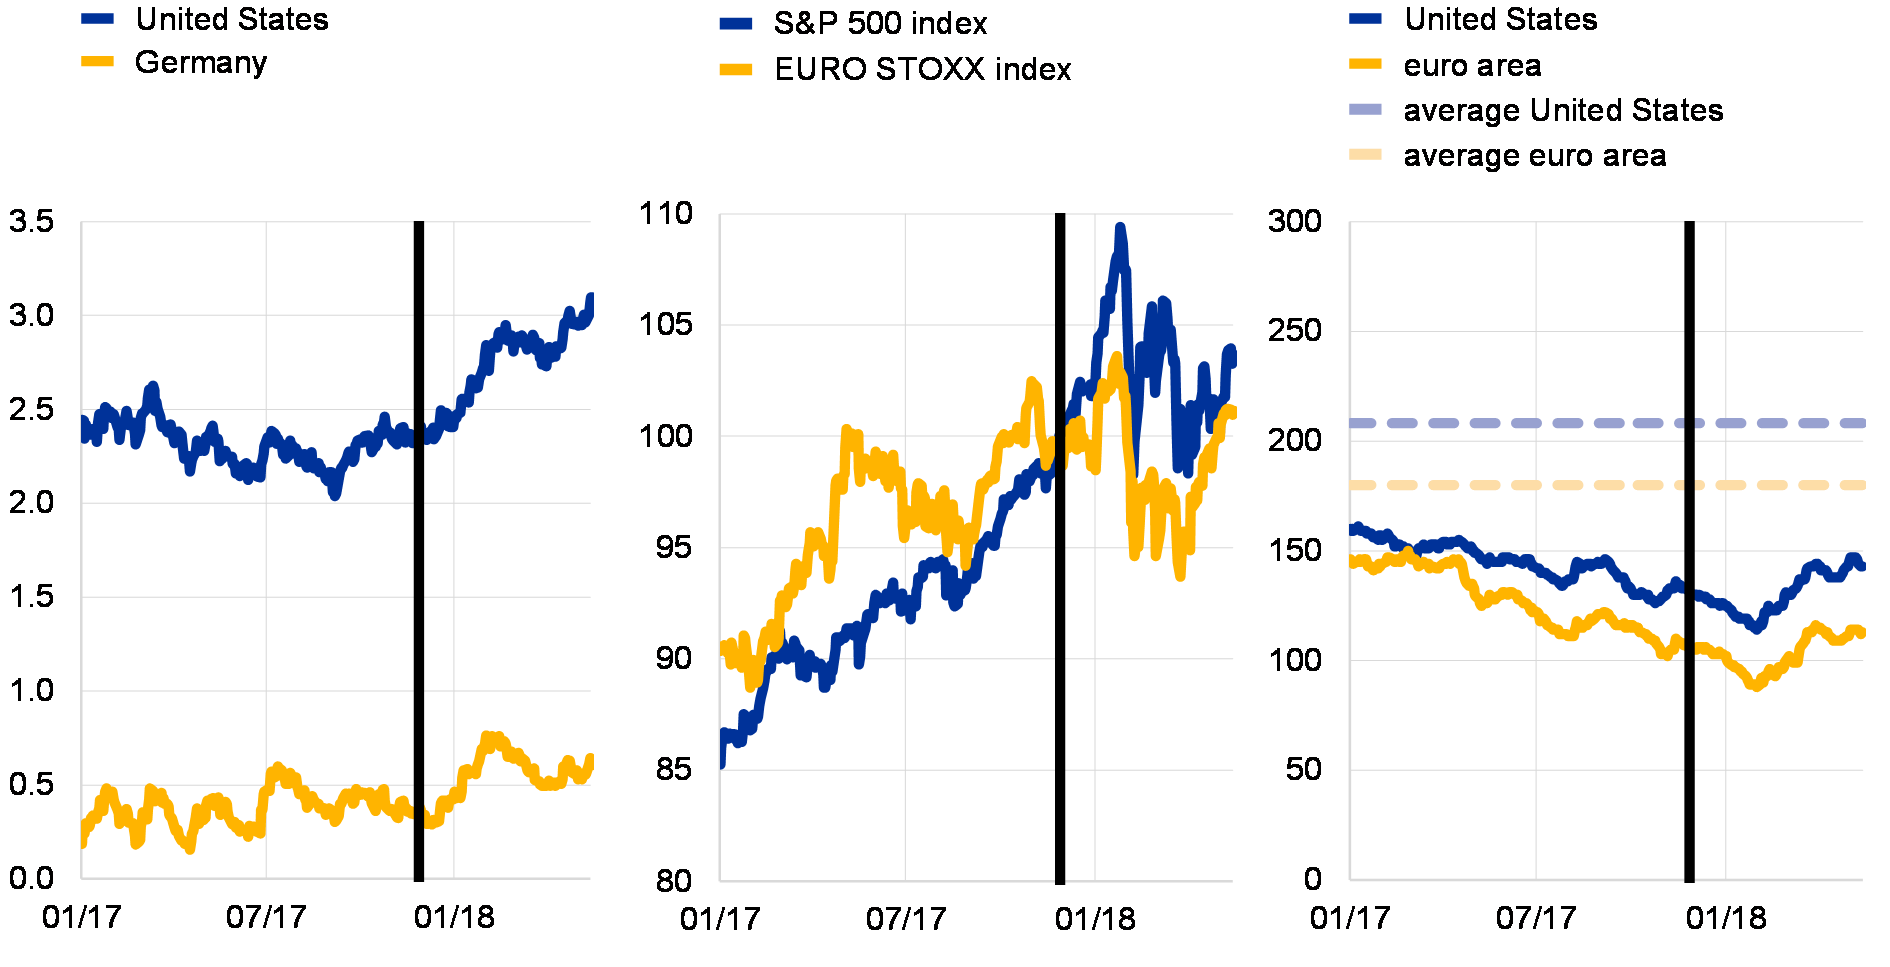
Sources: Bloomberg, Bank of America Merrill Lynch and ECB calculations.
Notes: The vertical lines refer to the publication of the previous FSR on 29 November 2017. The right panel shows averages since January 2002.
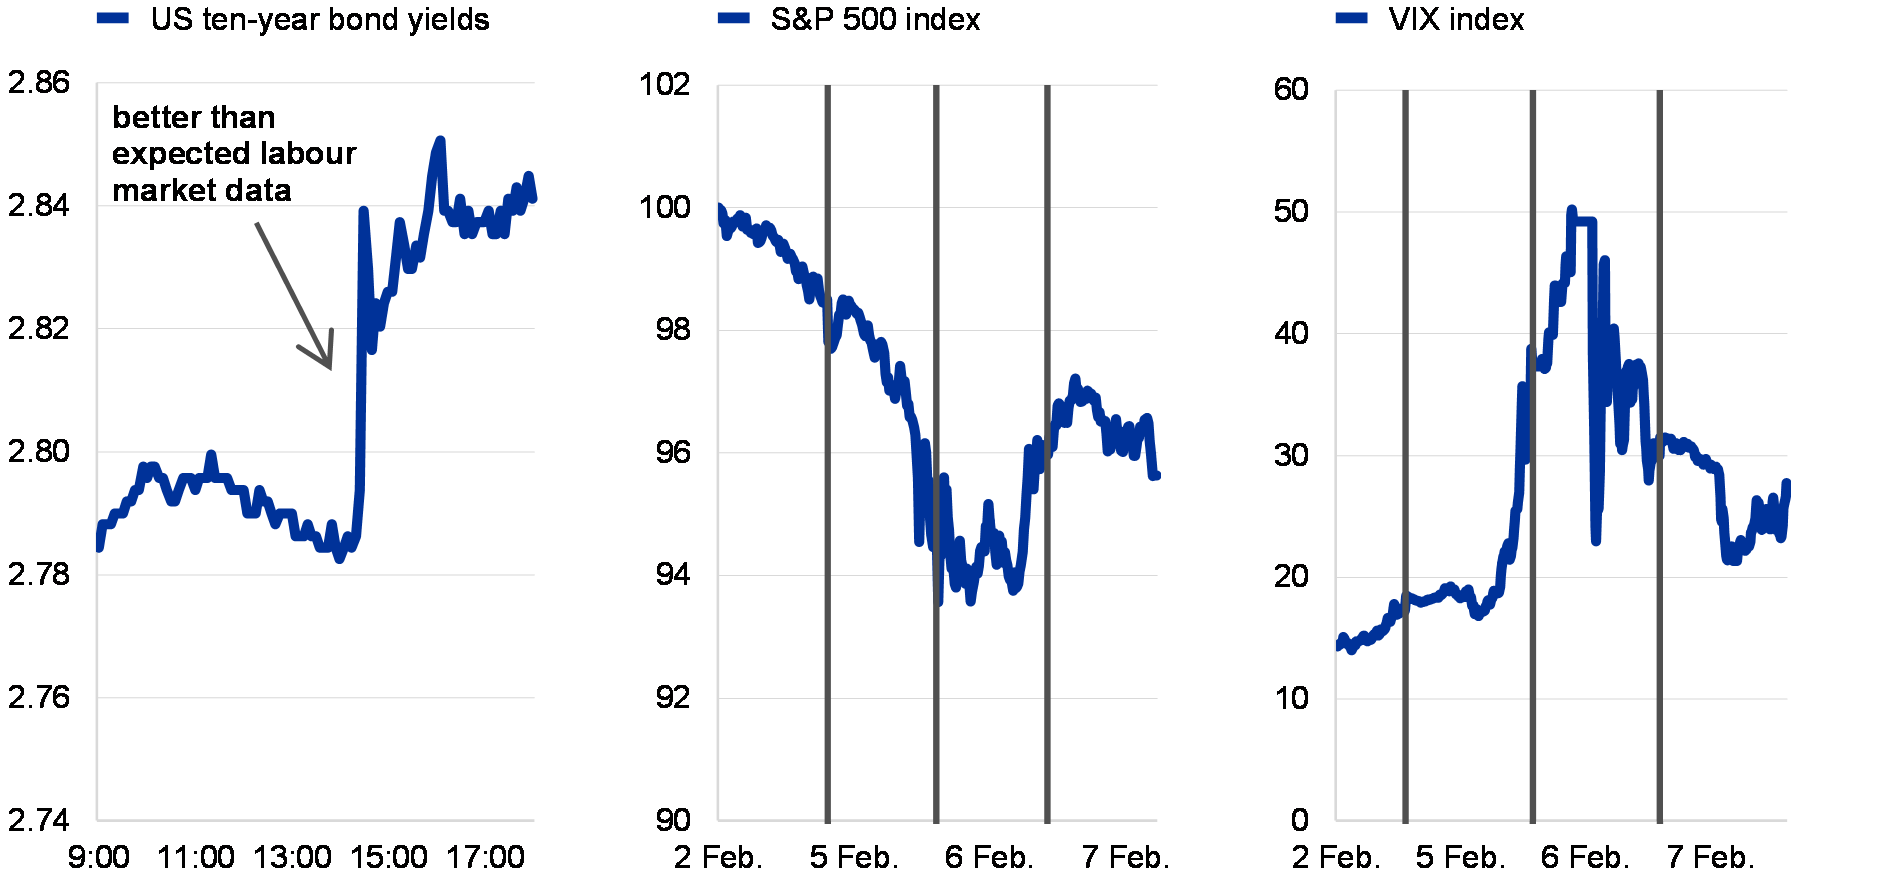
A surge in volatility in US stock markets in early February underscored the fragility of current market sentiment (see Chart 8). Following a prolonged period of rising stock prices and low volatility, US stock markets experienced a sharp sell-off in the first trading days of February. The drop in US stock prices was probably triggered by stronger than expected US labour market data which seem to have led to some pick-up in uncertainty about future inflationary pressures. Implied stock market volatility – a standard metric of future expected volatility derived from option prices – surged well above what historical patterns would suggest, given the actual drop in stock prices. The overshooting in volatility during this period was partly linked to technical factors. Hedging activities of financial products linked to the low-volatility environment (such as inverse VIX products) probably contributed to the amplified movement in implied stock market volatility. The risk that these products could amplify market fluctuations was highlighted in a special feature in the November 2017 FSR.[1] The turmoil did not have any material adverse financial stability implications. It was relatively short-lived and did not spill over to other asset classes. That said, the episode illustrated how abruptly market sentiment can change in the current environment of generally compressed risk premia. After the spikes in February, stock market volatility in the United States has hovered at slightly higher levels than in 2017 (see also Box 3, which examines the statistical pattern of US stock market volatility over the past 90 years). Further turbulence may materialise over the risk horizon of the FSR, possibly amplified by portfolio strategies linked to the level of volatility in markets.
Chart 8
Turmoil in US stock markets in early February 2018
US ten-year bond yields on 2 February 2018 (left panel), movements in US stock prices and the VIX index over the period 2-7 February 2018 (middle and right panels)
(five-minute intraday observations; left panel: percentages per annum; middle panel: index: stock prices on 2 February 2018 = 100; right panel: index points)
Sources: Bloomberg and ECB calculations.
Note: In the middle and right panels, the weekend of 3 and 4 February is omitted from the scale on the x-axis.
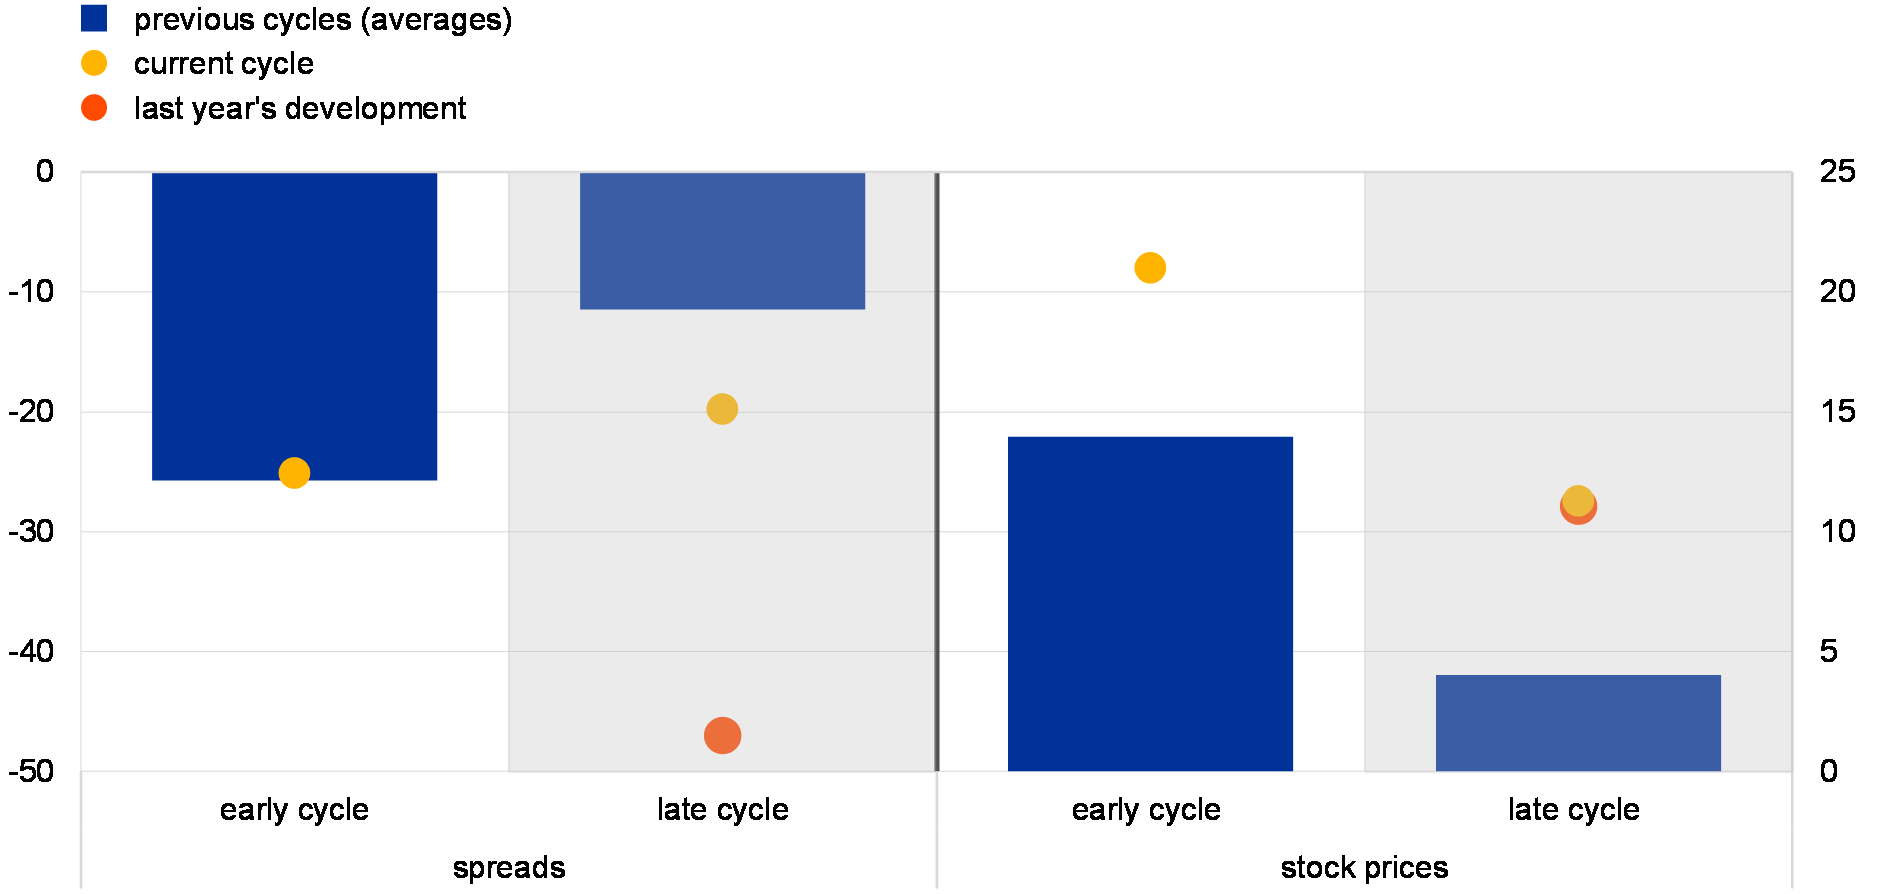
A reversal of the atypical US asset price developments for this stage of the business cycle could impact global asset prices more broadly. The United States has been in an expansionary phase since mid-2009. With the US economy running at close to full (or at full) capacity, inflationary pressures are gradually building up and policy rates are moving closer to a neutral stance. As a result, the US economy has possibly entered the latter part of the expansionary phase of the business cycle. Looking back in history, asset price performance tends to differ between the earlier and the later phases of business cycle expansions (see Chart 9). In the earlier part of expansions, stock prices have, on average, increased rapidly along with a significant narrowing of corporate bond spreads. In the late stage of the expansion, asset price increases tend to slow down, as inflationary pressures build up and monetary policy becomes less accommodative. The behaviour of US asset prices during the current “late cycle” phase differs somewhat from previous patterns. In fact, asset price gains have been stronger than what has been observed in the past. The somewhat atypical behaviour of US asset prices seems to indicate signs of “pricing for perfection”, pointing to a market perception that business cycle conditions will continue to improve for the foreseeable future and that there is a low probability of a turnaround in the business cycle. However, should a sharp reassessment of the maturity of the US business cycle occur, an abrupt reversal of US risk premia may take place, with possible spillover effects for the euro area.
Chart 9
Late cycle developments in US asset prices suggest that markets are “pricing for perfection”
Changes in US Baa corporate bond spreads and stock price returns for the S&P 500 index during the current and previous expansions
(left-hand scale: bond spreads, basis points; right-hand scale: stock prices, percentages per annum)
Sources: Bloomberg, National Bureau of Economic Research (NBER), Federal Reserve Economic Data (FRED) and ECB calculations.
Notes: Spreads are computed as the Baa corporate bond yield relative to the ten-year Treasury constant maturity rate. The cycles are defined according to the expansionary periods defined by the NBER since 1960. Early and late cycles are defined as the first and second half, respectively, of the expansionary periods. Changes in credit spreads and stock price returns are annualised. The current cycle is defined as the period from June 2009 to April 2018.
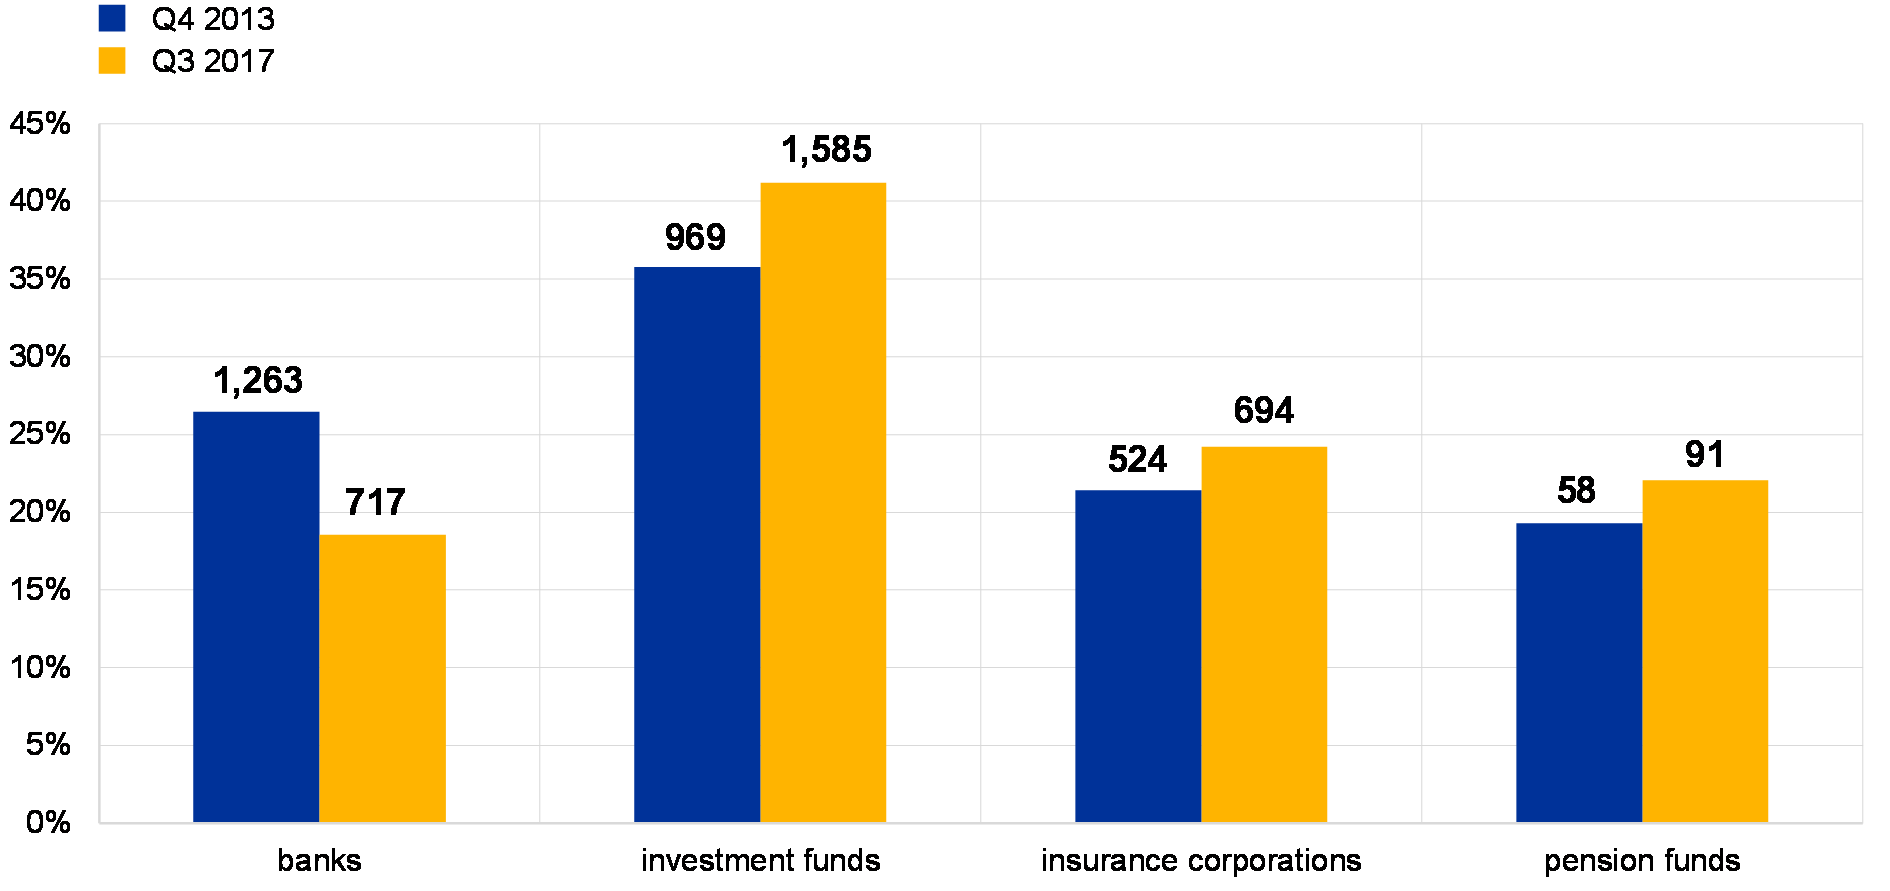
Higher risk-taking remains concentrated outside the euro area banking sector. Apart from some temporary bouts of volatility, fluctuations in global asset markets have been exceptionally muted for a prolonged period, which has incentivised one-sided risk-taking. To preserve returns, euro area financial sectors (apart from the banking sector) have increased their holdings of lower-rated fixed income instruments (see Chart 10). In addition, the same sectors have increased the duration of their fixed income instruments, exposing them to the risk of larger capital losses should a sudden and sharp repricing materialise.
Chart 10
Most euro area financial institutions have increased their exposures to lower-rated bonds
Share of lower-rated financial and non-financial corporate bonds in financial institutions’ bond portfolios
(percentages of total bond portfolio, € billions)
Sources: ECB Securities Holdings Statistics (SHS) and ECB calculations.
Notes: Corporate bonds issued globally by both financial and non-financial companies. Lower-rated bonds are BB- and below. The figures above the columns show the market value of lower-rated bond holdings.
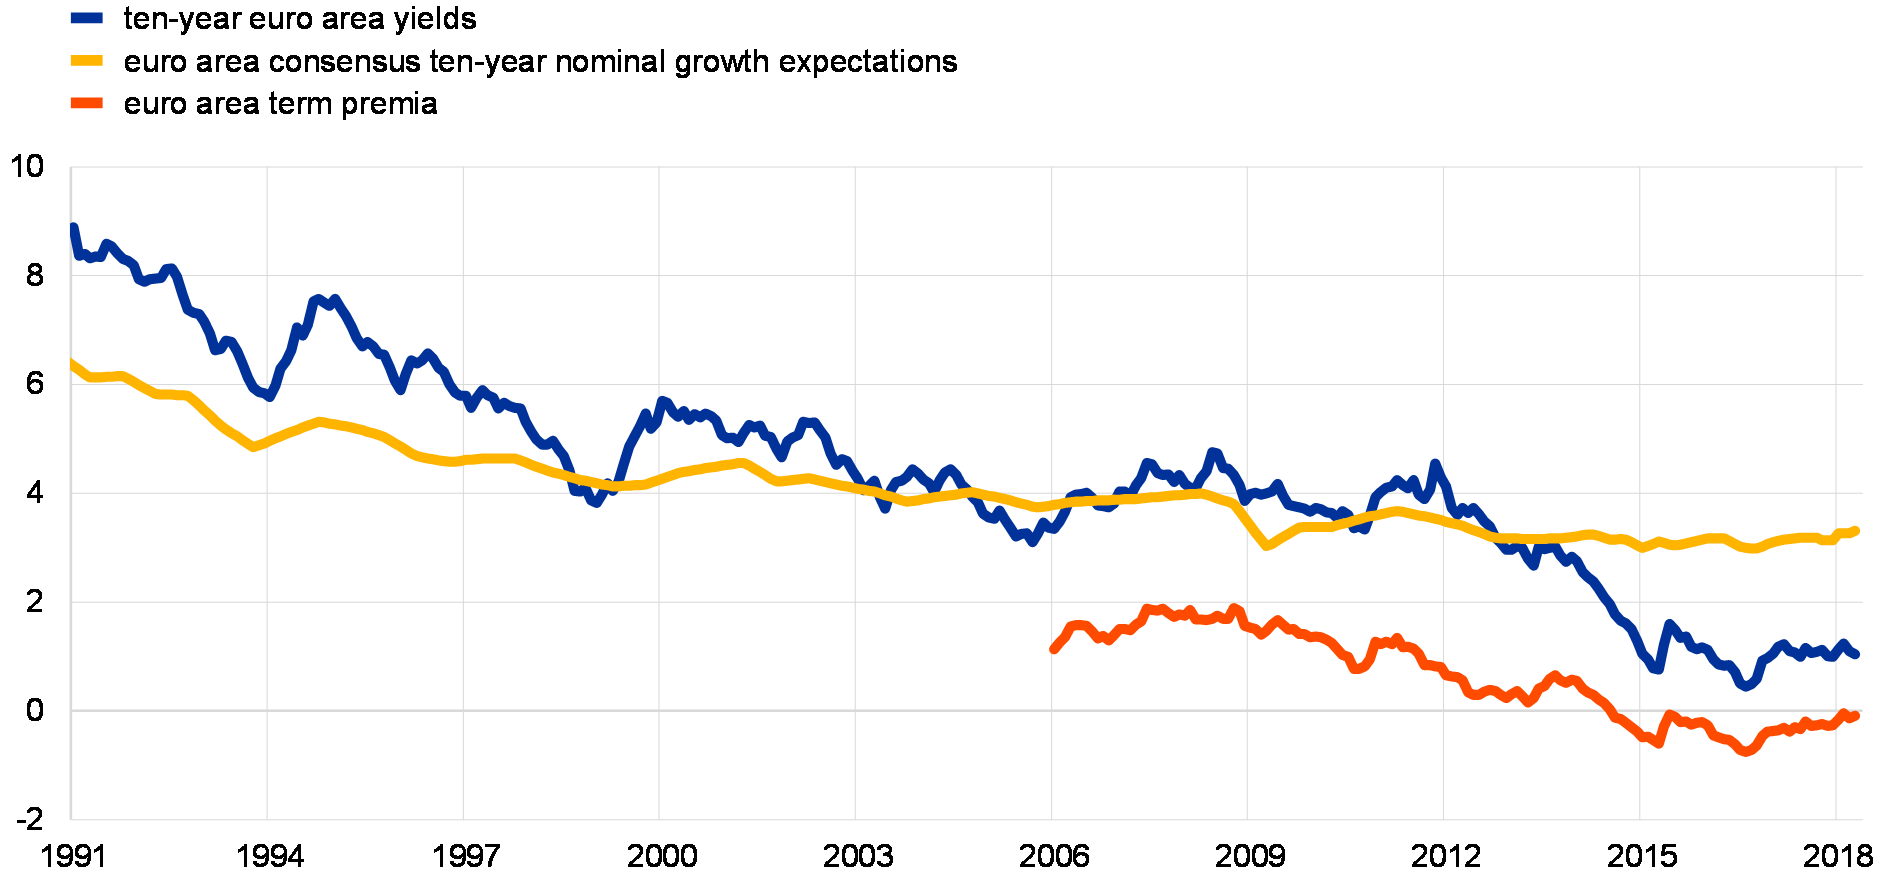
Risks of an abrupt reversal of compressed term and risk premia remain high amid stretched valuations in several asset classes and geographical regions. Estimates of term premia embedded in euro area long-term government bond yields continue to fluctuate at historically low levels and bond yields themselves are still well below nominal economic growth expectations, which are used as a yardstick for the equilibrium level of bond yields (see Chart 11). These observations point to upward risks to long-term bond yields in the coming years.
Chart 11
Upward risks to euro area long-term government bond yields
Long-term government bond yields, nominal GDP growth expectations and term premia in the euro area
(Jan. 1991 – Apr. 2018; percentages per annum, annual percentage changes)
Sources: Thomson Reuters, Consensus Economics and ECB calculations.
Notes: Before 1999, the euro area bond yields are approximated by ten-year bond yields in Germany. The euro area ten-year term premium shown in the chart is estimated on the basis of OIS rates using an affine term structure model following the methodology of Joslin, S., Singleton, K.J. and Zhu, H., “A New Perspective on Gaussian Dynamic Term Structure Models”, The Review of Financial Studies, Vol. 24(3), March 2011, pp. 926-970.
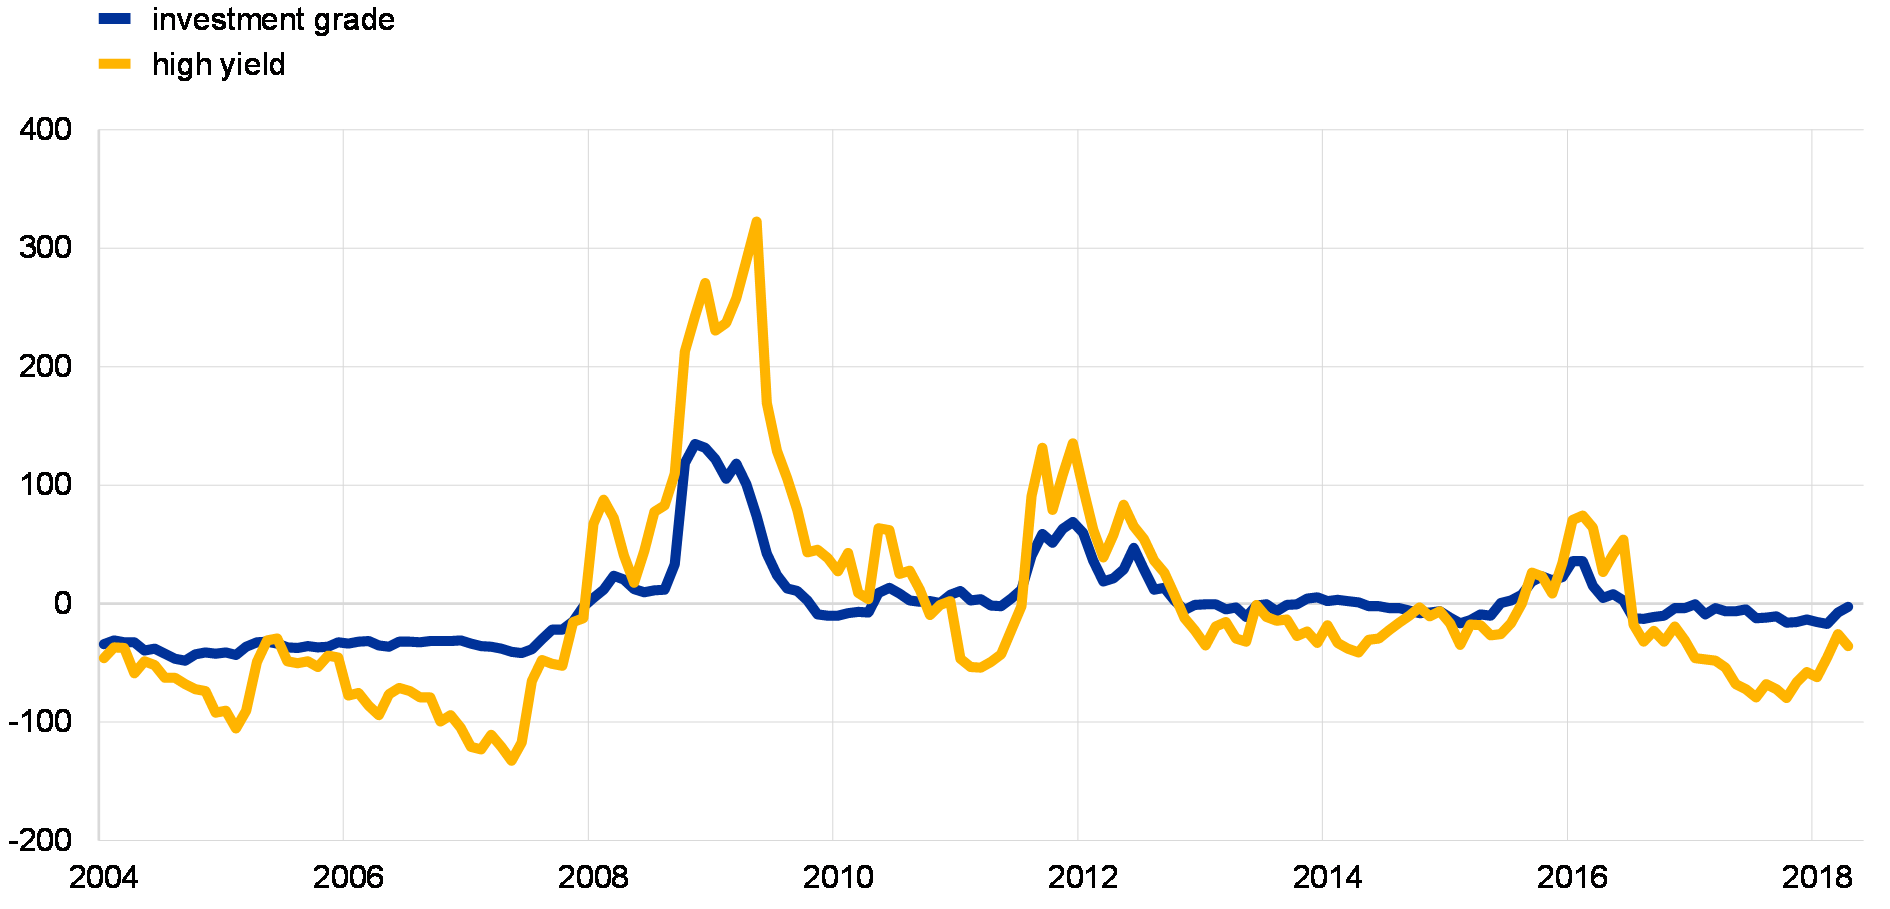
Similarly, for the high-yield corporate bond market segment, current levels of spreads are somewhat stretched vis-à-vis fundamentals (see Chart 12). Signs of potential mispricing are also evident in the larger leveraged loan market. As discussed in Box 5, a significant relaxation of underwriting standards for US and European leveraged loans has been observed in recent years. This increases the likelihood that defaults will be delayed and recovery rates will be lower should the creditworthiness of the borrowers deteriorate. At the same time, valuation models for euro area investment-grade bonds and aggregate stock price indices indicate broadly fair valuations (see Chapter 2). Nevertheless, investment-grade euro area non-financial corporates remain more levered than before the crisis, which leaves them vulnerable to a turnaround in the global economic outlook. Looking beyond the euro area, US corporate bond spreads are trading at levels below historical norms. Furthermore, as highlighted in previous issues of the FSR, US stock prices are still elevated when gauged using standard valuation metrics such as the cyclically adjusted price/earnings (CAPE) ratio.
Chart 12
Valuations somewhat stretched for euro area high-yield bonds
Excess bond risk premia on euro area investment-grade and high-yield non-financial sector bonds
(Jan. 2004 – Apr. 2018; basis points)
Sources: iBoxx and Moody’s.
Notes: The excess bond premium (EBP) is defined as the deviation of credit spreads from measures of credit risk and liquidity risk at individual bond level. The series represent averages from two ECB models. For further details, see Chart 2.7 in Chapter 2.
Higher risk premia on euro area assets could be triggered by developments from both within and outside the euro area. First, a faster than expected withdrawal of monetary policy accommodation globally has some potential to translate into higher risk premia, which could spill over to the euro area. Second, a significant reassessment of global economic growth prospects and the impact of fiscal policies or adverse implications stemming from rising protectionism all have the potential to trigger a repricing of risk. Third, a sharp, domestically driven slowdown in economic growth prospects may also drive risk premia higher in the euro area, particularly in countries and sectors where the level of indebtedness is high. Fourth, high valuations in some markets may themselves act as triggers. Once valuations reach levels that are excessively stretched compared with historical norms, a growing number of investors may start withdrawing exposures from these markets, possibly triggering abrupt normalisations.
Any sustained repricing of assets could be amplified by an increasingly large investment fund sector. Both bond and equity fund flows in the euro area experienced some volatility around the turn of the year owing to rising yields and the more recent spike in equity volatility (see Section 3.2). The volatility did not adversely impact the functioning of the fund sector. That said, a prolonged period of negative returns in the future could trigger elevated investor outflows, eventually resulting in forced sales of fund portfolios. Data on liquid holdings show that bond funds domiciled in the euro area have reduced the buffers available to accommodate large outflows in recent years.
Improving cyclical outlook for euro area banks and insurers, but structural challenges remain
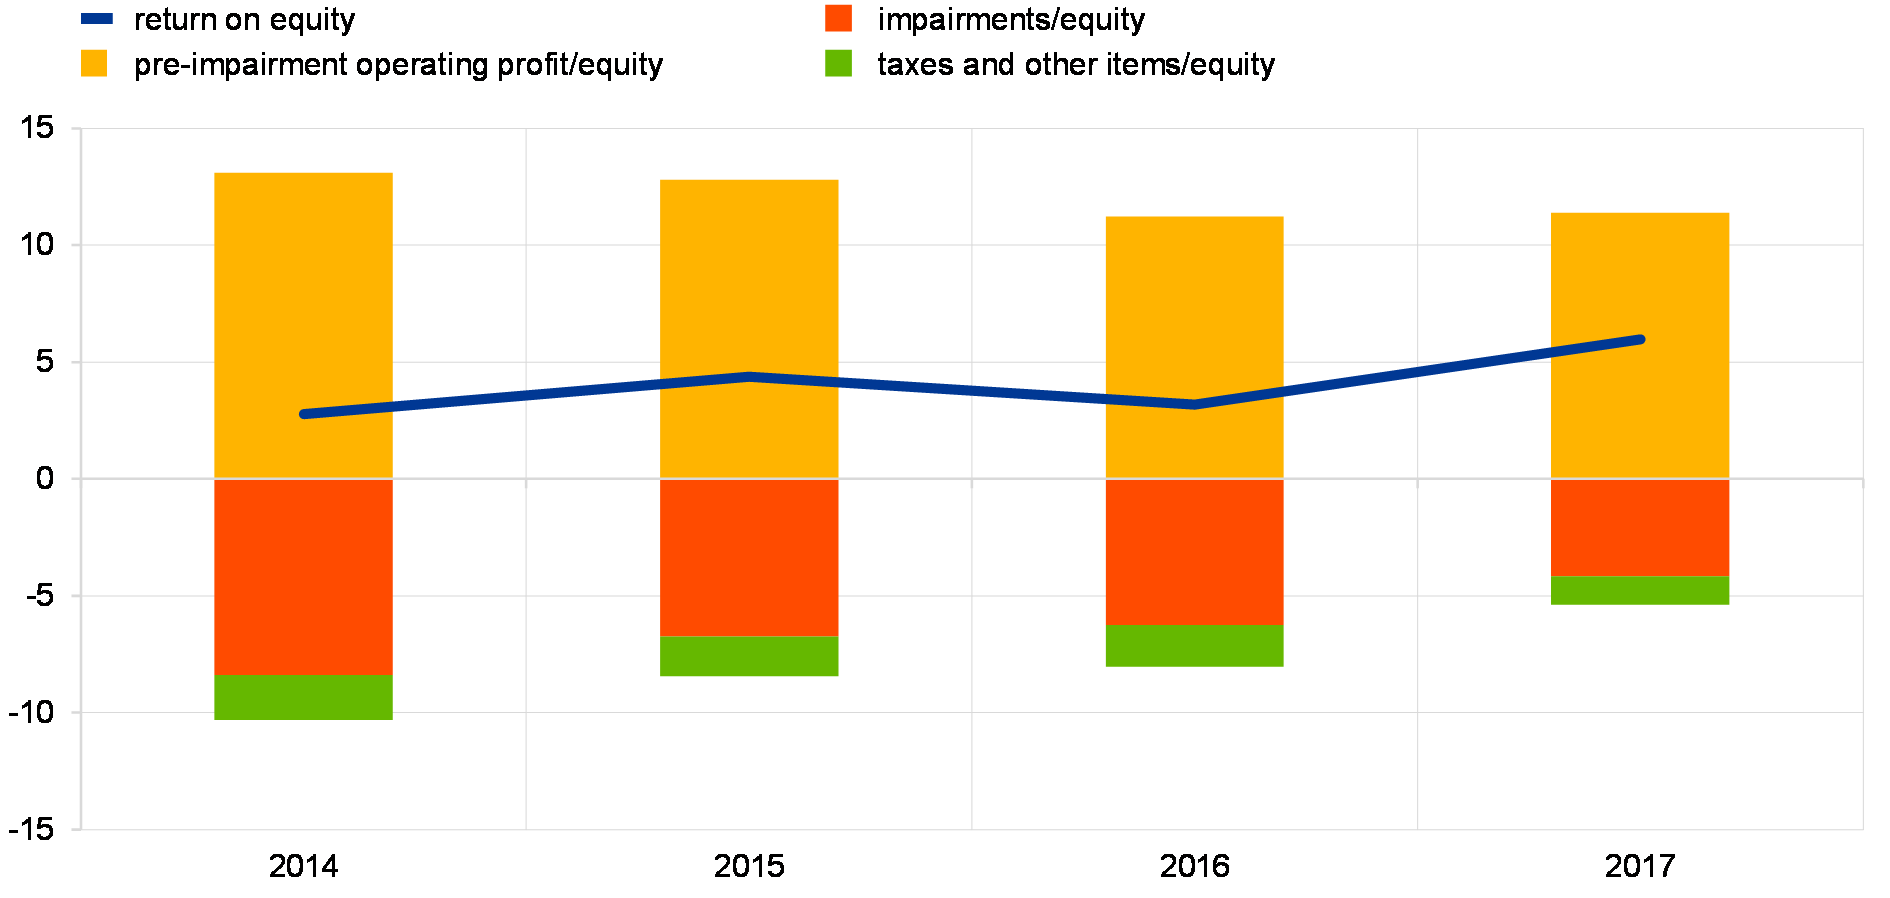
Bank profitability recovered in 2017, supported by the improvement in economic growth. After a prolonged period of low profitability, bank performance rebounded in 2017 (see Chart 13). Euro area significant institutions’ aggregate return on equity increased to around 6% in 2017, compared with 3.5% one year earlier. The main driver of higher profitability was lower impairment costs, as new NPL formation slowed. Across countries, the bulk of the euro area-wide improvement was driven by banks operating in the countries most affected by the crisis.
Chart 13
Euro area bank profitability recovered in 2017, buoyed by improving cyclical prospects
Decomposition of euro area significant banks’ aggregate return on equity
(2014-17, percentages, percentage point contributions)
Sources: ECB and ECB calculations.
Note: Based on an unbalanced sample of at least 103 euro area significant institutions.
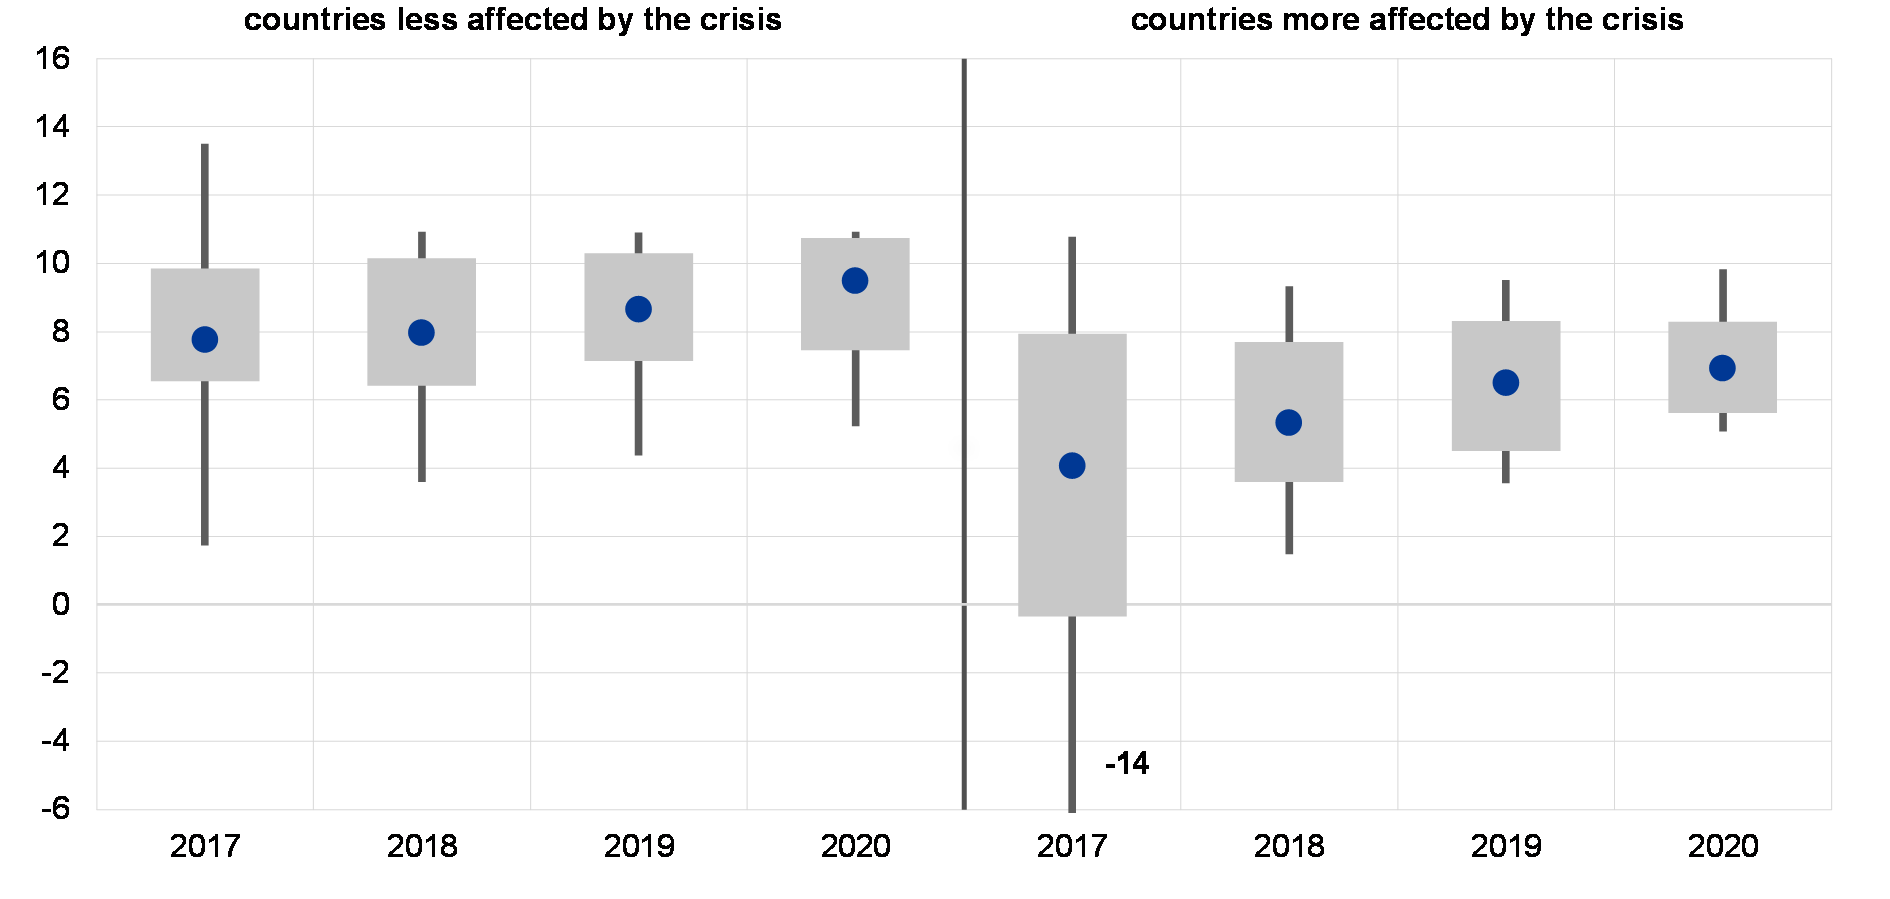
Looking ahead, bank profitability is expected to improve further over the coming years, according to market analysts (see Chart 14). This notwithstanding, for some banks, particularly in the countries most affected by the crisis, the return on equity is likely to continue to fluctuate below the corresponding cost of equity.
Chart 14
Analysts expect profitability to further improve over the next three years
Actual return on equity in 2017 and estimates for 2018-20 for euro area banks
(2017-20; percentages, 10th and 90th percentiles, interquartile distribution and median)
Sources: SNL Financial and S&P Capital IQ.
Note: Based on a sample of 41 euro area listed banks. Countries more affected by the crisis include Cyprus, Greece, Ireland, Italy, Portugal, Spain and Slovenia.
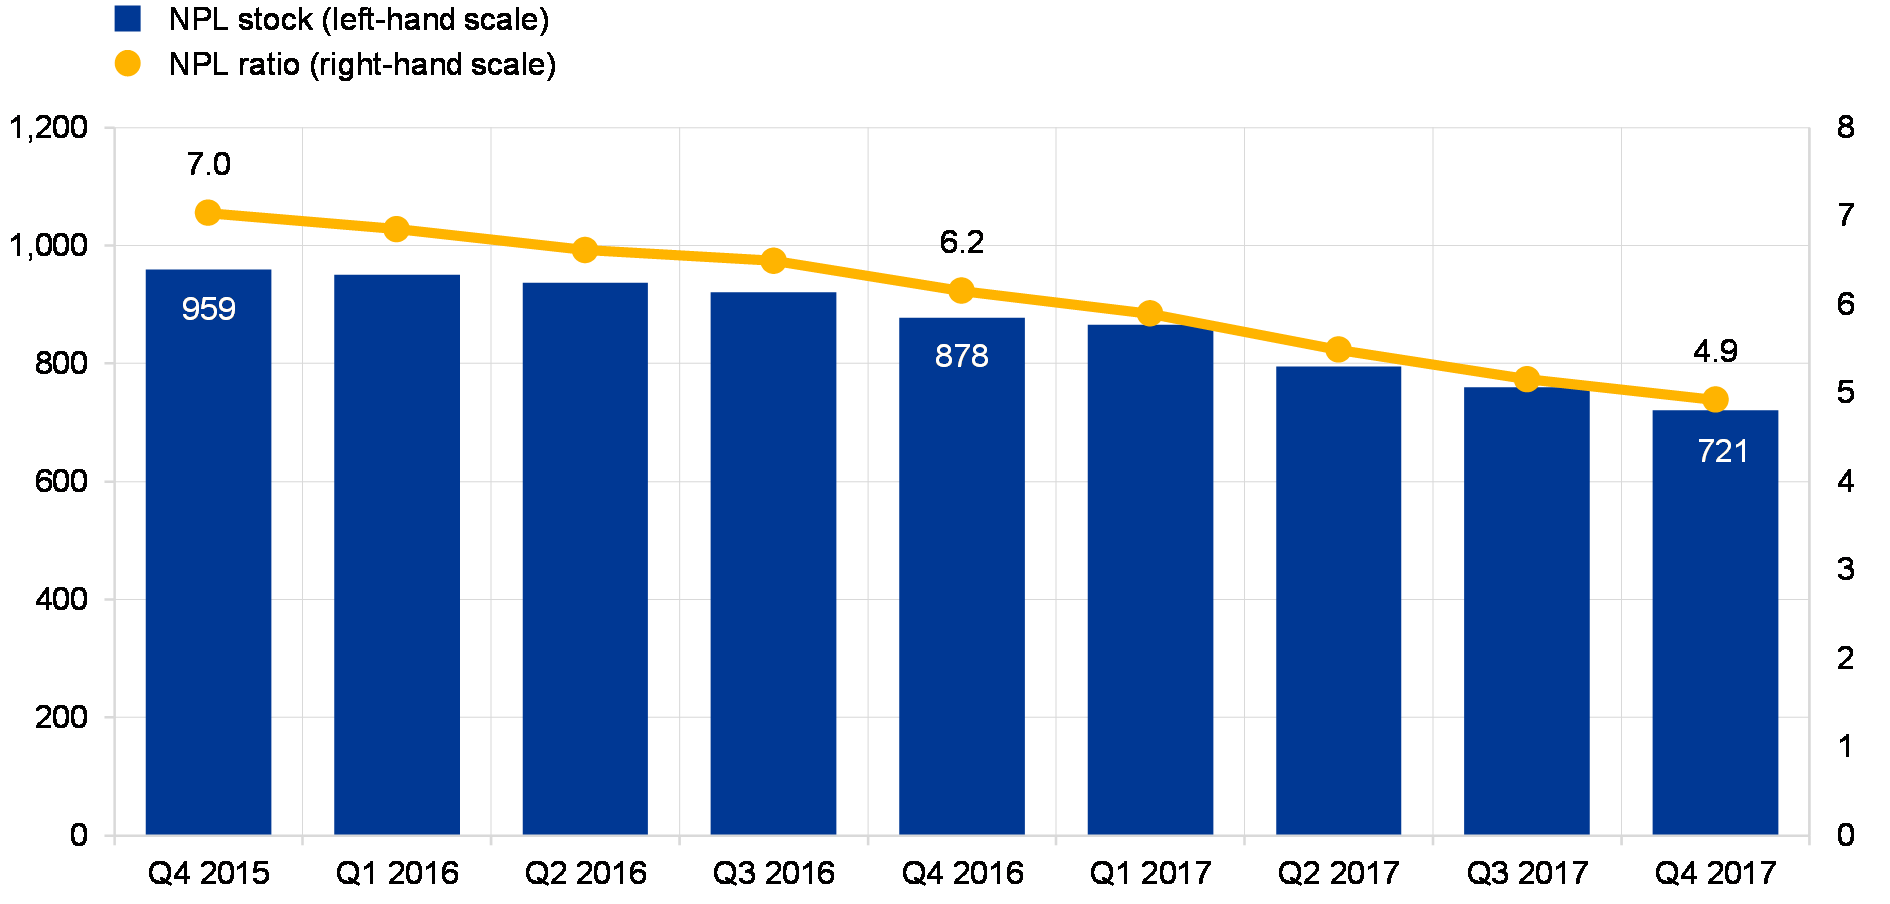
The stock of NPLs fell in 2017, but remains persistently high in some countries. Euro area significant institutions’ aggregate NPL stocks and ratios decreased in 2017 (see Chart 15). The reduction was relatively broad-based across countries. Coverage ratios also increased in 2017, which suggests an improved ability of banks to absorb losses from NPL portfolios. Despite the overall improvement in asset quality, high NPLs are still a challenge in some jurisdictions, as they weigh on financing conditions and, ultimately, economic growth prospects. Further work is needed to bring them down to sustainable levels. Improving the functioning of the secondary NPL market could make a substantial contribution in this respect. As highlighted in Box 7, liquidity in the secondary market for NPLs in Europe has improved in recent years, but continues to be afflicted by several types of market failure.
Chart 15
Progress in NPL reduction gained momentum in 2017
Euro area significant institutions’ NPL stock and aggregate NPL ratio
(Q4 2015 – Q4 2017; € billions, percentages)
Source: ECB supervisory data.
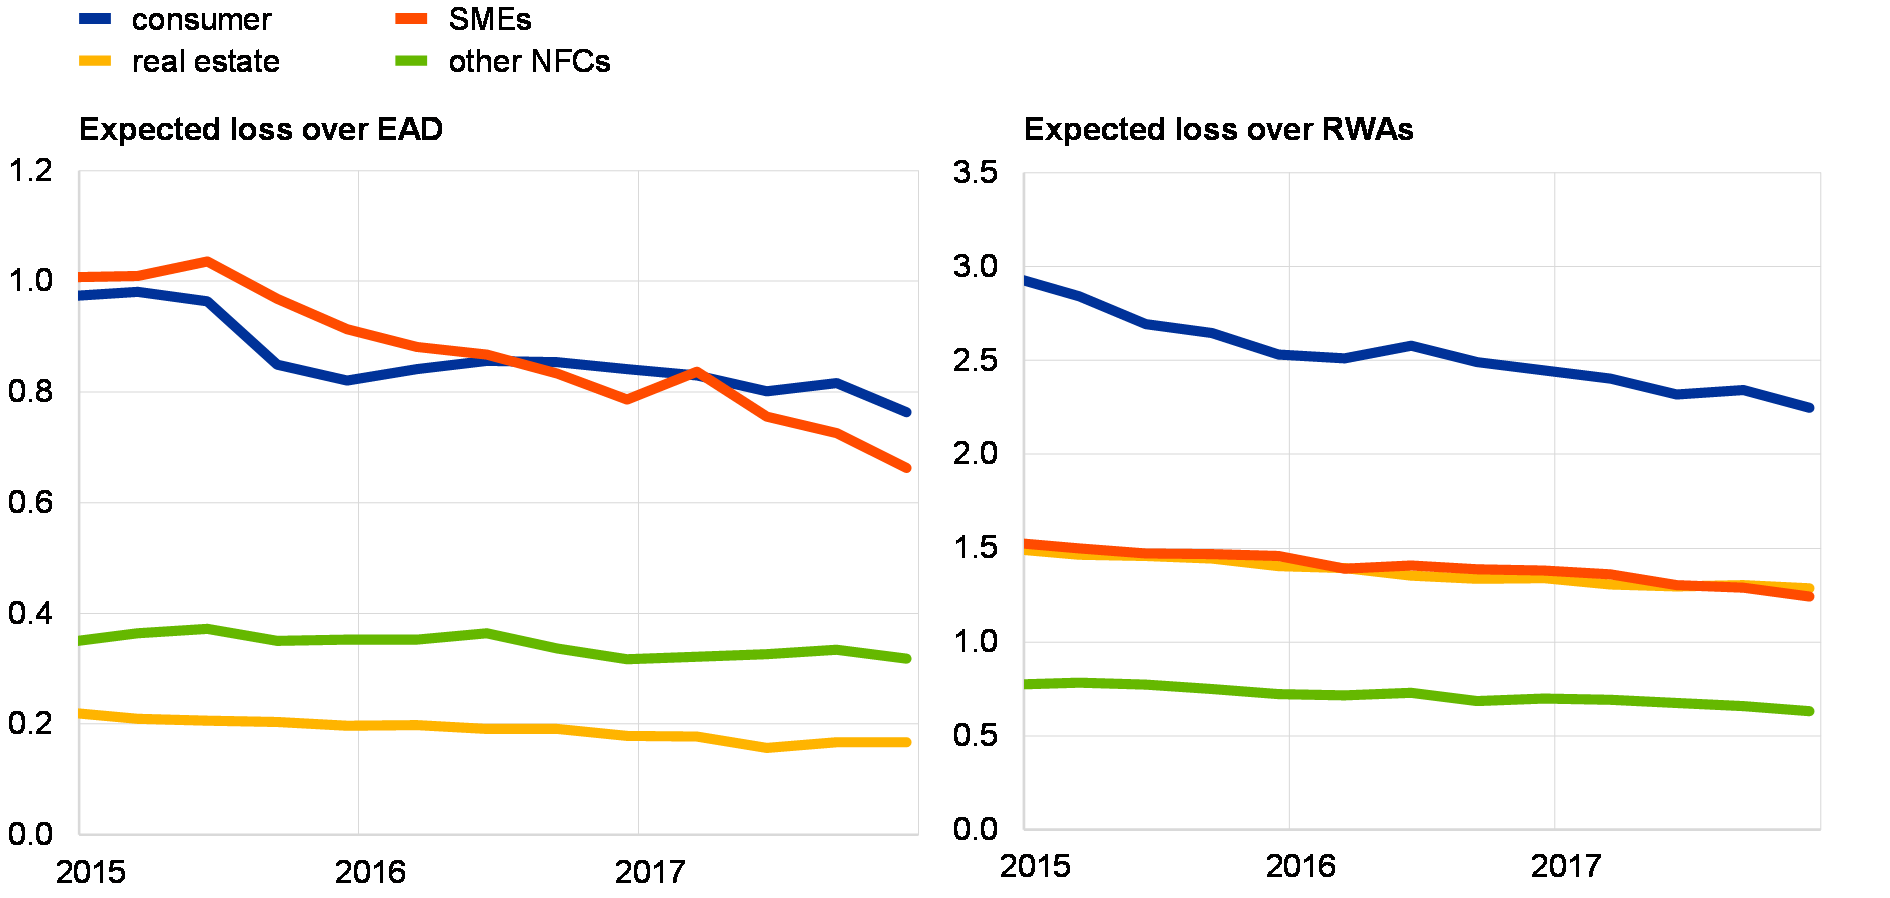
Despite still weak performance, risk-taking appears to be limited in the euro area banking sector. One avenue for banks to boost profitability in a (still) low interest rate environment is to engage in higher risk-taking. Bank credit risk measures, however, point to slightly lower reported credit risk over the past year for significant institutions (see Chart 16 and Section 3.1). This is consistent with the improved economic outlook, which supports household disposable income and companies’ earnings prospects. Some pockets of vulnerability do, however, exist. In particular, consumer lending is growing at double-digit rates in some countries. Such credit developments warrant close monitoring as risk-taking that is not properly compensated for by higher risk premia may lead to a build-up of vulnerabilities in the medium term. Euro area banks’ aggregate exposure to interest rate risk is fairly limited. Some heterogeneity across banks can, nevertheless, be observed. For instance, banks operating in countries with predominantly fixed rate mortgages will be more vulnerable to higher interest rates than banks situated in countries where floating rates dominate. As discussed in Special Feature C, there is evidence that banks are taking measures (i.e. hedging) to mitigate their exposure to interest rate risk.
Chart 16
Credit risk measures continue to drift lower
Expected loss relative to exposure at default (EAD) and risk-weighted assets (RWAs)
(Q1 2015 – Q4 2017; medians, percentages)
Sources: ECB supervisory data and ECB calculations.
Notes: Based on measures reported by banks on their internal ratings-based (IRB) portfolios. Excludes exposures in default. Cross-sectional median of a balanced sample of 52 significant institutions with IRB exposures. “Real estate” includes retail loans secured by immovable property; “consumer” includes qualified revolving loans and other non-secured retail credits.
High operating costs remain a key obstacle to achieving sustainable bank profitability. Cost-efficiency across banks in the euro area remains low compared with that of their international peers. This holds true both when looking at accounting indicators (such as cost-to-income and cost-to-assets ratios) and when looking at results coming from cost function techniques that estimate banks’ relative ability to convert inputs into outputs (for a discussion about the latter, see Box 6). The largest cost component for euro area banks relates to staff (making up around half of euro area banks’ operating expenses). In recent years, however, non-staff costs have grown at a faster pace than staff-related costs. Part of the higher non-staff costs relates to higher IT costs and investment in digital technologies. It remains to be seen whether the short-term costs attached to such investment can bring long-term efficiency gains.
Notwithstanding an improving banking sector outlook, a sharp deterioration in economic or financial conditions could unearth stress. First, an abrupt repricing of risk premia has the potential to increase stress in the banking sector via higher funding costs and capital losses. This, in turn, could impair banks’ intermediation capacity and have an impact on the real economy. Second, substantially weaker economic developments may lead to deteriorating asset quality and earnings prospects. At the same time, the continued improvements observed in banks’ solvency positions should mitigate stress stemming from possible adverse developments.
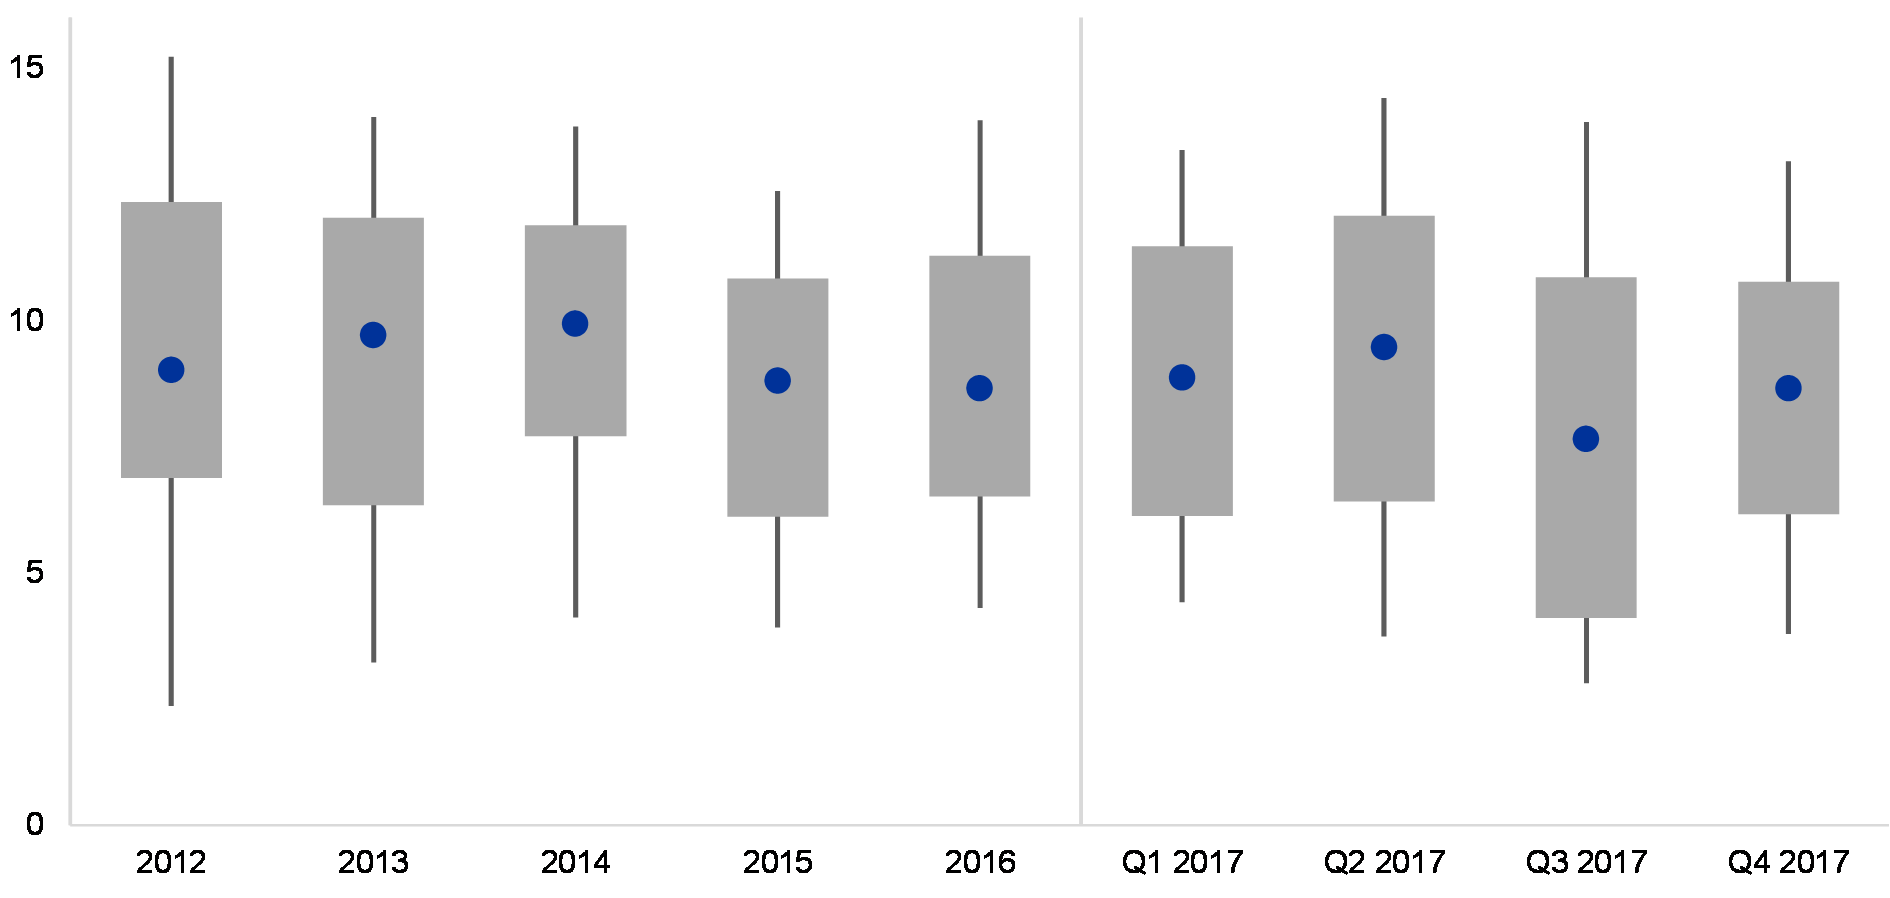
Similar to banks, the profitability and solvency positions of the insurance sector have benefited from a robust economic outlook. Insurers’ profitability continues to develop favourably, supported by the economic outlook (see Chart 17). For the life insurance sector, profitability has also benefited from increasing yields. For reinsurers, however, a number of costly natural catastrophe losses gave rise to a significant drop in profitability in the latter part of 2017. The fall in profitability is expected to be temporary and should not have any material impact on reinsurers’ long-term profitability prospects. Solvency positions remain solid and well above regulatory requirements for the majority of euro area insurers.
Chart 17
Overall solid profitability for the insurance sector
Return on equity for a sample of large euro area insurers
(2012 – Q4 2017; percentages, 10th and 90th percentiles, interquartile distribution and median)
Sources: Bloomberg, individual institutions’ financial reports and ECB calculations.
Notes: Quarterly data are annualised. Based on a sample of 27 large insurers and reinsurers with total combined assets of about €4.98 trillion in 2017, which represent around 62% of the assets of the euro area insurance sector. Quarterly data are only available for a sub-sample of these insurers.
A continuing low interest rate environment and signs of increased interconnectedness are giving rise to vulnerabilities for the insurance sector. Even though the recent rise in long-term interest rates is reducing some of the cyclical challenges for insurers, long-term interest rates are in many cases still below the levels offered as guaranteed returns in the past. Some insurers have, therefore, taken on higher risk in order to boost returns. Such activities include a larger exposure to riskier debt instruments, a shift towards investments in the real estate sector and an extension of maturities in insurers’ fixed income portfolios. More broadly, the non-bank sector as a whole has become more intertwined. For instance, the securities portfolios of insurance companies and investment funds show a high degree of similarity across euro area countries – both within and between the two sectors. This makes them vulnerable to contagion should stress emerge in either of the two sectors.
ECB analysis suggests that the United Kingdom’s decision to withdraw from the European Union poses a limited overall risk to euro area financial stability.[2] Any impact on financial services is likely to differ across euro area countries, depending on the size of financial and real economy linkages with the United Kingdom, and it is more likely to be reflected in the cost of financial services and in costs for financial institutions than in a reduction in the availability of services. While the progress that has been achieved in the negotiations with the United Kingdom since the publication of the November 2017 FSR is a welcome development, the risk of an adverse outcome to the negotiations remains. Affected financial institutions should therefore continue to plan for all contingencies, including a hard Brexit scenario. Stakeholders’ timely and adequate preparations remain a key mitigant against the risks of Brexit-related cliff-edge effects.
Scenario analysis
This FSR identifies two broad scenarios that could be used to test the resilience of financial institutions over a two-year horizon.[3] Two plausible, albeit unlikely, adverse scenarios are run to illustrate the quantitative implications for bank solvency positions if the risks previously outlined in this chapter were to materialise (for more details about the scenarios, see Section 3.3).
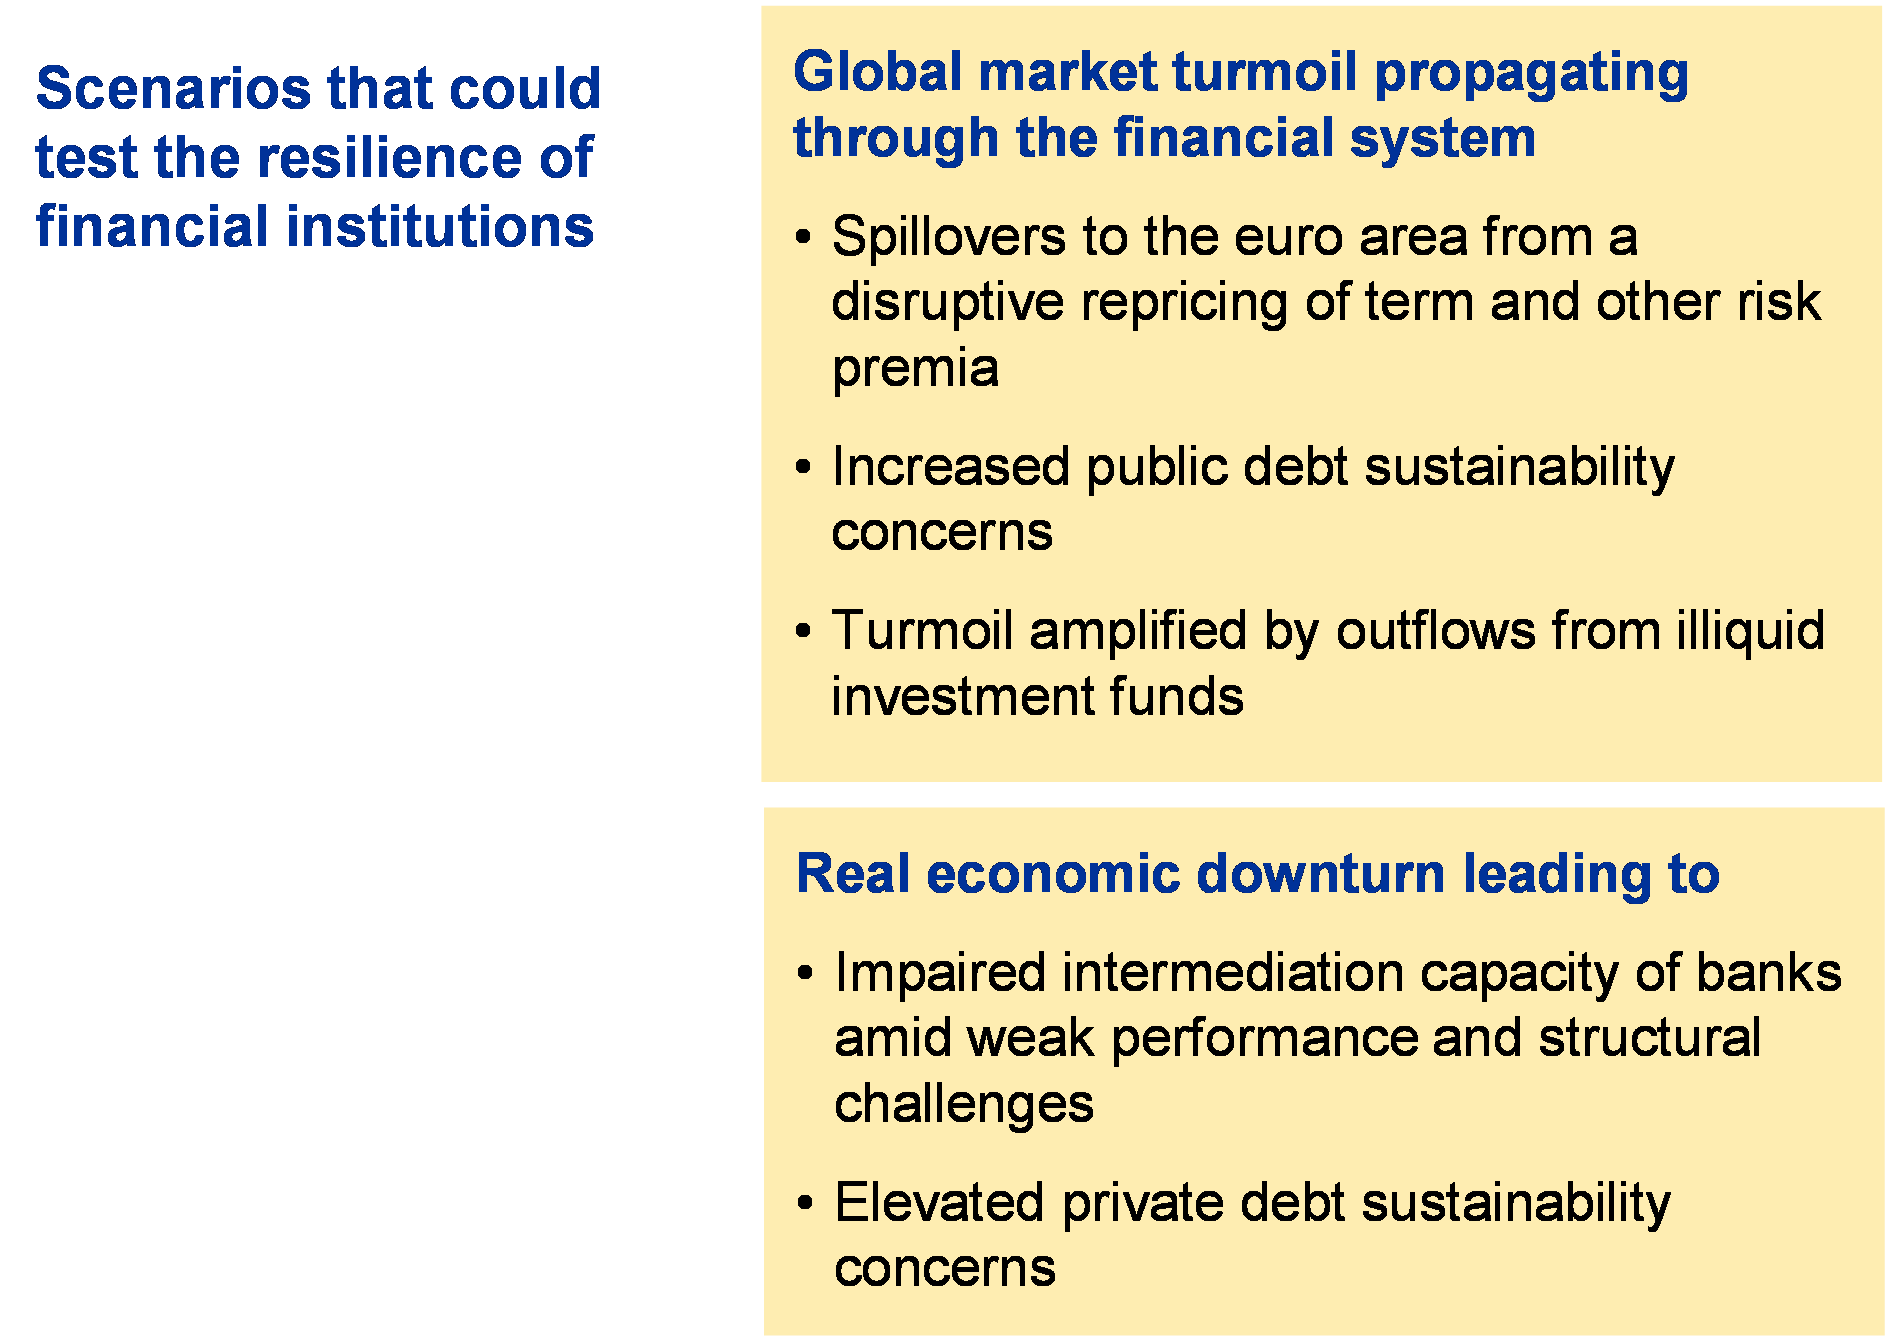
The first scenario entails an abrupt repricing of global risk premia. It envisages higher risk premia triggered by changes in market participants’ expectations regarding economic policies in major economies outside the EU. The ensuing financial market turmoil then spills over to the euro area, and the resulting higher financing costs for the sovereign sector lead to a re-emergence of public debt sustainability concerns. The financial market turmoil is amplified in this scenario by a large sell-off of financial assets by the non-bank financial sector.
The second scenario is generated by a sharp economic slowdown. The main trigger in this scenario is a slowdown in economic growth prospects in the United States and in emerging markets that spills over to euro area countries. This would be amplified by trade disruptions owing to more protectionist policies in some advanced economies. Aggregate demand falls, which leads to a sharp downturn in private consumption and investment. Households and firms face difficulties in paying back their debt, which leads to elevated debt sustainability concerns for the private sector.
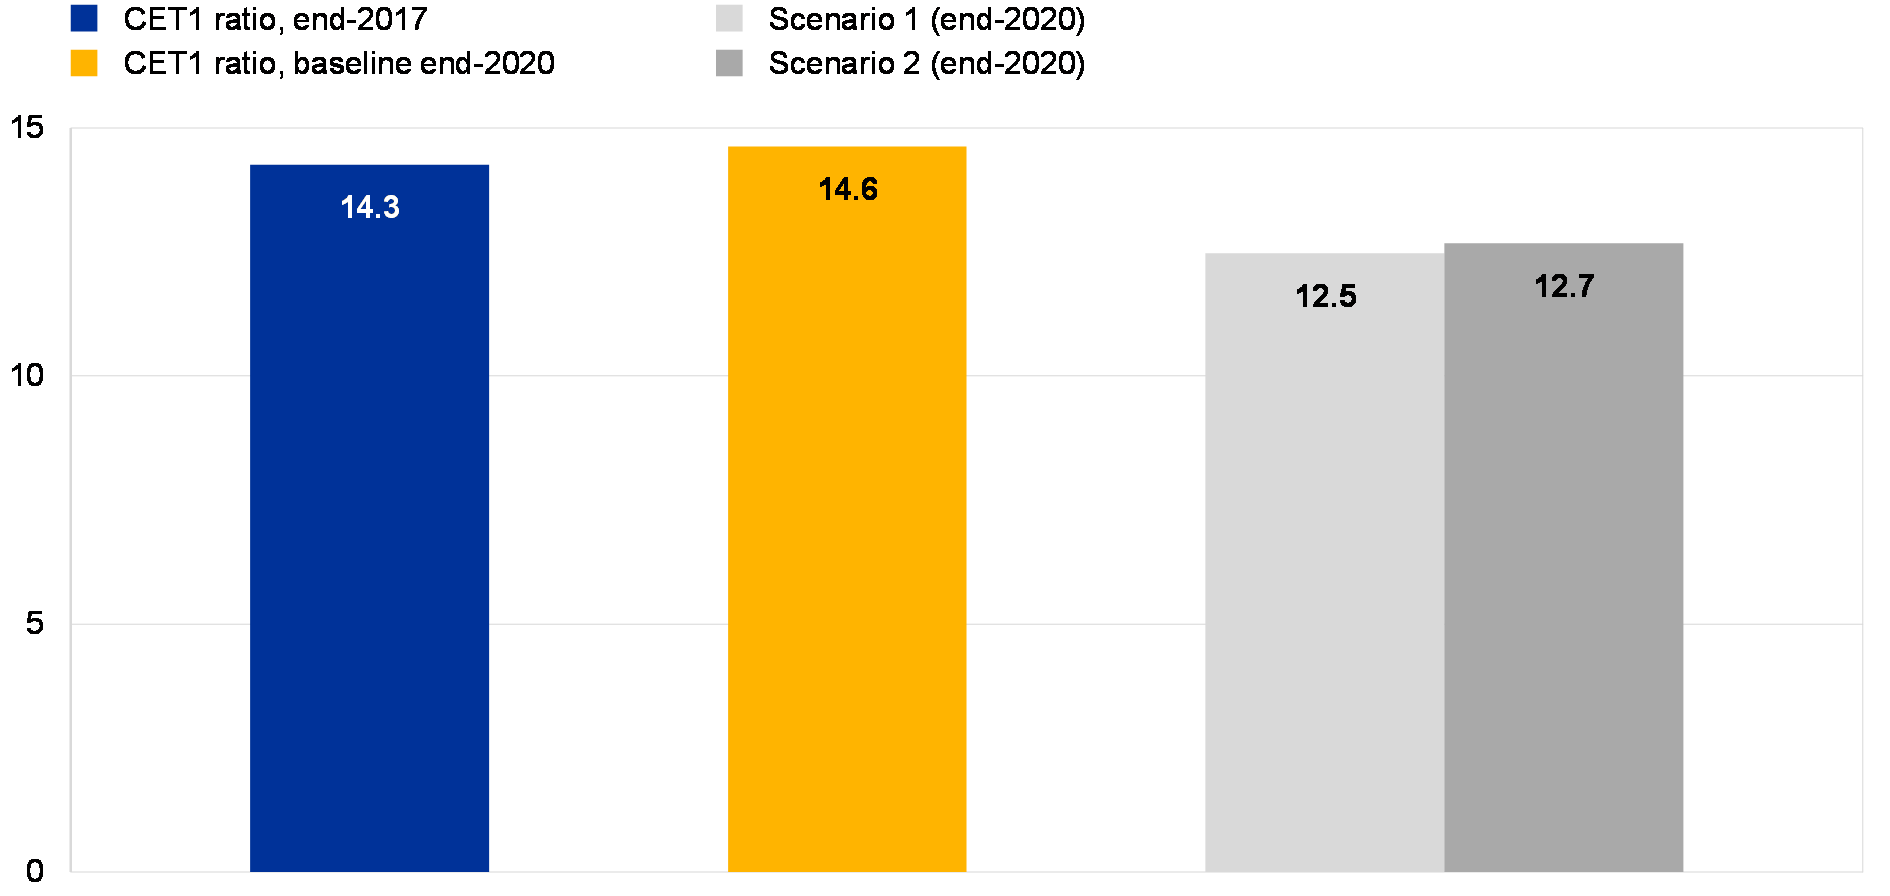
Chart 18
The materialisation of key financial stability risks could lead to sizeable losses for banks, but aggregate capital positions would remain adequate
CET1 capital ratios of euro area banking groups under the baseline and adverse scenarios
(percentages)
Sources: Individual institutions’ financial reports, EBA, ECB and ECB calculations.
Note: The scenario analysis covers about 100 large and medium-sized banking groups directly supervised by the ECB.
A materialisation of either of the two scenarios would lead to sizeable depletions of bank capital (see Chart 18). In aggregate terms, the euro area banking sector is assessed to be resilient to the materialisation of the main financial stability risks. In the first and second scenarios, the aggregate Common Equity Tier 1 (CET1) ratio would decline by 2.1 and 1.9 percentage points, respectively, compared with the baseline.[4] Some differences across banks can be observed, but the majority of euro area significant institutions would maintain their CET1 capital ratio above the average capital requirement of 10% under the adverse scenario.[5] While the implications of the materialisation of the two scenarios are broadly similar, the probability of the first scenario materialising is assessed to be higher than that of the second, given the continued higher risk-taking in financial markets and the positive macro news in recent quarters.
Recommendations and policy considerations
Although the financial stability environment is currently benign, deliberate and decisive action is needed to address nascent and existing vulnerabilities. Many of the vulnerabilities discussed in this FSR can be dealt with through action by financial regulators and legislators, macroprudential authorities as well as market participants and the financial industry. The most relevant and pressing of these recommended actions are outlined below.
Policy considerations for cyclical systemic risks
Cyclical systemic risks remain contained, but on an upward trajectory, in most euro area countries and in the area as a whole. Credit growth rates are recovering across the board. Together with additional indicators of cyclical systemic risks, especially asset prices, these developments support the assessment that risks are gradually increasing. At the same time, deviations of credit-to-GDP ratios from their long-term trend (“credit gaps”) remain negative in most countries. Overall, therefore, a broad-based increase in countercyclical capital buffers (CCyBs) across the euro area is not warranted currently. Nevertheless, CCyB rates have been announced or activated in two euro area countries. Moreover, some other macroprudential authorities should be ready to act should cyclical systemic risks increase further.
Policy considerations for property markets
Macroprudential authorities are encouraged to step up efforts to prevent the materialisation of spirals of excessive and mutually reinforcing credit and property market dynamics. Against the backdrop of the recovery in residential real estate markets gaining momentum across the euro area, macroprudential authorities should consider activating borrower-based measures in countries where household balance sheets are weakening or where lending standards are showing early signs of deterioration. In this context, countries should ensure that legal frameworks for borrower-based measures are adopted and fully operational in line with the December 2016 Governing Council statement on macroprudential policies. Moreover, in countries where the residential real estate cycle is more advanced and “stock” vulnerabilities are more visible in the form of high household indebtedness and/or price overvaluation, macroprudential authorities should consider introducing capital measures targeting real estate exposures. Regarding potential risks in commercial real estate markets, countries should close data gaps in line with the 2016 ESRB recommendation[6] in order to improve risk and policy analysis. In addition, countries should work towards sound risk assessment frameworks to support policy analysis.
Policy considerations for banks
Banks need to make further progress towards adjusting their business models in order to achieve sustainable profitability. This adjustment should encompass both a better diversification of sources of revenue (to reduce reliance on interest income) and cost-cutting, including by reaping the benefits of increased digitalisation.
In the current favourable macroeconomic environment, banks should continue to step up their efforts to reduce NPL stocks. National authorities can support banks’ efforts by implementing policies to support markets for NPLs and could facilitate the setting-up of NPL transaction platforms and consider securitisation schemes. In certain circumstances, asset management companies (AMCs) may be warranted. Banks should continue to pursue timely provisioning and write-off practices in line with supervisory expectations, also taking into account the addendum that the ECB published to its NPL guidance.[7]
Banks (and other financial institutions) need to ensure that sound cyber risk management is in place and fully integrated in their institution-wide operational risk management frameworks. As technological progress has made the financial system more complex and more deeply interconnected, banks need to reconsider their internal risk management practices in order to withstand cyber and associated IT risks. In this regard, international cooperation between institutions and authorities is essential.
Policy considerations for the asset management sector
Financial market participants need to be aware that the favourable market environment observed over the past few years may quickly change. In order to mitigate possible losses stemming from a sudden reversal in risk premia, market participants should conduct proper risk management that takes into account stressed scenarios such as abrupt changes to the correlation patterns across asset classes or a possible deterioration in liquidity conditions.
Policy considerations for highly indebted sovereigns and corporates
In view of the high debt ratios in some countries, it is important that fiscal authorities continue to ensure positive primary balances in the coming years, even under less favourable economic conditions. By the same token, as deleveraging by households and non-financial firms has scarcely materialised in the euro area, contrary to what has been seen in other major jurisdictions, it would be advisable for cash-rich private agents to reduce their current debt levels.
Regulatory issues
The finalised Basel III package should be fully implemented across all jurisdictions in a timely fashion. As further experience with this common set of standards is gained, progress should be carefully monitored through a comprehensive evidence-based evaluation. In this regard, it will be important to maintain the current high level of international cooperation, as globally agreed standards are key to financial stability.
The ongoing review of the Capital Requirements Regulation (CRR) and the Capital Requirements Directive (CRD IV) should be used to strengthen and harmonise the European regulatory architecture. Alongside increased financial integration and progress towards banking union, regulators and legislators should achieve more progress in the harmonisation of national options and discretions and consider the introduction of cross-border capital waivers, subject to additional safeguards such as those suggested by the ECB in its Opinion.[8] Moreover, regulators and legislators should consider introducing a requirement to establish an EU intermediate parent undertaking (IPU) and, to prevent regulatory arbitrage opportunities, require the inclusion of third-country branches in the regulatory EU sub-group under such an IPU. Otherwise, third-country groups could partially or fully circumvent the IPU requirement by operating in the EU primarily or entirely via branches. Finally, a full and timely implementation of internationally agreed supervisory standards is warranted.
The review of the CRR and CRD IV also provides an opportunity to revisit the design of the macroprudential framework. At present, the implementation of macroprudential policy is scattered across the CRR and CRD IV, leading to a wide range of practices regarding the use of the tools and their application by authorities. In this context, EU co-legislators should consider an ambitious set of targeted changes to the framework, with the aim of making it more coherent, consistent and operational.
The revised framework for crisis management and resolution should be swiftly adopted so as to enable risk reduction and risk-sharing. Completing the reform requires the agreement of the co-legislators, so it is essential that the Council and the European Parliament reach a position and then agree in the trialogue meetings. In addition, the co-legislators should make progress on the European Stability Mechanism (ESM) reform, including, in particular, its establishment as a backstop to the Single Resolution Fund (SRF), and reach an agreement on the European deposit insurance scheme (EDIS) as the missing third pillar of the banking union.
The regulatory and supervisory framework for non-banks needs to be strengthened. In view of the strong growth in the role of investment funds in financial intermediation and indications that the sector is assuming more risk, authorities need to be equipped with relevant powers to be able to mitigate structural vulnerabilities from asset management activities, in particular for situations where measures available to asset managers themselves would not be sufficient to address these. EU co-legislators should introduce macroprudential tools designed to address systemic risks related to liquidity mismatches and the use of leverage in investment funds. Moreover, large and complex investment firms, and in particular those with cross-border operations and those undertaking bank-like activities, should be subject to the same regulation and supervision as credit institutions.
1 Macro-financial and credit environment
1.1 Robust euro area growth with a broadly balanced outlook
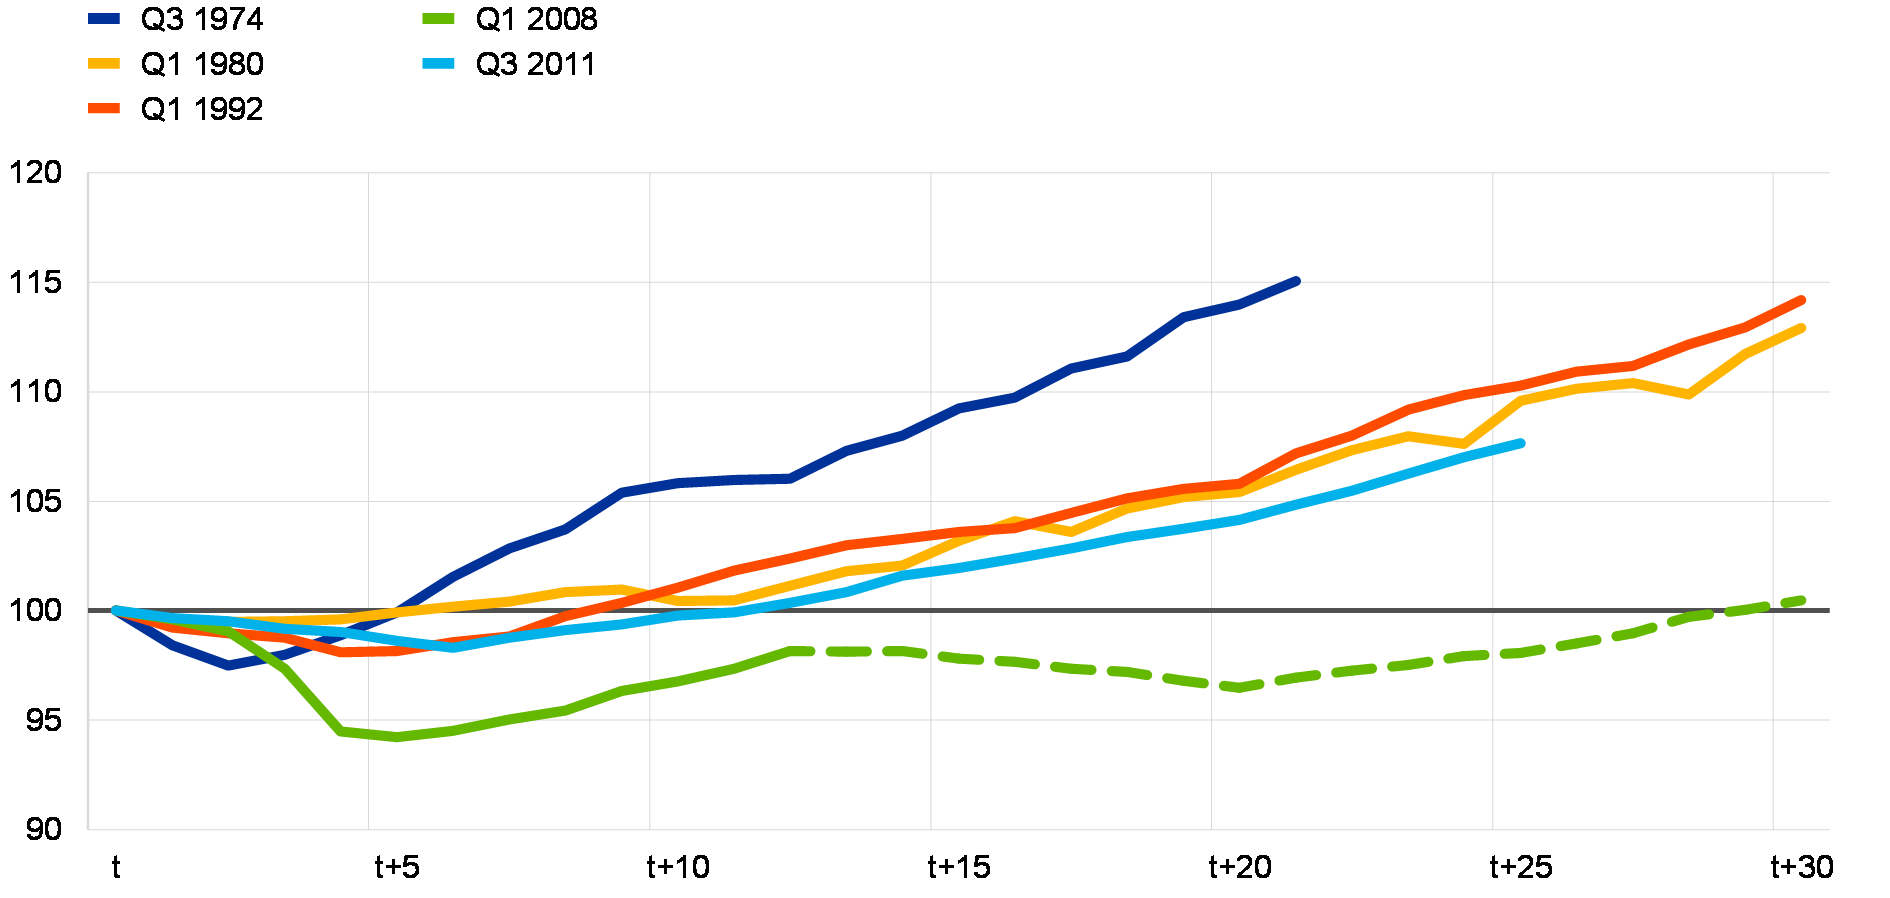
The euro area economy has continued to expand at a robust pace. Domestic demand has remained the main engine of economic growth. The ongoing recovery in labour and housing markets is bolstering private consumption via positive income and wealth effects, while very favourable financing conditions and rising corporate profitability are lending support to business investment. At the same time, a broad-based global expansion is supporting foreign demand for euro area goods and services. The cyclical euro area upturn is also being reinforced by strong (albeit more recently somewhat softening) business and consumer sentiment, as well as low macroeconomic uncertainty. After an exceptionally drawn-out recovery, the euro area economy is in an expansion phase and the output lost since the start of the downturn in 2008 has been restored (see Chart 1.1).
Chart 1.1
Relatively moderate economic recovery in the euro area since 2008 by historical standards
Real GDP patterns during various episodes of economic recovery in the euro area
(pre-recession peak = 100, number of quarters after the peak)
Source: Eurostat and ECB calculations.
Notes: The dashed line refers to the euro area sovereign debt crisis that followed the global financial crisis. This recession is also shown separately, starting in Q3 2011. Recessions are based on those identified by the CEPR Euro Area Business Cycle Dating Committee.
The broad-based nature of the economic expansion in the euro area underpins its resilience. The distribution of growth rates across both euro area countries and sectors of economic activity has continued to narrow, suggesting a broad-based and thus resilient economic expansion. Labour market conditions have also continued to improve. Employment gains have been similarly broad-based across countries and sectors and the aggregate euro area unemployment rate has dropped to the lowest level since late 2008. That said, heterogeneity across countries remains high, amid signs of increasingly binding labour supply shortages in some countries but also persistently elevated unemployment rates in others.
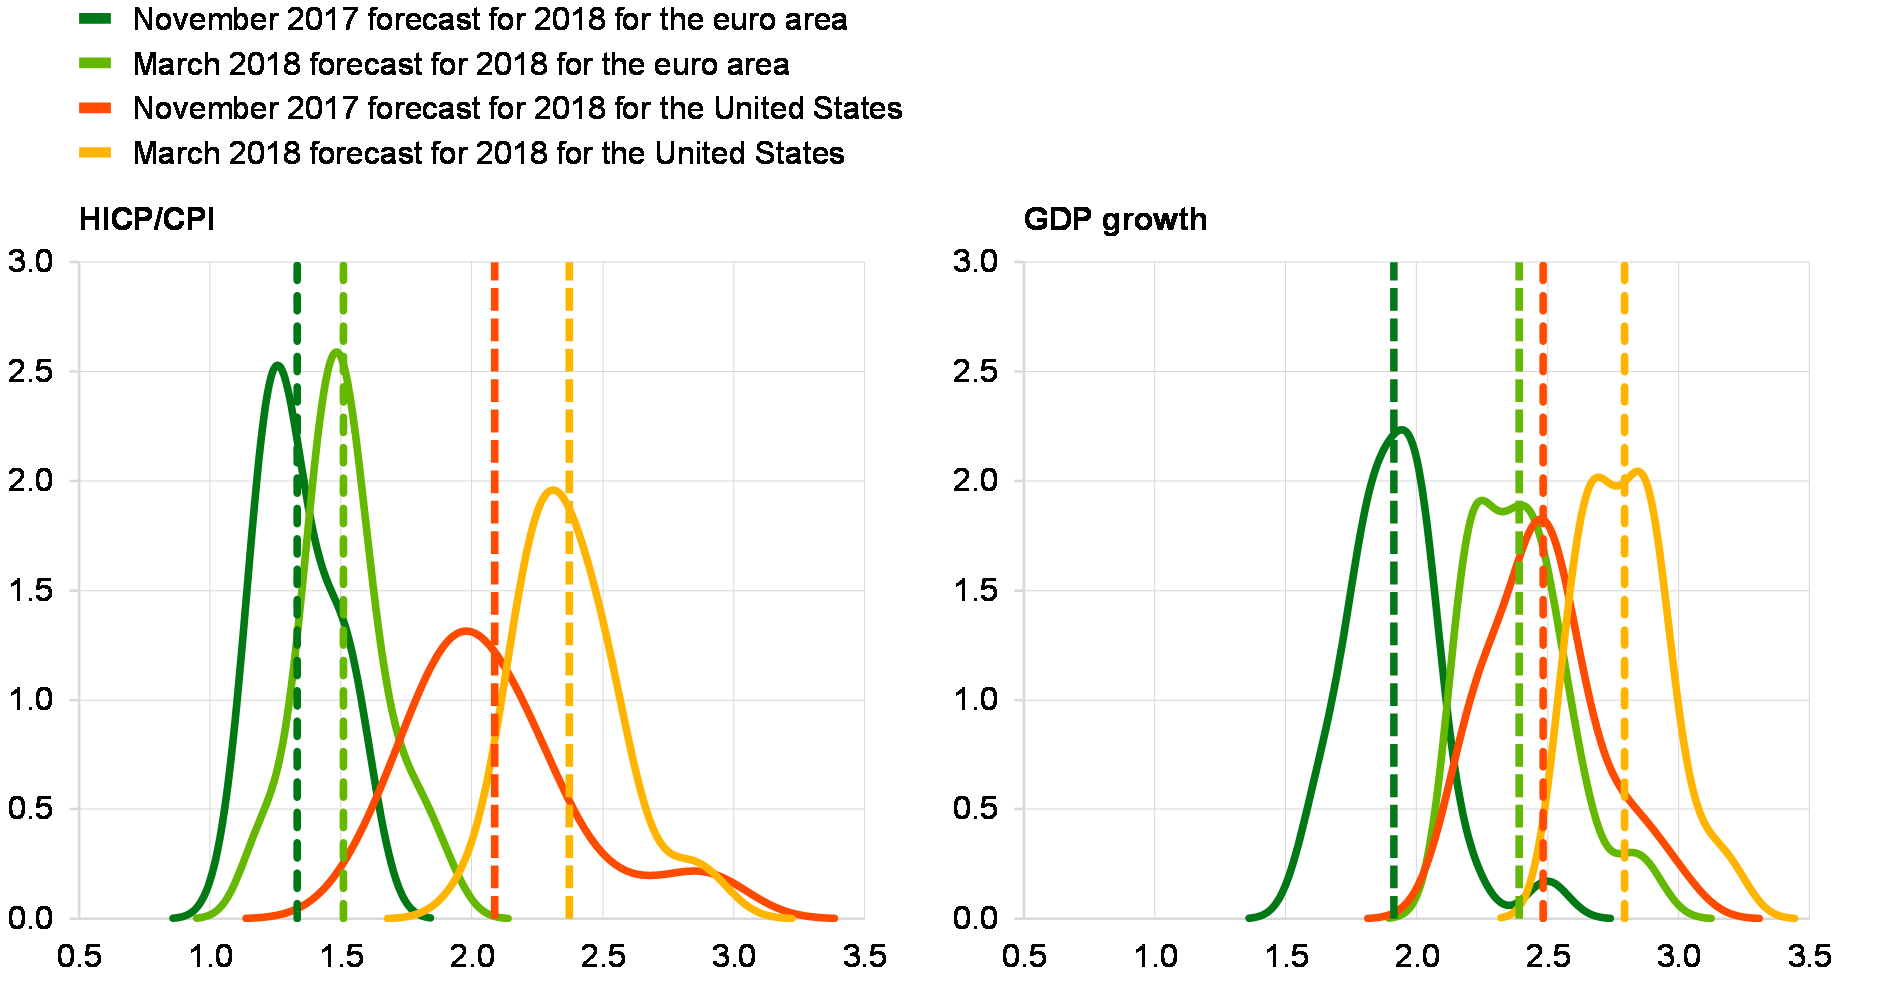
Fundamentals bode well for a continued economic expansion. Favourable financing conditions, past progress made in deleveraging and strong confidence across sectors signal robust economic growth ahead. Real GDP growth is expected to remain above potential until 2020. Nevertheless, based on the March 2018 ECB staff macroeconomic projections, real GDP growth is projected to slow from 2.4% in 2018 to 1.9% in 2019 and 1.7% in 2020, as some tailwinds gradually dissipate. Despite the strong cyclical momentum, the euro area growth environment continues to lag behind the more buoyant developments seen in the United States, particularly as regards inflation (see Chart 1.2).
Chart 1.2
Higher expected real GDP growth and inflation for both the euro area and the United States reflect improved nominal growth prospects
Distribution of the 2018 real GDP growth and HICP/CPI forecasts for the euro area and the United States
(probability density)
Sources: Consensus Economics and ECB calculations.
Note: The dashed lines represent the average real GDP growth and HICP/CPI forecast values.
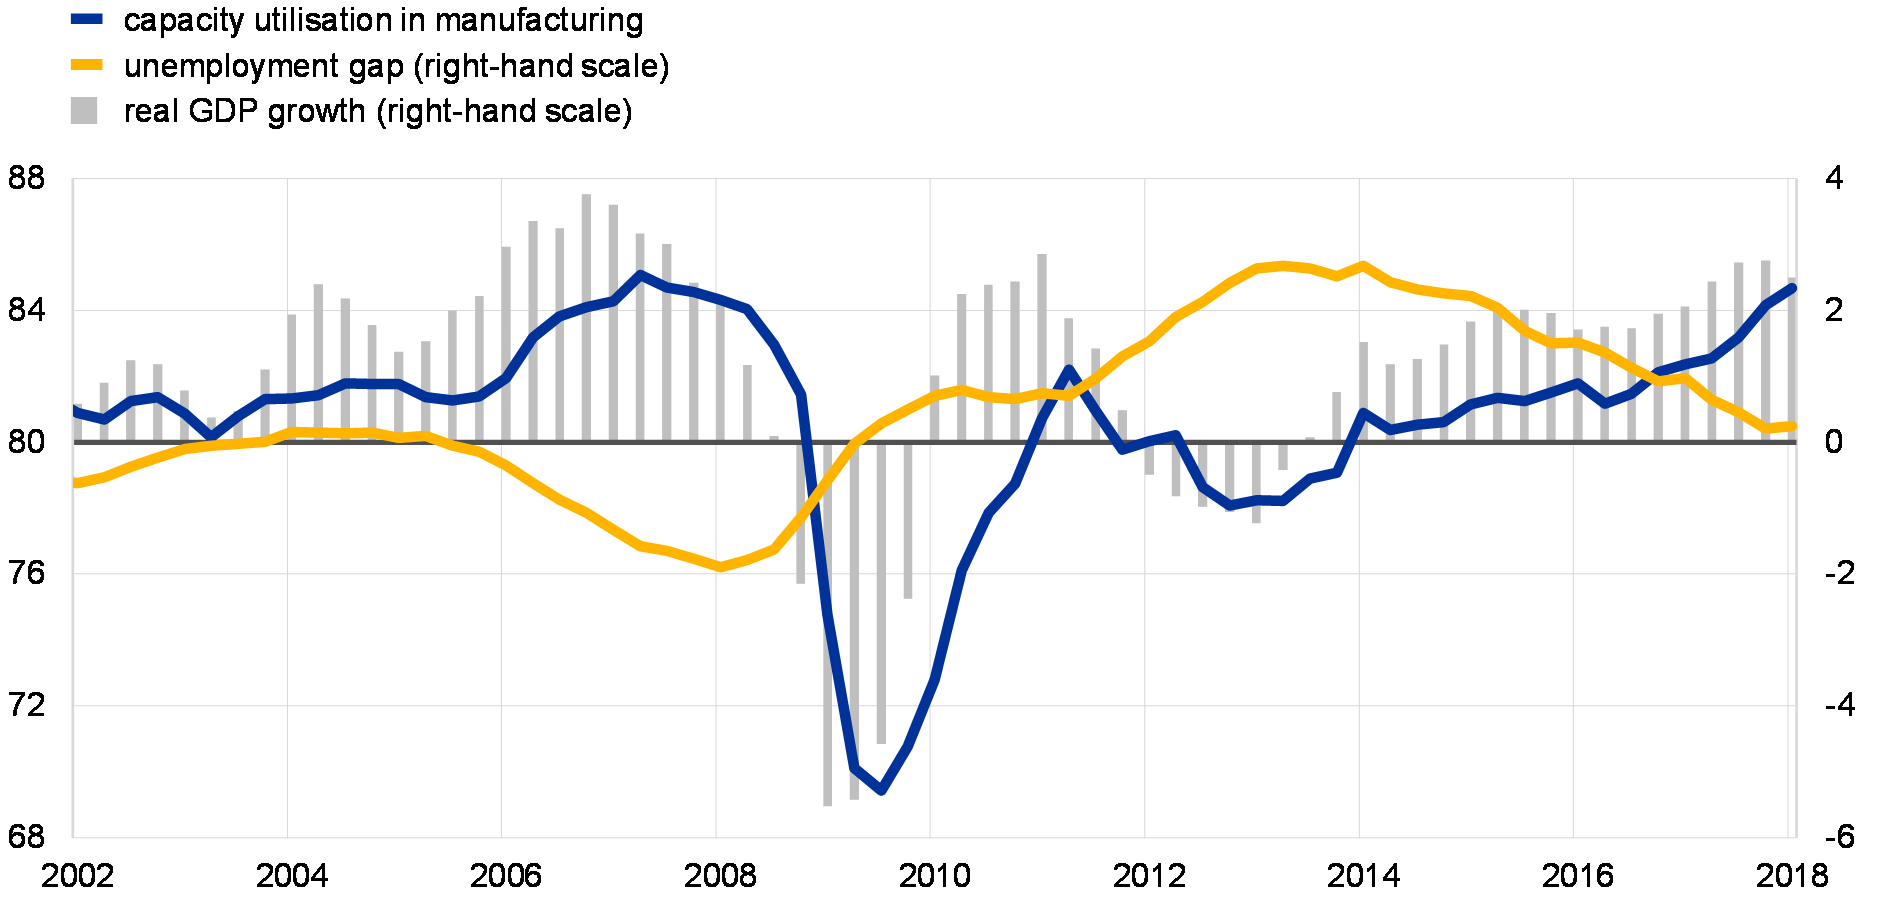
Euro area nominal growth prospects are set to improve gradually. Headline HICP inflation has been broadly stable at around 1.3% since the publication of the previous FSR. Looking ahead, on the basis of current futures prices for oil, annual rates of headline inflation are likely to hover around 1.5% for the remainder of the year. Measures of underlying inflation remain subdued but are expected to rise gradually, supported by the ECB’s monetary policy measures, the ongoing economic expansion as well as the related gradual absorption of economic slack and increase in capacity utilisation (see Chart 1.3) leading to stronger wage growth. The March 2018 ECB staff macroeconomic projections for the euro area foresee headline inflation averaging 1.4% in 2018 and 2019, before rising to 1.7% in 2020.
Chart 1.3
Nominal pressures may be building up gradually as economic activity in the euro area gathers pace
Capacity utilisation, unemployment gap and real GDP growth
(Q1 2002 – Q1 2018, percentage of capacity utilisation, percentage points, annual percentage changes)
Sources: European Commission (AMECO database), European Commission Business and Consumer Surveys and ECB calculations.
Notes: The unemployment gap is calculated as the difference between the unemployment rate and the non-accelerating wage rate of unemployment. The real GDP growth figure for the first quarter of 2018 is the flash estimate.
The global economy continued on a robust growth path. Underlying growth dynamics have become more broad-based and synchronised across the globe. Economic growth in advanced economies outside the euro area is being bolstered by supportive global financial conditions, upbeat confidence, favourable labour market conditions, an upswing in housing markets and receding headwinds from private sector deleveraging in several countries. In emerging markets, economic growth is also being supported by strong foreign demand and higher commodity prices. In fact, oil prices have reached almost USD 80 per barrel – the highest level since late 2014 – driven by both strong demand and continued supply restrictions.
Global economic activity is expected to remain strong in the short run. Growth in the global economy is expected to accelerate in the near term (see Chart 1.4), but the pace of expansion will remain below pre-crisis rates, in line with lower potential growth estimates. Against the backdrop of overall supportive (albeit increasingly diverging) monetary policies, the outlook for advanced economies entails a robust expansion, boosted by the recent tax reform in the United States in the near term. Thereafter, output growth is projected to slow somewhat as the recovery matures. Economic activity in emerging market economies is expected to be supported by the ongoing gradual recovery from deep recessions in major commodity exporters (e.g. Brazil and Russia) and fairly resilient growth prospects in China and India.
Chart 1.4
Broad-based improvement in economic growth prospects across the globe
Change in real GDP growth forecasts for 2018 for major advanced and emerging economies
(Apr. 2018, changes vs. Nov. 2017; percentages, percentage points)
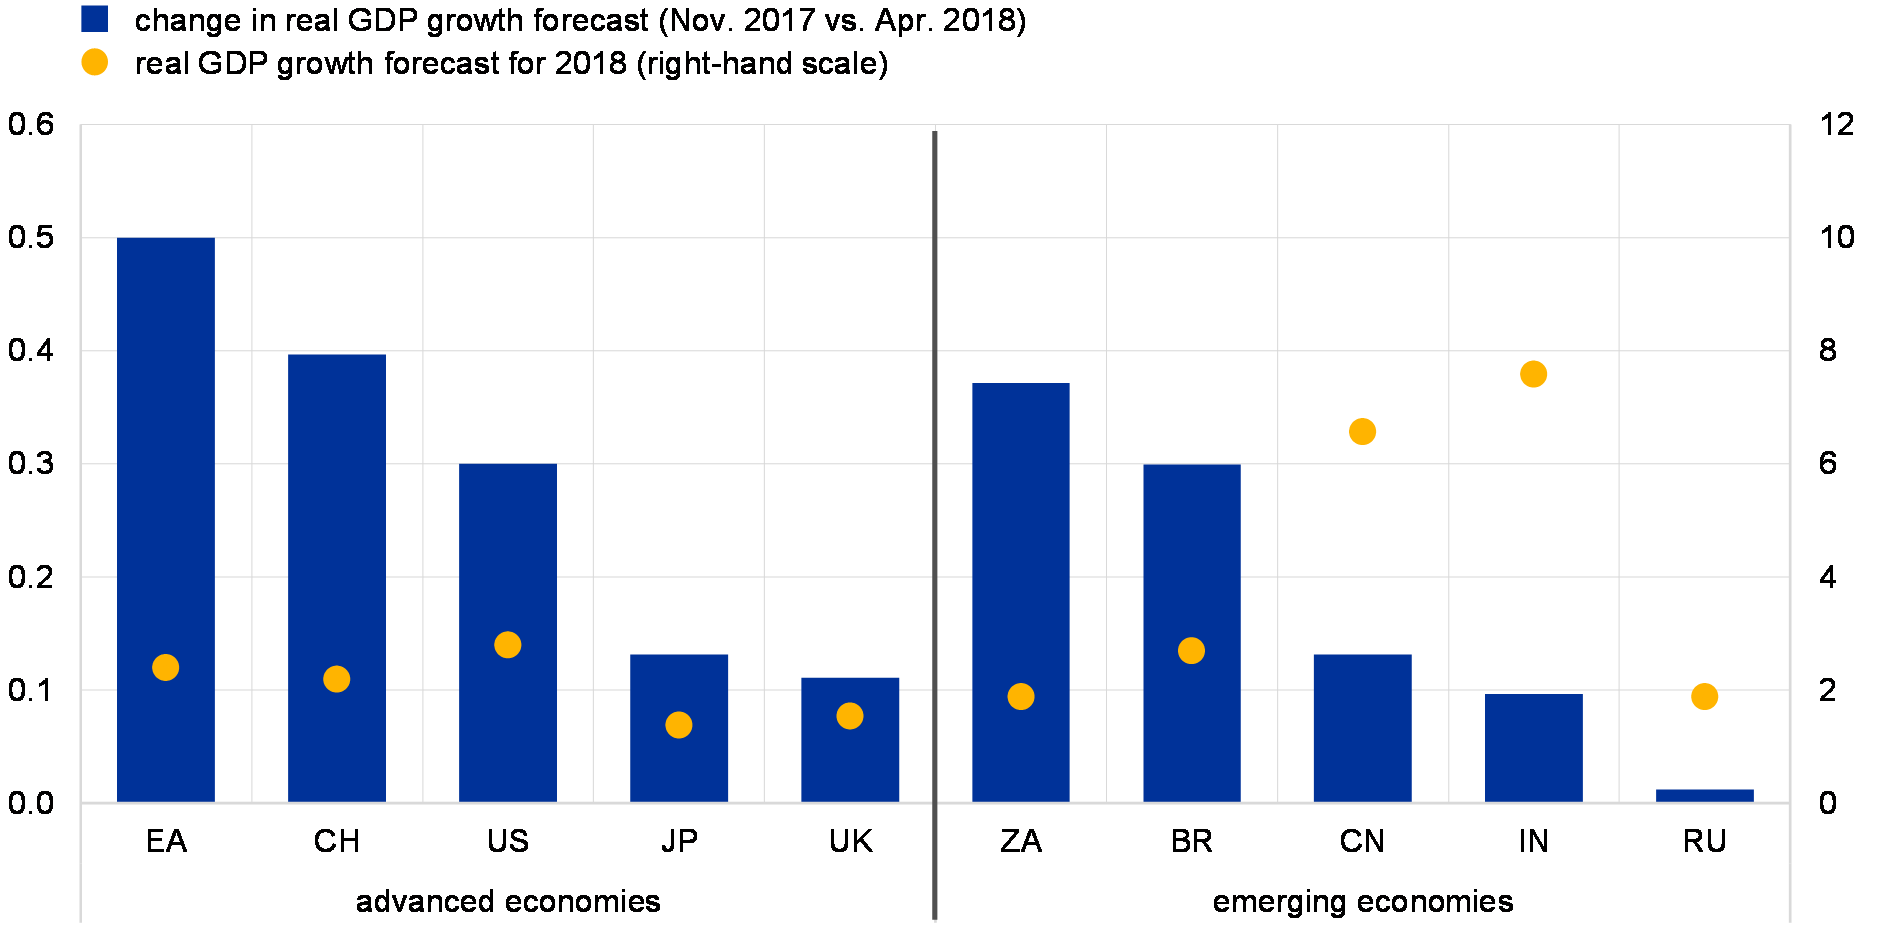
Sources: Consensus Economics and ECB calculations.
Note: EA: euro area; CH: Switzerland; US: United States; JP: Japan; UK: United Kingdom; ZA: South Africa; BR: Brazil; CN: China; IN: India; RU: Russia.
The upbeat baseline outlook for euro area growth is clouded by some risks emanating from global factors. Downside risks primarily relate to global factors, although the sluggish pace of structural reforms or further balance sheet adjustment needs in the public and/or private sectors in some euro area countries also pose risks to the growth outlook. The uncertainties surrounding the fiscal and monetary policy mix in the United States and its implications for the US and global economy, lingering debt sustainability concerns in emerging market economies and a further rise in (geo)political uncertainties across the globe, particularly as regards trade policies, may weigh on the global and euro area growth momentum. These downside risks are broadly counterbalanced in the risk assessment by the possibility of stronger than expected domestic demand momentum, a looser fiscal stance or higher than expected euro area potential output.
An overheating of the US economy could lead to tighter global financial conditions. The significant US fiscal stimulus enacted at the turn of the year is expected to boost economic activity in the near term. The expansionary fiscal stance in the late phase of the business cycle (see Chart 1.5) may lead to an overheating of the economy, while the ensuing higher inflationary pressures could lead to a faster than expected monetary policy tightening in the United States. Tighter financing conditions in the United States would, in turn, spill over to global financing conditions, negatively affecting the global economy. The recent fiscal stimulus may also exacerbate concerns regarding the sustainability of public finances and lead to a reassessment of US sovereign risk, potentially translating into a repricing in global bond markets.
Chart 1.5
Expansionary fiscal policies in the United States may raise public debt sustainability and overheating concerns
Output gap and changes in the cyclically adjusted primary budget balance in the United States
(2007-19, percentages, percentage points)
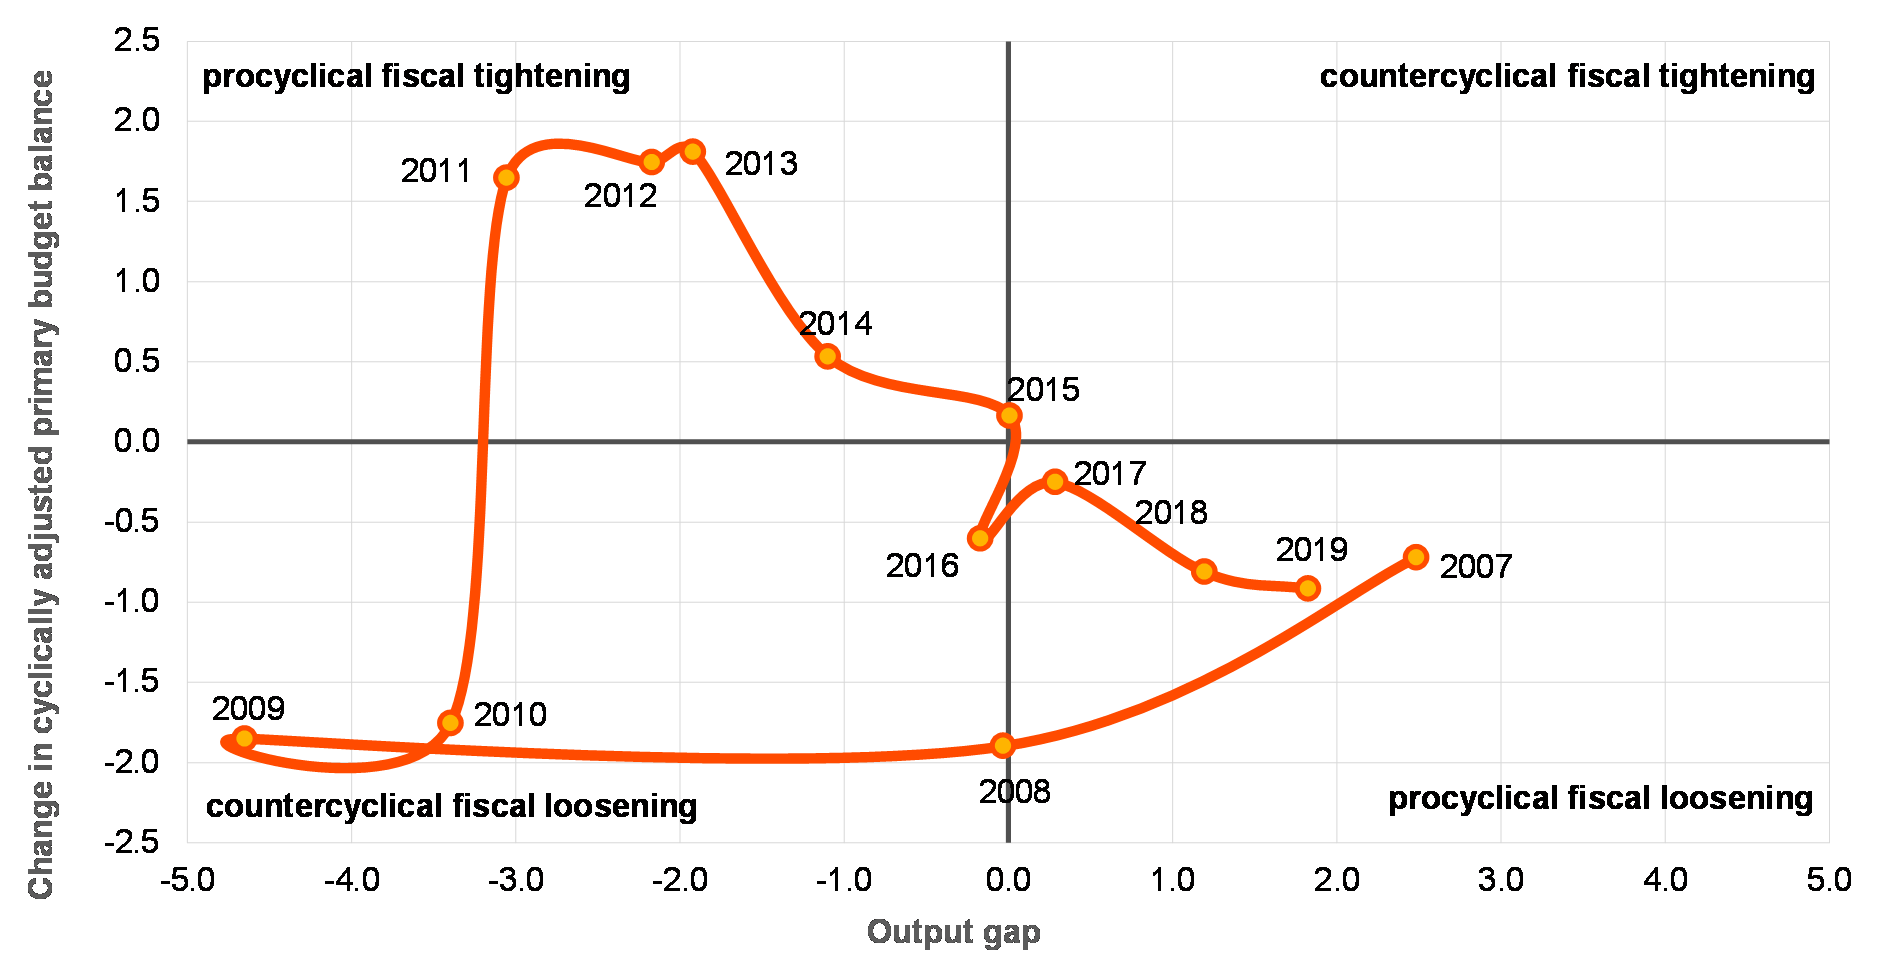
Sources: IMF (World Economic Outlook Database) and ECB calculations.
Note: Data for 2018 and 2019 are projections.
Lingering vulnerabilities in emerging market economies remain a cause for concern. In general, emerging market economies are in an increasingly robust position to withstand external financial shocks given their improved fundamentals. However, past credit excesses and the related debt accumulation over the past decade (see Chart 1.6 – left panel) may expose many emerging market economies to the risk of sudden capital flow reversals. Moreover, they render them more vulnerable to exchange rate shocks, particularly in the case of emerging market economies with notable US dollar liabilities, as reflected by the recent turmoil in Argentina and Turkey. That said, these developments have been driven by domestic factors and no wider emerging market sell-off has occurred to date in the wake of rising US long-term yields and the stronger US dollar. The prospective implications of further exchange rate turbulence could reverberate beyond emerging market economies given their growing economic and financial linkages with the rest of the world, in particular if an idiosyncratic, country-level event turns into a more broad-based increase in risk aversion vis-à-vis emerging markets (see Box 1).
Chart 1.6
Debt sustainability concerns in EMEs, a renewed flare-up of (geo)political risk and growing trade protectionism represent downside risks to global growth prospects
Non-financial private sector debt and deleveraging needs in emerging market economies, economic policy uncertainty and geopolitical risk index, and number of trade interventions
(left panel: Q4 2016, percentage of GDP, percentage points; middle panel: May 2016 – Apr. 2018, indices: May 2016 = 100, six-month moving averages; right panel: Jan. 2009 – Apr. 2018, cumulative number of measures)
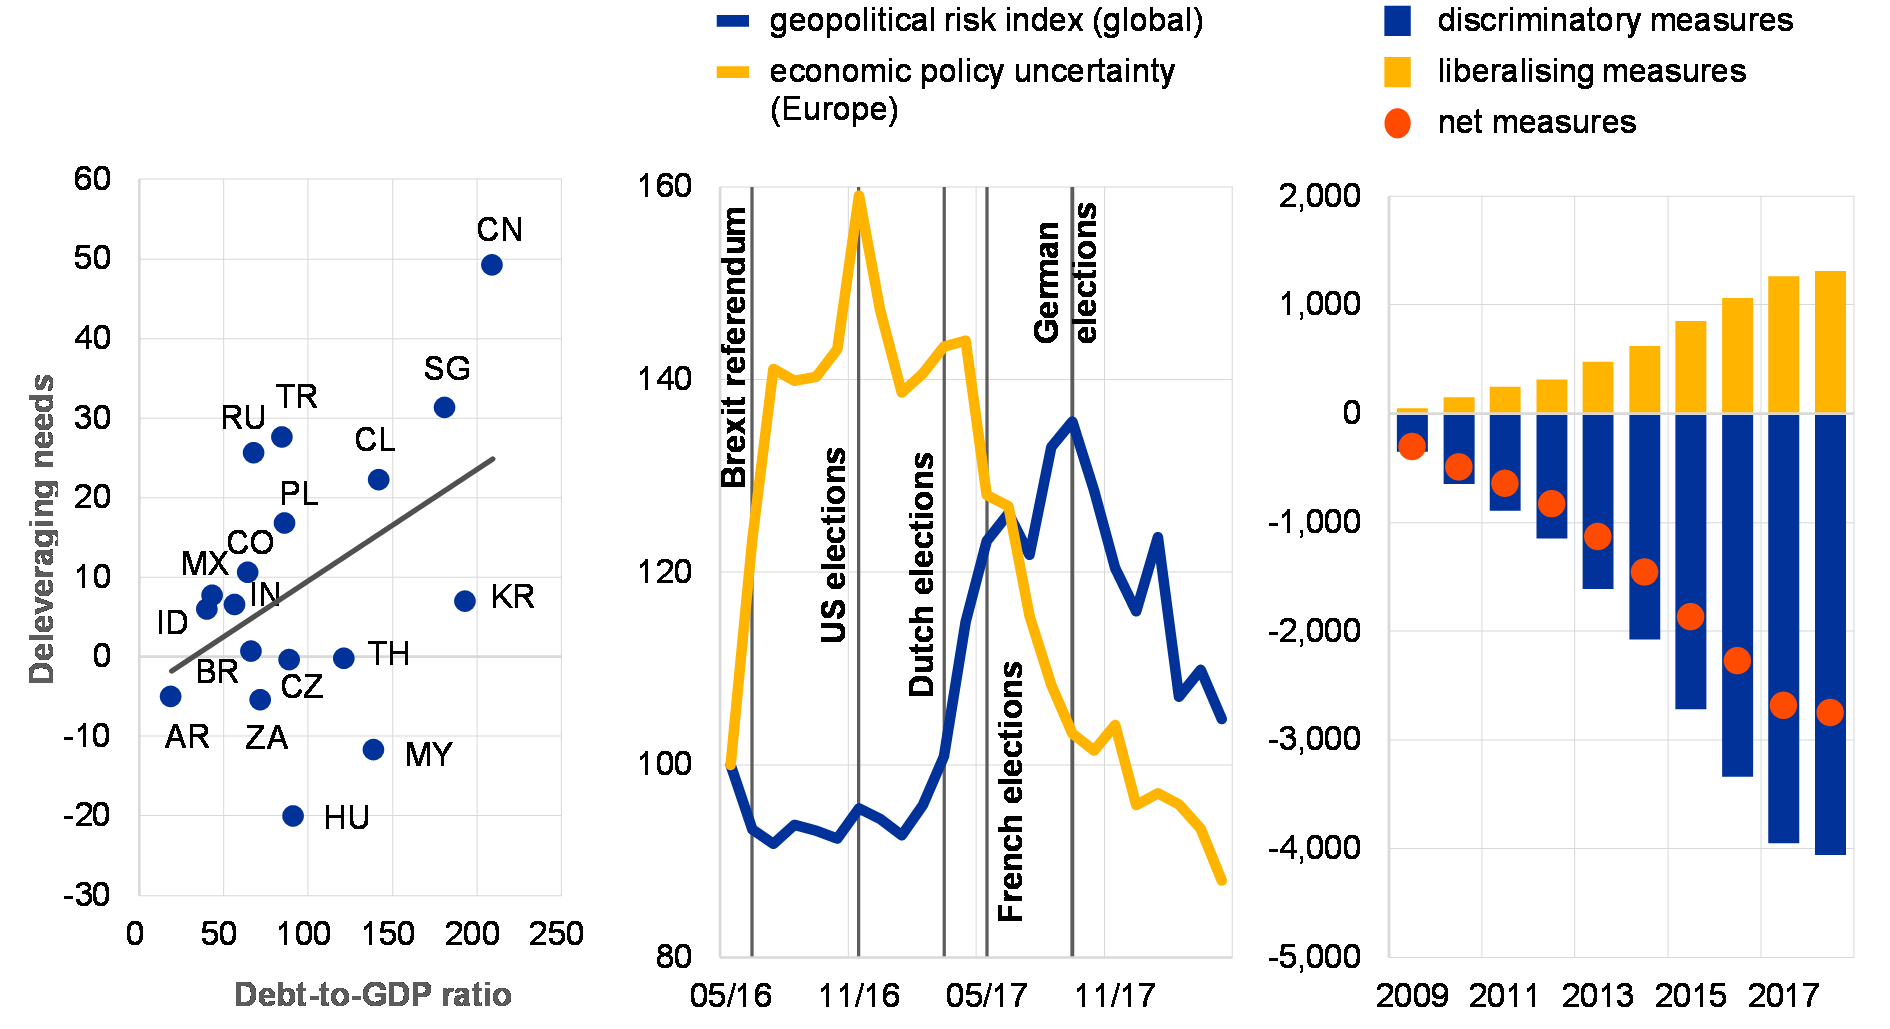
Sources: policyuncertainty.com and Caldara and Iacoviello (2017), Global Trade Alert Database, ECB and ECB calculations.
Notes: Left panel: Equilibrium debt level estimates are based on a panel co-integration model. Following Consolo and Pierluigi (2016) and Arellano et al. (2009), debt developments are explained with income (GDP), the cost of debt (lending rate), a measure of uncertainty (unemployment rate), and indicators of financial market development (bank deposits, equity market capitalisation and M2 – all relative to GDP). CN: China, SG: Singapore, KR: South Korea, MY: Malaysia: TH: Thailand, CL Chile, HU: Hungary, TR: Turkey, PL: Poland, RU: Russia, CO: Colombia: MX: Mexico, IN: India, ID: Indonesia, BR: Brazil, ZA: South Africa, CZ: Czech Republic and AR: Argentina. Middle panel: Measures of economic policy uncertainty are taken from Baker, S., Bloom, N. and Davis, S., “Measuring Economic Policy Uncertainty”, Chicago Booth Research Paper No 13/02, January 2013. The geopolitical risk index of Caldara and Iacoviello is used. For more details, see Caldara, D. and Iacoviello, M., “Measuring Geopolitical Risk”, working paper, Board of Governors of the Federal Reserve System, November 2017. Right panel: Measures capture trade in goods and services. Figures for 2018 cover data for the first quarter of 2018. First available data are for 2009.
Renewed (geo)political uncertainties have the potential to weigh on growth. While economic policy uncertainty and geopolitical risk appear to have decreased in recent months (see Chart 1.6 – middle panel), a re-intensification of (geo)political risks may bear the potential to undermine confidence and sentiment with adverse repercussions for both financial markets and the real economy. In fact, policy uncertainties remain elevated in advanced economies, in particular as regards the ongoing negotiations on the future relations between the United Kingdom and the European Union. Moreover, a potential escalation of geopolitical tensions may have a severe impact on the global economy via deteriorating sentiment and a rise in risk aversion.
A significant escalation of trade tensions risks derailing the ongoing recovery in global trade and economic activity. While strong global trade continues to underpin global growth prospects, a possible further strengthening of protectionist tendencies in advanced economies (see Chart 1.6 – right panel) could adversely impact global trade and growth, especially if accompanied by retaliatory measures by target countries and adverse confidence effects. According to ECB staff simulations, in such an escalation scenario, world trade in goods could fall by up to 3% in the first year after the change in tariffs and world GDP by up to 1%.[9] That said, the precise impact on individual countries would primarily depend on their size, openness and trade intensity with the tariff-imposing country.
All in all, financial stability in the euro area could be challenged should these downside risks materialise. These factors may not only undermine the sustainability of the global and euro area recovery, but also have the potential to trigger tensions in global financial markets and prompt a disorderly unwinding of global search-for-yield flows. A weaker than expected growth environment could trigger the materialisation of any of the main risks to euro area financial stability and could reinforce global risk repricing, further challenge bank profitability or fuel debt sustainability concerns.
Box 1
The growing systemic footprint of Chinese banks
Emerging market economies have experienced accelerated financial deepening since the onset of the financial crisis. Consequently, financial stability risks emanating from emerging markets may spill over more widely to the global financial system. A key focus in this regard has been China, not least given the sheer size of its banking sector and the country’s growing role in international finance. Against this background, this box investigates the risks related to the growing size and systemic importance of Chinese banks and their possible implications for euro area financial stability.
Chinese banks have increased their weight and systemic relevance in the global financial system since 2008. The total assets of China’s banking sector have increased from 205% to 305% of Chinese GDP over the last decade, while the market capitalisation of Chinese banks relative to the global stock market capitalisation of banks rose from 13% in 2008 to 20% in 2017. At individual bank level, this is reflected in the rapidly growing number of Chinese banks among the 100 largest banks in the world and in the growing number of Chinese banks in the Financial Stability Board’s (FSB’s) G-SIB list and their respective rankings (see Chart A – left panel). Moreover, metrics of systemic risk point to a growing systemic relevance of Chinese banks. Their SRISK – a measure of individual banks’ contributions to the undercapitalisation of the global banking system in times of distress – has increased compared to the pre-crisis period and now exceeds that for banks in the euro area and other advanced economies (see Chart A – right panel), while more recently the SRISK measure has stabilised.[10]
Chart A
Increasing weight of Chinese banks in the global financial system not only in terms of their size, but also as regards their systemic importance
Number of Chinese banks among the worlds’ 100 largest banks based on total assets (left panel) as well as SRISK as a share of global stock market capitalisation (right panel)
(Left panel: 2008-17, number; right panel: Q1 2001 – Q4 2017, percentages)
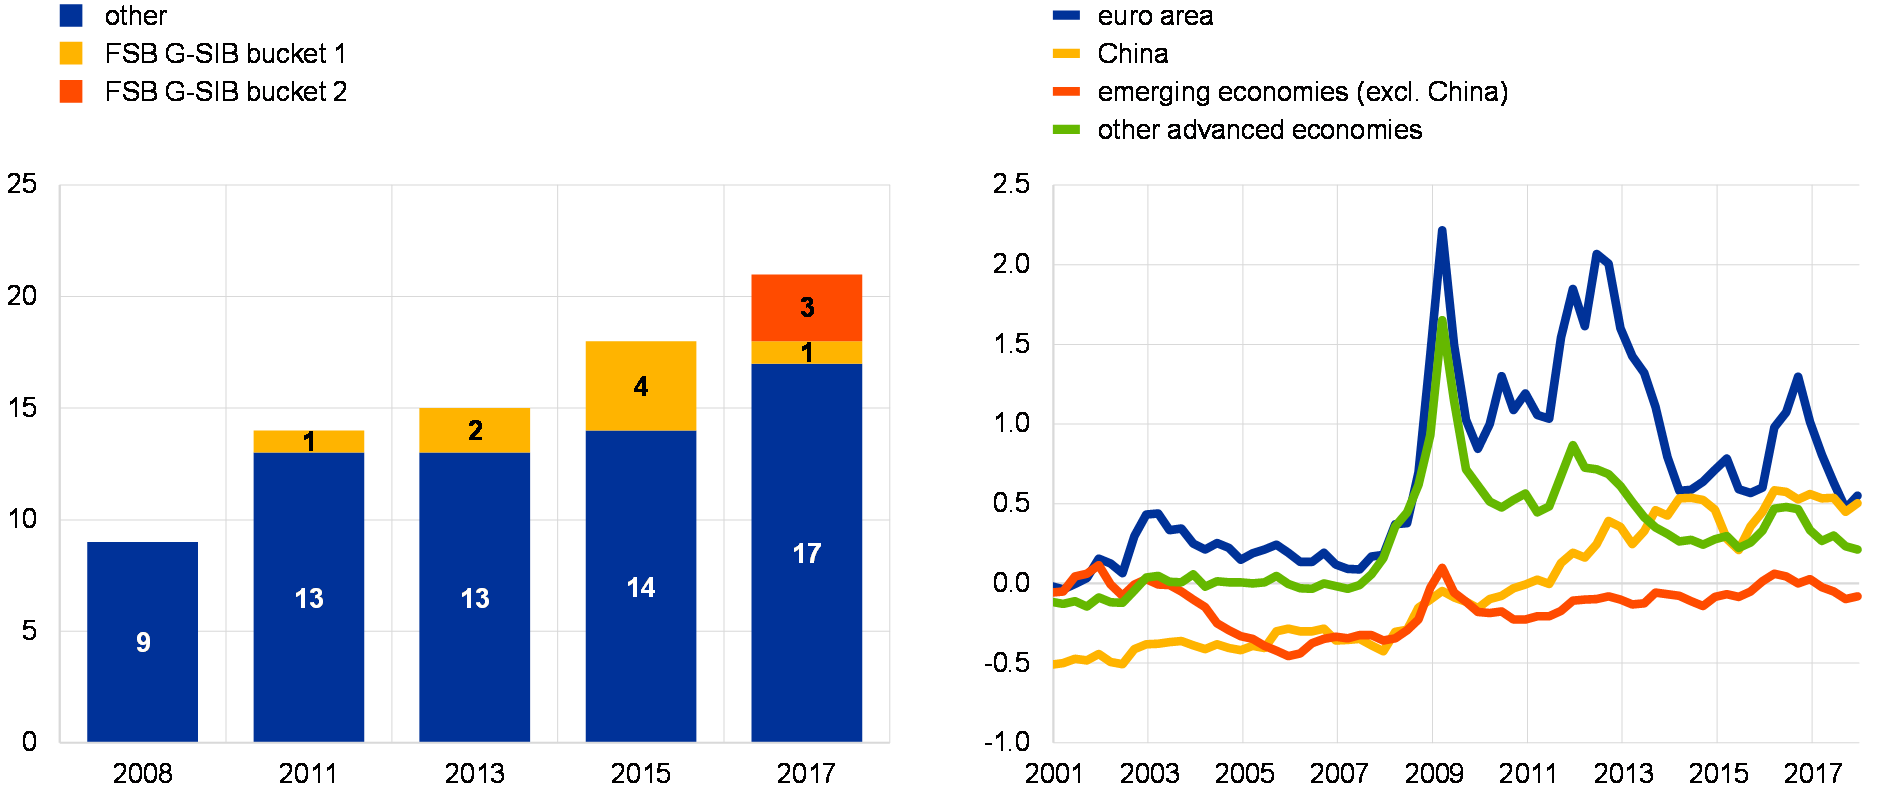
Sources: FSB, SNL Financial, New York Stern V-Lab and ECB calculations.
Notes: The FSB’s G-SIB list was introduced in 2011. G-SIBs are allocated to five buckets based on their systemic footprint as measured according to BCBS methodology. SRISK quantifies the capital shortfall conditional on a severe and prolonged stock market decline. A positive (negative) value of SRISK suggests an expected capital shortfall (surplus) of the underlying banks in the case of a systemic event. For further details on the computation of SRISK, see Brownlees, C. and Engle, R., “SRISK: A Conditional Capital Shortfall Measure of Systemic Risk”, The Review of Financial Studies, Vol. 30, January 2017, pp. 48-79. Other advanced economies cover Australia, Canada, Norway, Japan, Denmark, Sweden, Switzerland, the United Kingdom and the United States.
Chinese banks have become more interconnected with the rest of the world via both direct and indirect financial and trade channels. While China’s transactions in international portfolio assets (such as equity and fixed income securities) remain subject to tight quota, bank loans, in particular Chinese banks’ outbound investments, have been far less restricted. Zooming in on the euro area, direct euro area banking exposures to China remain negligible, in spite of having risen considerably in recent years both in absolute terms and relative to total assets. Supervisory data suggest that direct exposures of significant euro area institutions to the Chinese financial sector remain limited at below 1% of their total assets, with a strong concentration in France and Germany. Interconnectedness may, however, also arise on the liability side of euro area banks’ balance sheets, where rollover risks may emerge to the extent that Chinese banks serve as providers of (wholesale/interbank) funding. Available data, while scarce, would suggest that this funding source for euro area banks is negligible at the current juncture.
Indirect exposures may be a cause for concern, as they can generate adverse repercussions for global financial markets. This was demonstrated during the 2015 Chinese equity market turmoil that spilled over to global equity markets. Although in that episode the stock market correction did not originate in China’s financial sector, a combined Chinese economic and financial crisis scenario might have a larger impact on global financial markets, including those in the euro area. Moreover, if stress in the Chinese banking sector were to reduce Chinese banks’ capacity to finance the domestic economy, this might hamper global growth through trade channels which could have an impact on euro area banks via second round effects, such as higher credit risk.
Empirical evidence points to increased spillover risks from Chinese to euro area bank stock prices. Of the various spillover channels outlined above, the indirect exposures appear to have the largest stress potential but are at the same time the most difficult to quantify. One way to proxy spillover risk is to look at the (tail) dependencies of euro area and Chinese banks’ stock prices. To abstract from the potential impact of home-grown problems in the euro area banking sector (as indicated by marked corrections in euro area bank stock prices in early 2016) on changes in the (stock price) correlation, the focus is on the period from the middle to the end of 2015, which was characterised by a pronounced stock market correction in China. In general, the correlation of bank stock prices in the two jurisdictions has declined overall in recent years (see Chart B – left panel).[11] To better capture the tail dependencies and mitigate some of the shortcomings of the simple correlation approach, the more sophisticated conditional VaR (CoVaR) measure scaled by the prevailing level of market volatility is used. The results suggest that euro area bank equities have, in spite of lower correlations, become more sensitive to tail risks in the equity price of their Chinese peers since mid-2015 (see Chart B – right panel).
Chart B
Heightened co-movement in bank stock prices during stock price turmoil in China and increased sensitivity of euro area banks to tail risks in Chinese banks
Correlation between Chinese and euro area bank stock price indices (left panel) and euro area banks’ CoVaR vis-à-vis Chinese banks (right panel)
(left panel: Jan. 2010 – Feb. 2018, correlation coefficient; right panel: Jan. 2010 – Feb. 2018; standard deviations (inverted scale))
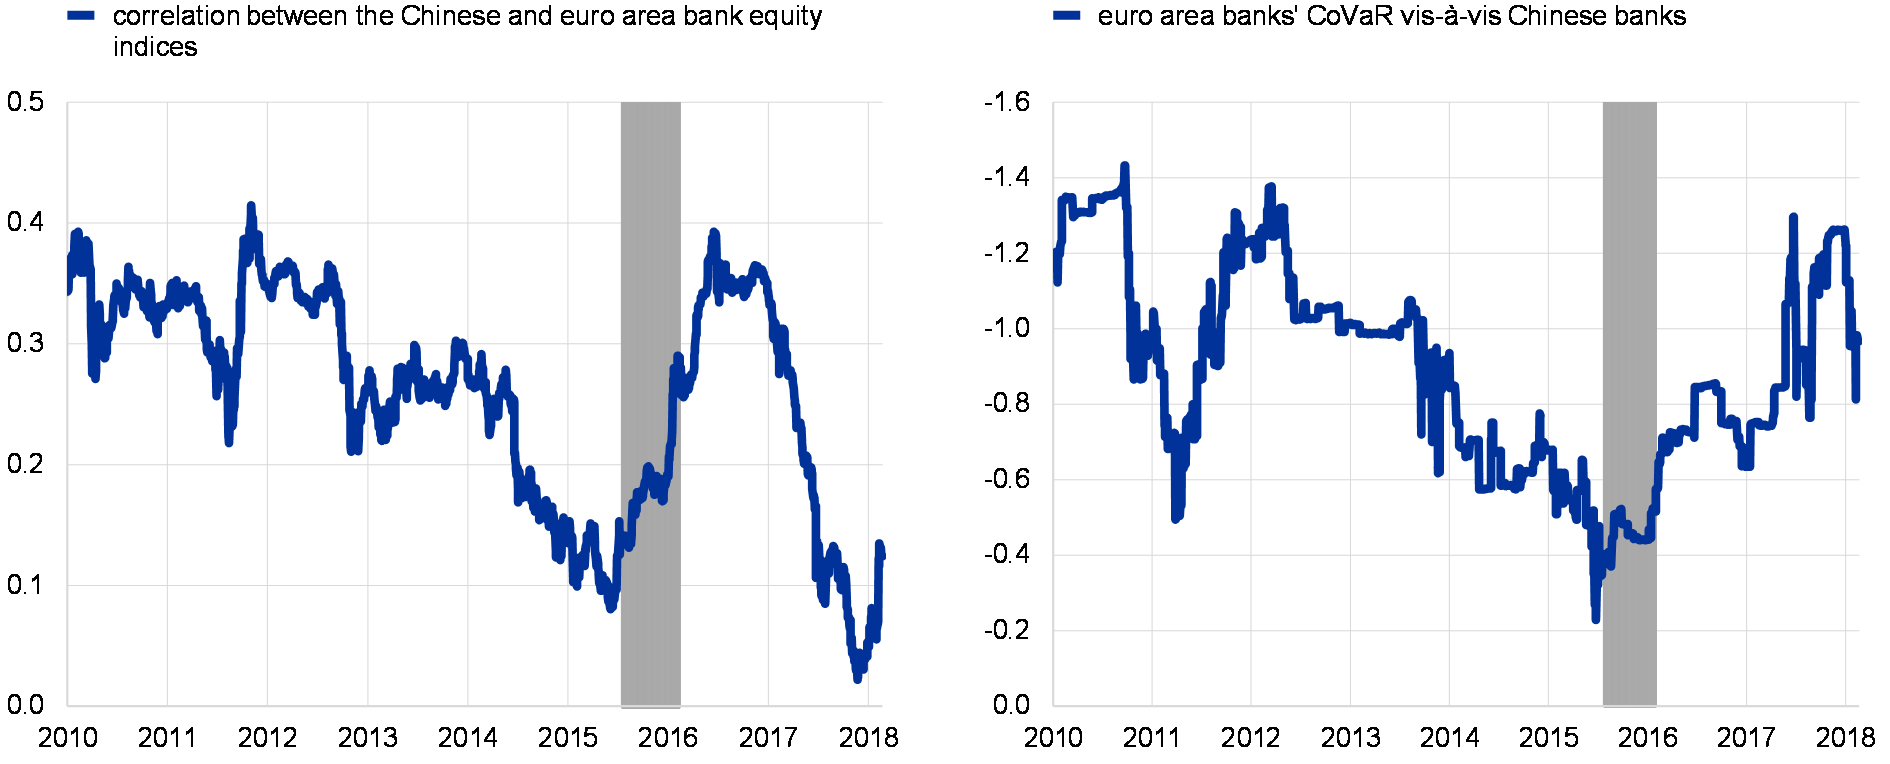
Sources: Thomson Reuters and ECB calculations.
Notes: Left panel: The line shows the rolling correlation coefficient over a 260-day window between the euro area and the Chinese (international) bank equity indices. The shaded area represents the Chinese equity market turmoil in the second half of 2015 and early 2016. Right panel: The CoVaR corresponds to the median price change in the euro area bank equity index in response to the materialisation of the 5% lower tail of the return distributions of six large Chinese banks: Bank of China, Bank of Communications, China CITIC Bank, China Construction Bank, China Merchants Bank, and Industrial and Commercial Bank of China. The CoVaR measure is computed on a two year rolling window of daily observations and reported in terms of standard deviations of the Chinese bank index. See Adrian, T. and Brunnermeier, M.K., “CoVaR ”, American Economic Review, Vol. 106(7), July 2016, pp 1705-41.
All in all, increased spillovers from Chinese banks may have heightened financial stability implications for euro area banks. Increased spillover risks are likely to be a reflection of the growing size and systemic importance of Chinese institutions. A further increase in the systemic footprint of Chinese banks and the ever-increasing interconnectedness of the Chinese financial system with the rest of the world may generate adverse repercussions for the global financial system, including in the euro area, in the event of any future episode of financial stress.
1.2 Benign macro-financial conditions conceal underlying sovereign vulnerabilities
Stress remained subdued in euro area sovereign debt markets. The composite indicator of systemic stress for euro area sovereign bond markets has continued to hover at low levels amid relatively narrow cross-country dispersion (see Chart 1.7). In terms of the underlying drivers, volatility in euro area sovereign bond markets has remained relatively low. At the same time, liquidity conditions in government bond markets (measured by bid-ask spreads) have remained favourable against the backdrop of the ECB’s public sector purchase programme, while sovereign credit risk has come down somewhat amid improving economic conditions, relatively low levels of political uncertainty and several sovereign rating upgrades (e.g. for Greece, Portugal and Spain).
Chart 1.7
Stress in euro area sovereign bond markets remained contained amid relatively low cross-country dispersion
Composite indicator of systemic stress in euro area sovereign bond markets
(Jan. 2004 – Apr. 2018)
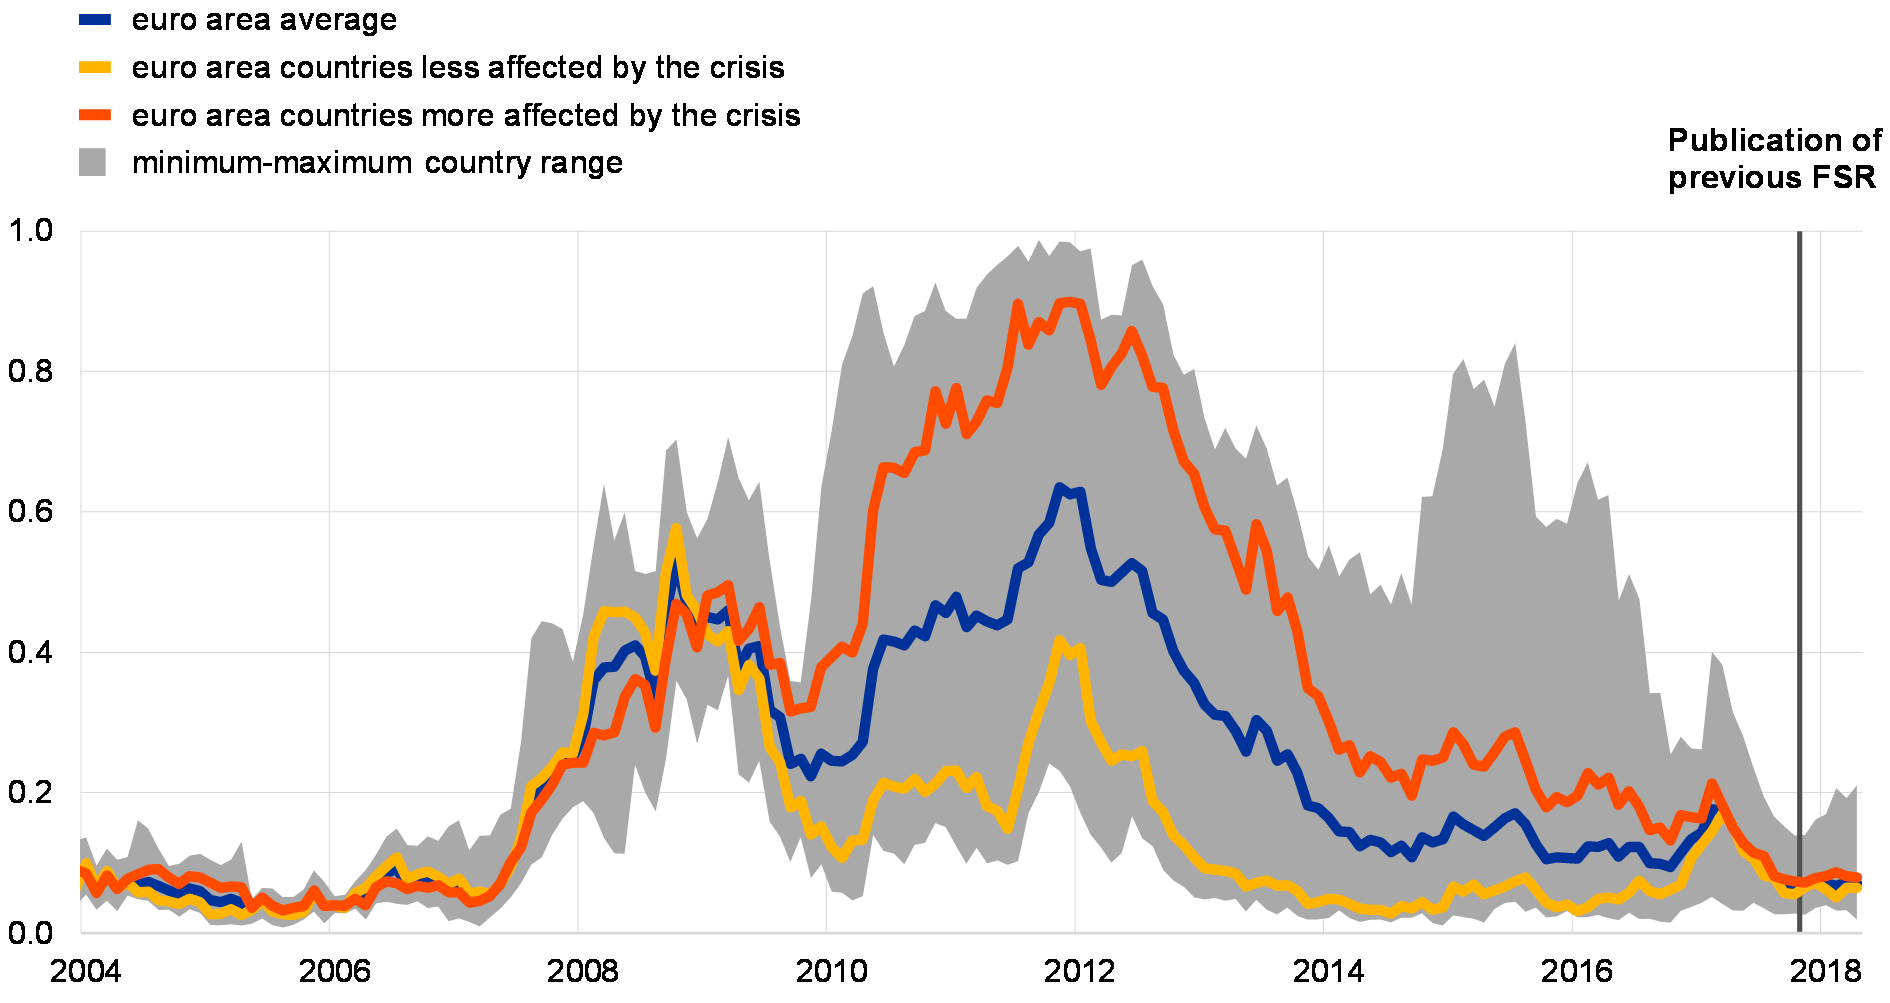
Sources: ECB and ECB calculations.
Notes: The SovCISS measures the level of stress in euro area sovereign bond markets. It is available for the euro area as a whole and for 11 euro area countries (Austria, Belgium, Finland, France, Germany, Greece, Ireland, Italy, the Netherlands, Portugal and Spain). Euro area countries more affected by the crisis comprise Greece, Ireland, Italy, Portugal and Spain, while euro area countries less affected by the crisis include Austria, Belgium, Finland, France, Germany and the Netherlands. The SovCISS combines data from the short end and the long end of the yield curve (two-year and ten-year bonds) for each country, i.e. two spreads between the sovereign yield and the euro swap interest rate (absolute spreads), two realised yield volatilities (the weekly average of absolute daily changes) and two bid-ask bond price spreads (as a percentage of the mid-price). The aggregation into country-specific and euro area aggregate SovCISS is based on time-varying cross-correlations between all homogenised individual stress indicators pertaining to each SovCISS variant following the CISS methodology developed in Hollo, D., Kremer, M. and Lo Duca, M., “CISS – a composite indicator of systemic stress in the financial system”, Working Paper Series, No 1426, ECB, March 2012.
While headline fiscal balances continue to improve, underlying fiscal efforts are waning. The aggregate euro area headline fiscal deficit has improved from 1.5% of GDP in 2016 to 0.9% of GDP in 2017, with only one country (Spain) above the Maastricht Treaty threshold of 3% of GDP. According to European Commission projections, the euro area headline balance is set to improve further over the 2018-19 horizon, albeit at a more moderate pace than in previous years. The improvement is, however, expected to be driven mainly by favourable cyclical conditions and, to a lesser extent, by lower interest expenditures. The underlying structural fiscal stance in the euro area is expected to remain broadly neutral in 2018-19, but several countries are expected to loosen policies slightly. Indeed, a deterioration of structural balances is projected in most euro area countries that were more affected by the crisis. Several highly indebted countries are at risk of non-compliance with the structural fiscal efforts envisaged in the rules of the Stability and Growth Pact (i.e. Belgium, France, Italy and Portugal). Structural reform efforts have also lost momentum, and there is still a need to achieve a more growth-friendly composition of public finances across the euro area. Overall, the reliance of the projected improvement in fiscal balances on cyclical conditions renders the fiscal outlook – and by extension the market sentiment towards some euro area sovereign issuers – very sensitive to changes in the growth environment.
Government debt sustainability concerns remain despite signs of improvement. The euro area aggregate government debt-to-GDP ratio has been on a downward path since the peak in 2014 and dropped to 86.7% in 2017, mainly driven by developments in euro area countries with low and medium levels of debt (see Chart 1.8). The decomposition of the change in public debt levels suggests that all country groups have benefited from favourable cyclical conditions (denominator effect, labelled “GDP contribution” in the chart). However, in highly indebted euro area countries the stock of debt (numerator effect, labelled “debt contribution” in the chart) has continued to increase. Looking ahead, the aggregate indebtedness of the general government sectors in the euro area is projected by the European Commission to decline further to 84.1% of GDP by 2019. All euro area countries are projected to see a further decrease or stabilisation in their government debt ratios over the 2018-19 horizon underpinned by projected primary surpluses (except for France and Latvia) and a negative interest rate-growth differential (except for Italy). Such negative interest rate-growth differentials may, however, reverse and render highly indebted sovereigns more vulnerable to a prospective normalisation of interest rates and/or a possible worsening of economic conditions.
Chart 1.8
Highly indebted euro area countries are not taking advantage of the favourable economic conditions to reduce high public debt levels
Sovereign indebtedness in the euro area and underlying contributing factors
(percentage of GDP, percentage point contributions)
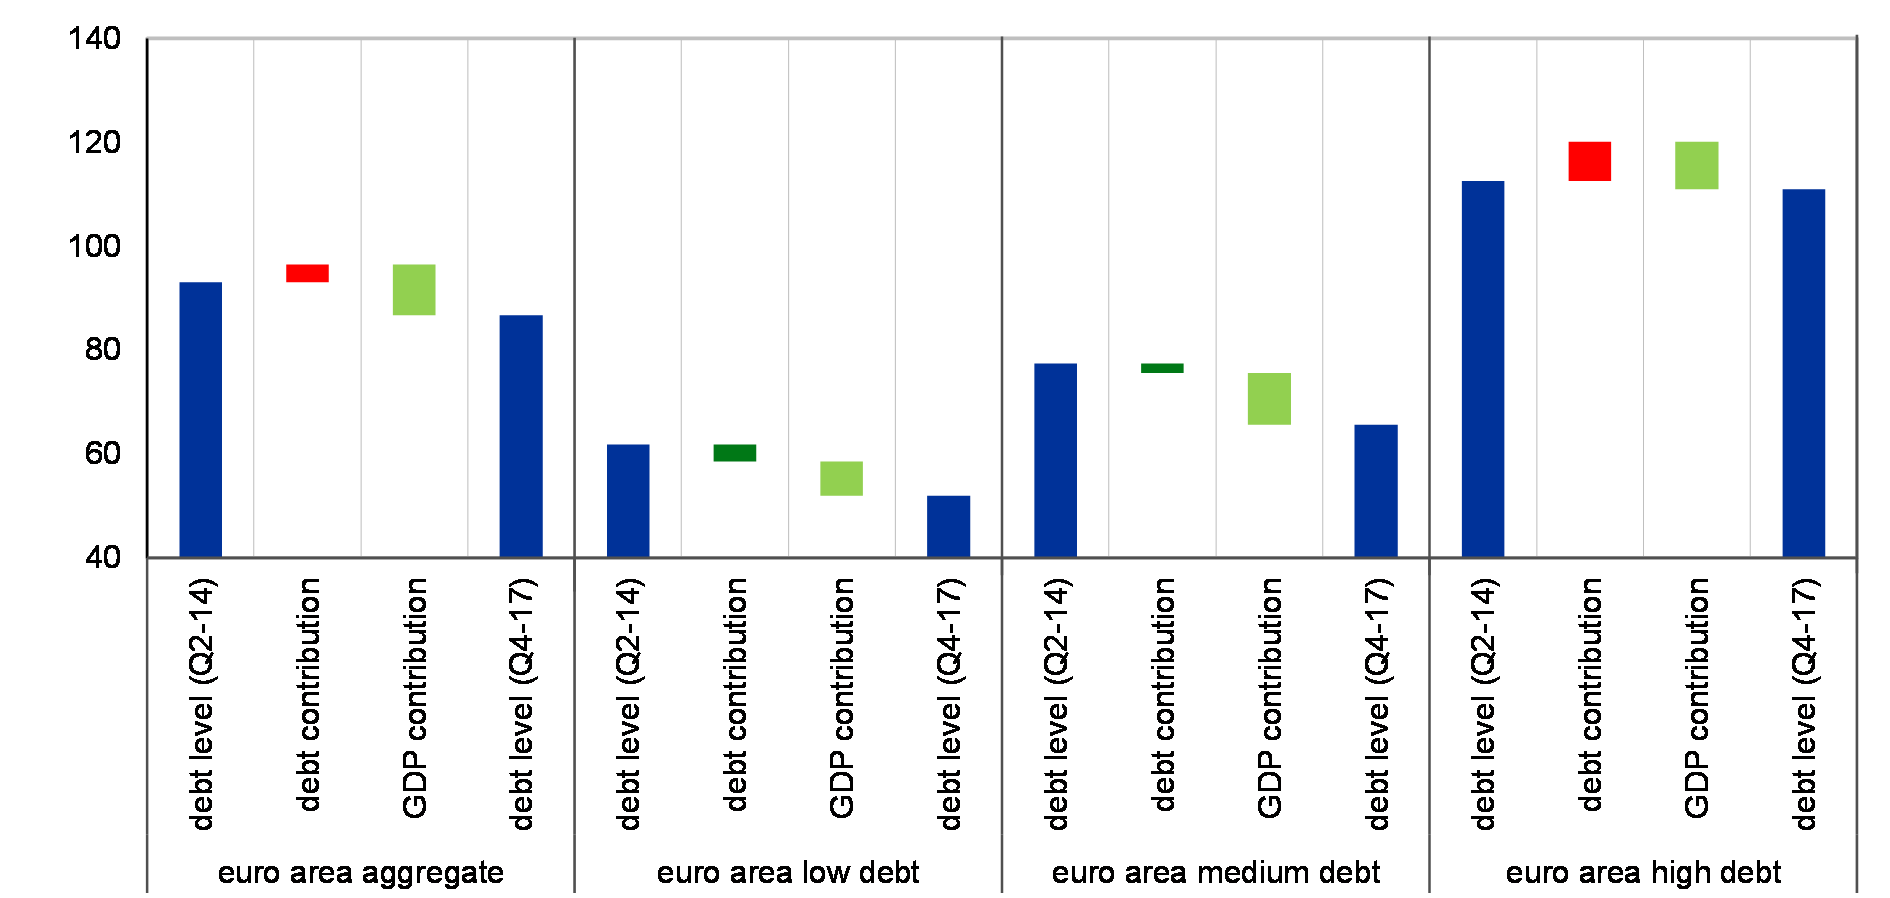
Sources: ECB (Government Finance Statistics) and ECB calculations.
Notes: The “low debt” category covers euro area countries with public debt levels below 60% of GDP (i.e. Estonia, Latvia, Lithuania, Luxembourg, Malta, the Netherlands and Slovakia) as at year-end 2017. Countries with public debt levels of between 60% and 90% of GDP (i.e. Austria, Finland, Germany, Ireland and Slovenia) are labelled “medium debt” countries, while countries with debt levels of over 90% (i.e. Belgium, Cyprus, France, Greece, Italy, Portugal and Spain) are referred to as “high debt” countries.
Relatively favourable sovereign financing conditions currently mitigate rollover risks. Pricing conditions have remained benign for euro area sovereigns against the backdrop of ongoing Eurosystem asset purchases. Moreover, the current low-yield environment continues to encourage strong issuance activity at long maturities, which results in a further increase of the average residual maturity of outstanding euro area government debt securities (see Chart 1.9 – left panel). As a result, the debt servicing obligations of euro area sovereigns have declined, but remain high for several – in particular the most highly indebted – euro area countries (see Chart 1.9 – right panel). This may suggest possible rollover risks in terms of both the availability and the cost of funding in the event of a reassessment of sovereign risk by market participants.
Chart 1.9
The shift of issuance activity towards long maturities continued, but debt servicing needs remain substantial for several euro area countries, highlighting rollover risks
Net issuance of government debt securities by original maturity (left panel) and total debt servicing needs due in two years (right panel)
(left panel: 2010-18, € billions, years; right panel: Mar. 2018, percentage of GDP)
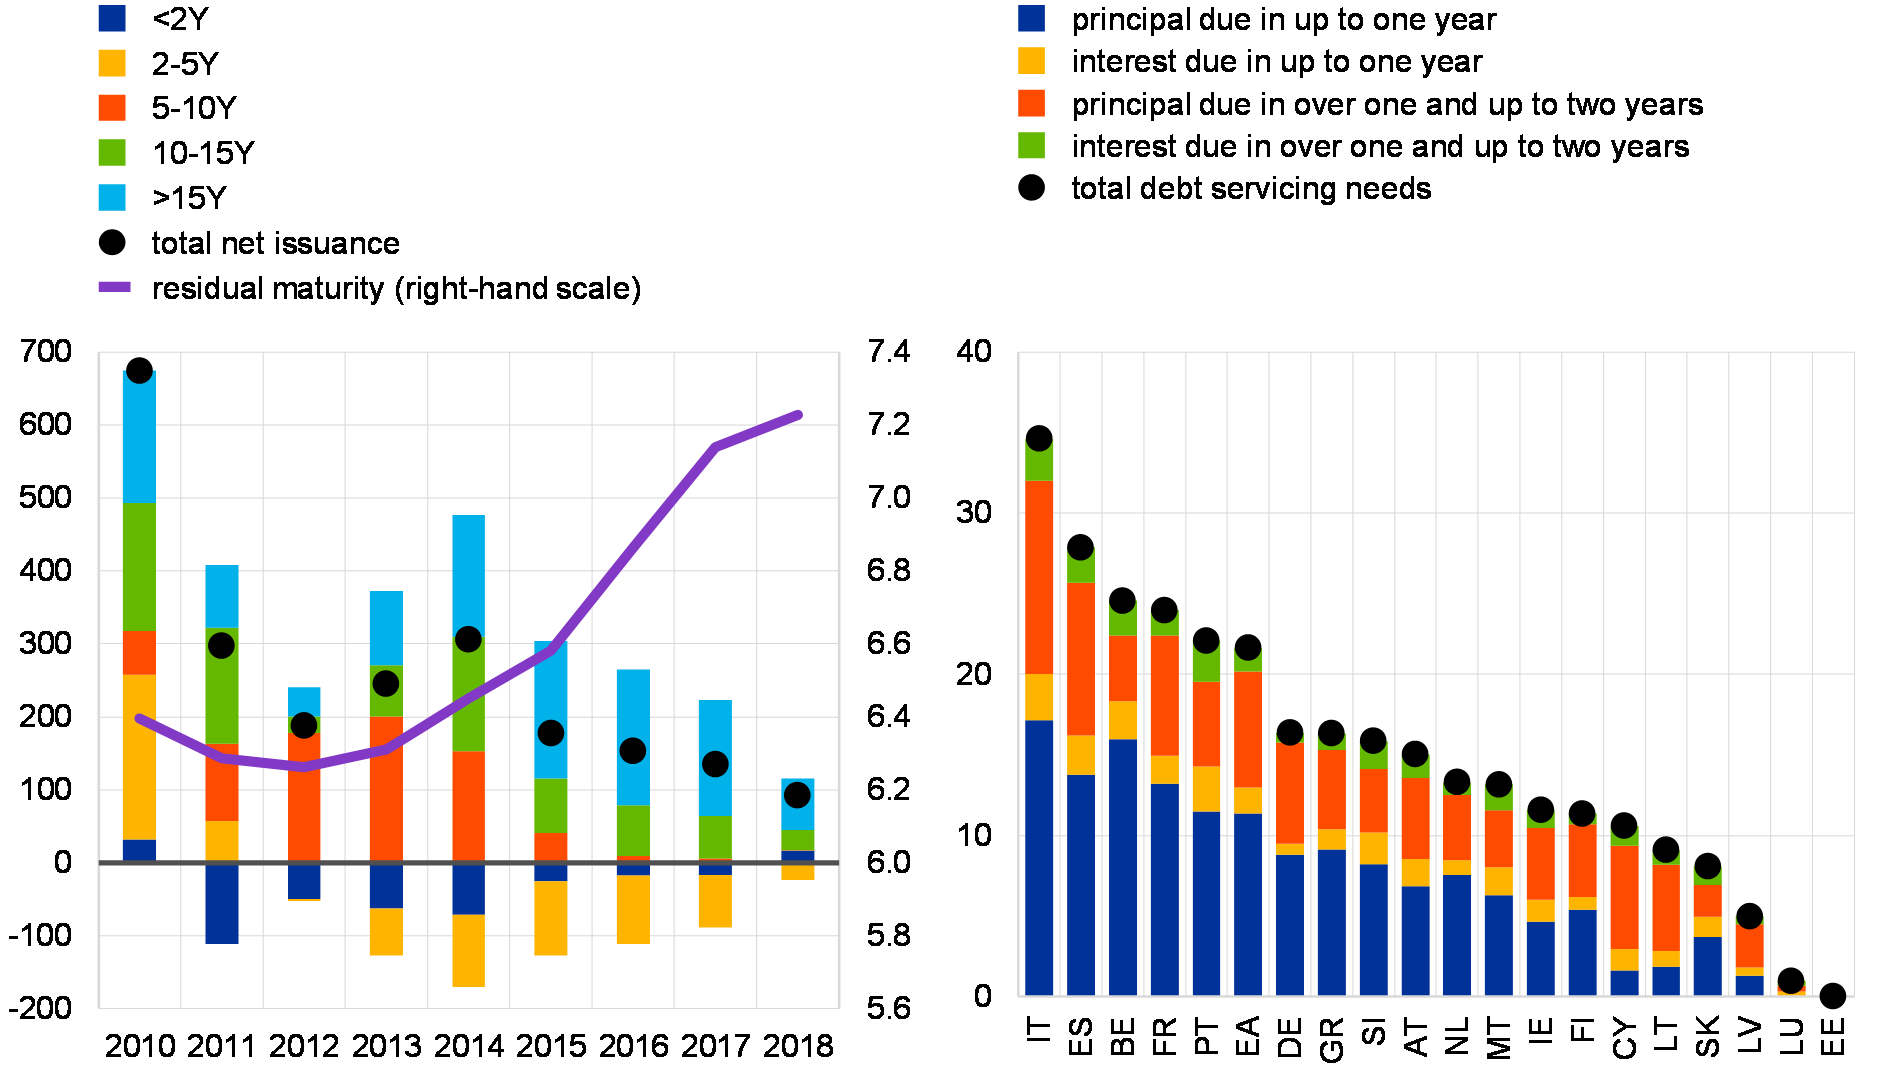
Sources: ECB and ECB calculations.
Note: Left panel: Figures for 2018 cover data up to March 2018.
The implications of the vulnerabilities identified above can be illustrated with stylised scenarios. The baseline improvements in primary balances rely either on the continuation of favourable cyclical conditions or on additional adjustments in fiscal policy to maintain those balances. If these fail to materialise, this will not only lead to a deterioration in fiscal balances, it will also affect debt dynamics. In some of the scenarios, a two percentage point increase in interest rates is simulated. This is a quite unlikely eventuality over the simulation horizon, which is used only to simulate stressed conditions. The simulation results for highly indebted euro area countries suggest that such an interest rate shock would be particularly destabilising in the absence of additional fiscal consolidation efforts (see Chart 1.10 – left panel). Sensitivity analyses also indicate that a one percentage point shock to potential GDP growth – which is also an unlikely outcome – would have the largest potential to reverse the downward trend in public debt levels in highly indebted euro area countries (see Chart 1.10 – right panel). A combined macro, fiscal and interest rate shock would put the debt ratio on a clearly unsustainable path in highly indebted euro area countries.
Chart 1.10
An interest rate shock under a no fiscal policy change scenario or a combined macro, fiscal and interest rate shock would put the general government debt ratio on a clearly unsustainable path in highly indebted euro area countries
Scenario (left panel) and sensitivity (right panel) analyses for highly indebted euro area countries
(2015-27, percentage of GDP)
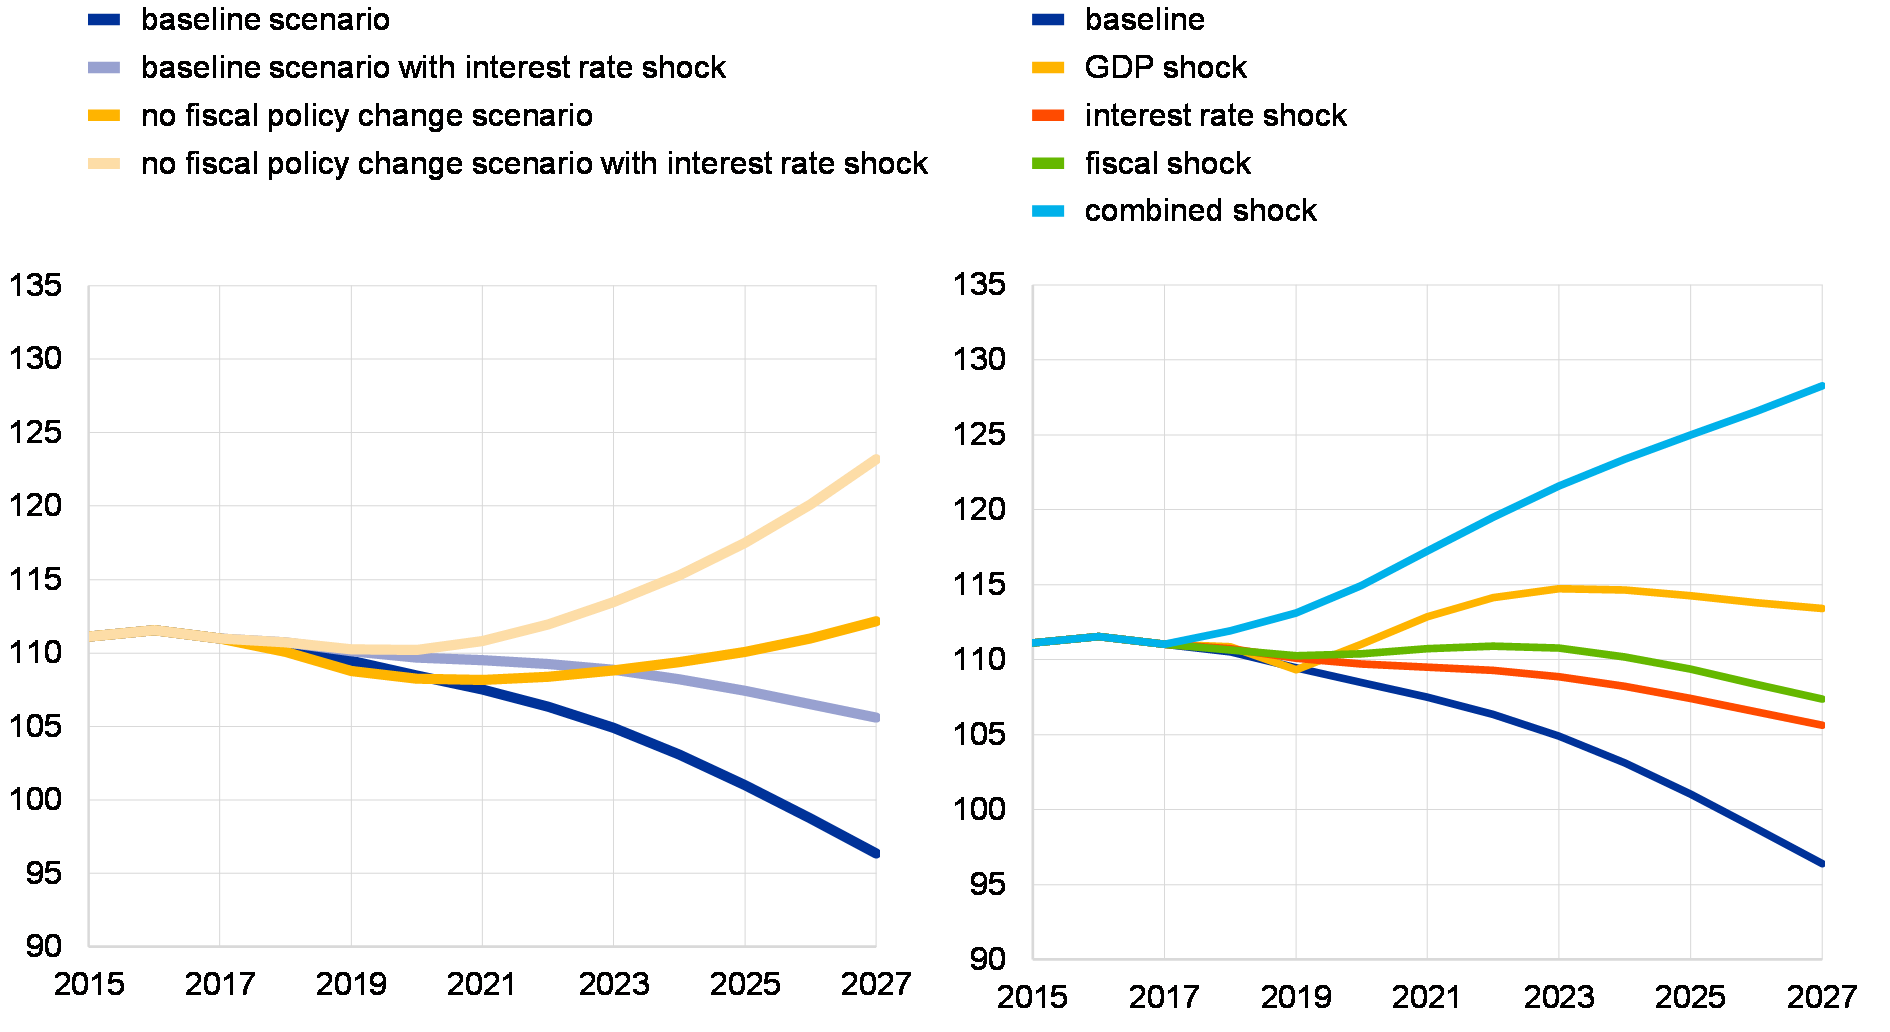
Sources: European Commission and ECB calculations.
Notes: Euro area countries with government debt-to-GDP ratios of over 90% of GDP (i.e. Belgium, Cyprus, France, Greece, Italy, Portugal and Spain) are considered as highly indebted. Left panel: In the baseline scenario, countries whose structural fiscal position is below (above) the medium-term objective (MTO) are assumed to undertake additional consolidation (stimulus) to converge to the MTO. In the no fiscal policy change scenario, no additional fiscal consolidation (stimulus) is assumed compared with what is implied by the European Commission’s spring 2018 economic forecast. For these countries (i.e. with a structural balance below their MTO) this represents an adverse shock. An interest rate shock of +200 basis points is applied in each of the two scenarios as of 2018. To separate the effect of the shock, in the baseline scenario with interest rate shock, no additional consolidation to account for the higher interest expenditure (normally required under the SGP) is considered. Right panel: A one percentage point standard shock on potential GDP growth (permanent shock) and the structural primary balance, respectively, is considered. The interest rate shock of +200 basis points is the same as in the scenario analysis. The combined shock captures the simultaneous impact of the three individual shocks.
In sum, sovereign risks appear to have declined slightly owing to improved economic conditions, but concerns remain given persistent underlying vulnerabilities. Sovereign debt dynamics continue to benefit from the ongoing cyclical upturn and very favourable financing conditions in terms of both pricing and duration. However, public finances remain fragile in a number of countries. Going forward, higher long-term interest rates as a result of a sudden sovereign risk repricing, deteriorating macroeconomic conditions or waning structural and fiscal reform efforts may represent a challenge to public finances. The materialisation of any of these vulnerabilities – particularly in combination – may renew concerns regarding public debt sustainability in the more vulnerable euro area countries.
1.3 Cyclical tailwinds support household fundamentals
Euro area household income continued to strengthen amid improving cyclical conditions. Households’ nominal disposable income growth is primarily being bolstered by improving labour market conditions (see Chart 1.11) and the related robust growth in labour income. To a lesser extent, it is also being supported by favourable profit and property income developments. Although higher inflation outturns have somewhat contained household real income growth in 2017, it continued to expand at above long-term average rates. Going forward, the expected further improvement in euro area labour markets bodes well for further alleviating households’ income risks.
Chart 1.11
Improving labour market conditions suggest lower income risks for euro area households
Unemployment rate and monthly change in the number of unemployed
(Jan. 2006 – Mar. 2018, percentages, number in thousands, three-month moving averages)
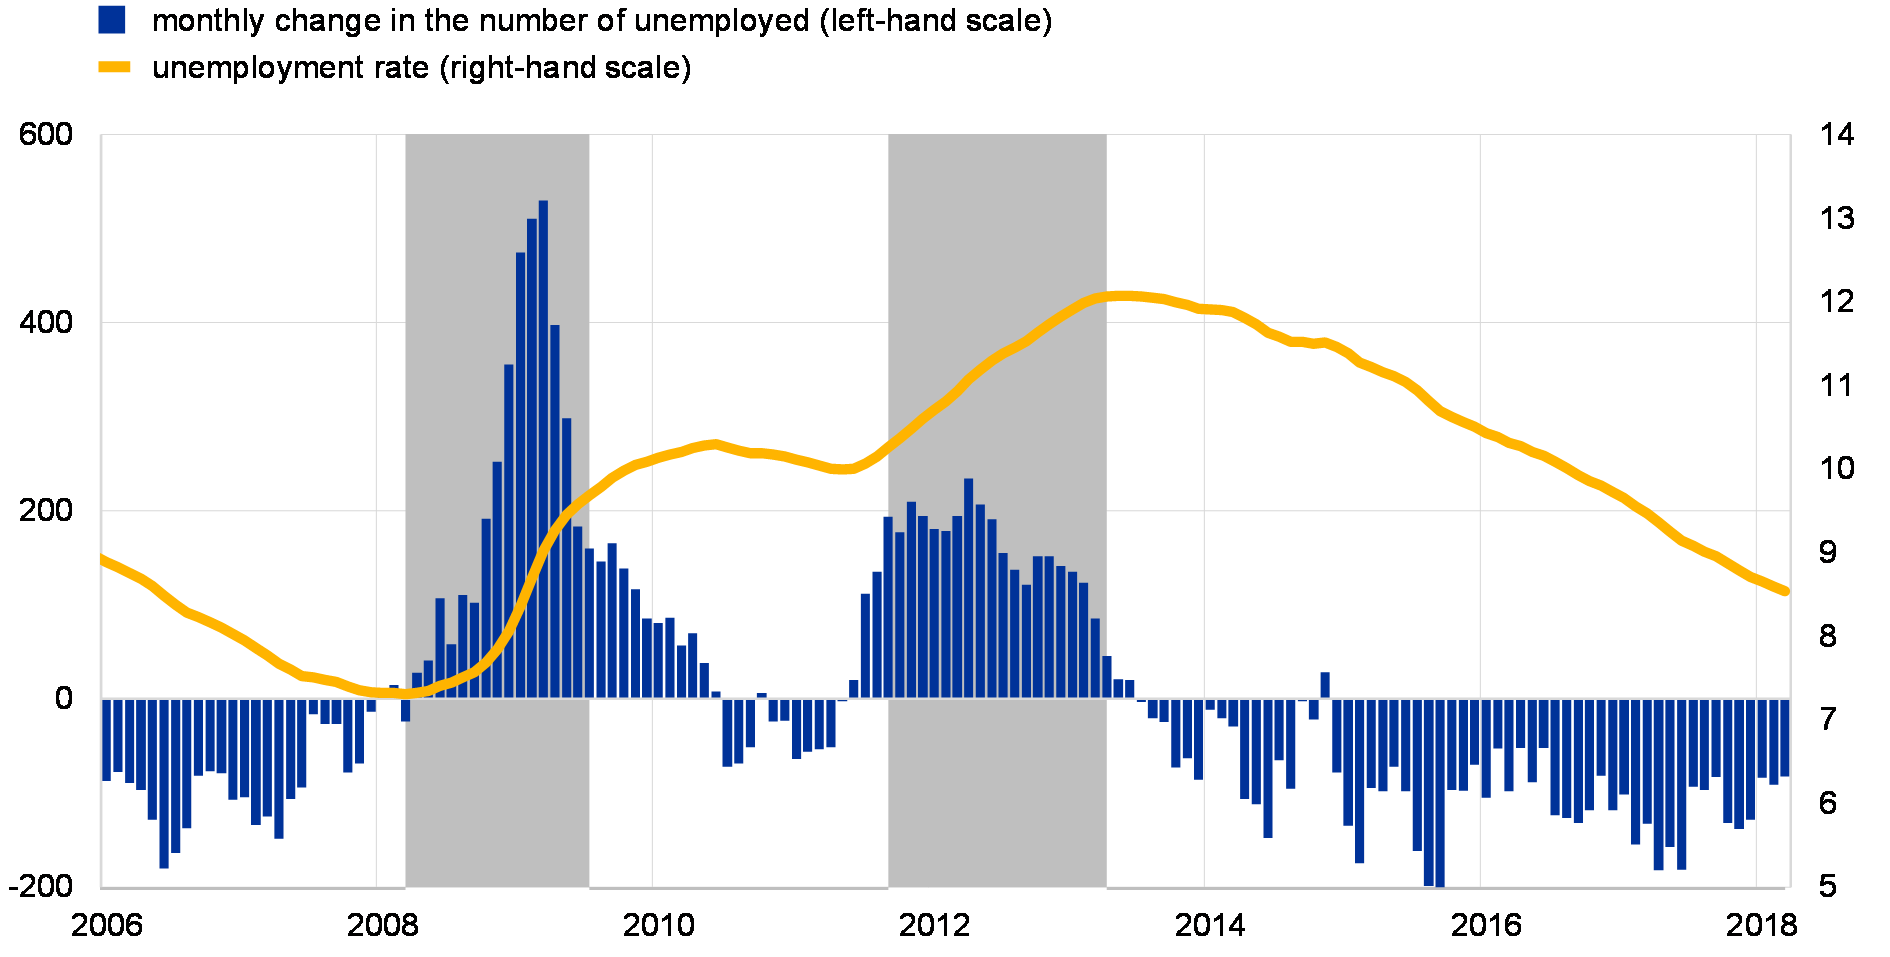
Sources: Eurostat, ECB and ECB calculations.
Note: The grey shaded areas indicate euro area recessions as determined by the CEPR Euro Area Business Cycle Dating Committee.
The net worth of euro area households has improved further, chiefly driven by the continued rise in euro area house prices. Strong valuation gains on real estate holdings, together with capital gains on direct equity and mutual fund holdings, continued to boost households’ net worth. In fact, owing to leverage, even small changes in house prices can have marked effects on households’ net worth relative to their income (see Chart 1.12). This could render households’ financial positions very sensitive to sudden corrections in housing markets, which is particularly relevant in countries with overvalued property markets (see Chapter 2).
Chart 1.12
Rising euro area house prices have favourable wealth effects
Euro area house price growth and change in net worth due to flows in non-financial assets
(Q1 2000 – Q4 2017, annual percentage changes, percentage of gross annual income)
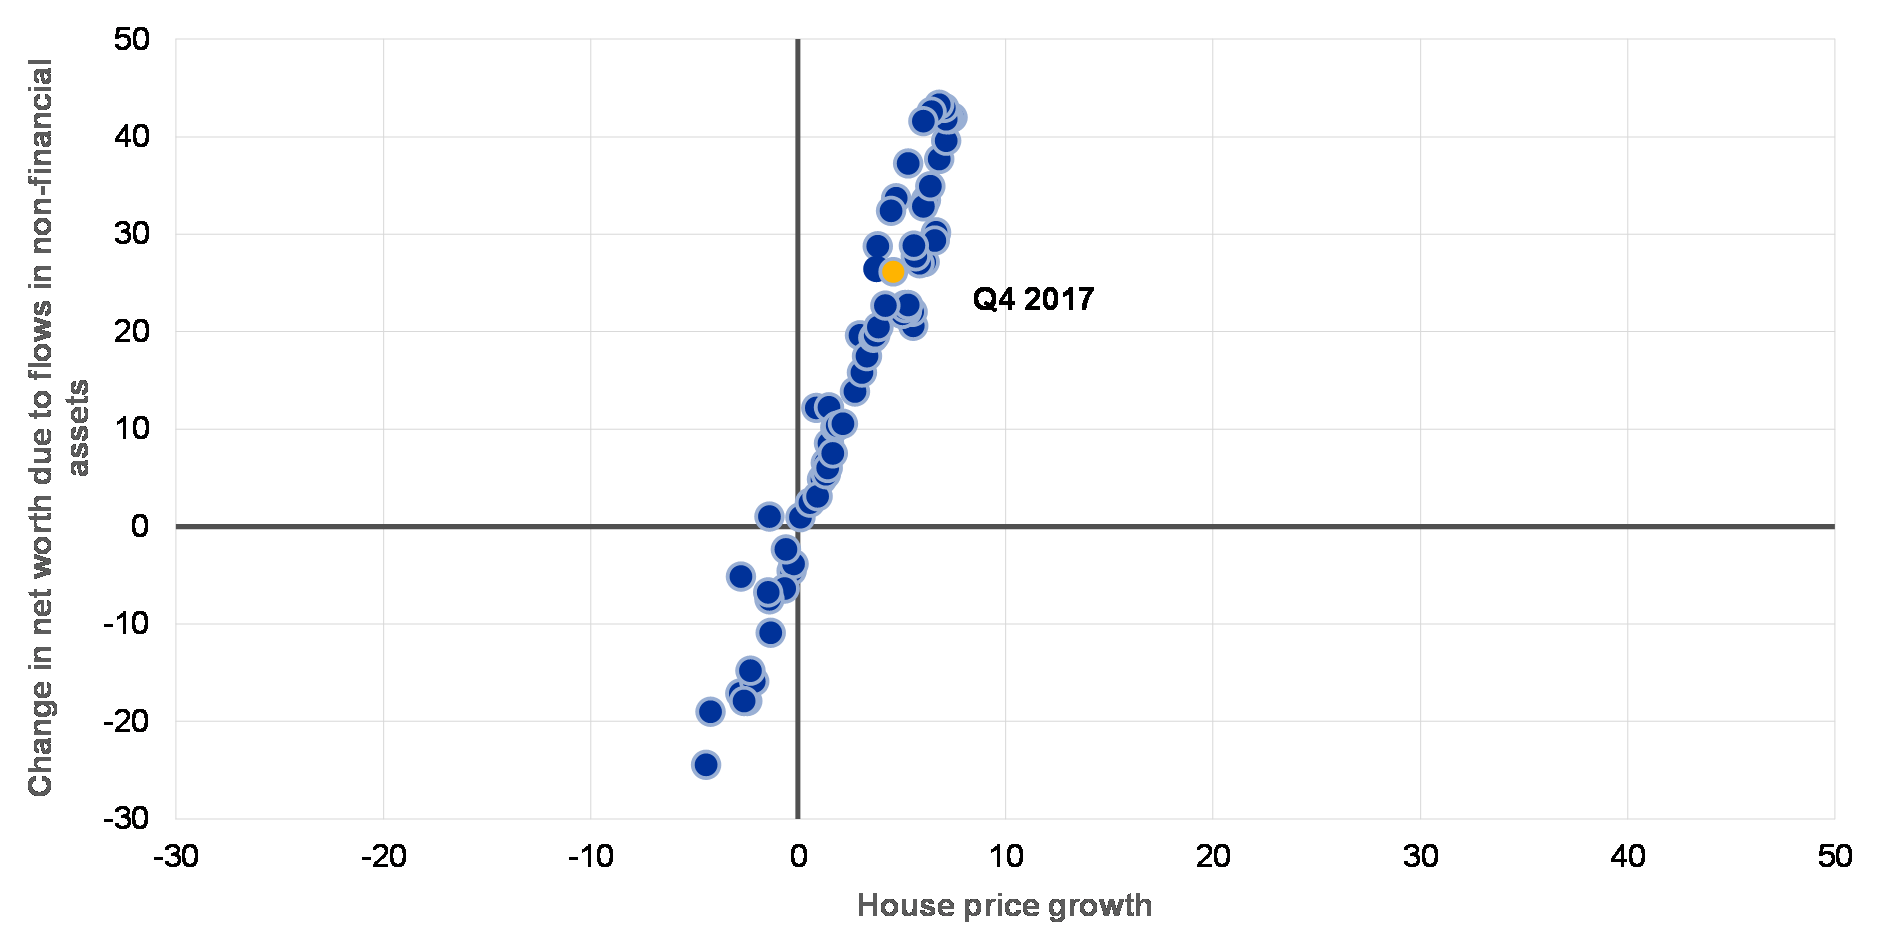
Sources: Eurostat, ECB and ECB calculations.
Notes: Changes in net worth due to flows in non-financial assets are four-quarter moving sums. Flows in non-financial assets mainly include holding gains and losses on real estate (including land).
The indebtedness of euro area households has stabilised at the levels that prevailed before the financial crisis, but vulnerabilities remain at the country level. On aggregate, the indebtedness of euro area households has decreased from the 64% of GDP peak in 2009 to 58.1% of GDP at the end of 2017 – a level last seen in mid-2006. While this figure is not particularly high by international standards, it is still somewhat above the benchmark level of 53% of GDP associated with a debt overhang (see Chart 1.13). The euro area aggregate continues to mask marked cross-country heterogeneity. In the euro area countries that experienced major housing market corrections in the aftermath of the crisis, household indebtedness has declined in recent years driven by loan repayments and/or debt write-offs, while remaining above the aggregate euro area level. In some countries, however, household indebtedness has continued to inch up from elevated levels (e.g. Belgium, Finland, France and Luxembourg).
Chart 1.13
Elevated and rising household debt may represent a cause for concern in some euro area countries
Household indebtedness across the euro area
(Q4 2017, percentage of GDP, percentage point change in the debt-to-GDP ratio)
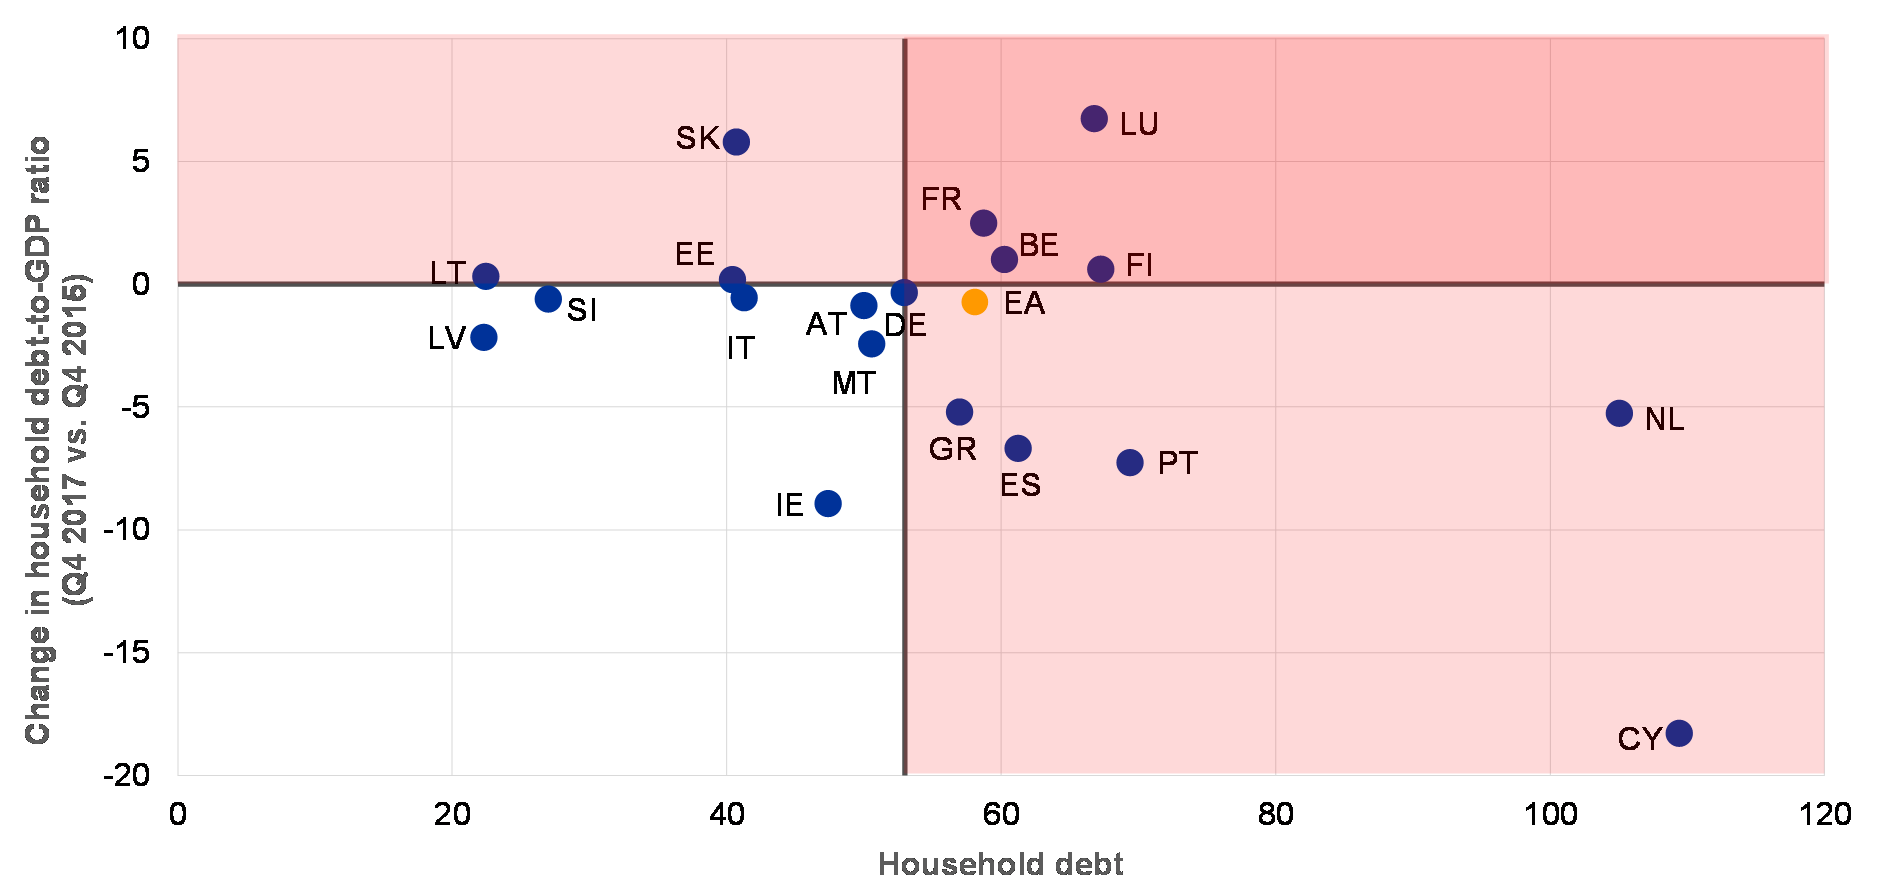
Sources: ECB euro area accounts and ECB calculations.
Notes: The red vertical line represents the estimated macroeconomic imbalance procedure (MIP) benchmark of 53% of GDP for household debt. The 133% of GDP MIP benchmark for fully consolidated non-financial private sector debt is split between households and firms based on their average past shares in the stock of non-financial private debt. In the case of Ireland, GDP may not be the most representative scaling variable given the activities of foreign-owned multinational enterprises resident in the country. Alternative metrics that are more related to the domestic economy, such as the Modified Gross National Income (GNI*) or Modified Domestic Demand, would yield considerably higher levels of households indebtedness.
The low interest rate environment alleviates debt sustainability concerns. Continued high household debt levels suggest additional deleveraging needs in some countries, even if gradually improving income positions coupled with record low interest payment burdens currently buttress households’ debt servicing capacity. The low interest rate environment has encouraged a shift towards longer rate fixation periods across countries (see Chart 1.14). However, especially in the event of an interest rate shock without a commensurate boost to household income, more vulnerable households might be challenged in countries where loans at floating rates or rates with rather short fixation periods predominate. Further balance sheet repair in countries with elevated levels of household debt should help mitigate the risks related to an eventual normalisation of interest rates and the ensuing rise in debt servicing costs.
Chart 1.14
The low interest rate environment has encouraged a shift towards longer rate fixation periods in most euro area countries
Share of new loans to households at a floating rate and with an interest rate fixation period of up to one year in total new loans
(percentages)
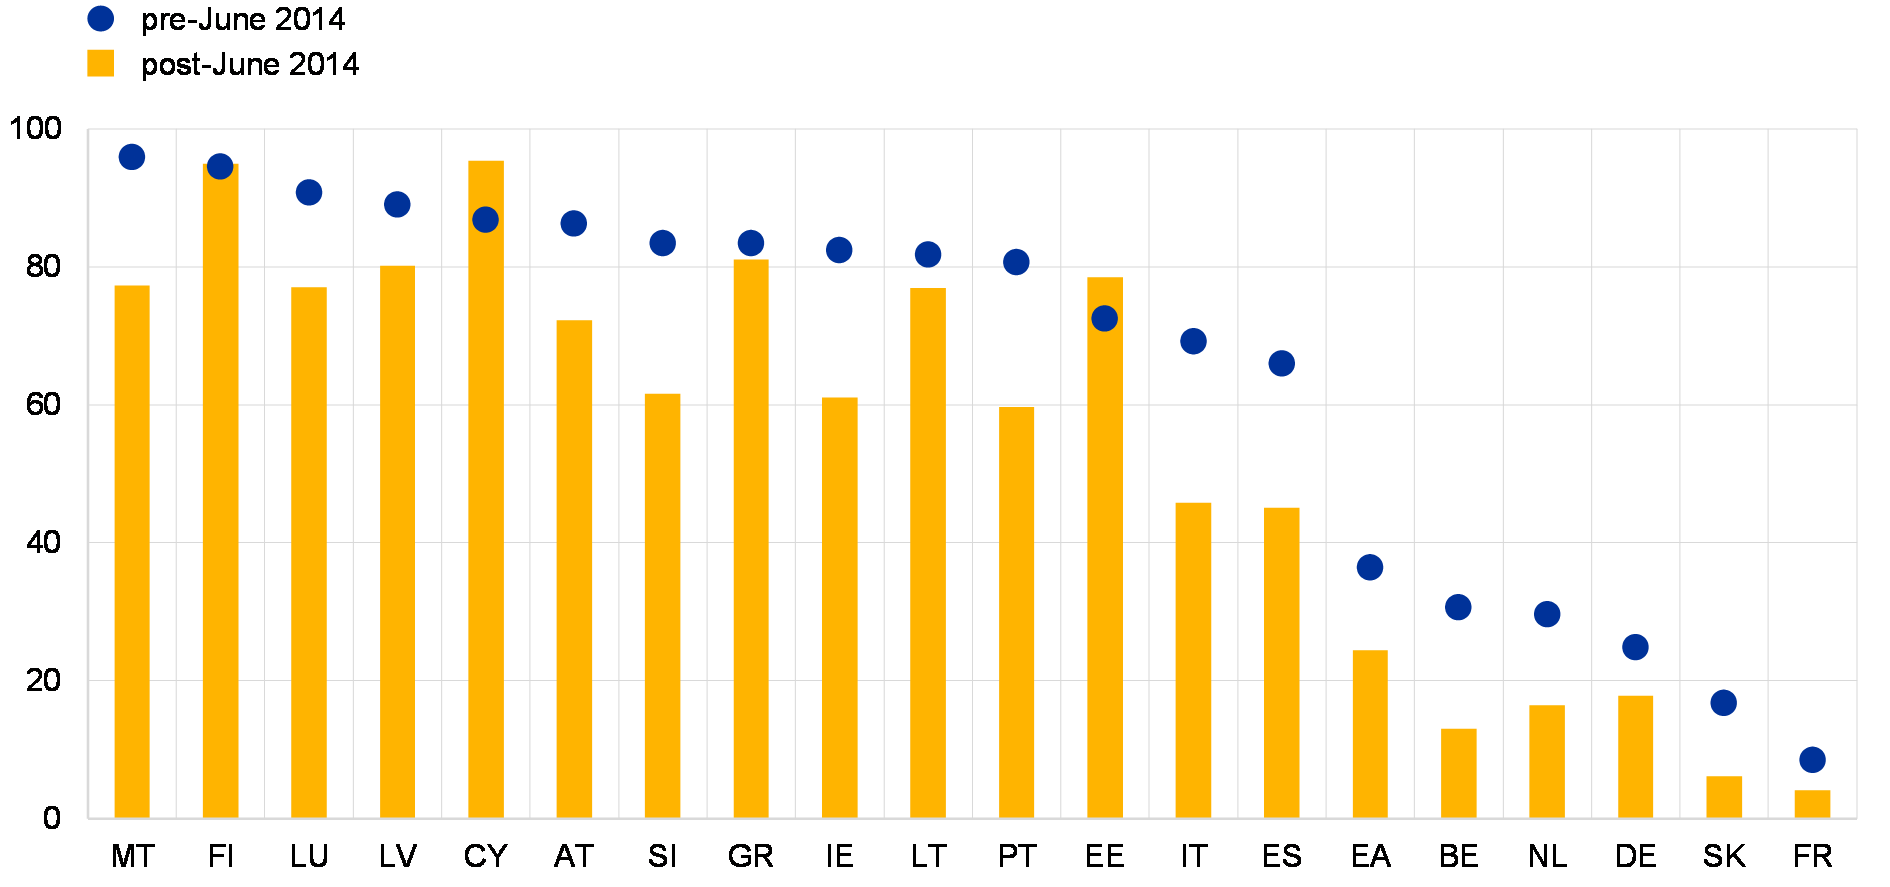
Sources: ECB (MIR statistics) and ECB calculations.
Notes: Loans to households comprise loans for house purchase, consumer lending and other lending. The pre-June 2014 period covers the 3.5 years before the introduction of the negative interest rates and the targeted longer-term refinancing operations by the Eurosystem, while the post-June 2014 period covers the time frame thereafter.
Credit market conditions are improving further in terms of both supply and demand. Credit standards continued to ease for both loans for house purchase and consumer credit (see Chart 1.15 – left panel), driven primarily by increased competitive pressures and banks’ lower risk perceptions. The rejection rates for housing and, even more so, consumer loans have decreased, pointing to a more forthcoming credit attitude on the part of banks. On the demand side, the recovery in housing and consumer lending is mainly supported by historically low bank lending rates in almost all household lending categories (see Chart 1.15 – middle panel). At the same time, strong consumer confidence, favourable housing market prospects and increased financing needs for spending on durable consumer goods also continued to underpin increased demand for household loans.
Chart 1.15
Favourable demand and supply conditions as well as record low interest rates support the recovery of bank lending to euro area households
Credit standards and demand for household loans by type of credit, household lending rates by type of lending, and annual growth in loans for house purchase and consumer lending
(left panel: Q1 2011 – Q2 2018, weighted net percentages; middle panel: Jan. 2011 – Mar. 2018, percentages; right panel: Q4 2017, annual percentage changes)
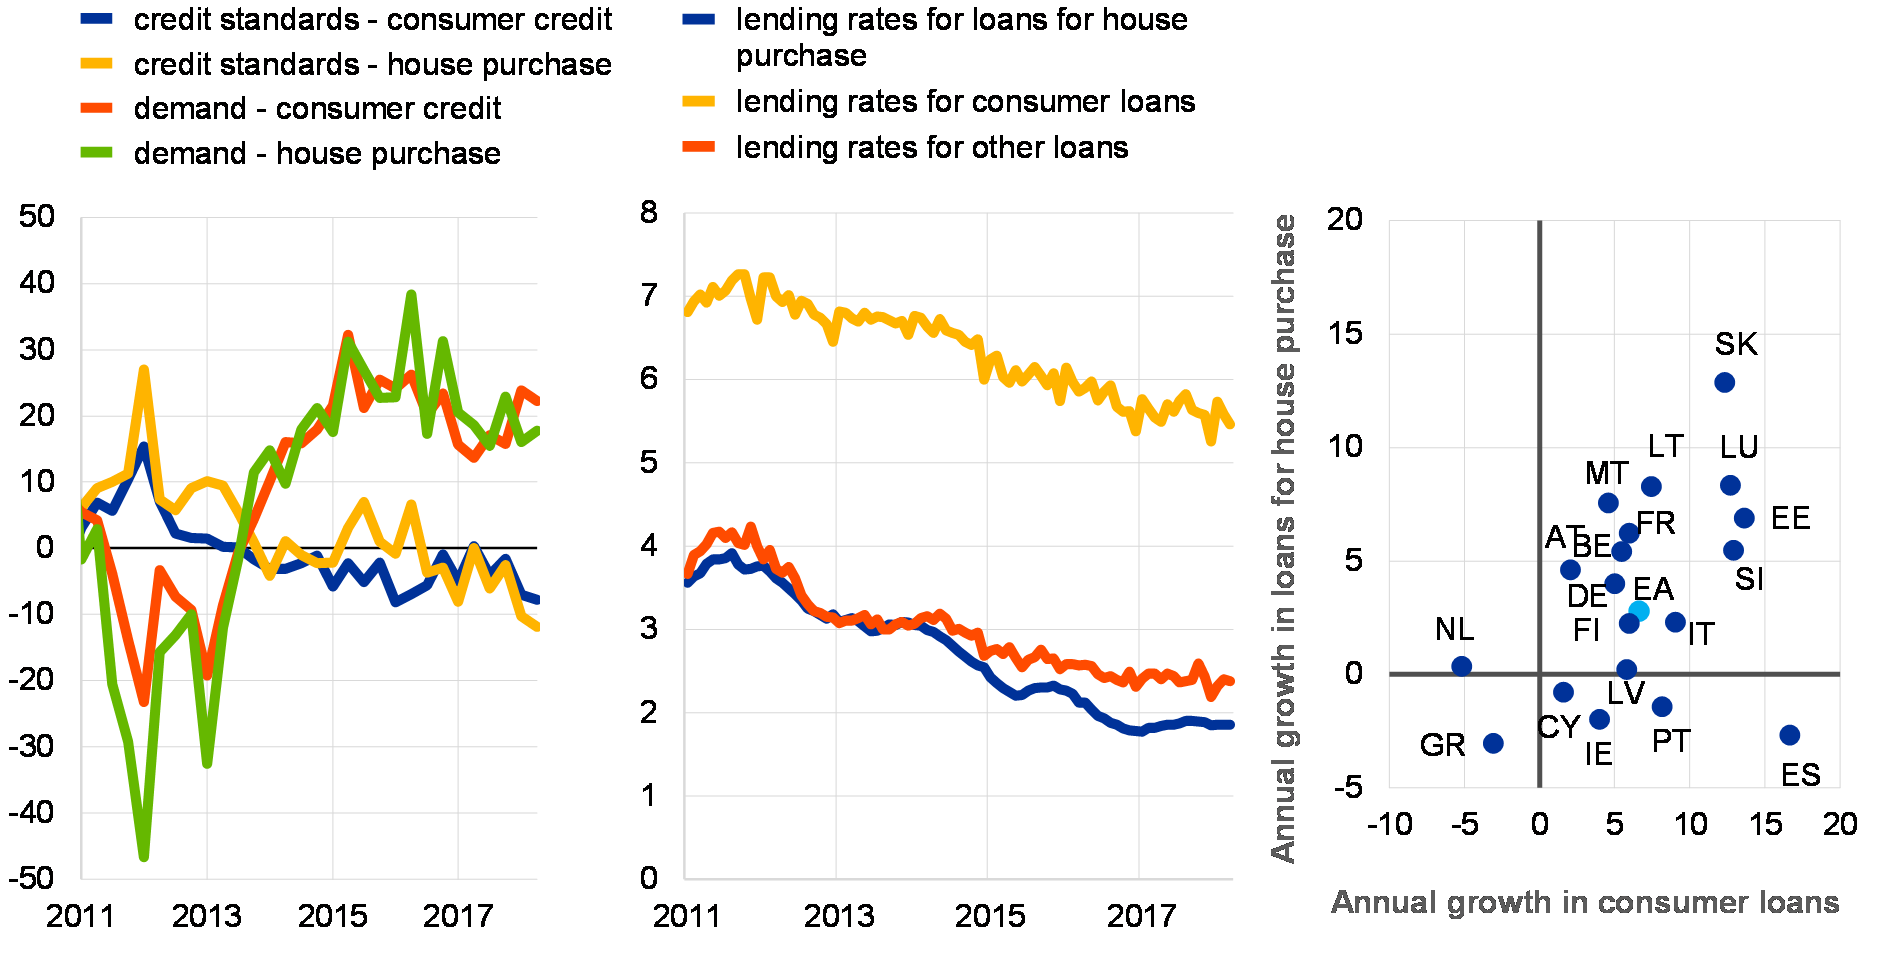
Sources: European Commission and ECB calculations.
Notes: Left panel: A negative (positive) number for credit standards represents an easing (tightening). Right panel: Loans are adjusted for loan sales and securitisations.
Lending flows to households have continued to recover, but the underlying dynamics continue to diverge across lending types and countries. At the aggregate euro area level, the recovery in household lending has continued gradually, broadly reflecting the overall dynamics of lending for house purchase. Consumer credit, however, has continued to expand at a brisker pace. The rapid pace of consumer loan expansion is not an immediate source of concern from a financial stability perspective though, given the relatively small share of consumer loans in total household loans for the euro area as a whole. Still, it may reflect increased risk-taking by banks due to higher margins in that business segment, and thus warrants monitoring going forward (see also Section 3.1). At the country level, consumer lending has expanded at double-digit rates in several euro area countries (see Chart 1.15 – right panel), albeit in some cases from a relatively low base. The pace of lending for house purchase tends to be strong or accelerating in many of the countries which weathered the crisis without major house price corrections. Depending on the state of the house price cycle, some euro area countries have already implemented macroprudential measures to ensure that the quality of new lending remains sound.
All in all, euro area households are benefiting from the cyclical upswing in euro area property markets and the real economy, but stock imbalances remain in some countries. The improving income position of euro area households coupled with continued favourable financing conditions are supporting households’ debt servicing capacity. However, a sudden rise in interest rates may spark renewed debt sustainability concerns in countries with elevated levels of household debt and where floating rate contracts prevail, while the recent buoyancy of certain types of bank lending in some euro area countries warrants monitoring.
1.4 Corporate debt sustainability concerns remain despite lower credit risks
Credit risks in the euro area non-financial corporate sector appear to have declined. Expected default frequency and distance-to-distress measures currently signal relatively low levels of balance sheet risk for the euro area non-financial corporate sector (see Chart 1.16 – left panel). This reflects the ongoing improvement in macroeconomic conditions and the low volatility environment prevailing in most asset classes, even after the equity market corrections in February this year. The improved creditworthiness of the corporate sector is also corroborated by lower earnings risks, as the broad-based economic growth across countries and sectors translates into gradually rising corporate profitability (see Chart 1.16 – right panel). Favourable order books and increased capacity utilisation coupled with still moderate pressures from cost-push factors, such as higher wages and interest rates, bode well for further improvements in corporate profitability. That said, a sudden deterioration in economic growth prospects or a cost shock could undermine corporate profitability, while increased trade protectionism may hamper the profit-generating capacity of export-oriented firms. Also, high commercial real estate valuations may challenge the profitability of firms exposed to this market either directly or indirectly (see Chapter 2 and Box 2).
Chart 1.16
Market price-based measures of corporate balance sheet risks show clear improvement, as earnings risks subside amid gradually rising corporate profitability
Distance to distress and expected default frequencies for euro area NFCs (left panel), as well as gross and net operating surplus of euro area NFCs (right panel)
(left panel: Jan. 2004 – Mar. 2018, percentages, averages, weighted by total assets; right panel: Q1 2007 – Q4 2017, percentage of net value added, annual percentage changes)
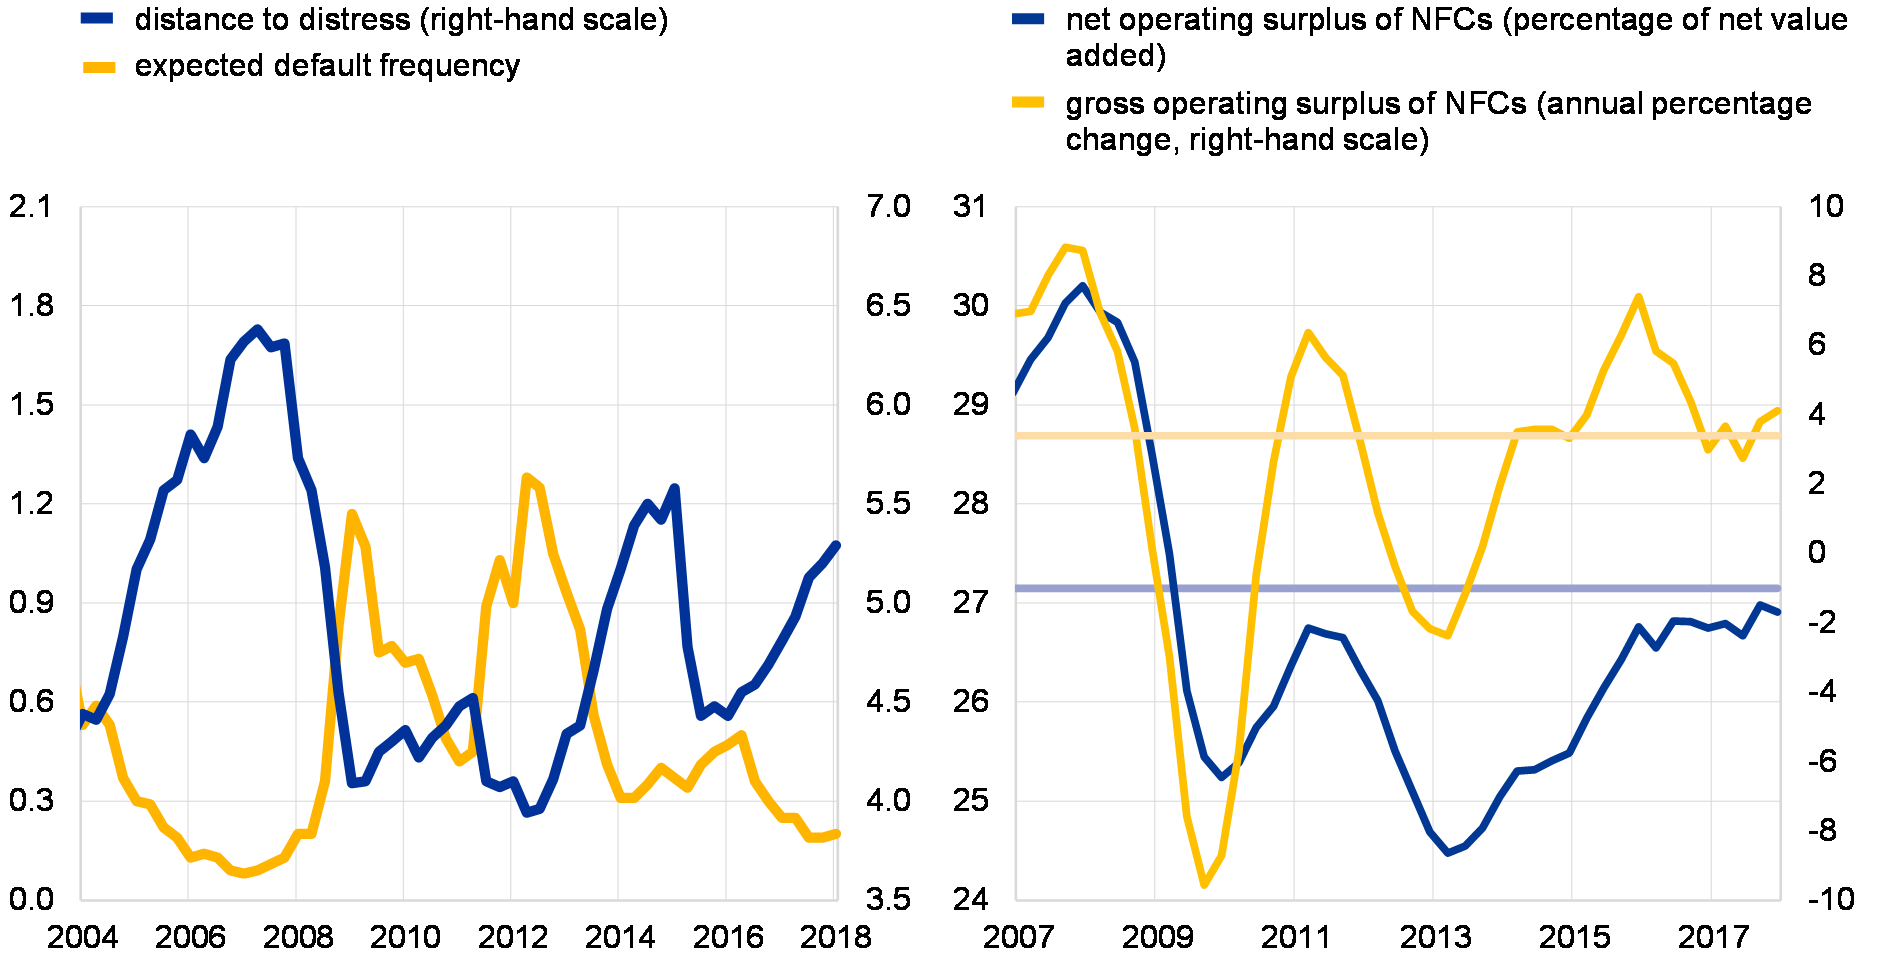
Sources: Moody’s, ECB euro area accounts and ECB calculations.
Note: Right panel: The horizontal lines illustrate the long-term averages for the respective indicators, covering the time span from Q1 1999 to Q3 2017.
A large stock of legacy debt continues to weigh on the euro area non-financial corporate sector. On aggregate, the level of non-financial corporate debt stood at 105.5% of GDP as at year-end 2017 on an unconsolidated basis – a level that remains high by both historical and international standards. While having decreased since the peak in early 2015, corporate indebtedness at 80.6% of GDP on a fully consolidated basis has remained slightly above the 80% of GDP benchmark (derived from the European Commission’s MIP Scoreboard) that can be associated with a debt overhang, albeit amid a high degree of heterogeneity across euro area countries. At the same time, other leverage measures such as debt-to-total assets and debt-to-equity ratios point to more favourable developments. They have declined markedly since mid-2012, now standing at or close to their historical lows. The decline in these measures can be mostly attributed to the increase in share prices, which has facilitated the deleveraging via the positive denominator effect.
The relevance of market-based debt has increased since the start of the crisis. The decomposition of non-financial corporate indebtedness by instrument suggests an ongoing (possibly more structural) shift from MFI loans towards market-based funding since the financial crisis in a large number of euro area countries (see Chart 1.17). In general, this is a beneficial development as it leads to increased diversification of corporate funding sources. At the same time, the cost and availability of market-based funding may also be more prone to an abrupt increase in risk premia in global financial markets, whereas bank funding may typically buffer some of the short-term volatility in markets. Moreover, market-based funding is outside the scope of traditional macroprudential policies should signs of credit exuberance emerge.
Chart 1.17
Marked shift towards market-based financing in many euro area countries since the financial crisis
Share of debt securities issued in total market-based (debt securities issued) and bank (MFI loans) financing
(Q2 2008, Q4 2017; percentages based on outstanding stocks)
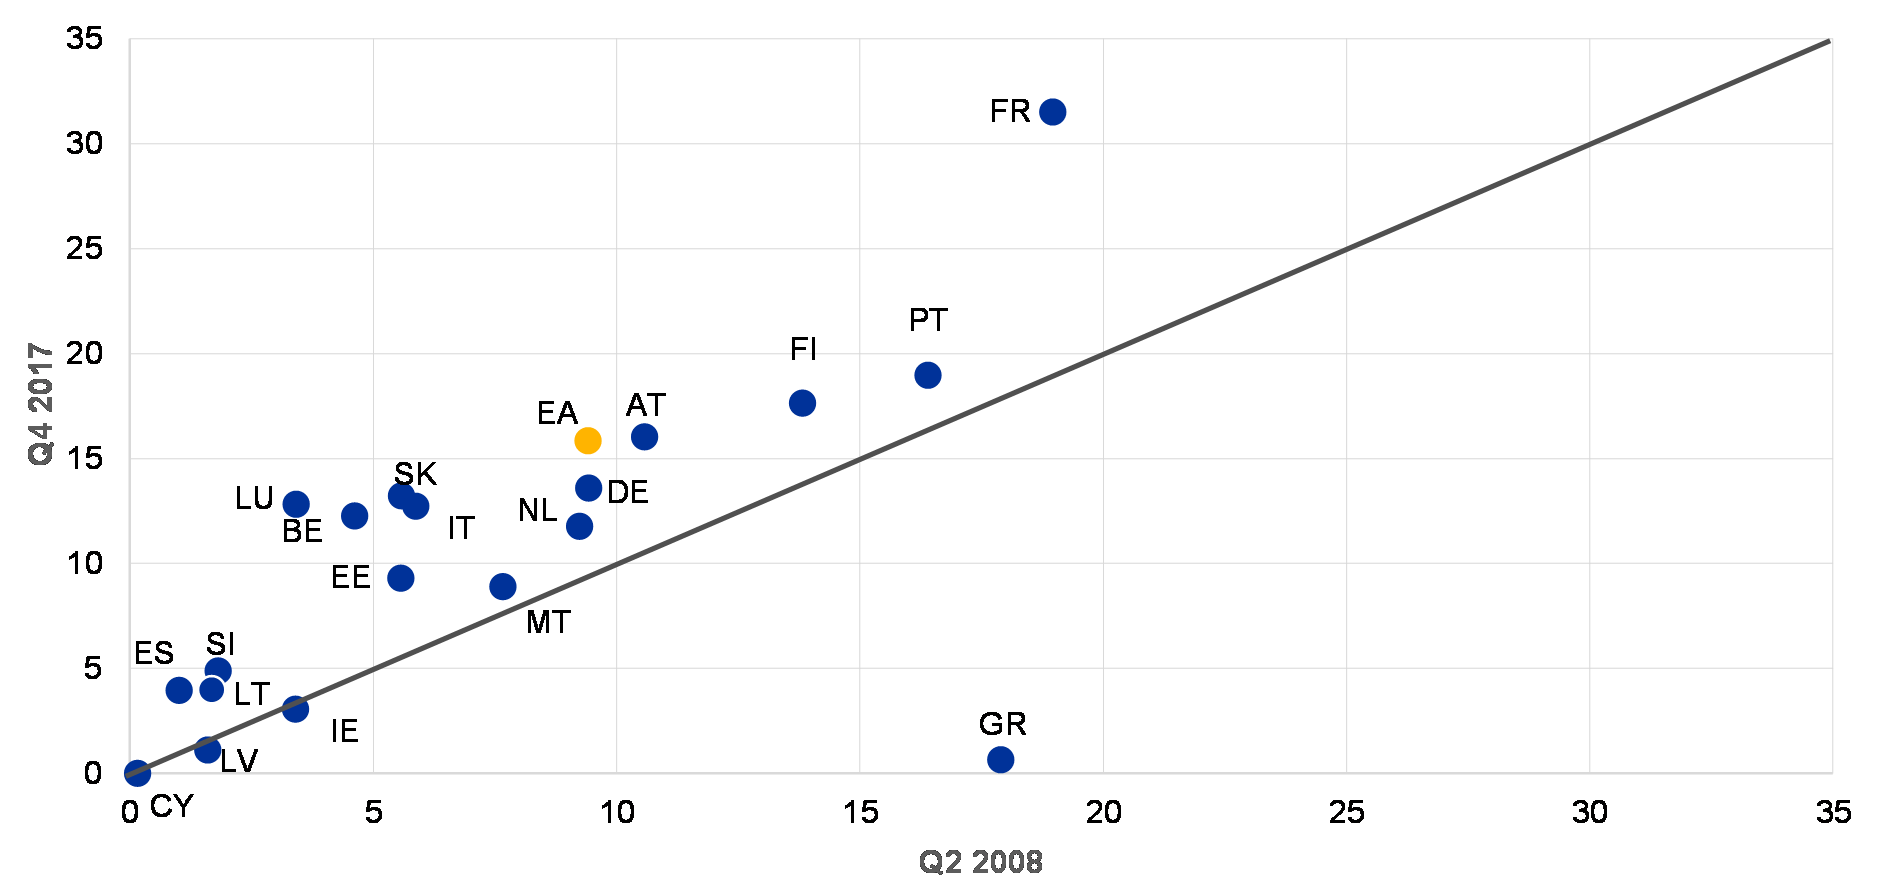
Sources: ECB euro area accounts and ECB calculations.
Note: Figures for Spain do not include debt issuance through financial subsidiaries which account for a significant part of the debt securities funding of large corporates.
A favourable interest rate environment alleviates debt sustainability concerns. Currently, euro area non-financial firms’ debt servicing capabilities are underpinned by rising corporate profitability and record low corporate interest payment burdens. Still, further balance sheet repair would help offset any risks related to a rise in interest rates (especially in the absence of a commensurate improvement in economic conditions) and the ensuing rise in debt servicing costs. In fact, unlike in the household sector, loans with floating rates or rates with rather short fixation periods continue to be the dominant type of loan for the euro area non-financial corporate sector. The related interest rate risk is partly mitigated by the ongoing shift towards market-based funding amid strong issuance activity at the long end of the maturity spectrum at fixed rates in recent years (see Chart 1.18).
Chart 1.18
Debt issuance at long-term fixed rates somewhat mitigates the risks related to a pick-up in interest rates
Cumulated net flows of debt securities issues by euro area non-financial corporations by maturity and interest rate type
(Jan. 2013 – Feb. 2018, € billions, cumulated net flows)
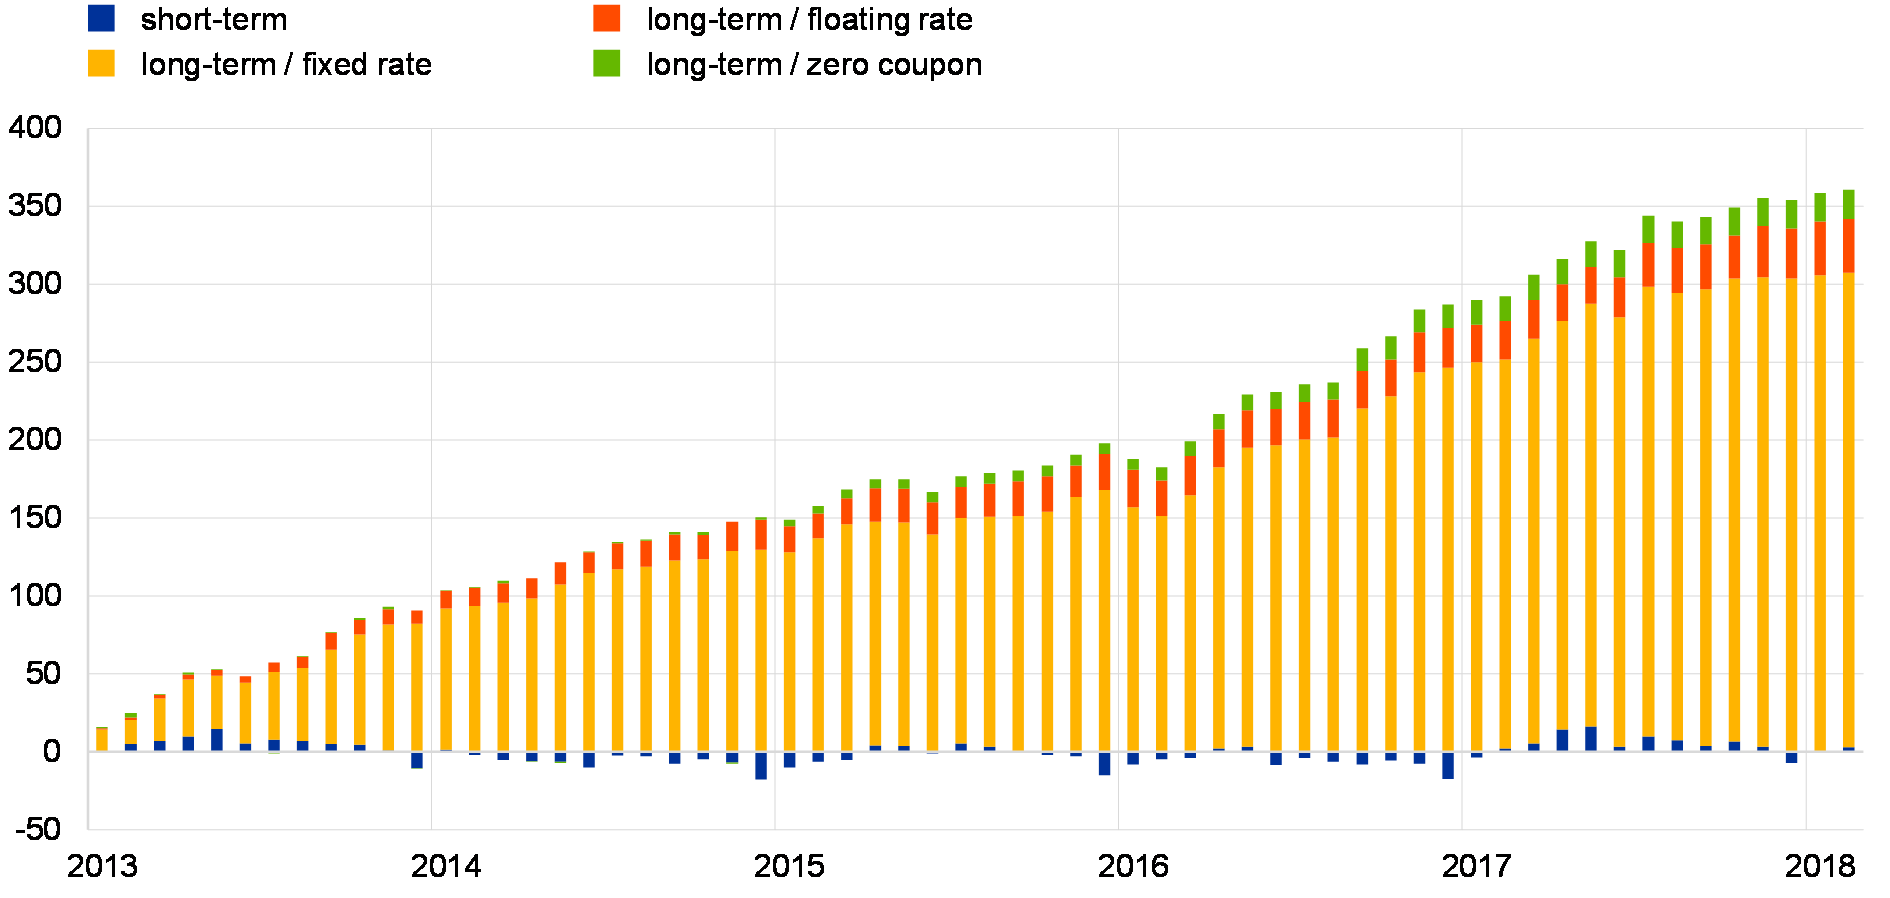
Sources: ECB and ECB calculations.
Bank lending flows to euro area non-financial firms strengthened gradually further, on the back of supportive demand and supply conditions. Developments have remained uneven across the euro area though, as relatively more dynamic lending activity in euro area countries that were less affected by the crisis contrasts with more muted developments in those countries that were more affected by the crisis (see Chart 1.19). Against the backdrop of increased competitive pressures and lower risk perceptions, banks have continued to ease their credit standards across maturities and firm sizes, but relatively more so for short-term loans and loans to large firms. Loan demand increased for loans to both SMEs and large firms, driven by an increase in fixed investment, the growth in inventories and working capital, as well as stepped-up M&A activity.
Chart 1.19
Expansion in lending to non-financial corporations is mainly driven by countries that were less affected by the crisis
Annual growth in loans to NFCs in the euro area
(Jan. 2009 – Mar. 2018, annual percentage changes, percentage point contributions)
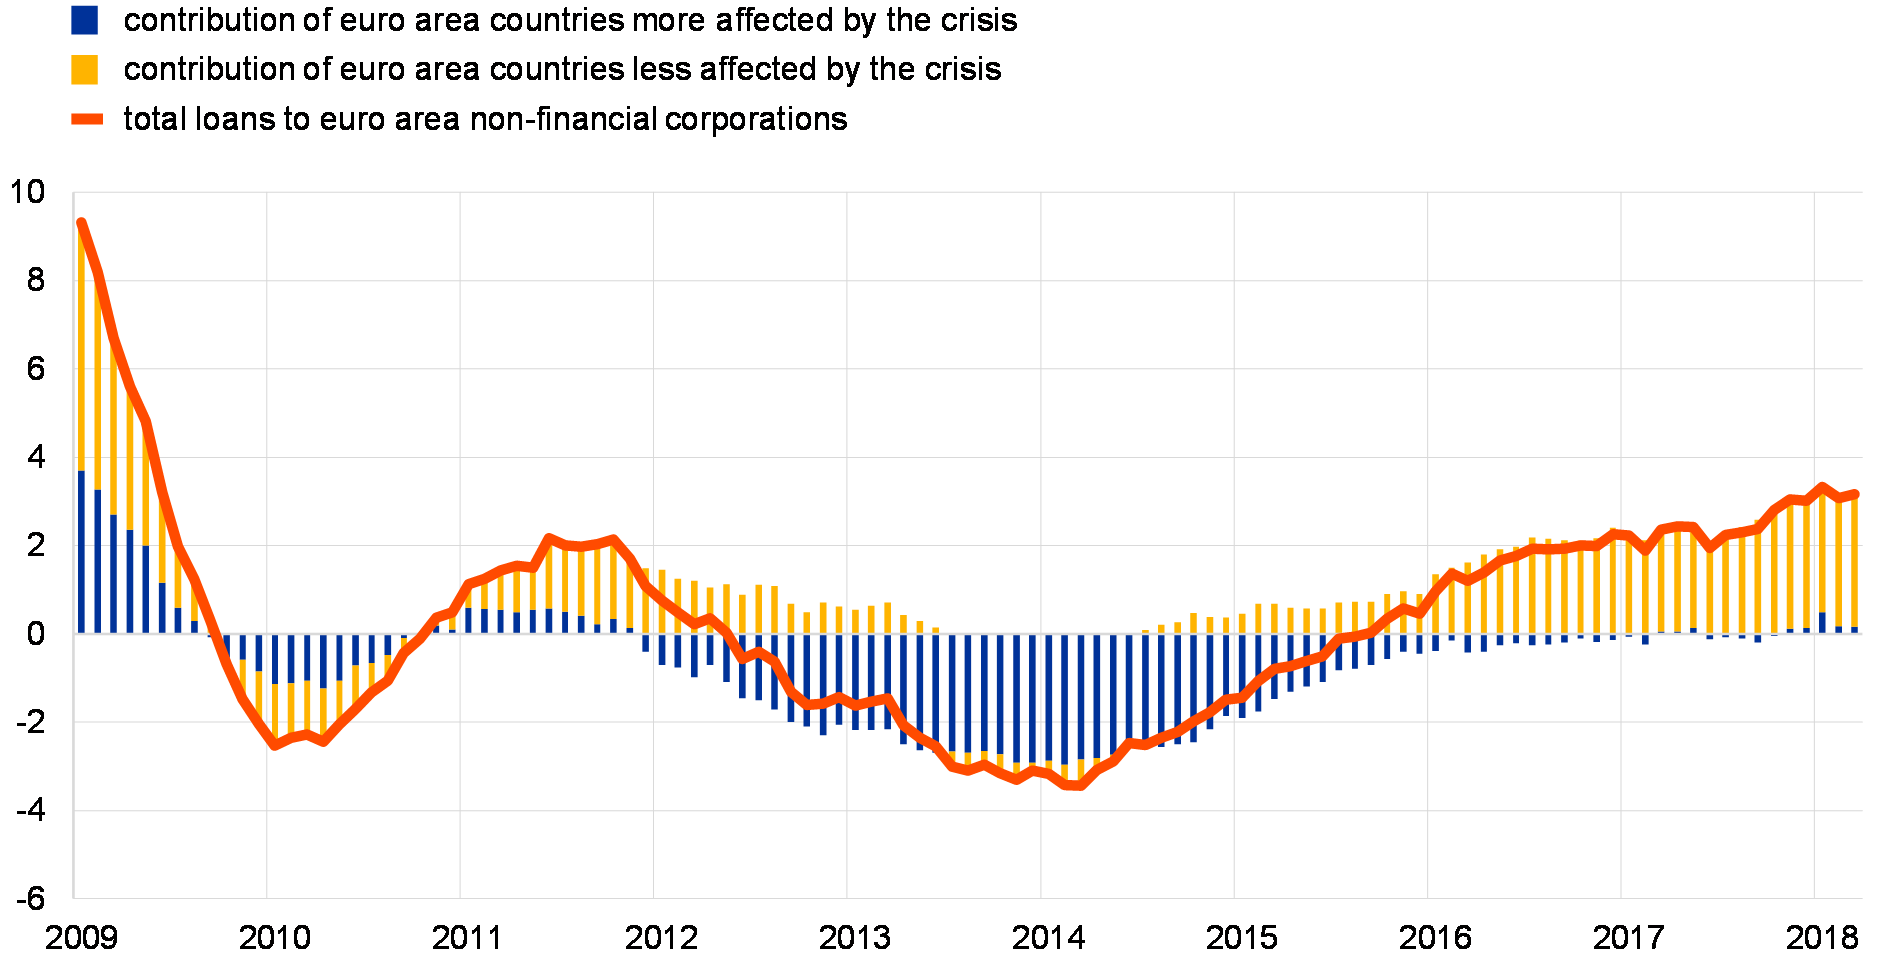
Sources: ECB and ECB calculations.
Notes: Data are adjusted for loan sales and securitisations. Euro area countries more affected by the crisis comprise Cyprus, Greece, Ireland, Italy, Portugal, Slovenia and Spain, while the category less affected by the crisis captures all other euro area countries.
External financing from non-bank sources has remained favourable in terms of both the availability and the cost of funding. External financing from non-bank sources strengthened further, supported by the low overall cost of external financing – even if the latter has increased somewhat since early 2018 as a result of the observed repricing in equity and bond markets (see Chart 1.20 – left panel). The net issuance of debt securities has remained relatively strong against the backdrop of both the ECB’s corporate sector purchase programme and the low cost of market-based debt. By contrast, the issuance of listed shares by NFCs continued to be rather modest given the comparatively high cost of quoted equity. In terms of the uses of funds, capital expenditures, purchases of financial assets, M&A activity as well as increases in liquid assets have gained in importance in recent years (see Chart 1.20 – right panel). There has been no marked increase in the return of funds to shareholders via dividends and share buybacks.
Chart 1.20
External financing conditions remained favourable for euro area non-financial corporations, underpinning an increase in capital expenditures and purchases of financial assets
Nominal cost of external financing for NFCs (left panel), as well as sources and uses of funds for euro area NFCs (right panel)
(left panel: Jan. 2009 – Apr. 2018, percentages; right panel: Q1 2008 – Q4 2017, percentage of notional stocks of assets, four-quarter moving sums)
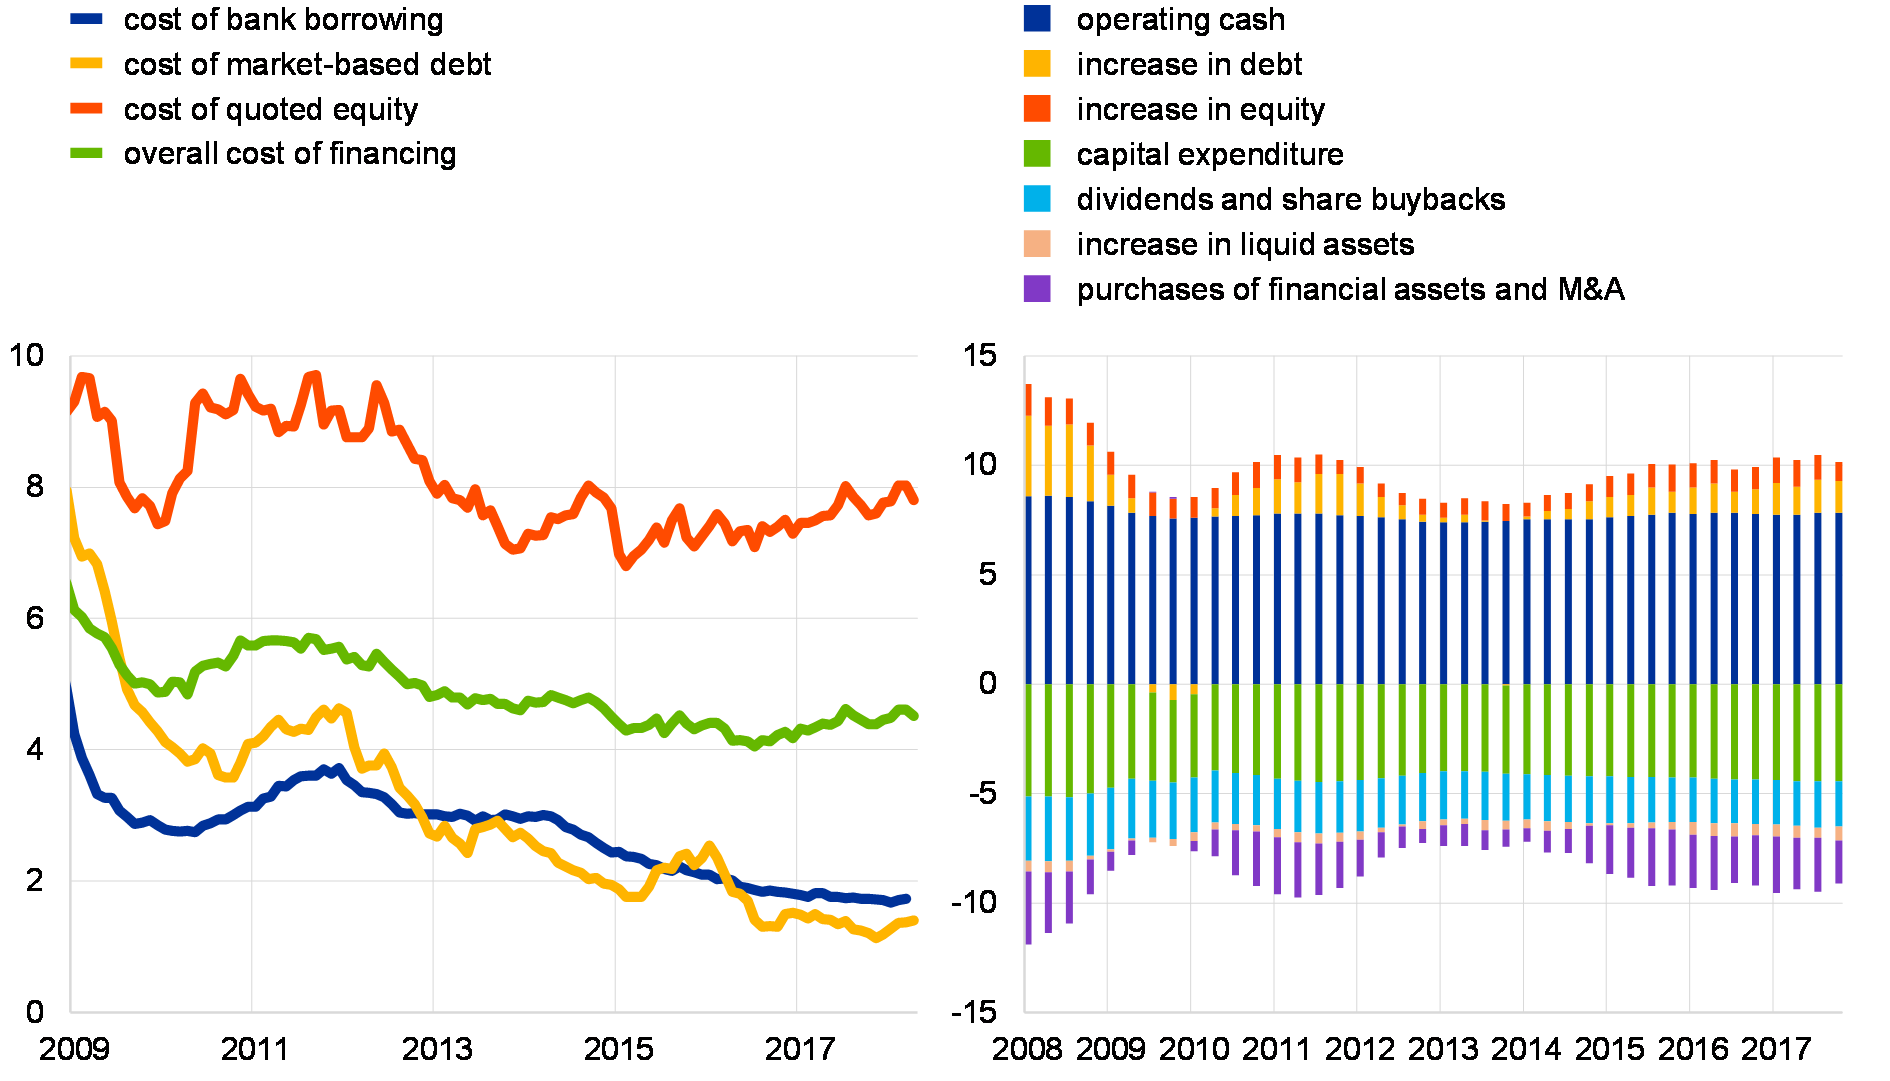
Sources: ECB, ECB euro area accounts, Merrill Lynch, Thomson Reuters and ECB calculations.
Notes: Left panel: The overall cost of financing for NFCs is calculated as a weighted average of the cost of bank lending, the cost of market-based debt and the cost of equity, based on their respective amounts outstanding derived from the euro area accounts. The cost of equity estimates are based on a three-stage dividend discount model. Right panel: Liquid assets include currency and deposits. Equity is the sum of the gross issuance of listed shares and the net issuance of unlisted shares and other equity.
Internal financing sources of euro area firms remain ample. Corporate liquidity has increased further in the euro area to the new record high of around 30% of GDP as at year-end 2017, suggesting that non-financial firms can also rely on drawing down these buffers as a financing source, in addition to loans and debt securities. These high liquidity buffers may reflect a lack of attractive investment opportunities, as well as precautionary motives (i.e. mitigating the risk of limited access to external financing in the future) and the low opportunity cost of holding liquid assets. Overall, these internal sources of funding could make a significant contribution to both reducing leverage and boosting investment. That said, micro data suggest that more levered firms tend to have lower cash holdings, even if over time cash holdings have increased in all leverage buckets (see Chart 1.21). This suggests that firms that would be most exposed to a tightening in financing conditions are the least able to withstand it by using their own liquidity buffers.
Chart 1.21
More levered euro area firms tend to have lower cash holdings
Cash holdings of non-financial firms by leverage bucket
(2006, 2016; percentage of gross debt)
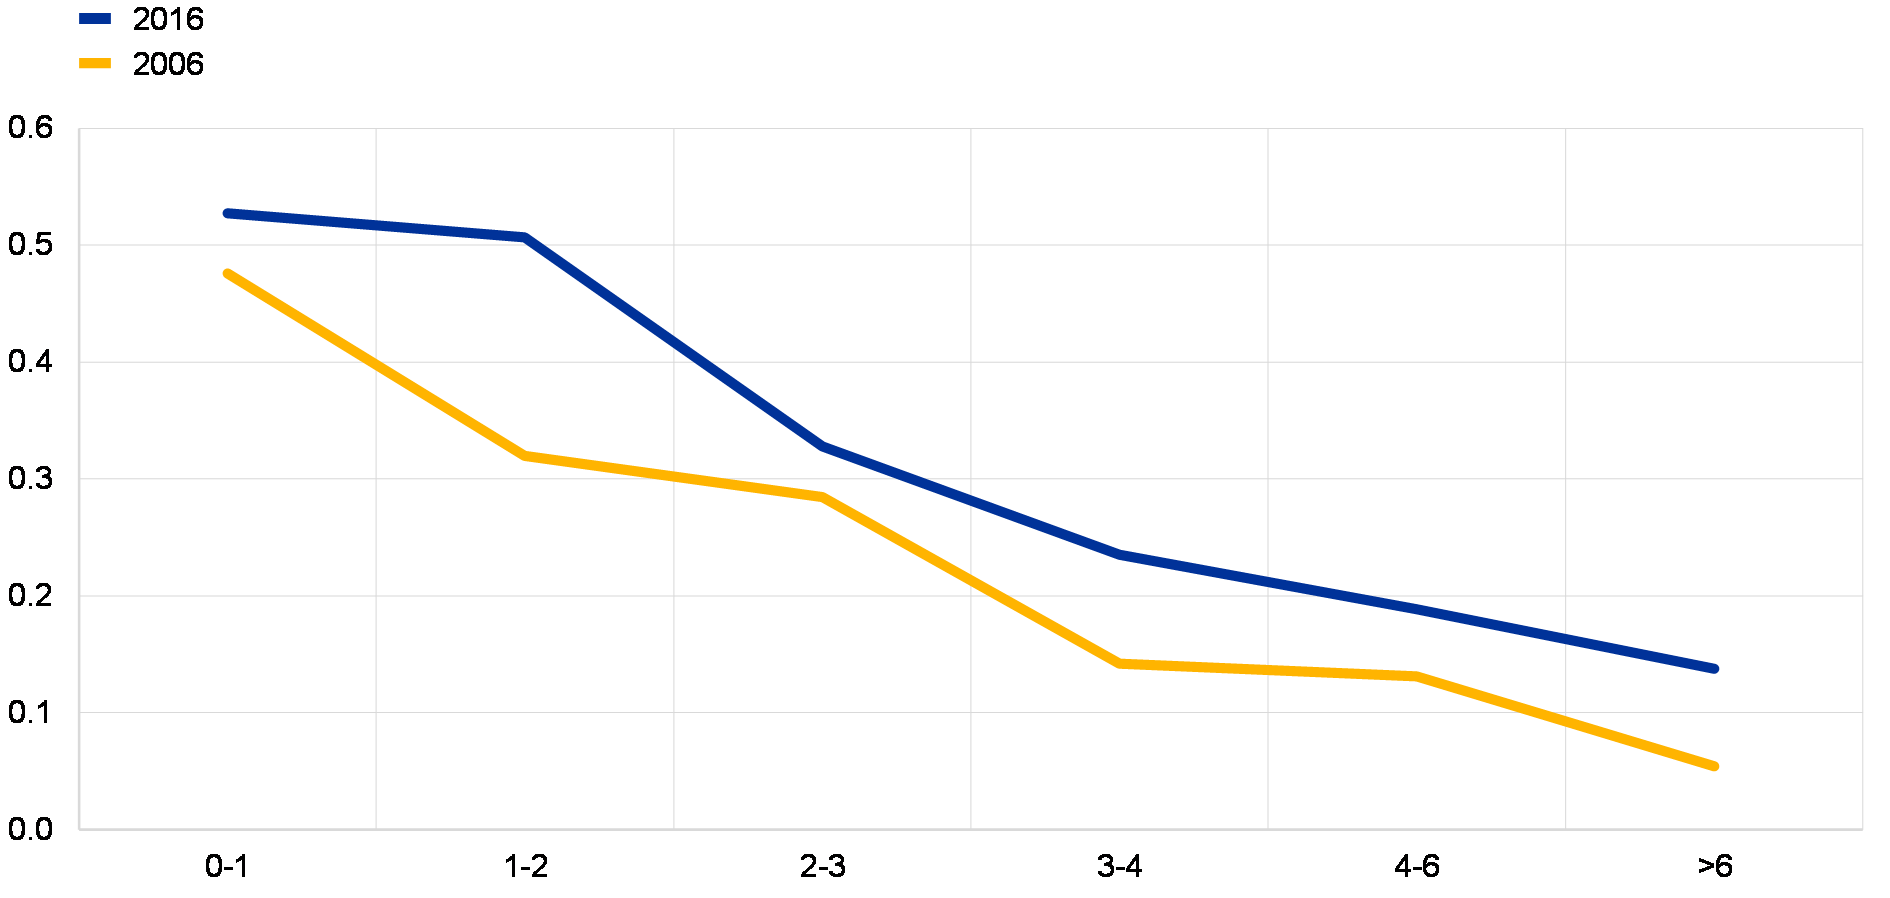
Sources: Thomson Reuters, Bloomberg and ECB calculations.
Notes: The sample consists of 154 investment-grade non-financial firms from the euro area, of which 45 are from France, 42 from Germany, 15 from Spain, 16 from Italy, 13 from the Netherlands and the rest from other euro area countries. Leverage is defined as gross debt over EBITDA.
All in all, euro area non-financial firms continue to benefit from the economic upswing and low funding costs, but underlying vulnerabilities remain. The strong underlying economic momentum underpins firms’ profit-generation capacity. Reinforced by the very accommodative monetary policy stance of the ECB, the financing conditions of euro area non-financial corporations remain favourable and supportive of both investment and debt servicing. However, rising interest rates (without a commensurate improvement in macroeconomic conditions) may spark renewed debt sustainability concerns, as corporate indebtedness remains high at the aggregate euro area level both historically and by international standards.
Box 2
Listed commercial real estate companies and real estate investment trusts: trends and implications for financial stability
Assessing the dynamics of the euro area commercial real estate (CRE) sector[12] during the current cyclical upturn remains important for identifying potential financial stability risks. The downturn in CRE markets played a significant role in the last financial crisis in many countries and contributed to the increase in the non-performing exposures of the banking sector. As part of this assessment, this box analyses the growing importance of listed CRE companies, and a sub-set thereof known as real estate investment trusts (REITs), in the euro area.
Over the last decade, the assets of listed CRE companies have grown rapidly in many euro area countries (see Chart A – left panel). Since 2009 the size of these companies has doubled relative to the underlying commercial property sector in the euro area, although they remain small relative to their counterparts in the United States and the United Kingdom (see Chart A – right panel). In most euro area countries where listed CRE companies are relatively large vis-à-vis the size of the underlying CRE market REITs are the dominant form (e.g. in the Netherlands, France, Belgium, Spain and Ireland).[13] The main exceptions are Germany and Austria, in which the largest listed CRE companies are not REITs.
Chart A
Both the assets of listed CRE companies and their weight relative to domestic CRE markets have grown markedly in many euro area countries since 2009
Relative size of listed CRE companies
(left panel: 2000-16; euro area FTSE EPRA/NAREIT index company assets as percent of GDP; right panel: 2009 and 2017; market capitalization of listed CRE companies as percent of total CRE assets)
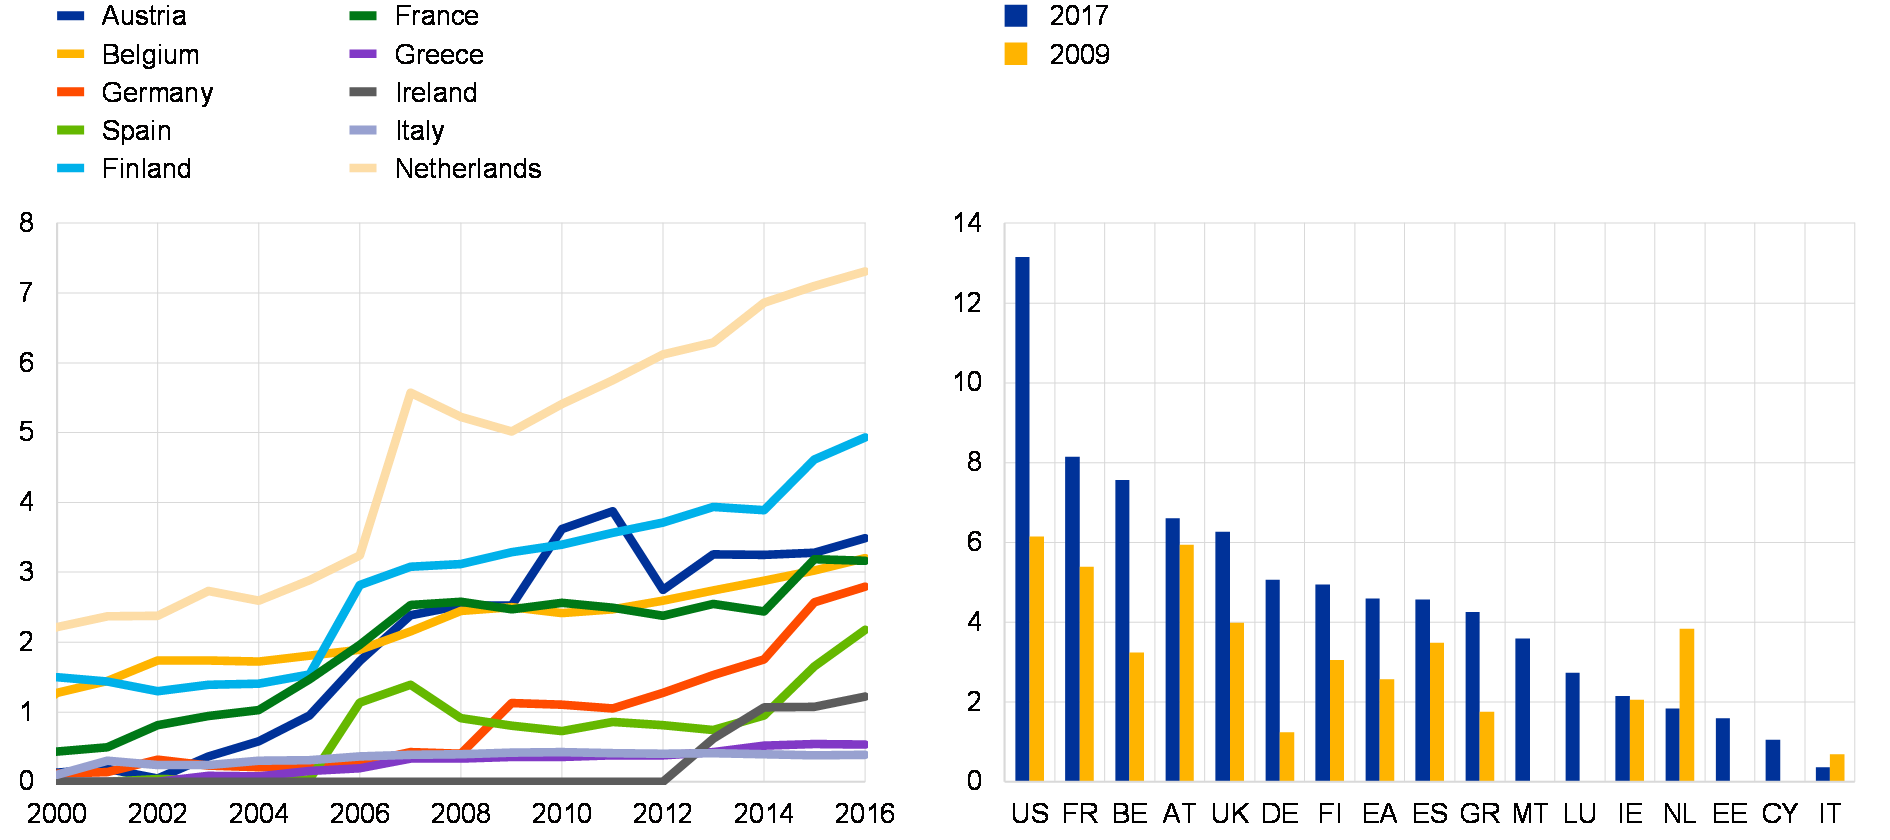
Sources: Bloomberg company data for FTSE EPRA/NAREIT index companies, EPRA Total Markets Table and ECB calculations
Note: The drop for NL in the right-panel chart is due to the reclassification in the EPRA Total Markets Table of a large REIT as French after a merger. The same large company has, however, continued to be classified as Dutch in the FTSE EPRA/NAREIT index.
Listed CRE companies usually derive most of their corporate revenue from the rental income that they earn on a portfolio of real estate property that they own. They have two distinctive features that render them attractive to investors. First, in the case of REITs, companies can either minimise or completely avoid paying corporate income tax by distributing most of their income as dividends, so that only the shareholders are taxed on their dividend income or capital gains. This allows REITs to offer higher dividend yields than other company stocks, whose issuers must pay taxes at the corporate level before distributing any dividends. Second, listed CRE companies, including REITs, are listed on a stock exchange, thereby offering investors exposure in a liquid and transparent way to a relatively illiquid underlying asset like commercial real estate.
Foreign investors are by far the most important source of both equity and debt funding for listed CRE companies in euro area countries (see Chart B – left panel). US asset management companies are the largest single source of equity inflows into listed euro area CRE companies, although other euro area countries still account for around 40% of foreign holdings of equity (see Chart B – right panel). In the current low global interest rate environment, foreign investors are attracted by the relatively high risk-adjusted returns offered by CRE company shares, through which they can also achieve a liquid exposure to a growing CRE sector.
Chart B
Foreign investors hold most of the equity and debt issued by listed euro area CRE companies, with US and French investors holding the largest equity stakes
Share of debt and equity in listed euro area CRE companies held by non-domestic investors (left panel) and foreign holdings of equity in listed euro area CRE companies by country of holder (right panel)
(2016; percentages)
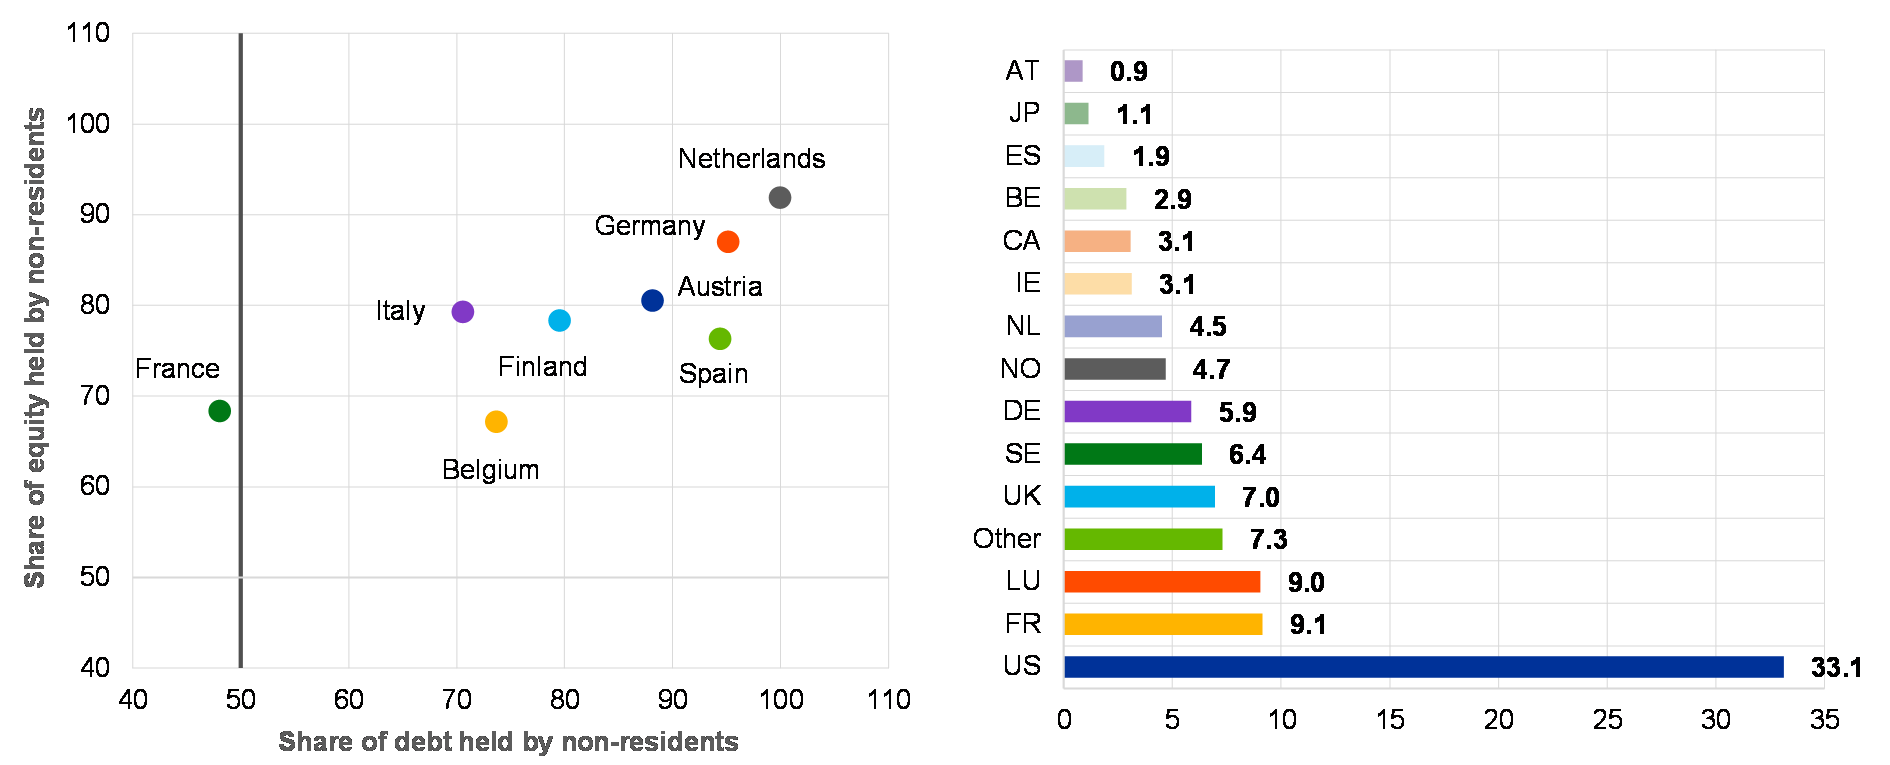
Sources: Bloomberg, SHS, FTSE Russell and ECB calculations
Notes: Left panel: “Non-domestic” refers to investors from both inside and outside the euro area. Foreign holdings as a percentage of debt and equity issued by companies listed in the FTSE – EPRA NAREIT Europe Index and included in Securities Holdings Statistics (SHS). Right panel: Calculations are based on the weighted average of aggregate total assets in the euro area. Domestic holdings represent total holdings held by investors from the same country and foreign holdings represent total holdings held by investors from foreign countries (including in the euro area).
In general, the funding structure of listed CRE companies and the dominant role of foreign funding sources could be seen as tempering any concerns about euro area financial stability. First, there is no significant direct exposure of the banking system to this sector, as it is mostly funded by institutional investors and funds managed by global asset managers. Second, the main source of funding for the sector is equity, which reduces the risks typically associated with leveraged investment structures, such as debt rollover risk. In fact, listed CRE companies operate with relatively low leverage, and the average debt-to-assets ratio of these companies in the euro area is fairly stable at around 37%. Third, the geographical diversification of the holdings of equity and debt securities issued by CRE companies allows risk sharing in the event of the materialisation of losses, as they are spread across numerous euro area jurisdictions and among investors outside the euro area, rather than being concentrated in the home jurisdiction of the company.
Foreign capital flows into listed CRE companies may, however, be susceptible to a sudden stop or reversal of search-for-yield flows should global financial conditions change. The growth of investment transactions and prices in the most dynamic CRE markets currently appears to be influenced by increased commercial property purchases by these listed CRE companies. In this context, a sudden stop in the funding inflows into these companies could lead to disorderly price adjustments in commercial property markets themselves. Accordingly, looking ahead, monitoring the influence of developments in listed CRE companies and their potential impact on the dynamics of euro area CRE markets will remain an important part of the overall assessment of financial stability risks in the euro area.
2 Financial markets and valuations
The February volatility surge had limited spillovers, but revealed a fragile financial system
Global financial markets were rattled in early February by a surge in volatility originating in US equity markets. Following the passage of the US tax reform, US equities rose by close to 9% between the end of November and the end of January. However, stronger than expected US wage increases and non-farm payroll data on 2 February triggered an increase in US term premia linked to greater uncertainty about the pace of US monetary policy normalisation and future inflation levels (Chart 2.1). This, in turn, precipitated a US equity market sell-off, which was mirrored in global equity markets. This episode highlighted risks harboured by a low-volatility environment associated with investor complacency, search for yield and the build-up of leverage, as previously discussed in the November 2017 FSR. It also brought to the fore the extent to which volatility has become an asset class in its own right with the potential to amplify market movements.
Chart 2.1
The recent bout of volatility was partly triggered by stronger than expected US labour market data on 2 February
Ten-year US Treasury yields, ten-year US Treasury term premium and US five-year inflation expectations
(Jun. 2017 to May 2018, basis points)
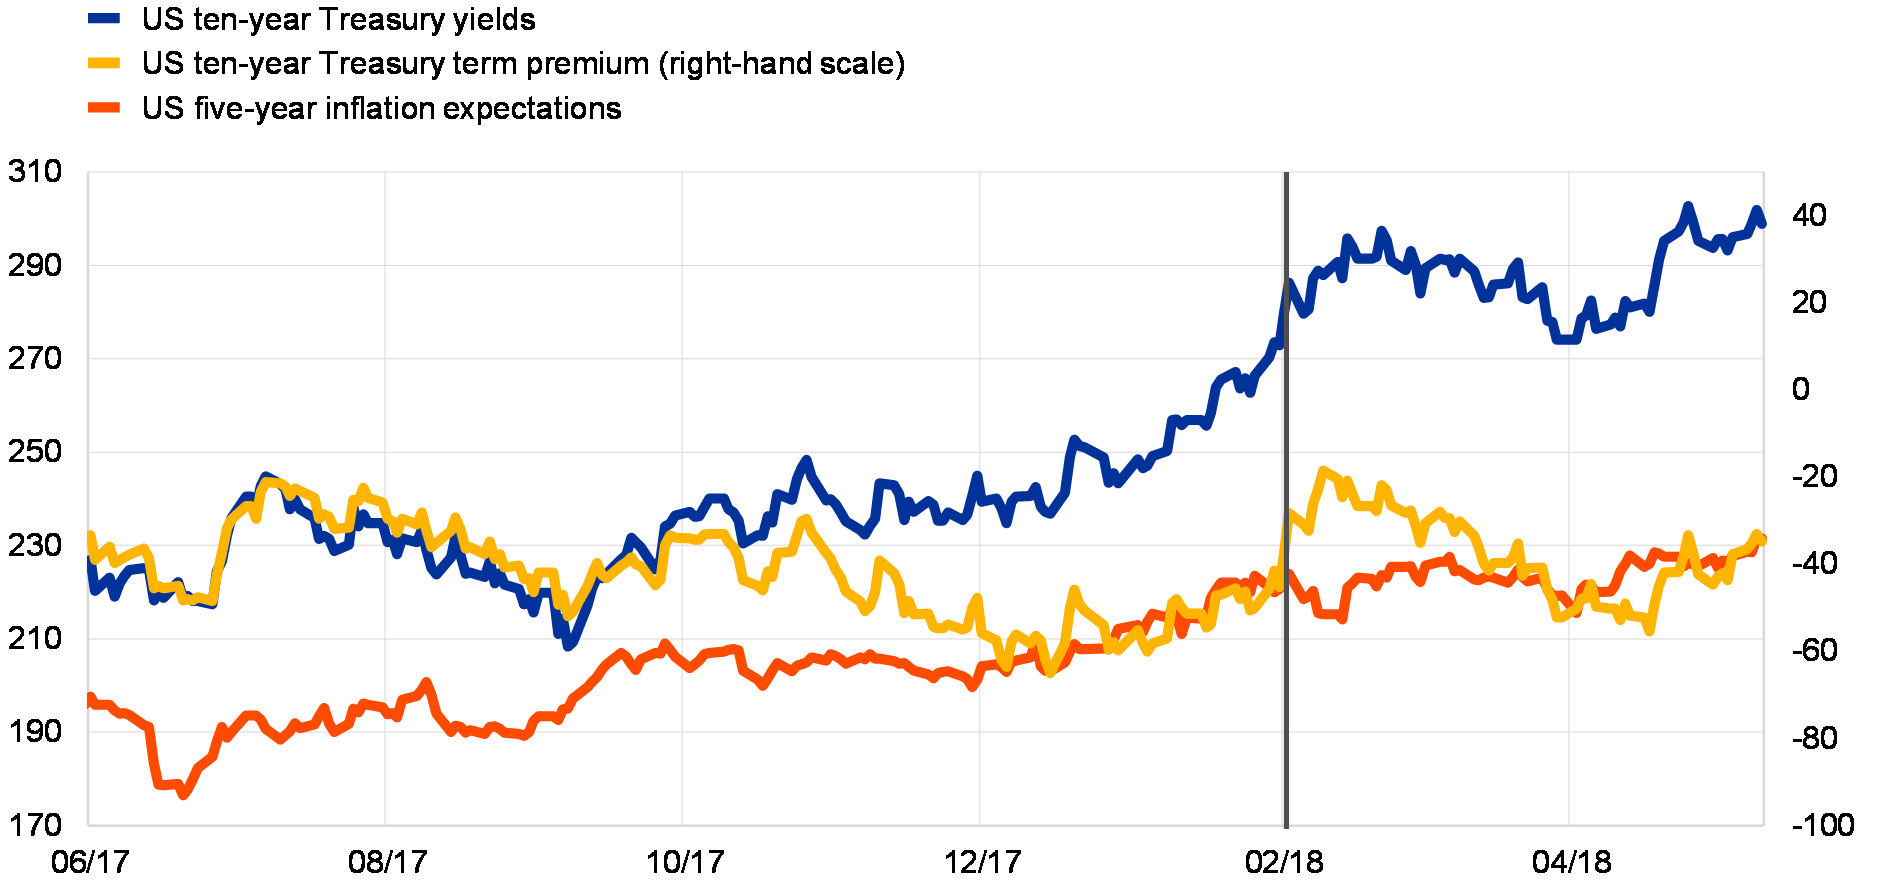
Sources: Bloomberg and ECB calculations.
Notes: US inflation expectations are based on inflation swap rates on the headline CPI-U NSA. The vertical grey line indicates 2 February 2018.
The disproportionate rise in equity market volatility partly reflected the behaviour of investment products positioned on low volatility. The more than doubling of the VIX on 2 February was far above what would have been expected based on similar past declines in the underlying S&P 500 equity index (Chart 2.2).[14] While the VIX is not directly tradeable, there is an arbitrage relationship between options on the S&P 500 – which determine the VIX level – and VIX futures. This means that the VIX both determines and is affected by the pricing of VIX futures. Trading in the VIX via the futures markets is, in part, related to the activity of a small number of exchange-traded products (ETPs) targeting volatility. These products require daily rebalancing to ensure that they meet their target exposure.[15] The sharp increase in the VIX in early February therefore required these ETPs to purchase significant amounts of VIX futures to meet their daily rebalancing requirements. The holders of inverse volatility ETPs are also likely to have put upward pressure on VIX futures prices as they tried to hedge their exposures. Ultimately, the volatility surge led to the implosion of some of these products, as daily losses in excess of pre-determined maximum thresholds – in some cases over 80% – triggered their closure.
Chart 2.2
The relationship between the VIX and stock price returns broke down in early February
VIX median, interquartile range, and minimum and maximum changes in VIX levels for given daily changes in the S&P 500
(Nov. 2000 to 5 Feb. 2018; daily changes in price volatility; percentages)
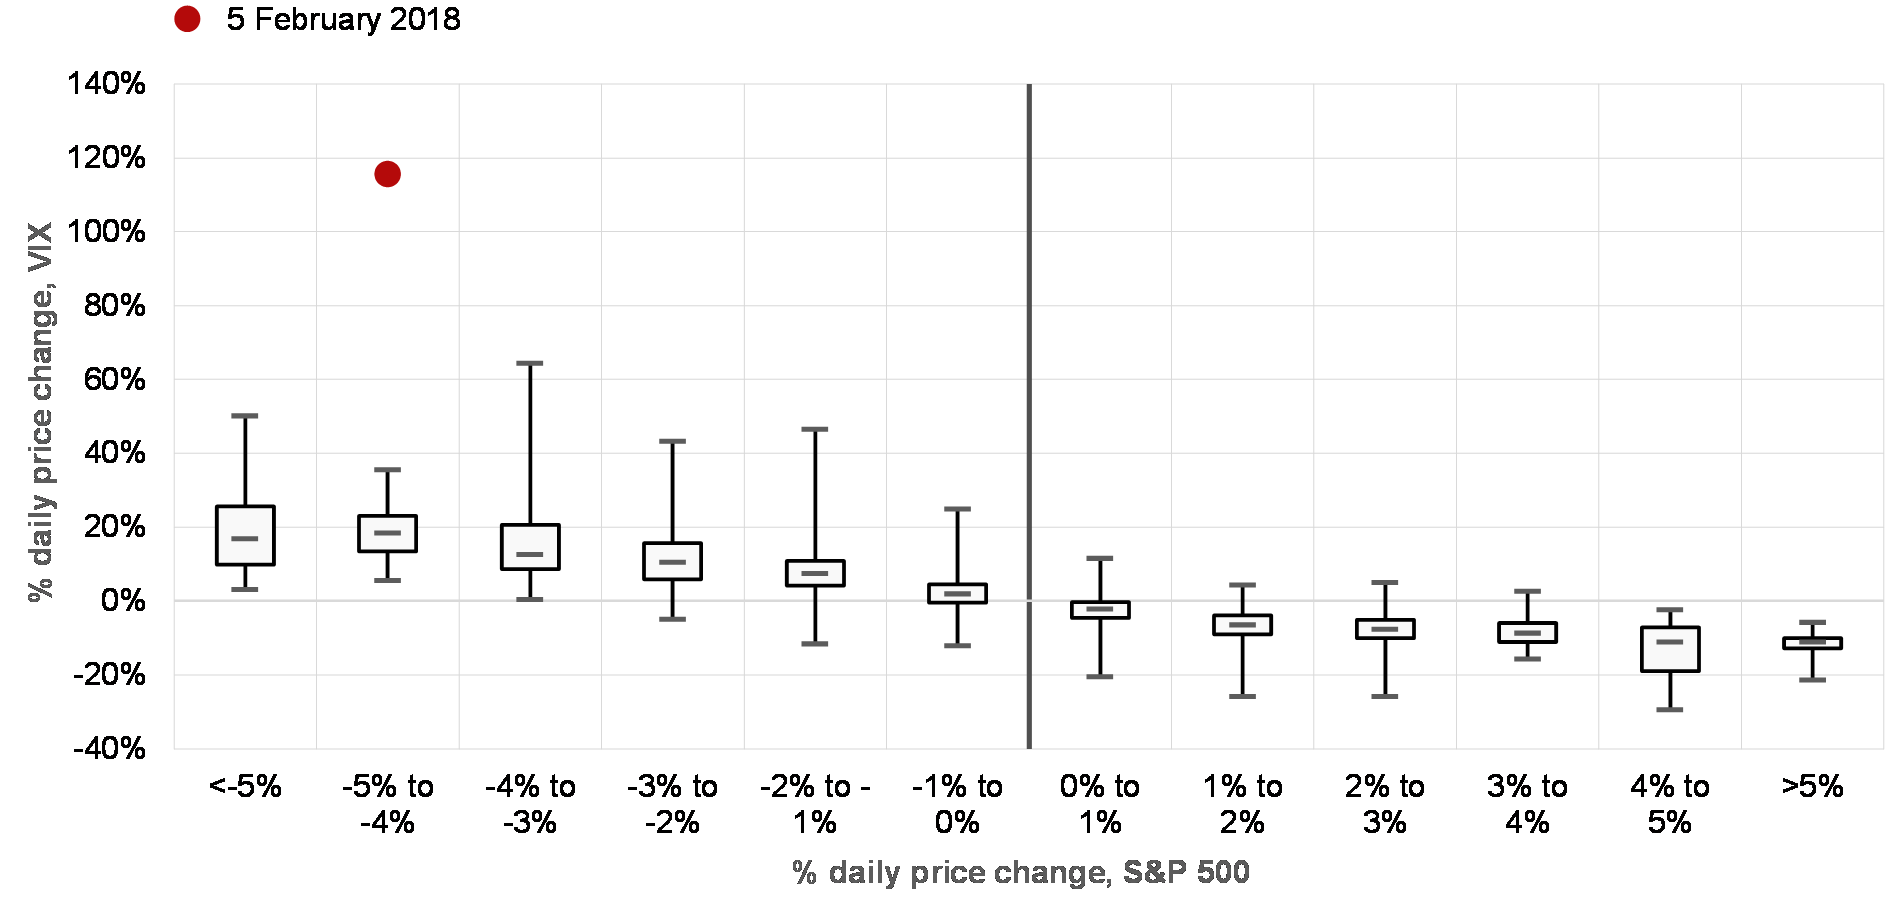
Sources: Thomson Reuters and ECB calculations.
Note: The statistics for daily changes in VIX prices are shown in relation to daily S&P 500 price changes, sorted into buckets.
While immediate spillovers from the February episode were largely limited, some of the shock persisted. Both in Europe and in the United States, equity markets saw an immediate and relatively sharp correction. This probably reflected both a pullback following previous rapid price appreciation and a negative feedback loop between the VIX and its underlying S&P index (via dealer and investor hedging activities). High-quality corporate bond markets and euro area sovereign bonds were only affected marginally, while high-yield corporate credit spreads saw an orderly and persistent widening. The implied volatilities of the VIX and of European and US credit indices have decreased since the February peak, but remain relatively high, indicating that markets continue to price in considerable uncertainty over the short term (Chart 2.3). This suggests that the spillovers from the February episode may eventually extend beyond the initial market correction and that the pricing of volatility has regained its sensitivity to daily news, such as increased global trade war rhetoric from the United States. From a financial stability perspective, an orderly repricing that brings the valuation of certain asset classes more into line with their fundamental value is, nevertheless, positive.
Chart 2.3
While most European bond markets were unaffected by the bout of equity volatility, US and European equity and credit markets priced in higher volatility levels after the spike in February
Implied price volatility of selected European and US CDS and equity indices and estimated price performance for selected European and US equity and credit indices since November 2017
(left panel: Jan. 2012 to May 2018, price volatility in percentages per annum; right panel: index: 1 Nov. 2017 = 100)
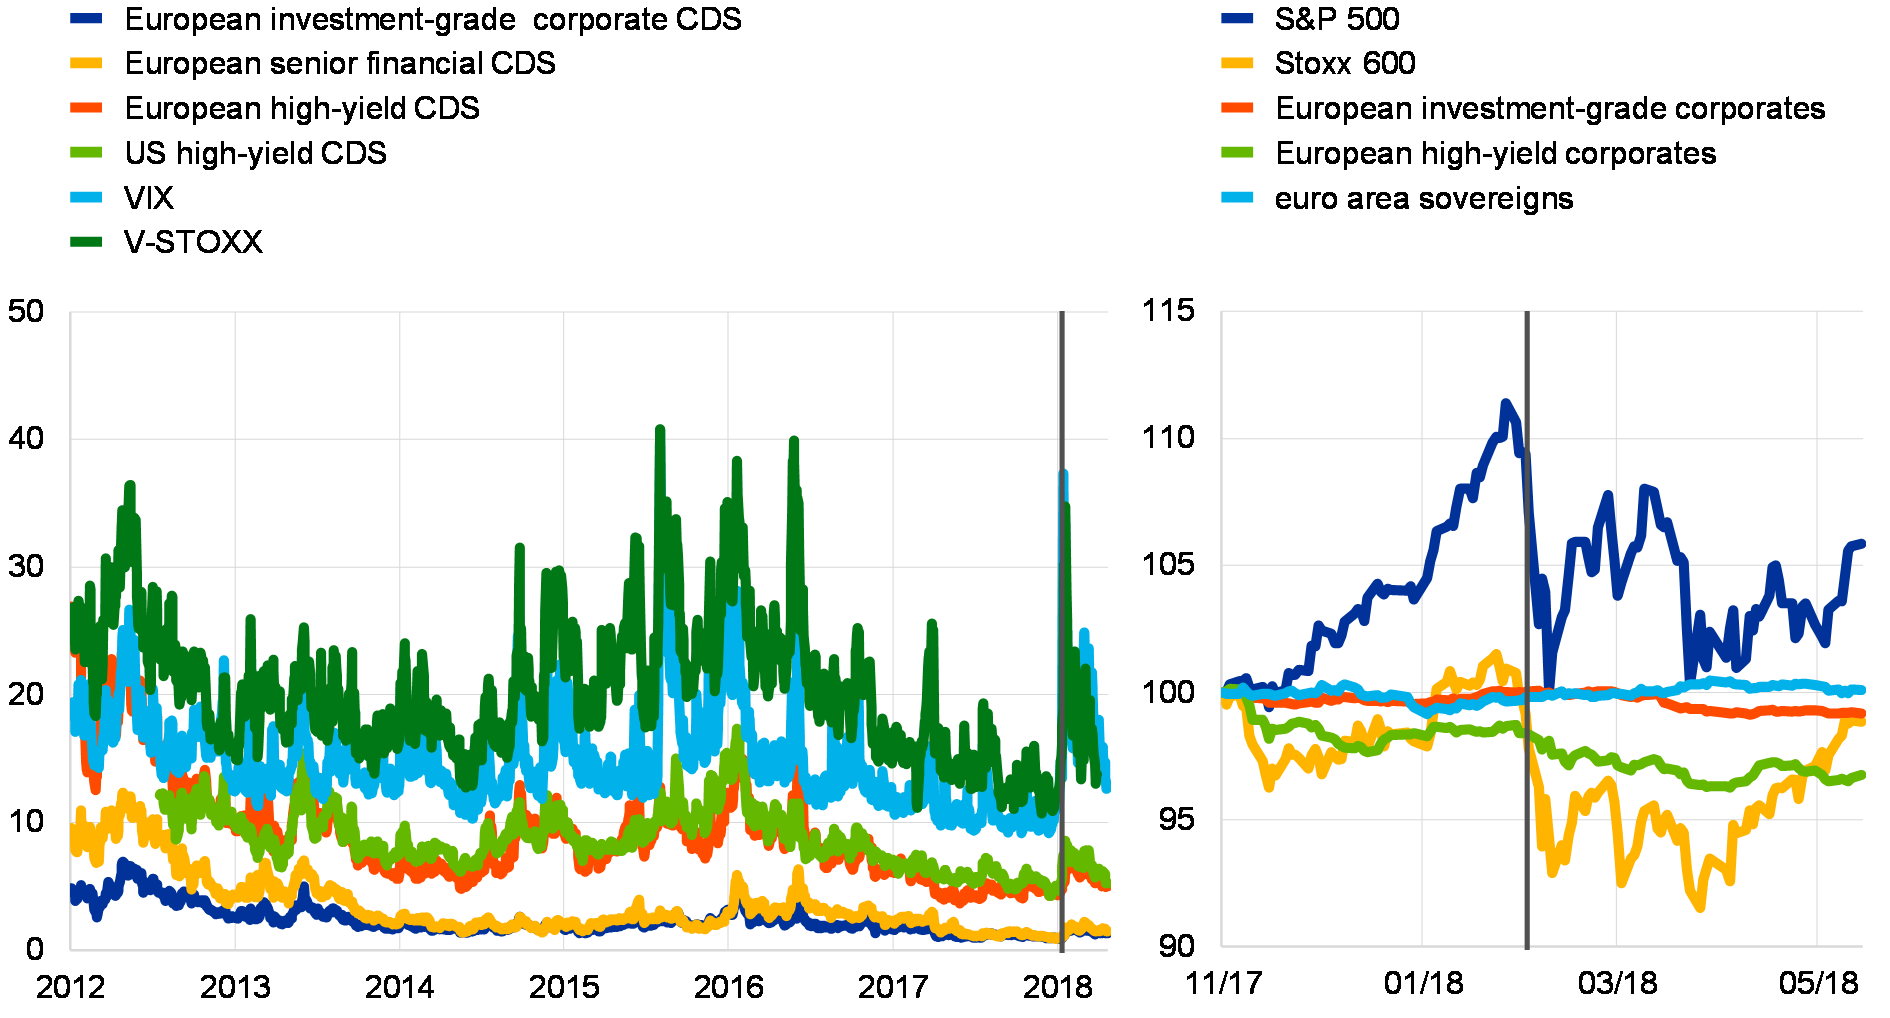
Sources: Thomson Reuters, Citigroup (implied CDS index volatility) and ECB calculations.
Notes: Left panel: European investment-grade corporate CDS, investment-grade senior financials, high-yield CDS and US high-yield CDS index volatilities represent market-implied at-the-money price volatilities for six-month credit options on the five-year iTraxx Europe, five-year iTraxx Senior Financials, five-year iTraxx Crossover and five-year CDX.NA.HY, respectively. Yield volatilities have been converted to price volatilities to make credit volatility comparable with equity volatility. Right panel: the evolution of corporate and sovereign bond indices is based on iBoxx EUR Non-Financials, iBoxx EUR HY Non-Financials and iBoxx EUR Eurozone Sovereigns. The illustrated bond prices capture the reaction to the changes in the credit spread component only. The risk-free rate is kept constant as of 1 November 2017 to ensure that only the impact arising from changes in the credit spread levels are captured. In each panel, the vertical black line indicates 2 February 2018.
Past experience using US data suggests that the higher volatility since February is likely to persist. Box 3 finds that the period of low volatility preceding the February episode is not unusual from a historical perspective and that the persistently higher volatility since February is likely to mark a shift to a higher volatility regime.
Box 3
Regime shifts in stock market volatility: a historical perspective on the US market
After a period of about two years with fairly steady price increases and persistently low volatility, global stock markets experienced a notable price and volatility correction in early February 2018. Before this correction, policy authorities had become concerned about the benign volatility conditions, since low volatility may lead market participants to take on excessive risk and thereby create risks to financial stability (the “volatility paradox”).[16] Against this background, a return to conditions of higher volatility could, on the one hand, be regarded as a welcome normalisation. On the other hand, a “disorderly” stock market correction with sharp price declines and large price fluctuations might itself pose risks to financial and economic stability.
To put recent developments into a historical perspective, this box analyses stylised facts of stock market volatility derived from 90 years of US data. For this purpose, a model of weekly returns of the S&P 500 price index is estimated that allows for abrupt switches between three regimes in the volatility dynamics during the period from January 1928 to mid-May 2018 (low, medium and high-volatility regimes).[17] Such regime-switching models are able to capture two well-known stylised facts of stock market volatility, namely that volatility can jump sharply upwards in a short amount of time, and that such jumps are followed by fairly rapid reversion to lower levels which, in turn, can vary over time.[18]
Chart A
Stock market volatility regimes are quite persistent historically
Estimated stock returns volatility and stacked regime probabilities
(Jan. 1928 – May 2018, weekly data; regime probabilities in percentages, annualised volatility in percentages)

Sources: Federal Reserve Economic Data (FRED) and ECB calculations.
Notes: The low, medium and high-volatility regime probability series are stacked onto each other such that they add up to 100%. The volatility series are computed as the square root of the probability-weighted average of regime-specific annualised conditional variances.
The model suggests that stock market volatility indeed tends to cluster around low, medium or very high levels. Chart A shows the estimated volatility of weekly S&P 500 returns (the blue series) along with the stacked probabilities of being in any of the three regimes (represented by the areas shaded in green, orange and red). Average volatility amounts to 9% in the low-volatility regime, 14% in the medium-volatility regime and 31% in the high-volatility regime. The estimated probability of staying in the same regime over the next period is high for all three regimes, but particularly so for the low and medium-volatility regimes. Accordingly, the expected duration for those two regimes is quite long at about 80 and 50 weeks, respectively. Historically, periods of low and medium volatility are the most common, occurring in 45% of all weeks in both cases. High-volatility regimes, by contrast, tend to be much less frequent (10%) and much less persistent, apart from two episodes in the 1930s, the first of which was related to the Great Depression.
The stock market turbulence in early February 2018 interrupted a protracted, though not unusually long, period of low volatility. Growing uncertainty among market participants about the future course of monetary, fiscal and foreign trade policy in the United States may have been among the main drivers of recent spikes in estimated and expected market volatility, the latter represented by the options price-based Volatility Index (VIX) (see Chart B). While US stock prices fell by about 6.5% in one week, estimated volatility and the VIX surged to levels of 25% and 32%, respectively. However, volatility receded quickly, dropping to levels of around 12% for estimated volatility and 14% for the VIX at the end of the review period.
Chart B
Is the market heading towards a period of sustained higher volatility?
Estimated stock returns volatility and the VIX during different volatility regimes
(Jan. 2007 – May 2018, weekly data; annualised volatilities in percentages; regimes with the highest probability shaded)
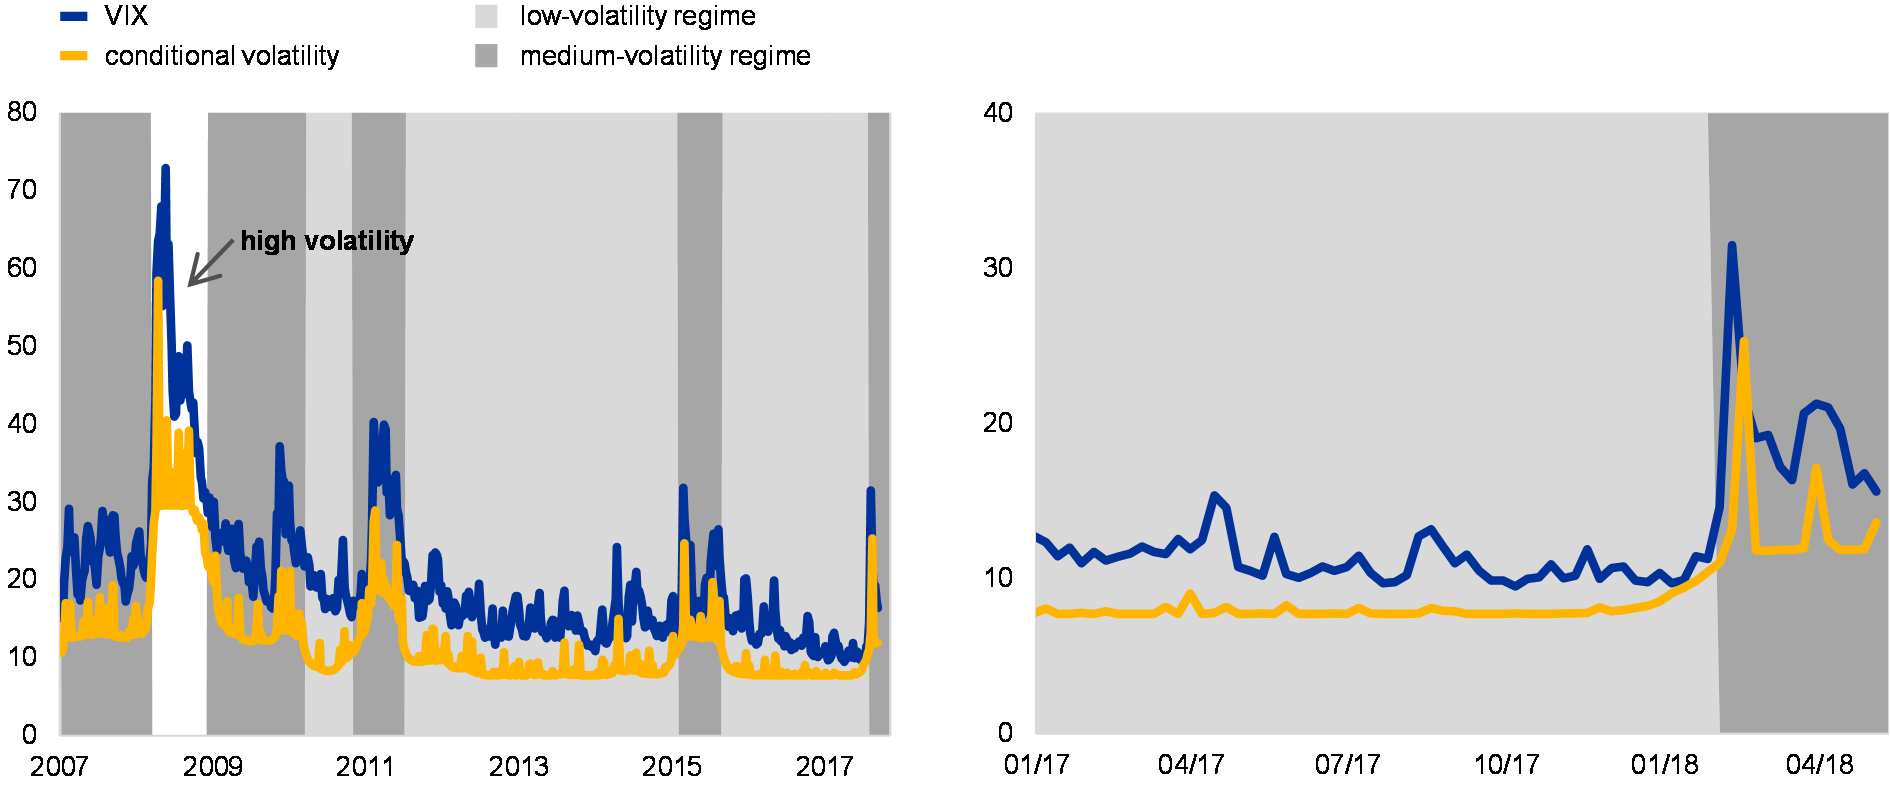
Sources: Federal Reserve Economic Data (FRED) and ECB calculations.
Note: The estimated volatility series is computed as the square root of the probability-weighted average of regime-specific annualised conditional variances.
The regime-switching model suggests that the recent bout of turbulence did not bring about a shift towards a high-volatility regime. This notwithstanding, the turbulence caused a shift from a regime of low volatility to one of medium volatility. Accordingly, the probability of a medium-volatility regime increased from below 1% at the end of November 2017 to around 75% from early February 2018 onwards. The increased likelihood of a medium-volatility regime also raised the odds of extreme market turmoil, from practically zero at the end of 2017 to close to 1% by mid-May 2018. All in all, this box suggests, when taking a long-term historical perspective, that the most recent gyrations in US stock market volatility did not bring about a clear shift towards a regime of extremely high volatility, but they may still indicate heightened risks of higher volatility going forward in the United States and elsewhere in the world. From a financial stability perspective, a move to only moderately higher average volatility can be considered as a welcome normalisation.
The proliferation of short-volatility strategies highlighted by this episode illustrates the extent of search for yield. The protracted low-volatility environment is likely to have incentivised risky yield-enhancing strategies. These include short-volatility trades involving the selling of call options for assets whose price is seen as expected to move in one direction only. Chart 2.4 suggests that such strategies may have been employed in the case of the VIX. When the VIX is low, the number of call contracts sold relative to puts on the VIX index increases, which may also reflect call options sold under the expectation that the options would expire without being exercised. The February spike also illustrates the procyclicality of such strategies: sellers of such options probably compounded the buying pressure on VIX futures.[19] Similar strategies may be employed in other, larger markets.
Chart 2.4
The higher ratio of call options to put options on the VIX during periods of low volatility may signal speculative actions
The VIX and the call-to-put ratio for options on the VIX
(Feb. 2006 to Feb. 2018, level of the VIX and the call-to-put ratio)
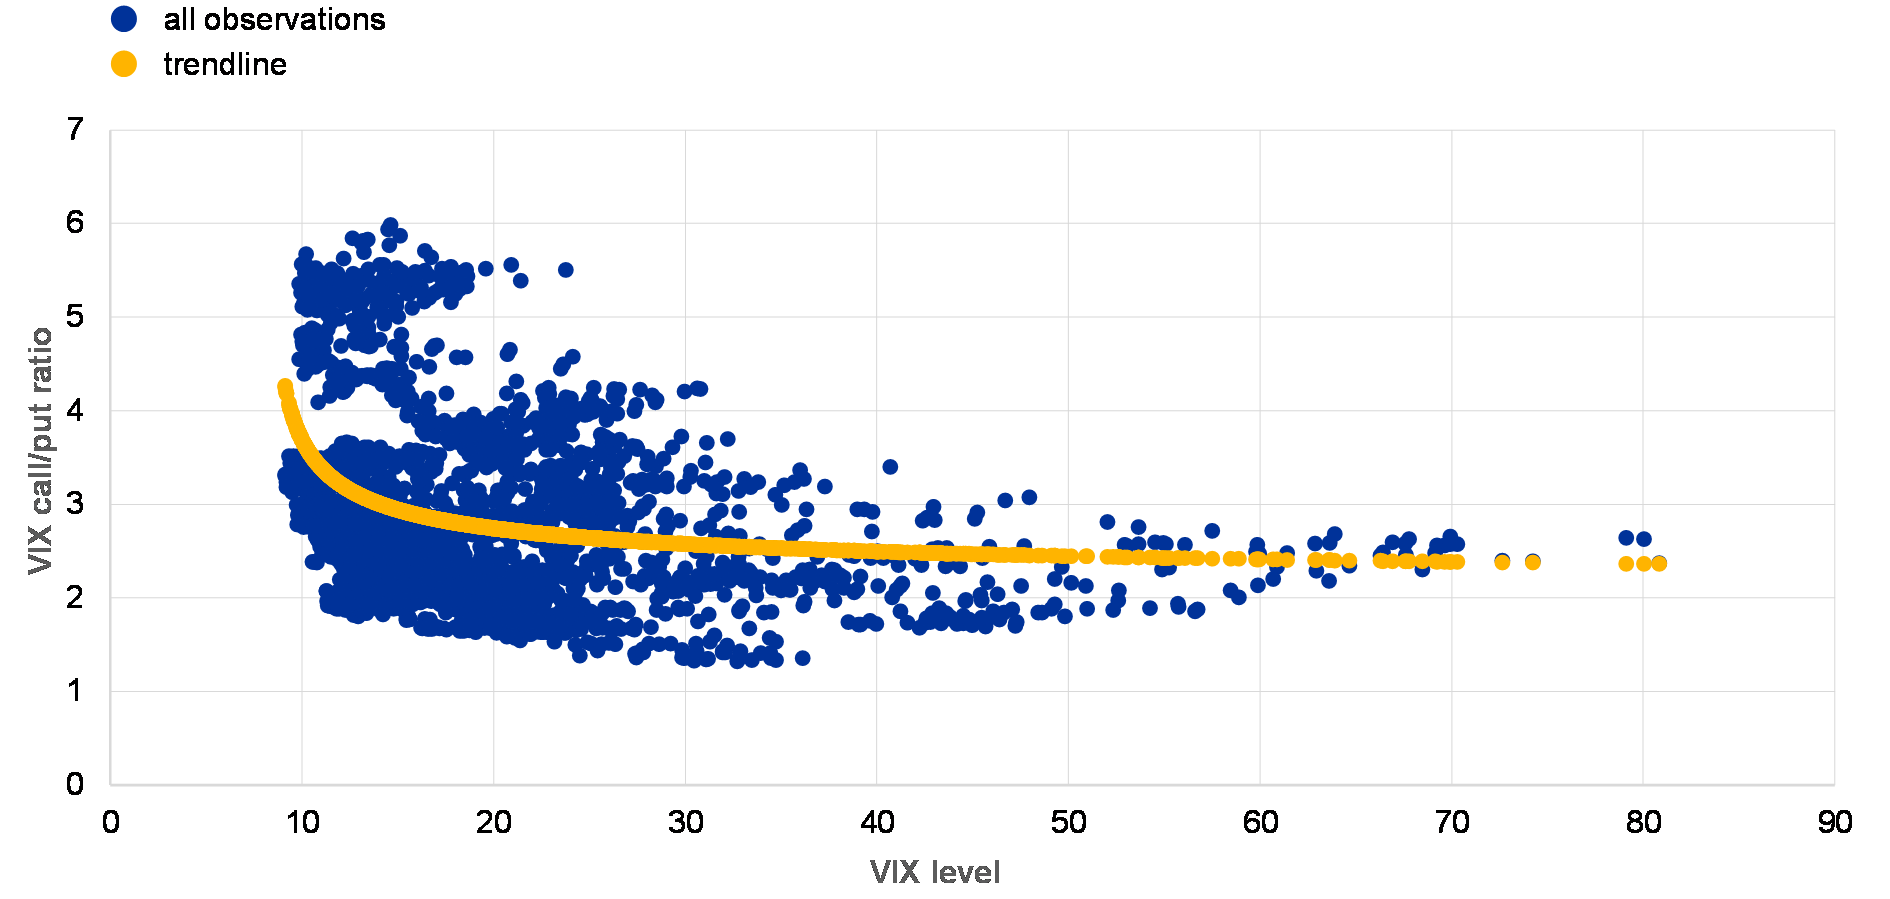
Sources: CBOE and ECB calculations
Note: The call-to-put ratio is computed as the 60-day moving average of the daily ratios.
Shifts in post-crisis risk management of investment portfolios may increase the risk that short-term spillovers will snowball into larger ones. The recent growth of risk management strategies seeking to protect portfolios from the types of losses experienced during the crisis may have increased the risk of contagion. Some funds employ risk parity strategies where the underlying asset classes contribute equally to the overall portfolio volatility; others target a certain constant portfolio volatility level. Some strategies also employ leverage to boost returns. Chart 2.5 shows the pro-cyclical behaviour of such an index that can lever up to 1.5 times and rebalances daily. Such an index levers up when market volatility is low, typically in rising equity markets, and delevers when volatility increases, typically in declining equity markets, thereby acting procyclically.
Chart 2.5
The increasing use of volatility controlling strategies can lead to pro-cyclical behaviour and exacerbate market movements
Comparison between S&P 500 index and a risk control index based on the S&P 500
(Jan. 2013 to May 2018; index: 3 January 2013 = 100)
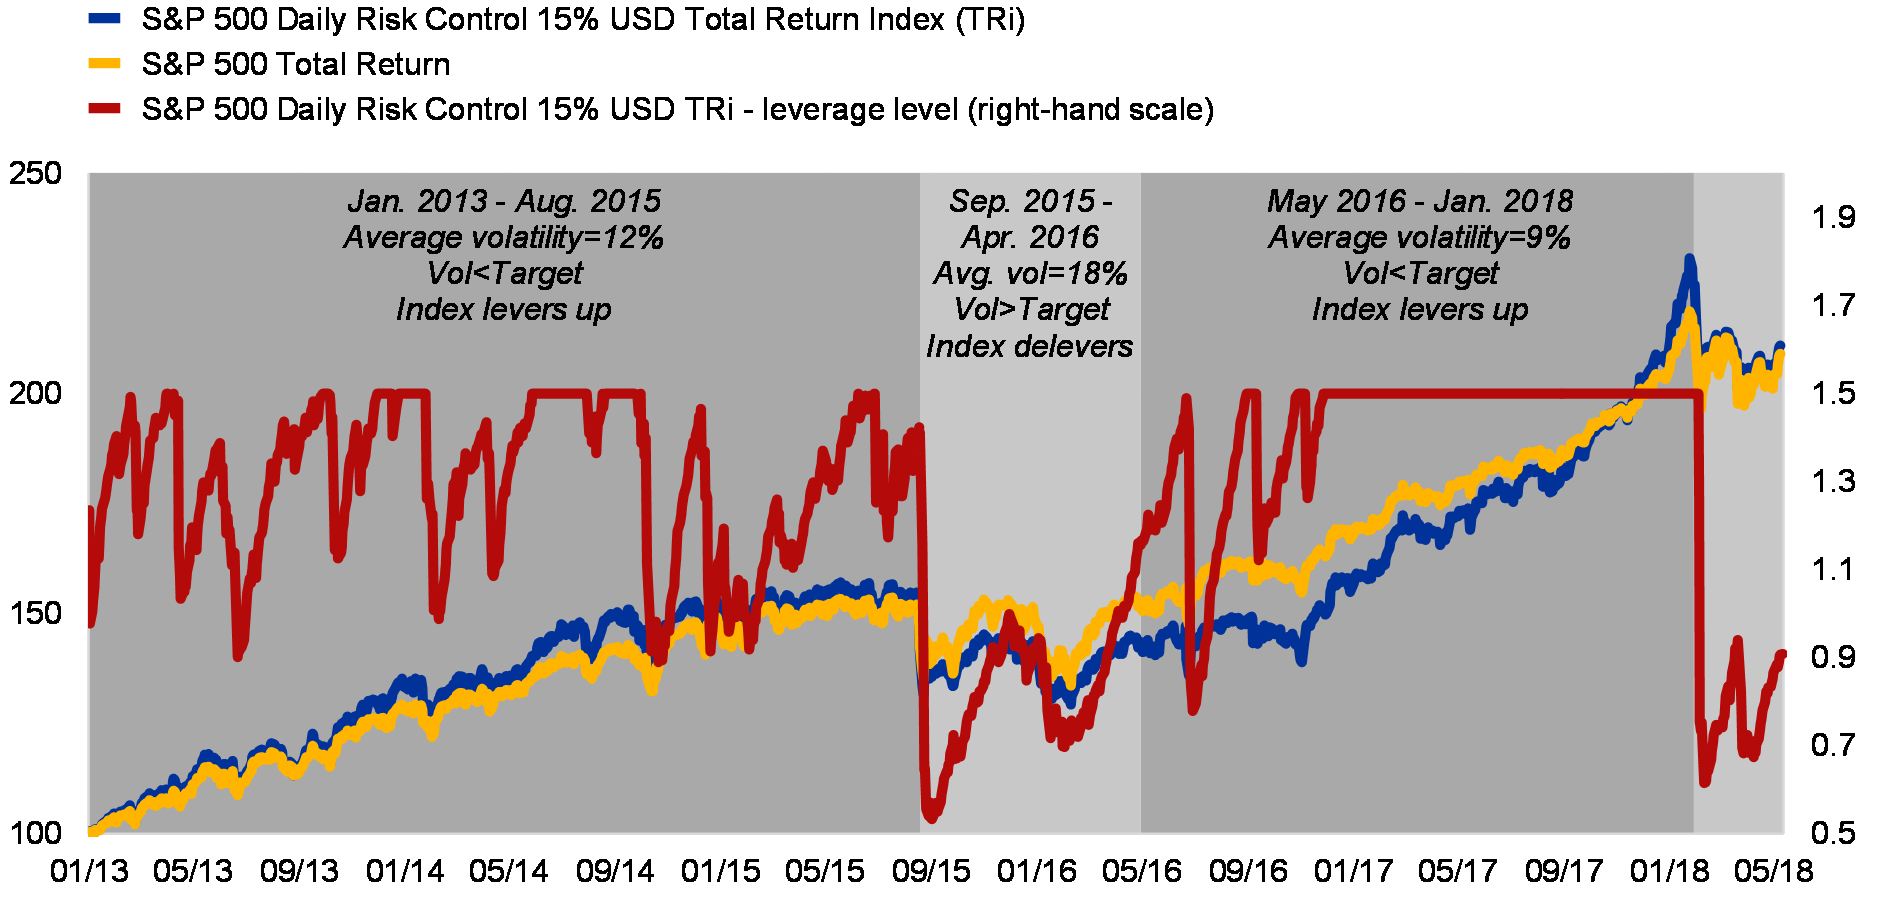
Sources: S&P, Bloomberg and ECB calculations.
Notes: The S&P 500 Daily Risk Control 15% USD Total Return Index has a target volatility of 15% and can lever up to 1.5 times; it rebalances daily. During January 2013 and August 2015, when the S&P 500‘s realised volatility was mostly below target, the total return index mostly levered up and outperformed the equity index. When volatility increased to or above the target, such as between September 2015 and April 2016, the index delevered below 1. Between May 2016 and January 2018, a period with mostly very low volatility, the index levered up for most of the time and outperformed the market, before sharply delevering to levels below 1 following the volatility surge in February.
Despite some repricing, valuations remain stretched in some markets
While there are no general misalignments across asset classes in the euro area, pockets of overvaluation are visible in certain segments and in some foreign markets. In the euro area, valuations appear stretched in the riskier segment of the non-financial corporate credit market and in prime commercial real estate. Beyond the euro area, US equities also have very high valuations by historical standards. Globally, some asset classes appear to be “priced to perfection”. This reflects several factors. First, growth expectations in several major countries have exceeded expectations. Second, the US tax reform has provided impetus to financial markets and to risky assets in particular. Third, markets seem to have taken comfort from central banks’ very gradual exit from accommodative monetary policies. Fourth, significant amounts of funds appear to be available for deployment in an environment of already low returns.
Chart 2.6
Credit spreads of European high-yield bonds and leveraged loans have declined significantly recently
Evolution of European high-yield bond credit spreads by rating category and of European leveraged loan spreads
(Jan. 2006 to May 2018, basis points)
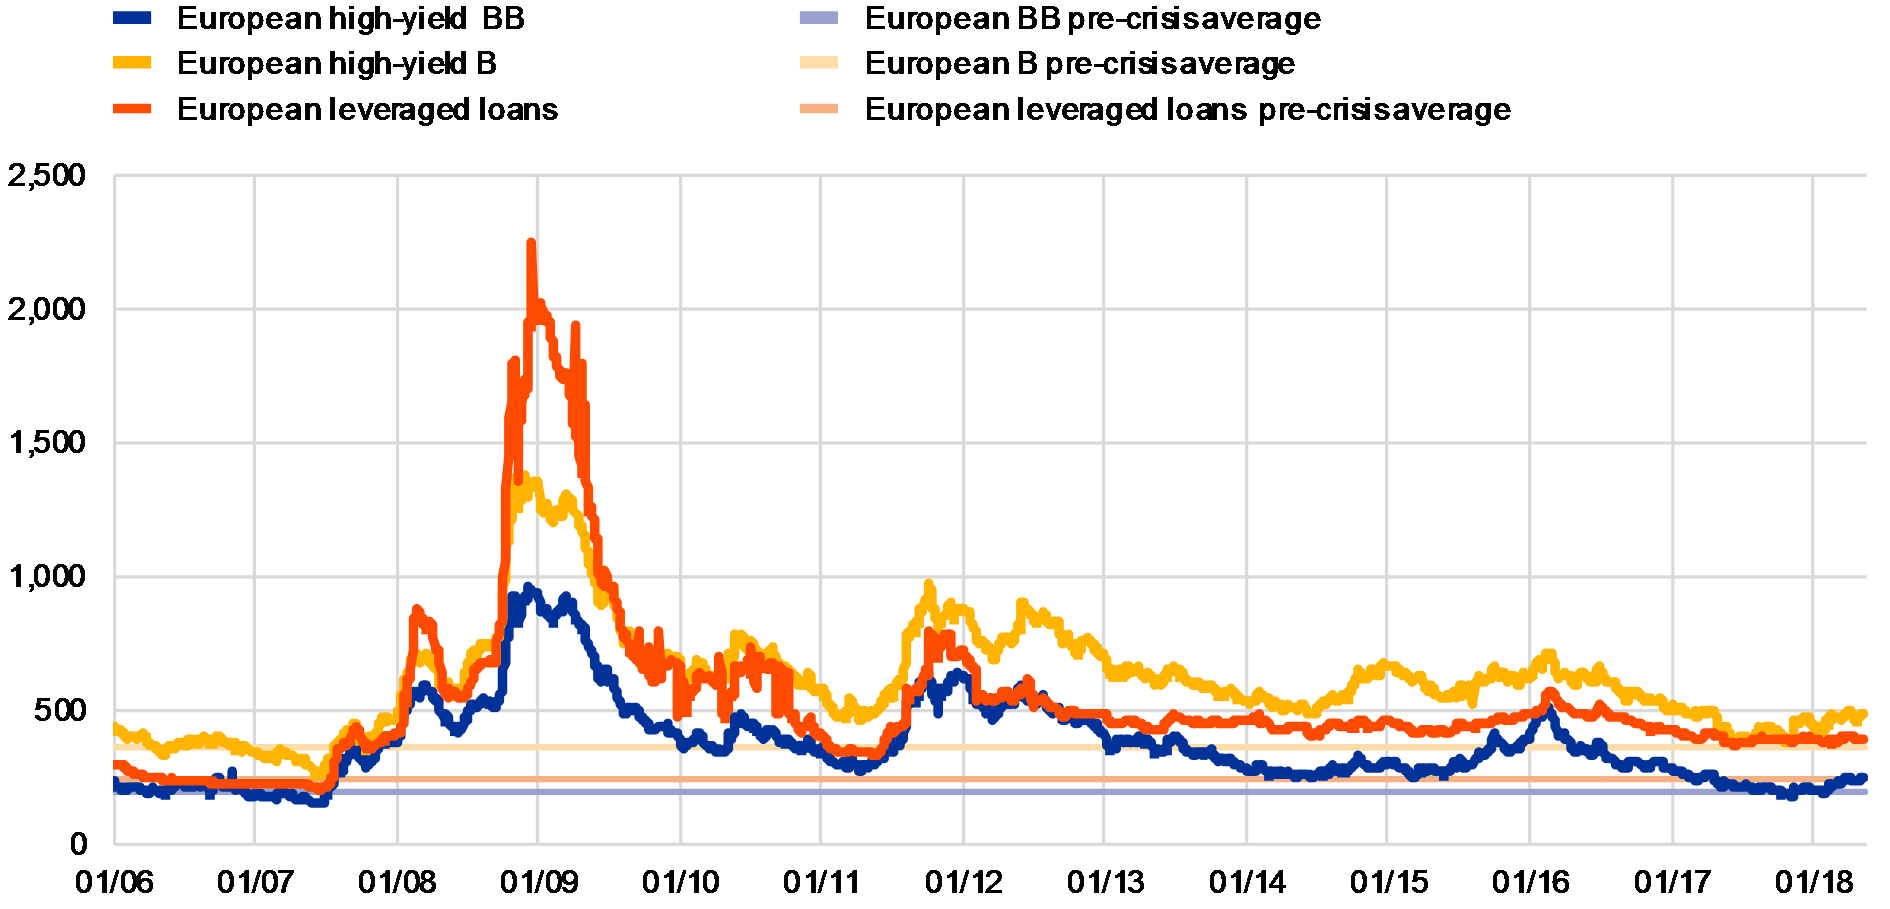
Sources: Thomson Reuters and ECB calculations.
Notes: The credit spreads for European high-yield B and BB-rated bonds represent asset swap spreads for the iBoxx EUR High Yield main Non-Financials ex crossover B and iBoxx EUR High Yield main Non-Financials ex crossover BB indices, respectively. The European Leveraged Loan Index shows the discount spread for the Thomson Reuters’ Top 40 Leveraged EMEA index. Pre-crisis levels are computed as the simple average of daily spreads between Q4 2005 and Q1 2007.
The search for yield is particularly evident in the markets for riskier credit. Spreads of BB European high-yield non-financial corporate bonds are at the average levels seen just before the crisis (Chart 2.6). The excess bond premium – defined as the difference between the credit spread required by investors and that implied by credit ratings – is negative and is low for European high-yield non-financial corporates by historical standards, despite having somewhat decreased following the widening of credit spreads after February (Chart 2.7). Similarly, European and US leveraged loan markets show signs of overvaluation (see also Box 5). Frothiness in this market segment is also evident in looser terms and conditions and in aggressive structuring practices.
Chart 2.7
There are signs of overvaluation in European high-yield bond markets
Excess bond premia in European investment-grade (left panel) and high-yield (right panel) non-financial bond markets
(Jan. 2004 to Apr. 2018; basis points)
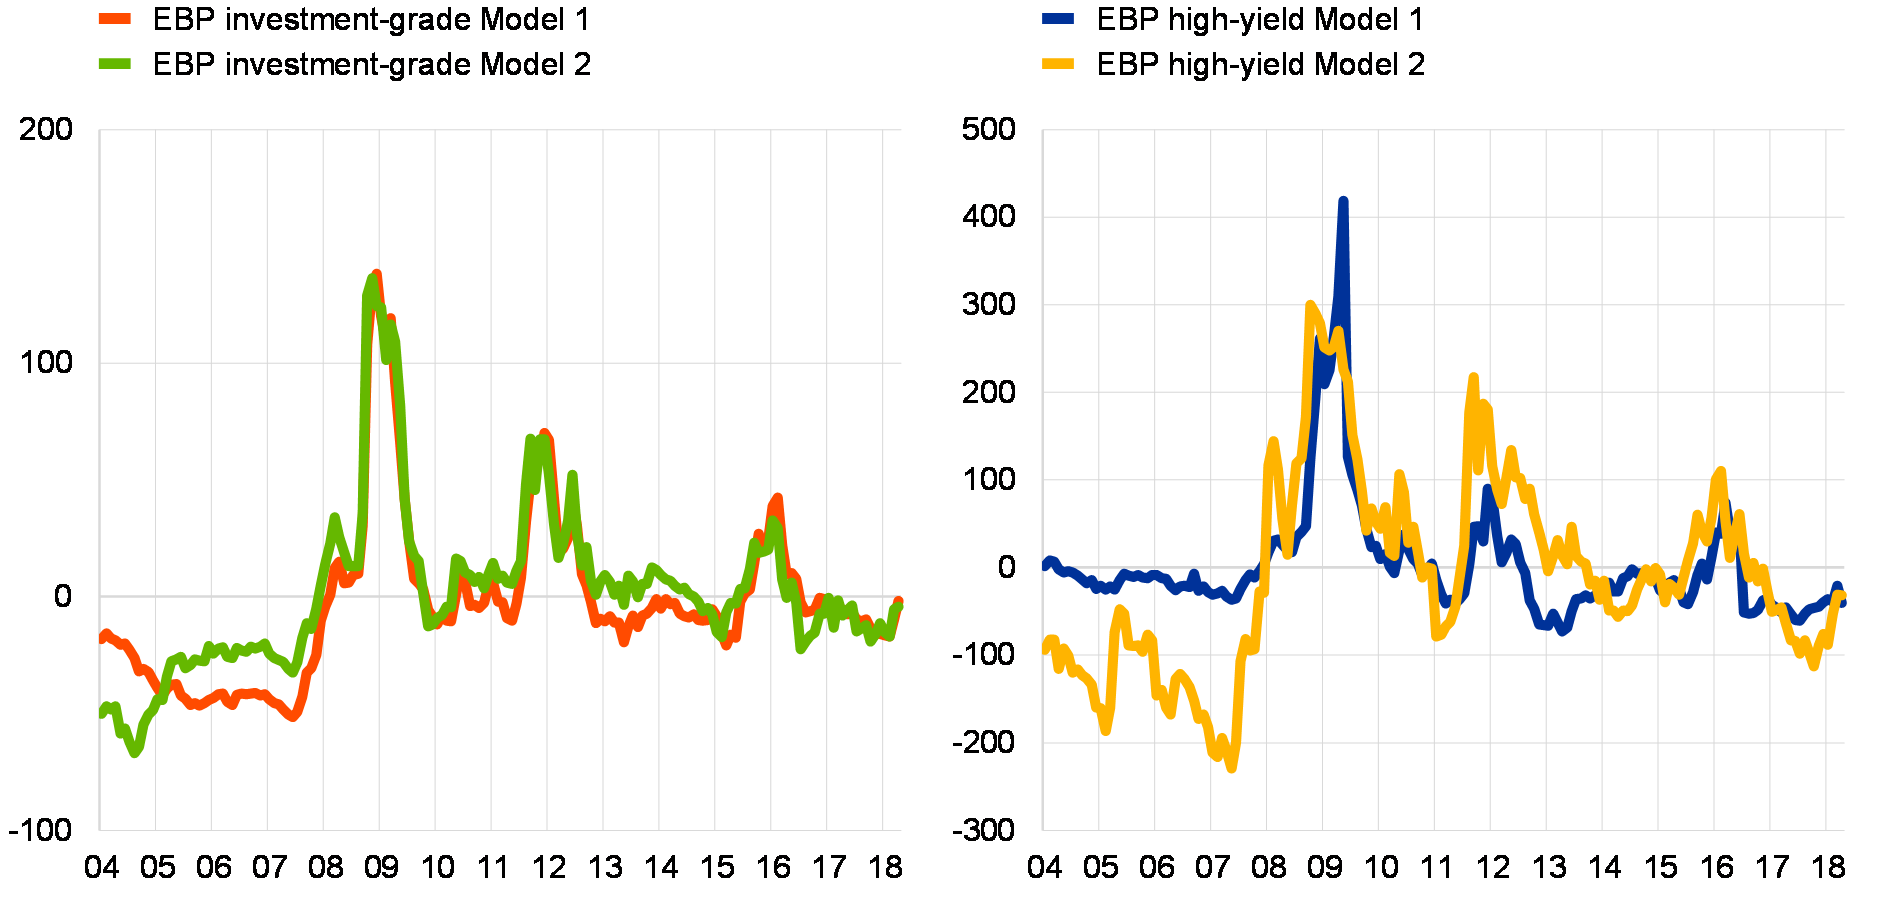
Sources: Bank of America Merrill Lynch, Bloomberg, Moody’s and ECB calculations.
Notes: The excess bond premium (EBP) assesses the difference between the bond asset swap spreads derived from market levels and measures of credit risk at individual bond level. A negative EBP suggests that market-derived credit spreads are lower than model-derived ones. The EBP under Model 1 follows Altavilla, C., Darraq Paries, M. and Nicoletti, G., “Loan supply, credit markets and the euro area financial crisis”, Working Paper Series, No 1861, ECB, 2015. The EBP under Model 2 follows De Santis, R., “Credit spreads, economic activity and fragmentation”, Working Paper Series, No 1930, ECB, 2016.
The cyclical upturn in euro area residential property markets gathered further momentum, but there are no signs so far of large and widespread misalignments. Bolstered by the low interest rate environment and the ongoing robust economic expansion, euro area residential property markets expanded at the highest rate since mid-2007 in the latter half of 2017. Developments across the euro area have continued to become more broad-based, with all euro area countries apart from Greece and Italy exhibiting positive annual rates of change in residential real estate prices (see Chart 2.8). In terms of valuations, euro area residential property prices are estimated to be slightly overvalued on aggregate. Still, the degree of uncertainty surrounding these estimates is large and developments are heterogeneous across countries and in some cases across regions within a country, largely depending on the depth and length of the correction phase in the aftermath of the crisis in each country, if any. Potential pockets of risk warrant closer monitoring in some countries, in particular if brisk house price developments are also mirrored by exuberance in credit (see Section 1.3) and the build-up of household debt. Macroprudential policies may help mitigate possible risks to financial stability at the country level.
Chart 2.8
On aggregate, euro area residential property prices are slightly overvalued, but cross-country dispersion is high
Valuation estimates and annual growth in residential property prices across the euro area
(Q3 2017; percentages; annual percentage change)
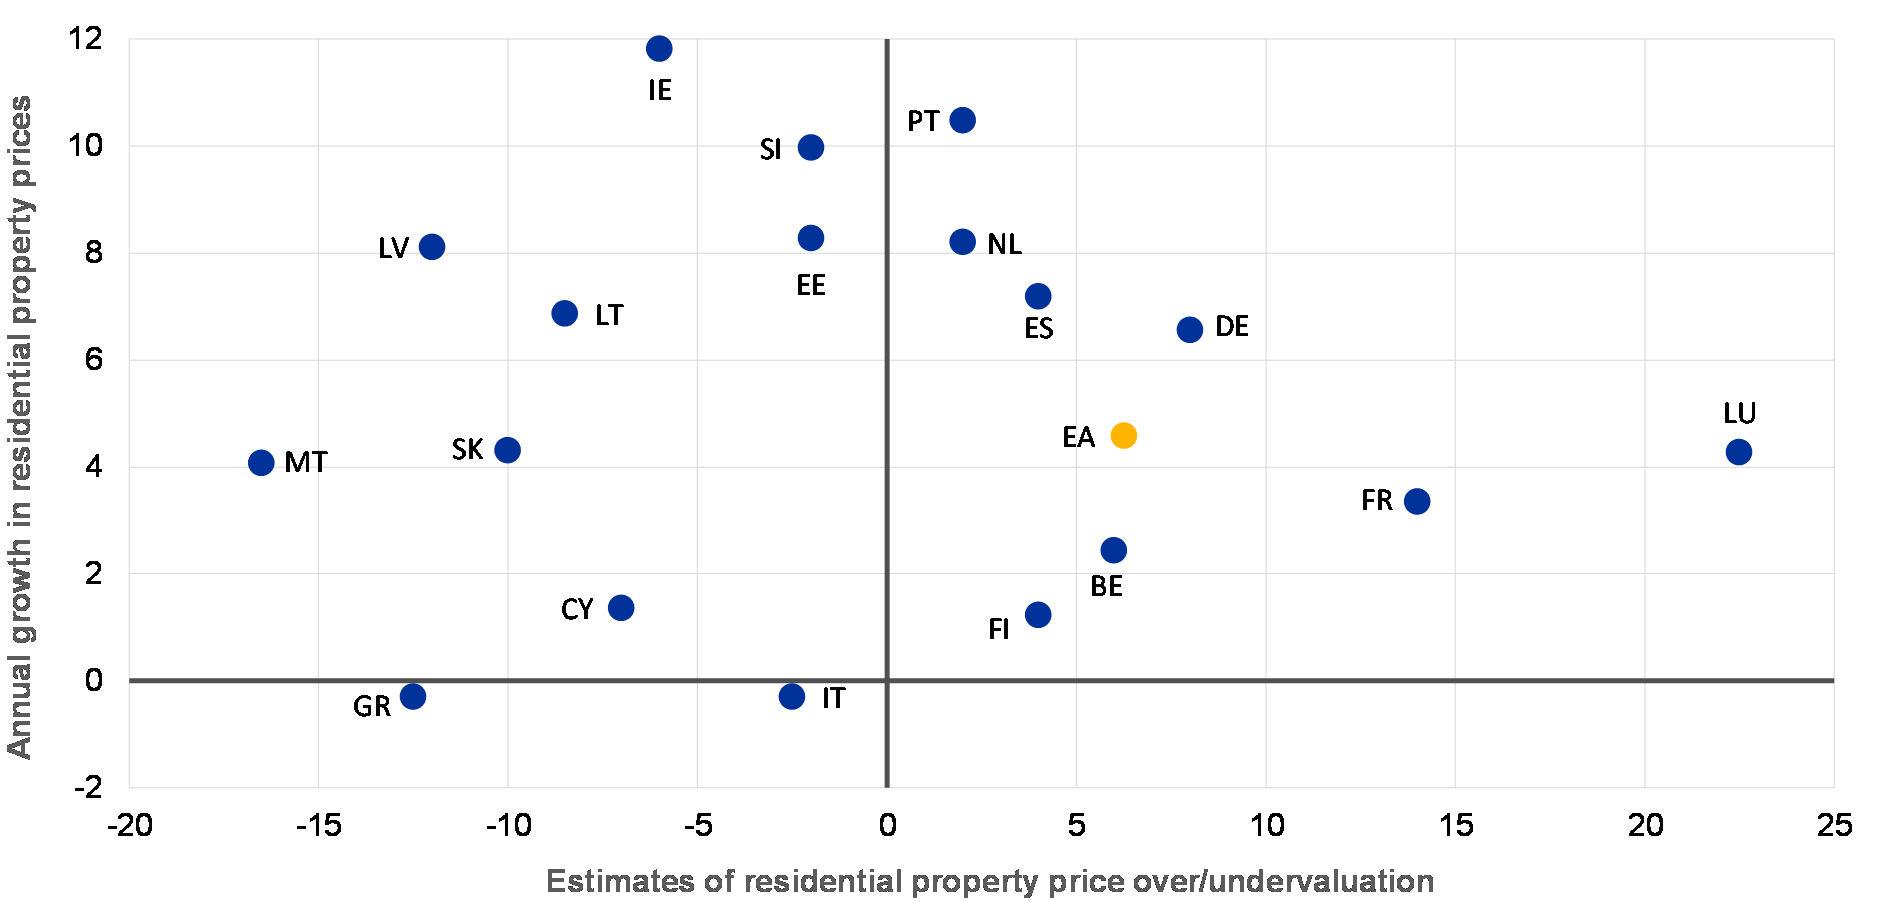
Sources: ECB and ECB calculations.
Notes: The valuation estimates for residential property prices are based on two different valuation methods: the price-to-income ratio and a model-based estimate (Bayesian inverted demand model). For details of the methodology, see Box 3 in Financial Stability Review, ECB, June 2011, and Box 3 in Financial Stability Review, ECB, November 2015. Valuation estimates are surrounded by a high degree of uncertainty, while their interpretation may be complicated at the country level, given national specificities like fiscal treatment or structural factors (e.g. tenure status).
Euro area commercial property markets have seen continued price growth, with signs of overvaluation in some segments. Commercial property price dynamics point to a continued bifurcation between relatively muted developments in the non-prime segment and strong price increases in prime markets (see Chart 2.9). Price developments in the prime retail segment have remained particularly ebullient in the context of the current low-yield environment and the ongoing search for yield. As in residential property markets, cross-country price variation has also continued to fall in prime commercial property markets as the adverse repercussions of multi-year corrections gradually recede at the country level. Overall, continued strong price increases have pushed euro area prime commercial real estate prices to new historical peaks, which points to overvaluation.
Chart 2.9
Buoyant developments in euro area prime commercial property markets, driven mainly by the retail segment
Commercial property price indices
(Q1 2015 – Q4 2017; index: Q1 2015 = 100)
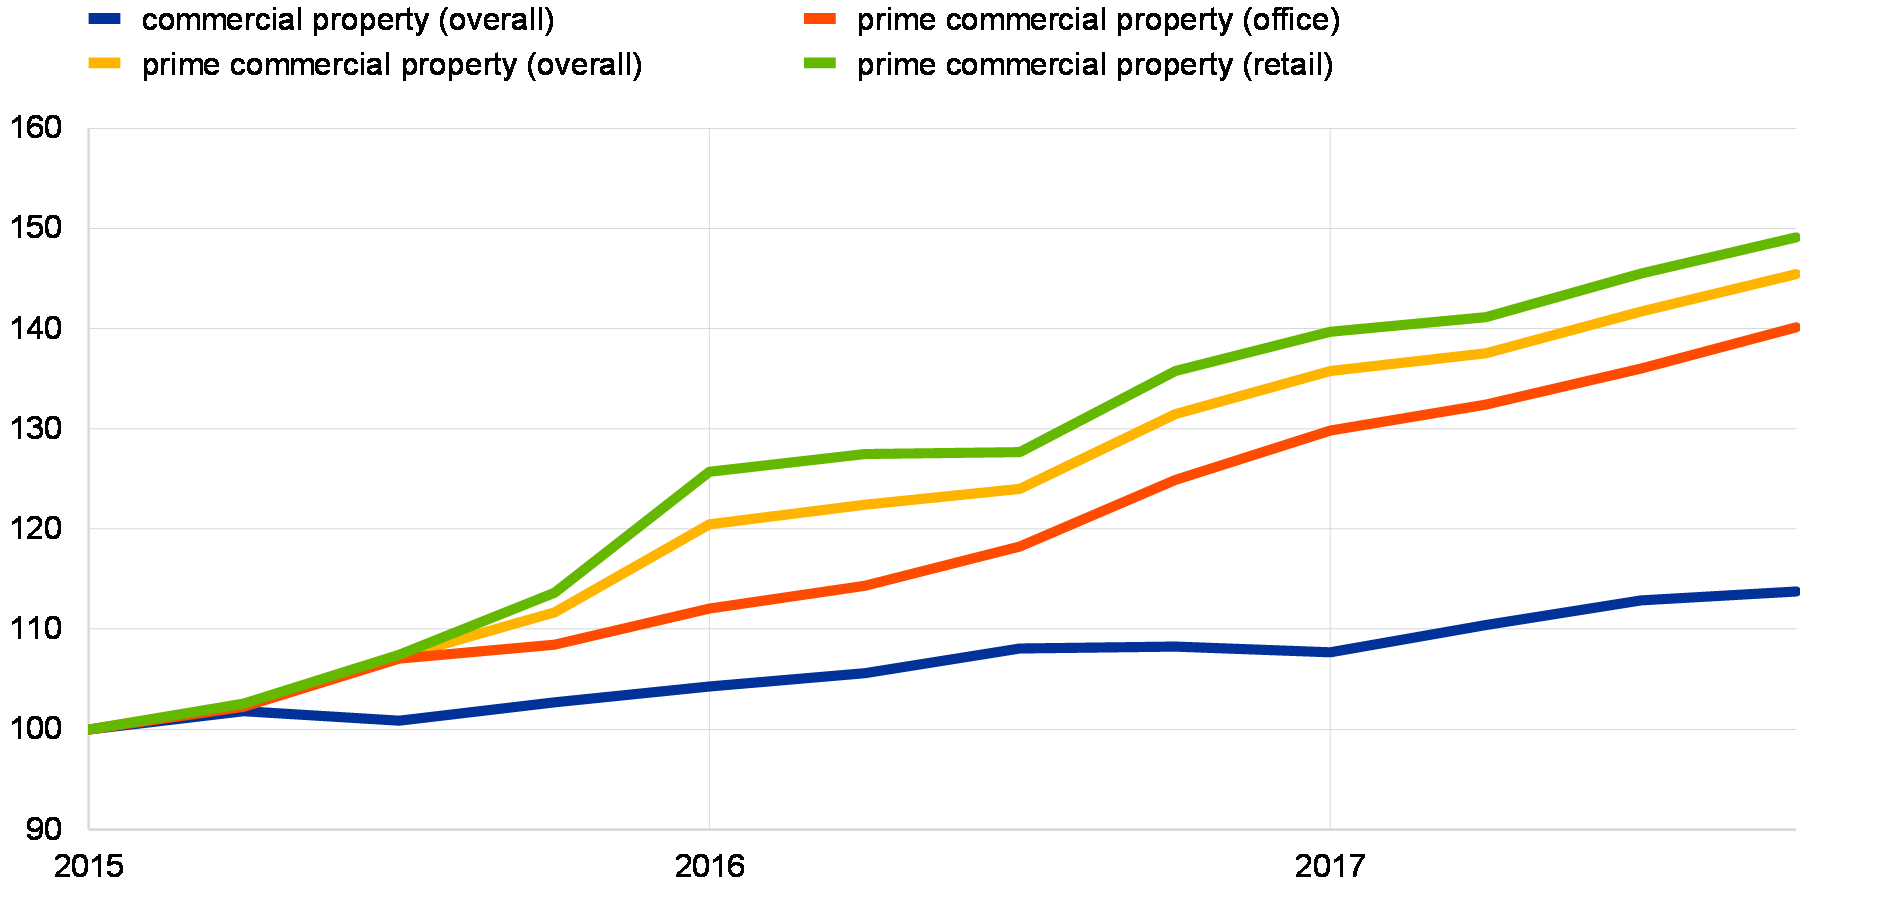
Sources: Jones Lang Lasalle and experimental ECB estimates based on MSCI and national data.
Note: Retail establishments include inter alia restaurants, shopping centres and hotels.
Valuations of US equities continue to be high. US equity valuations remain high, based on historical comparisons across several indicators (Chart 2.10). The valuation of European equities is, however, more in line with historical levels. The drivers of the recent equity price performance in the euro area and in the United States are discussed further in the last part of this chapter, which reviews market developments.
Chart 2.10
US equity valuations continue to be high by historical standards
Current values and historical distribution of accounting-based equity valuation metrics
(1985 to May 2018; ratios)
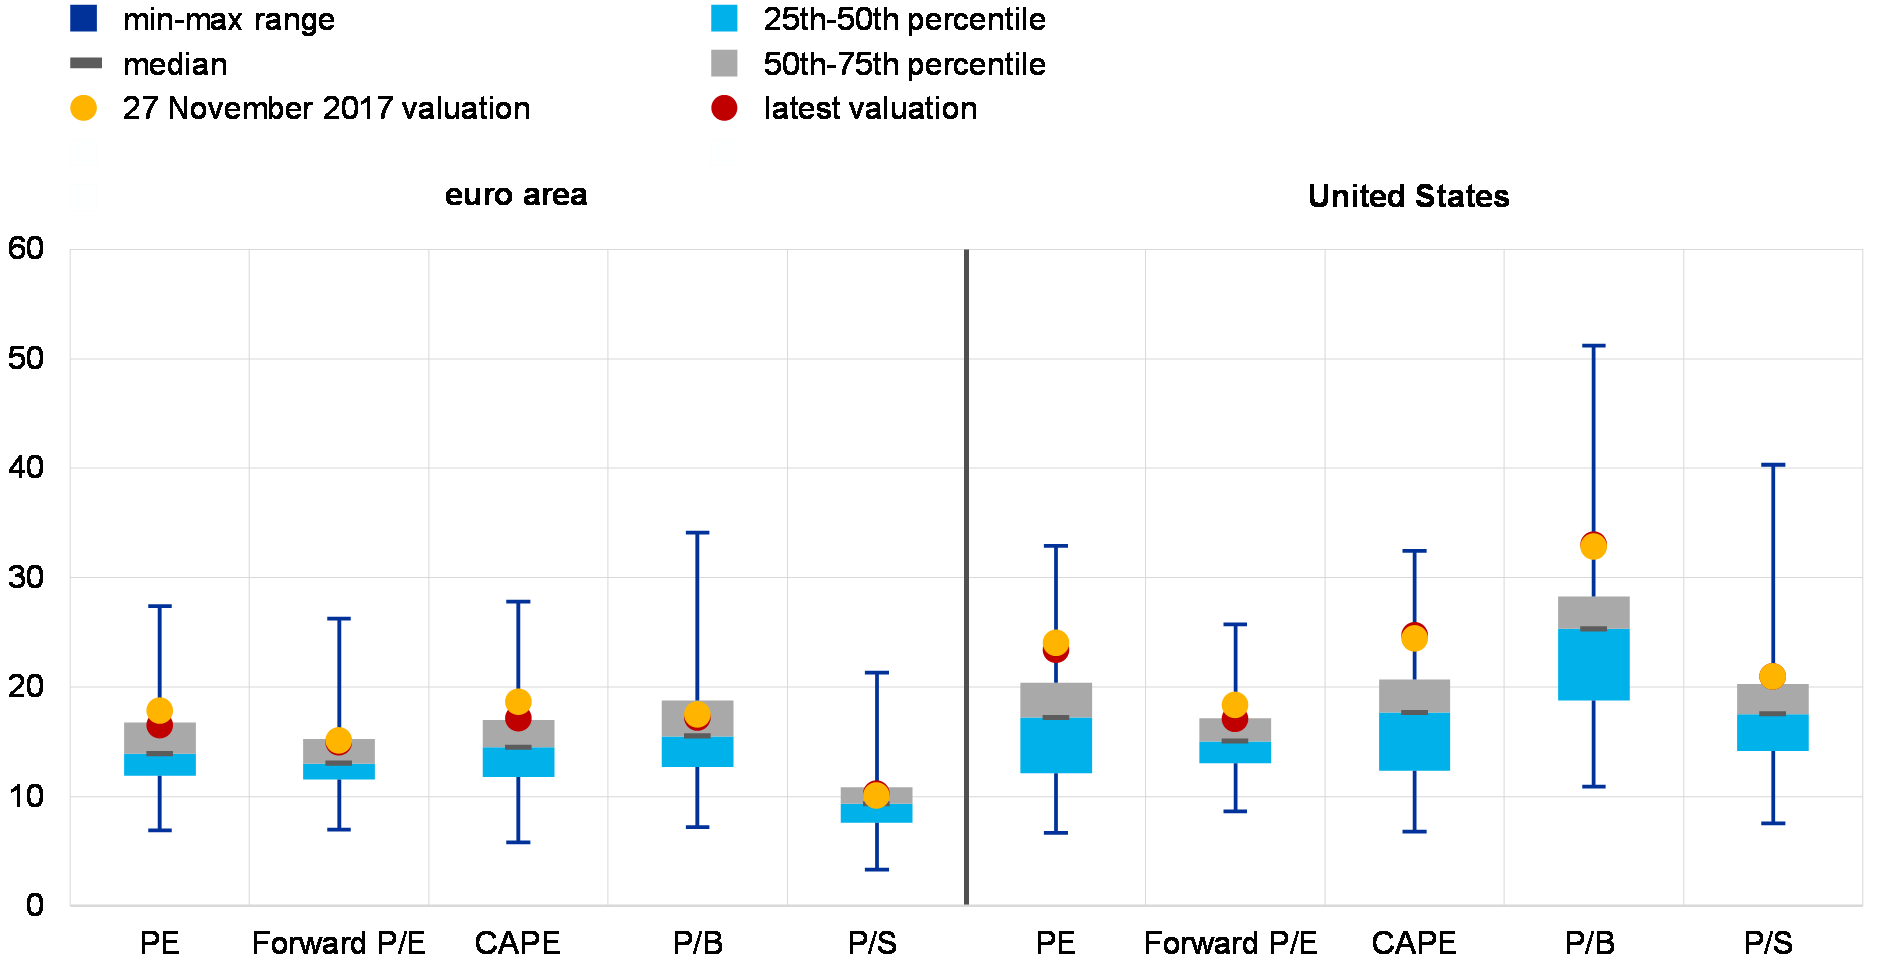
Sources: Thomson Reuters and ECB calculations
Notes: Valuation metrics have been recorded monthly since 1985, except for the forward-looking price/earnings (P/E) ratio for the euro area, which is available since 1989. The price-to-book (P/B) ratio and the price-to-sales (P/S) ratio are multiplied by a factor of ten. The latest observation is for 15 May 2018.
Nominal yields for longer-term government bonds in the euro area remain low, mainly on account of compressed term premia. At face value, a zero or negative term premium would imply that investors have full insight into the expected path of both monetary policy and inflation. Historically, investors have required some compensation for these risks. The decline in the euro area term premium (Chart 11 in the Overview) can be explained by increased investor certainty around the future path of euro area policy and inflation rates, increased demand for government bonds driven by regulatory requirements such as the liquidity coverage ratio (LCR), and by the ECB’s expanded asset purchase programme (APP).[20] The pricing of the term premium is discussed further in the last part of this chapter.
The magnitude and intensity of the search for yield in recent months has also been reflected in more exotic assets, such as crypto-assets. As discussed in Box 4, the combined valuation of crypto-assets increased fivefold over the last two quarters of 2017, before plunging significantly – with bitcoin losing almost two thirds of its value between January and February this year. Such price volatility reflects the largely speculative nature of investment in these assets. While not posing a financial stability risk, owing to their limited use so far, crypto-assets could pose financial stability concerns in the future if their use becomes more widespread.
Box 4
Financial stability implications of crypto-assets
This box assesses potential financial stability concerns related to the rapidly growing market for crypto-assets. Crypto-assets (e.g. bitcoin, ether and ripple) are a new, innovative and high-risk digital asset class.[21] Recent price developments and market interest in crypto-assets have given rise to concerns about potential financial stability implications. This box presents key facts on crypto-assets, concluding that they do not currently pose a material risk to financial stability in the euro area, but warrant careful monitoring.
Chart A
Market capitalisation of crypto-assets remains modest despite price developments that are more extreme than those of historical bubbles
Total market capitalisation of crypto-assets as a percentage of FAANG, euro area GDP and past bubbles (left panel) and price changes before and after peaks for bitcoin and historical bubbles (right panel)
(left panel: percentages; 15 May 2018 for crypto-assets and FAANG, Q1 2018 for euro area GDP, market peaks for the dot-com bubble and sub-prime mortgage-backed securities; right panel: index; three years before peak = 1; three years before to one year after peak)
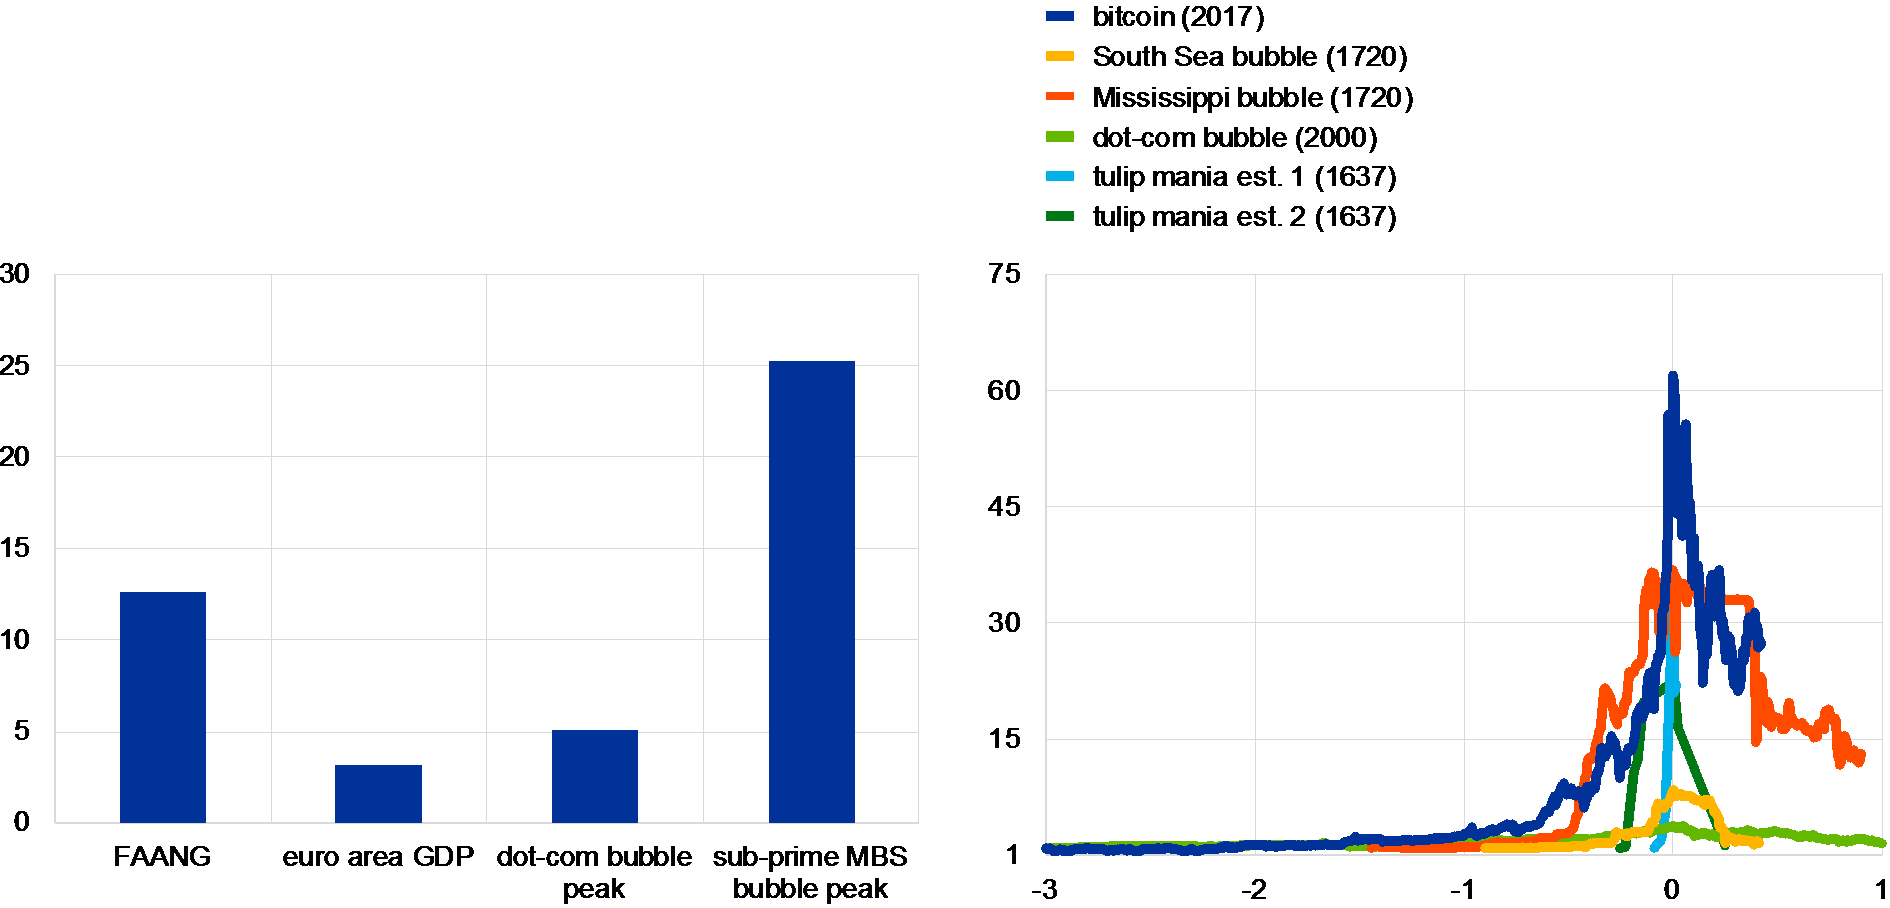
Sources: CoinMarketCap, Thomson Reuters, Haver Analytics, Sifma, Yale School of Management, ECB and ECB calculations.
Notes: Left panel: “FAANG” refers to Facebook, Apple, Amazon, Netflix and Google. The dot-com bubble peak refers to the level of the NASDAQ in March 2000 and the sub-prime peak to 2006. Sub-prime market size is defined as the sum of sub-prime, non-prime and Alt-A US non-agency residential real estate securities. Right panel: the chart shows price evolution, starting from a level of three years before the peak, over a period of four years. Owing to uncertainty about data on the tulip mania, two separate estimates of the size of that bubble are displayed. The years of the peaks are shown in brackets.
Crypto-asset markets have grown more than fivefold in size since July 2017, but they are still small compared to other asset markets. Despite the recent correction to an aggregate valuation of €330 billion from a peak of €680 billion, the market capitalisation of crypto-assets remains modest compared to the market capitalisation of top technology companies, euro area GDP or the size of historical bubbles (see Chart A, left panel). Of the around 1,600 crypto-assets currently in circulation (up from seven in April 2013), bitcoin remains the largest in terms of market capitalisation. Nonetheless, its prominence has decreased in recent months and it now accounts for less than 40% of the market capitalisation of all crypto-assets.
Bitcoin’s growth surpassed that of other historical bubbles before it crashed in early 2018, losing 65% of its value (see Chart A, right panel). The extreme price developments of bitcoin – with much higher volatility than that observed for traditional asset classes and commodities – mirror similar price changes across the crypto-asset universe. This highlights the poor suitability of these assets as a reliable store of value, useful medium of exchange or efficient unit of account.
Crypto-assets do not currently appear to pose a material risk to financial stability in the euro area. Overall market exposure appears to be modest, correlations with other markets are very low and interlinkages with the financial system and the real economy remain rather limited. Although a significant share of bitcoin’s trading volume is settled in euro (around 12% since the beginning of 2018, see Chart B), anecdotal evidence suggests that financial institutions have refrained from acquiring sizeable exposures to crypto-assets. Furthermore, ownership of bitcoin is highly concentrated, which implies that losses from drastic price corrections, such as in the recent crash, are confined to a rather small group of investors.[22]
Chart B
Bitcoin trading cleared in euro hovering around 12% since January 2018
Clearance of bitcoin trading volumes by currency
(percentages; 23 Jan. 2017 – 14 May 2018; weekly data)
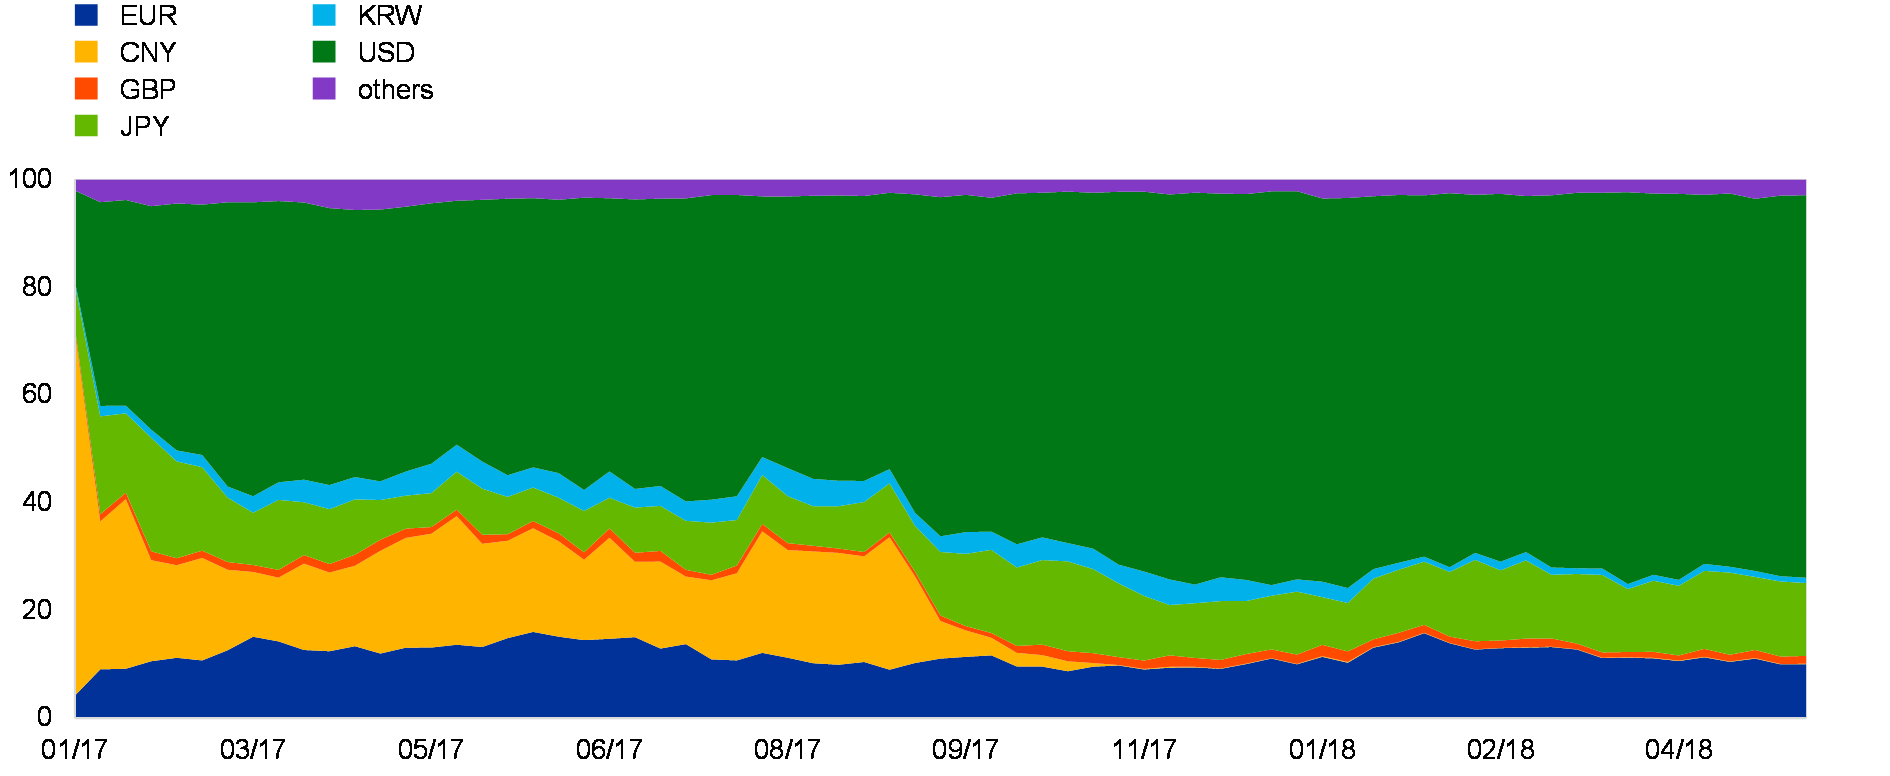
Sources: Bitcoinity.org and ECB calculations.
Notes: Trading volume data based on aggregated information from bitcoin exchanges. Since no provider aggregates all the exchanges, the true figures may be somewhat different. For example, CoinMarketCap quoted 8% of trading volume in euro on 8 March 2018.
Several sources of potential vulnerability do, however, exist. Anecdotal evidence from outside Europe suggests that some retail investors may be taking on debt to invest in crypto-assets and that some new start-up lenders are accepting crypto-assets as collateral for lending. Retail investors in various jurisdictions also reportedly buy crypto-assets on margin, with some exchanges providing leverage of up to 25 times the principal. Moreover, novel developments, such as regulated bitcoin futures markets in the United States, may increase interlinkages with the financial sector. Other investment vehicles, such as trusts, exchange traded notes (ETNs) and contracts for difference (CFDs), offer crypto-asset exposure to European clients, although their market size is still quite small.
No major regulatory action has been taken so far from a financial stability perspective. The scope of regulatory response has, however, expanded from its initial focus on the prevention of illicit activities, such as money laundering and terrorist finance, to consumer and investor protection and ensuring market integrity, as demonstrated, for example, more recently by the joint warning of the European Supervisory Authorities.[23]
The rapid evolution of the crypto-asset market warrants increased data collection and careful monitoring from a multitude of angles. These include: the potential entry by financial institutions into crypto-asset business by, for example, investing in these assets or providing related services; the use of crypto-assets as collateral; the provision of credit to individuals and firms investing in crypto-assets; and greater interlinkages with the rest of the financial system through crypto-asset derivatives trading and hedge fund/asset manager involvement. Coordinated data collection efforts are required to improve data gaps at both the EU and global level to facilitate effective monitoring and to prevent connections with the financial system from increasing to the point where crypto-assets could pose a risk to financial stability.
Vulnerabilities to a sharp repricing of risk are high and have increased
The repricing episode in February illustrates that the system remains vulnerable even to small shocks. The immediate market reaction, even if contained and partially justified as an overdue correction to the rapid gains in US equity markets, was disproportionate to the magnitude of the shock. While investors no longer expect a low-volatility environment going forward, it is unclear whether speculative strategies similar to those shorting volatility have been unwound in other larger markets that entail higher financial stability risks.
A sharp rise in US interest rates or the US dollar exchange rate may transmit stress abroad. In the latter part of the review period the US dollar exchange rate appreciated, in particular vis-à-vis the currencies of a few emerging market economies with high external vulnerabilities and domestic challenges on the fiscal and inflation fronts. However, as no wider emerging market sell-off occurred, the impact on the euro area was limited. Emerging market developments continue to require close monitoring with regard to their sensitivity to higher US yields and an appreciation of the dollar. A significant increase in US Treasury yields and the value of the US dollar going forward would imply a non-negligible risk of a wider sell-off in emerging economies’ financial assets, in particular in those economies with large net US dollar liabilities.
Compared to the November 2017 FSR, vulnerabilities stemming from financial markets have increased. Despite a pullback in some markets, the search for yield continued over the review period, with the valuation of certain asset classes becoming more stretched. As such, investors are remunerated less for potential losses. In addition, the probability of an abrupt repricing of risk has also increased. Potential triggers include increased geopolitical tensions and the possibility of escalating tensions over global trade.
Chart 2.11
Issuance of riskier non-financial corporate debt has been strongsince the crisis
Cumulative investment-grade and high-yield gross non-financial corporate debt issuance in the euro area between 2006 and 2017
(2006 to 2017; € billions)

Sources: Thomson Reuters, Dealogic, and ECB calculations
Notes: The issuance data sums up the primary market issuance of non-financial corporate bonds and loans. Investment-grade loan issuance represents gross primary market issuance of investment-grade syndicated loans; high-yield loan issuance represents gross issuance of leveraged loans, which are mostly syndicated. The cumulative issuance for US Alt-A and sub-prime mortgages covers the period 1996 to 2007.
The increasing exposure of euro area entities to lower-rated debt reflects the overall increase in high-yield corporate credit issuance compared to investment-grade debt. Euro area entities held directly €1 trillion of non-financial corporate bonds rated BBB or lower as of the third quarter of 2017, up 60% since the fourth quarter of 2013. This has occurred amid strong increases in issuance in the high-yield segment. Chart 2.11 shows that, taking into account non-financial corporate debt – both bonds and syndicated loans – high-yield gross debt supply over the period 2006-2017 has been around 40% that of the investment-grade debt in the euro area. In the United States, the cumulative high-yield gross debt supply is estimated to have accounted for an even larger share – about two thirds – of the cumulative gross debt issuance of investment grade corporate debt over the same period. This issuance, estimated at between €5 trillion and €8 trillion between 2006 and 2017, compares to cumulative gross issuance of US sub-prime and Alt-A mortgages of less than €3 trillion over the ten years preceding the crisis.[24] However, this comparison must be seen in the light of the different dynamics of the two markets and the fact that, particularly in the case of leveraged loans, the amount outstanding is likely to be significantly lower than the cumulative gross issuance owing to the large proportion of refinancing in gross debt issuance. In addition, since the crisis the leverage of non-financial corporates, measured as debt to EBITDA, has increased in Europe and, in particular, in the United States for both investment-grade and high-yield corporates (Chart 2.12 and Box 5). For European investment-grade corporates, the higher post-crisis leverage partly reflects the significant decline in earnings during the crisis. The increase is less significant when measured on a net, instead of a gross, basis, as European corporates generally have higher cash levels than they had before the crisis (see also Chart 1.21). Nevertheless, the higher than pre-crisis leverage leaves corporations with less flexibility should future earnings decrease unexpectedly.
Chart 2.12
Gross leverage for European investment-grade non-financial corporates has been increasing across all credit ratings
Gross leverage ratios for European non-financial corporates, by investment-grade rating
(2006 to 2017; ratios)
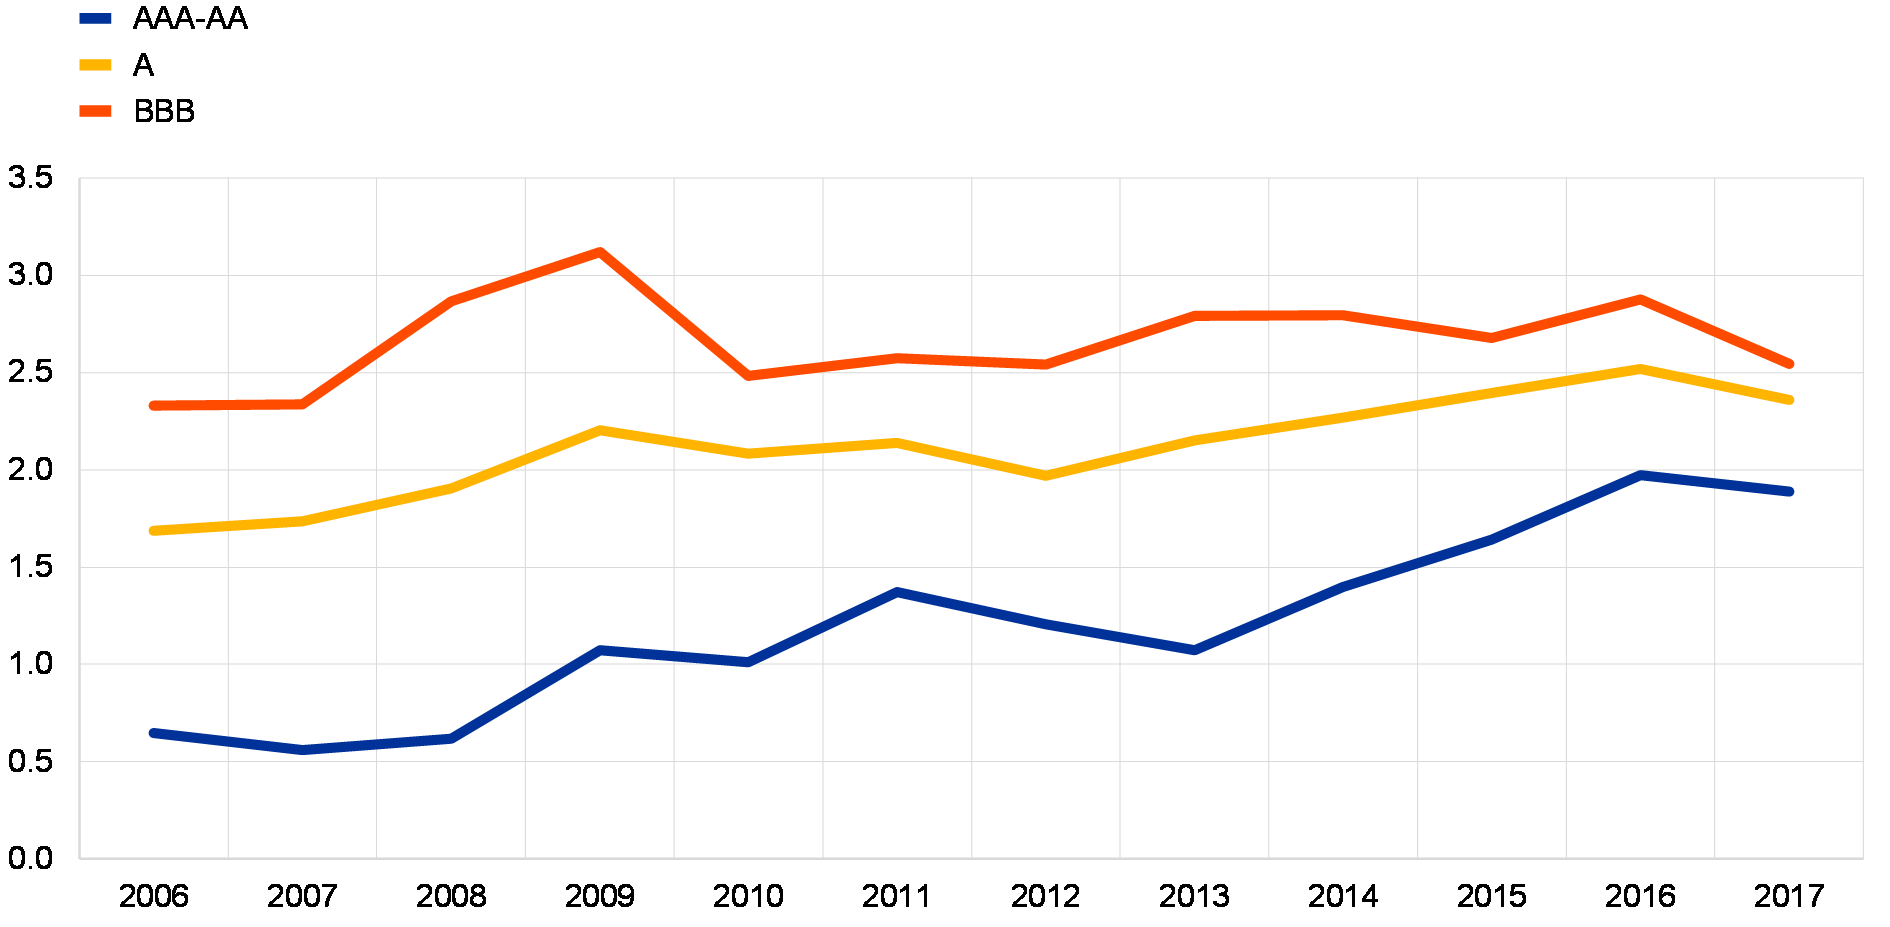
Sources: Bloomberg, Thomson Reuters and ECB calculations
Notes: Leverage is computed as gross debt to annual EBITDA using median values of a constant sample of 203 European corporates: nine AAA-AA, 71 A and 123 BBB.
Box 5
Leveraged loans: a fast-growing high-yield market
The market for leveraged loans is significant and recent developments may be generating financial stability risks.[25] In both Europe and the United States, the markets for leveraged loans issued by non-financial corporates are about five times larger than high-yield bond markets. In 2017 US leveraged loan issuance rose well above its pre-crisis levels, with gross issuance, depending on methodology and data source, estimated at between €500 billion and €1 trillion, while EU issuance, estimated at between €120 billion and €320 billion, is around the previous highs recorded in 2007 and 2014 (see Chart A).[26],[27]
Chart A
Since the crisis leveraged loan issuance has matched previous highs in the EU
Primary market gross issuance of non-financial corporate high-yield bonds and leveraged loans in the EU
(2006-2017; € billions)
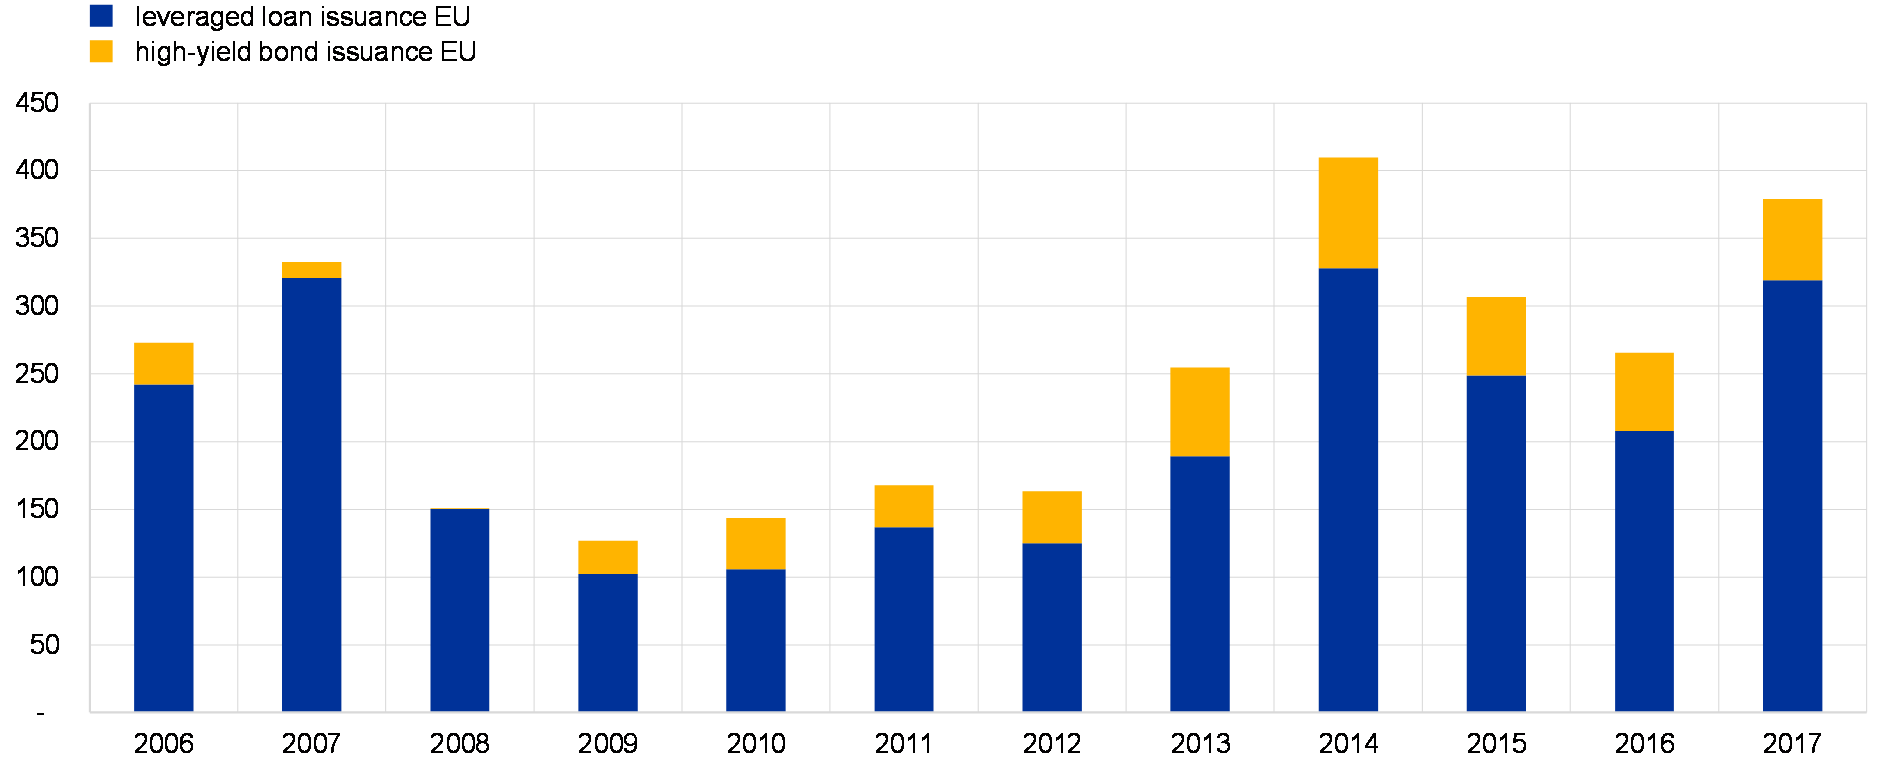
Sources: Thomson Reuters for leveraged loans, Dealogic for bond issuance, and ECB calculations.
Notes: Primary market issuance data do not include borrowing by financial and project finance companies or by governmental entities. Thomson Reuters data on gross primary market issuance of leveraged loans include refinancing of leveraged loans that are carried out via amendments to pricing of loan agreements with existing investors.
High investor demand has allowed increasingly leveraged corporates to obtain financing in the leveraged loan market. In the United States, corporate leverage for firms active in the leveraged loan market has already exceeded pre-crisis peaks and the same trend has been observed for first lien corporate leverage in the European market (see Chart B).[28] In many cases, actual leverage is likely to be significantly higher than reported leverage, given the increasingly common practice among borrowers of making optimistic adjustments to pro-forma EBITDA levels. At the same time, as in the high-yield bond market, valuations are tight (see Chart 2.6).
Non-price terms in the leveraged loan market also reveal a significant relaxation of underwriting standards. In both Europe and the United States, the level of investor protection envisaged in leveraged loan contracts is low: covenant lite (cov-lite) transactions are now reported to account for around 80% of the issuance in both markets, compared to less than a quarter during the pre-crisis period (Chart B).[29] Since investors have fewer means of timely intervention to restrict borrower behaviour, this increases the likelihood that defaults will be delayed and recovery rates will be lower. High borrower bargaining power has also led to other forms of weakened investor protection, such as restrictions on loan transferability in the secondary market and limits on the share of the issuance that can be held by any one investor.
Chart B
Corporate leverage in US and European leveraged loan markets is at a post-crisis high, while underwriting standards have deteriorated markedly
Corporate leverage levels in the European and US leveraged loan markets and the share of cov-lite loans in primary US leveraged loan market
(2000-2017; ratios and percentages)
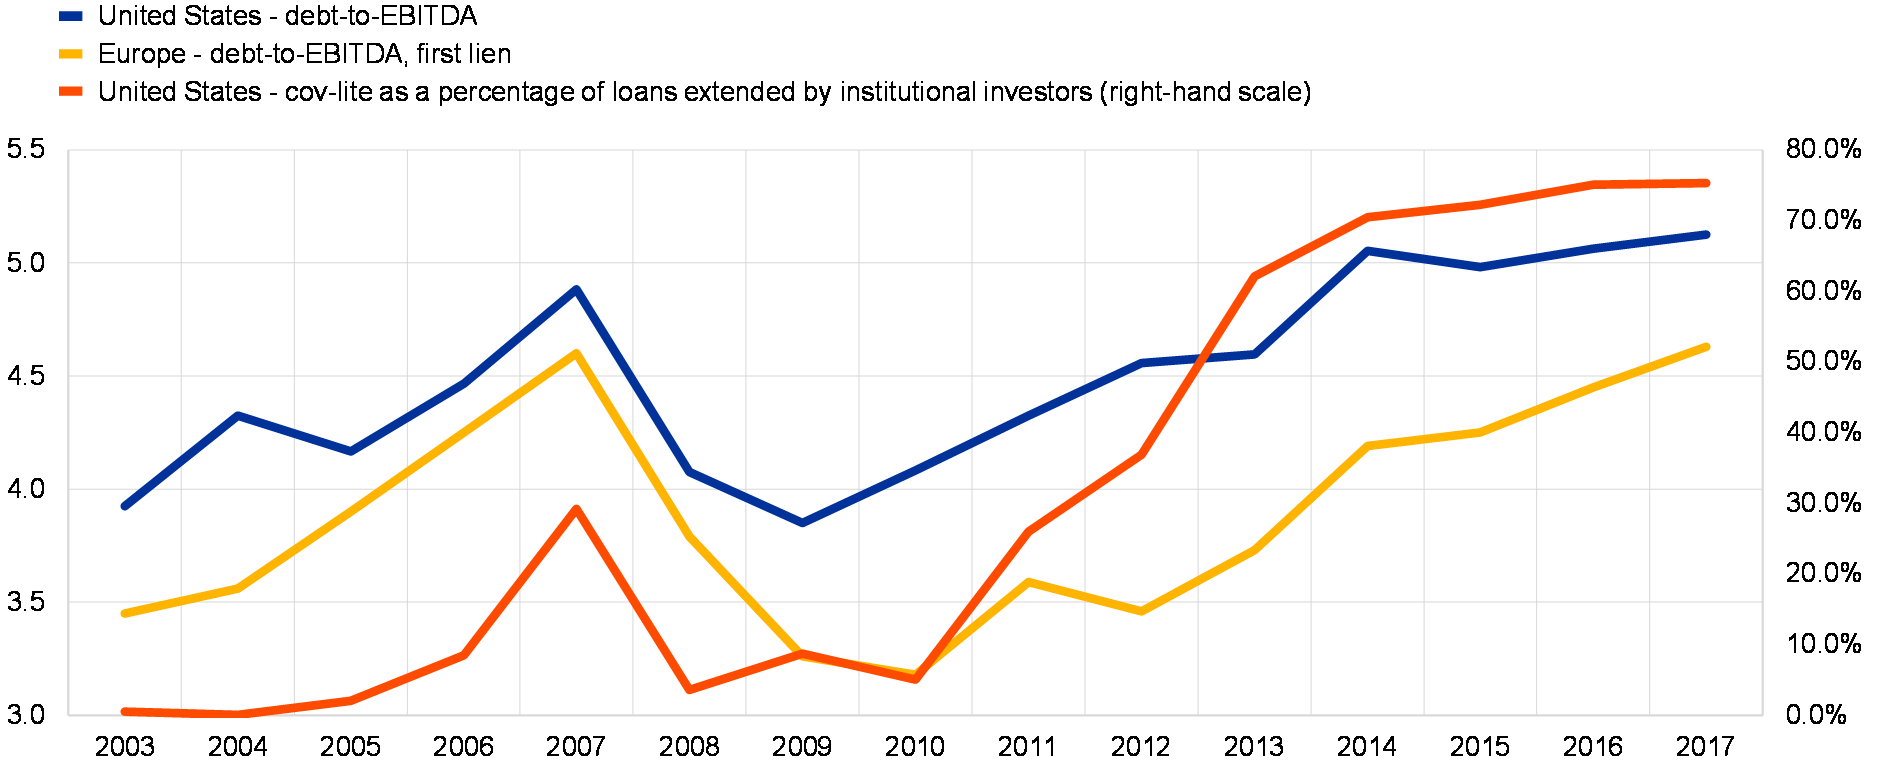
Sources: S&P Ratings Direct and ECB calculations.
Note: Leverage is computed as gross debt divided by pro-forma EBITDA.
Credit standards in the European leveraged loan market closely mirror those in the United States, where the leveraged loan market is larger and at a more advanced stage of the credit cycle. Anecdotal evidence suggests that some of the more aggressive practices, in terms of both higher leverage and lower investor protection, are associated with transactions by cross-border US private equity sponsors, with transactions initiated by sponsors typically employing more leverage than the average. This probably reflects the high bargaining power of private equity sponsors, who account for 70-80% of the borrowing volumes.
In the EU, non-bank investors have increasingly replaced banks in the financing of highly indebted companies. Chart C shows that, since the financial crisis, banks have reduced their share of financing in the primary market, with non-bank investors estimated to have provided more than half of the overall financing in 2017. This reflects both very high investor demand, as investors have increasingly purchased term loans and even bank facilities traditionally retained by banks, and higher capital charges and restrictions imposed on bank activities since the crisis.
Chart C
Non-banks in Europe have acquired increasingly large shares of leveraged loans in the primary market since the financial crisis
Breakdown of leveraged loan facilities in the EU market by type and estimated share of primary market loans extended by EU banks
(2006-2017; percentages)

Sources: Thomson Reuters and ECB calculations.
Notes: Institutional term loans cover term loans B, C, D and E, while bank syndicated term loans cover term loans A (TLAs). Other bank facilities cover bridge loans, revolving credit facilities, and capital expenditure (capex) and acquisition loans. Banks’ share in the primary market is estimated as the share of term loans retained by the banks and of other bank facilities in the total volume of leveraged loans syndicated in the primary market.
Despite accounting for a smaller overall market share, euro area banks may have increased their exposure to leveraged loan markets recently. As previously mentioned, banks have generally reduced their role as investors and arrangers in leveraged loan markets. Nevertheless, against the background of a resurgence in issuance, euro area banks’ holdings of leveraged loans to euro area non-financial corporates may have picked up again. While statistics on the direct holdings of leveraged loans by euro area banks are not available, syndicated leveraged loans are estimated to account for about a third of the syndicated loans extended by euro area banks in major jurisdictions to euro area non-financial corporations. Syndicated loans accounted for 4.4% of the euro area banking sector’s loan exposure to euro area non-MFIs in March 2018 (see Chart D). The absolute exposure amounted to €524 billion a 10% increase compared with levels at the end of 2014. German and, in particular, French banks are driving overall euro area bank exposure higher, while Spanish and Italian banks have decreased their holdings by around 20% and 30%, respectively, since the beginning of 2012.
Chart D
Some euro area banks’ holdings of syndicated loans have been increasing recently
Euro area banks’ holdings of syndicated loans extended to euro area corporates by country
(Jan. 2012-Mar. 2018; index: Jan. 2012 = 100 (left-hand scale); percentages per annum (right-hand scale))

Source: ECB MFI balance sheet items (BSI) statistics.
Notes: Numbers next to countries in the legend show country-level syndicated loan holdings in € billions in March 2018. Holdings of syndicated loans represent the stock of syndicated loans extended by euro area MFIs, excluding the Eurosystem, to euro area non-financial corporations at the end of each month. The syndicated loan data cover loans extended to both investment-grade and sub-investment-grade companies.
Developments in leveraged loan markets may create financial stability risks. In particular, the rollover of maturing loans into exposures with a significantly worse risk-return profile may create vulnerabilities. In addition, the distribution of risks beyond the banking sector is unknown, given the lack of statistical data. Finally, higher than expected potential losses in this sector may spill over to the wider economy. With these risks in mind, the ECB issued guidelines on leveraged transactions in May 2017 which set minimum supervisory expectations regarding loan origination, loan identification and the leveraged lending risk control framework for the banks under its remit.[30] In this context, all relevant credit institutions should be in a position to demonstrate how their loan origination and risk management practices reflect the ECB’s expectations by November 2018.
The likelihood of international contagion and system-wide spillovers is elevated in the context of a global search for yield. Given the more advanced US credit cycle relative to Europe, developments in the US high-yield non-financial corporate sector and in US equities are of concern for euro area financial stability. While direct exposure to US equities accounts for around a quarter of the equity portfolios of euro area investment and pension funds (Chart 3.28 (b)), the wider contagion channels in the event of sharp declines in the US stock market are even more important.
Looking more broadly, markets have adjusted well to faster than expected monetary policy normalisation and year-end effects
Looking across financial markets, global risk-free rates have repriced higher as markets have factored in faster monetary policy normalisation. In the euro area, longer-term rates started to rise in December, following strong economic data, evidence of globally synchronised growth, and some anticipation that the ECB’s forward guidance could be revised earlier than expected. Longer-dated yields declined somewhat in February and March, as markets were reassured of a gradual exit, despite the removal at the ECB’s March Governing Council meeting of the “easing bias” in the APP communication. Both short and long-term rates remained relatively well anchored during the period under review, reflecting confidence in the pace and sequencing of the ECB’s steps to exit its monetary policy accommodation (Chart 2.13). In the United States, the Federal Reserve System raised its policy rate twice to 1.75%, and gradually moved up its expected Fed funds path for 2019 and 2020 in line with the strengthening growth and inflationary outlook. The long and, in particular, the short end of the US risk-free curve rose over the review period, and the spread between the FOMC and market expectations for the Fed funds rate narrowed, even as the Federal Reserve signalled a more sustained tightening path.
Chart 2.13
In the euro area, policy rate expectations and longer-term bond yields remain well anchored, while the US market has converged towards the FOMC’s view of higher policy rates
Fed funds futures, EONIA forward rates, and 5, 10 and 30-year US Treasury and German Bund yields
(Dec. 2008 to 28 Feb. 2018; percentages per annum)
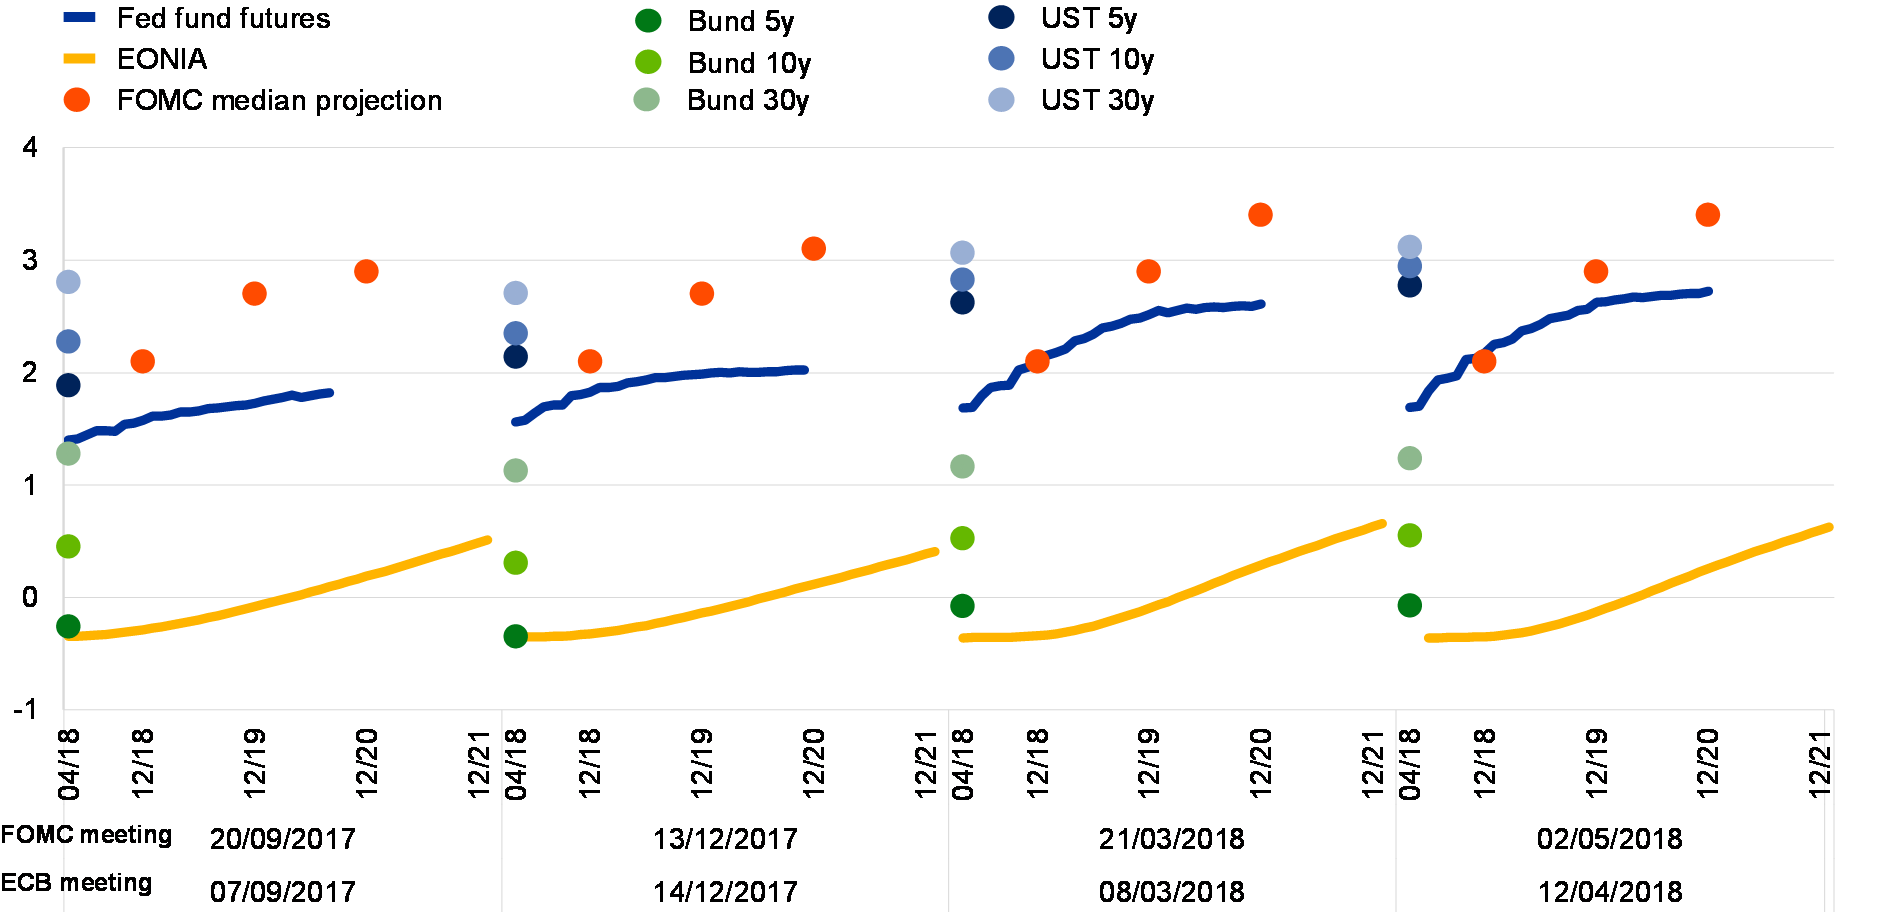
Sources: Bloomberg, Federal Reserve System and ECB calculations.
Note: The curves show market-implied pricing levels one day after the FOMC meeting.
Markets have responded well to the gradual approach central banks have taken towards the removal of accommodative monetary policies. In particular, the price of risky assets generally rose during December 2017 and January 2018, when most of the repricing of policy expectations and of the risk-free curve took place. This reflected expectations that the withdrawal of central bank stimulus would be faster in an environment of strong global growth. The developments suggest that central bank reaction functions to changes in economic activity are currently well understood by market participants, as is also reflected in the low and stable term premia discussed above.
Sovereign spreads have continued to tighten, reflecting improved euro area fundamentals. The ratings of a number of countries more affected by the crisis were upgraded over the review period.[31] The narrowing of euro area sovereign spreads (Chart 2.14) also reflects the market’s positive view of the continued commitment to completing the banking union and to increasing the resilience of the euro area by completing its institutional architecture. While the inconclusive outcome of the election in Italy on 4 March did not precipitate a significant market reaction, sovereign yields came under pressure later in the review period as markets grew concerned about the prospective coalition’s policy agenda.
Chart 2.14
Euro area sovereign spreads have continued to narrow
Ten-year sovereign yield spreads versus the OIS rate
(Jan. 2014 to May 2018; left-hand scale: spread in percentages per annum; right-hand scale: change in basis points)
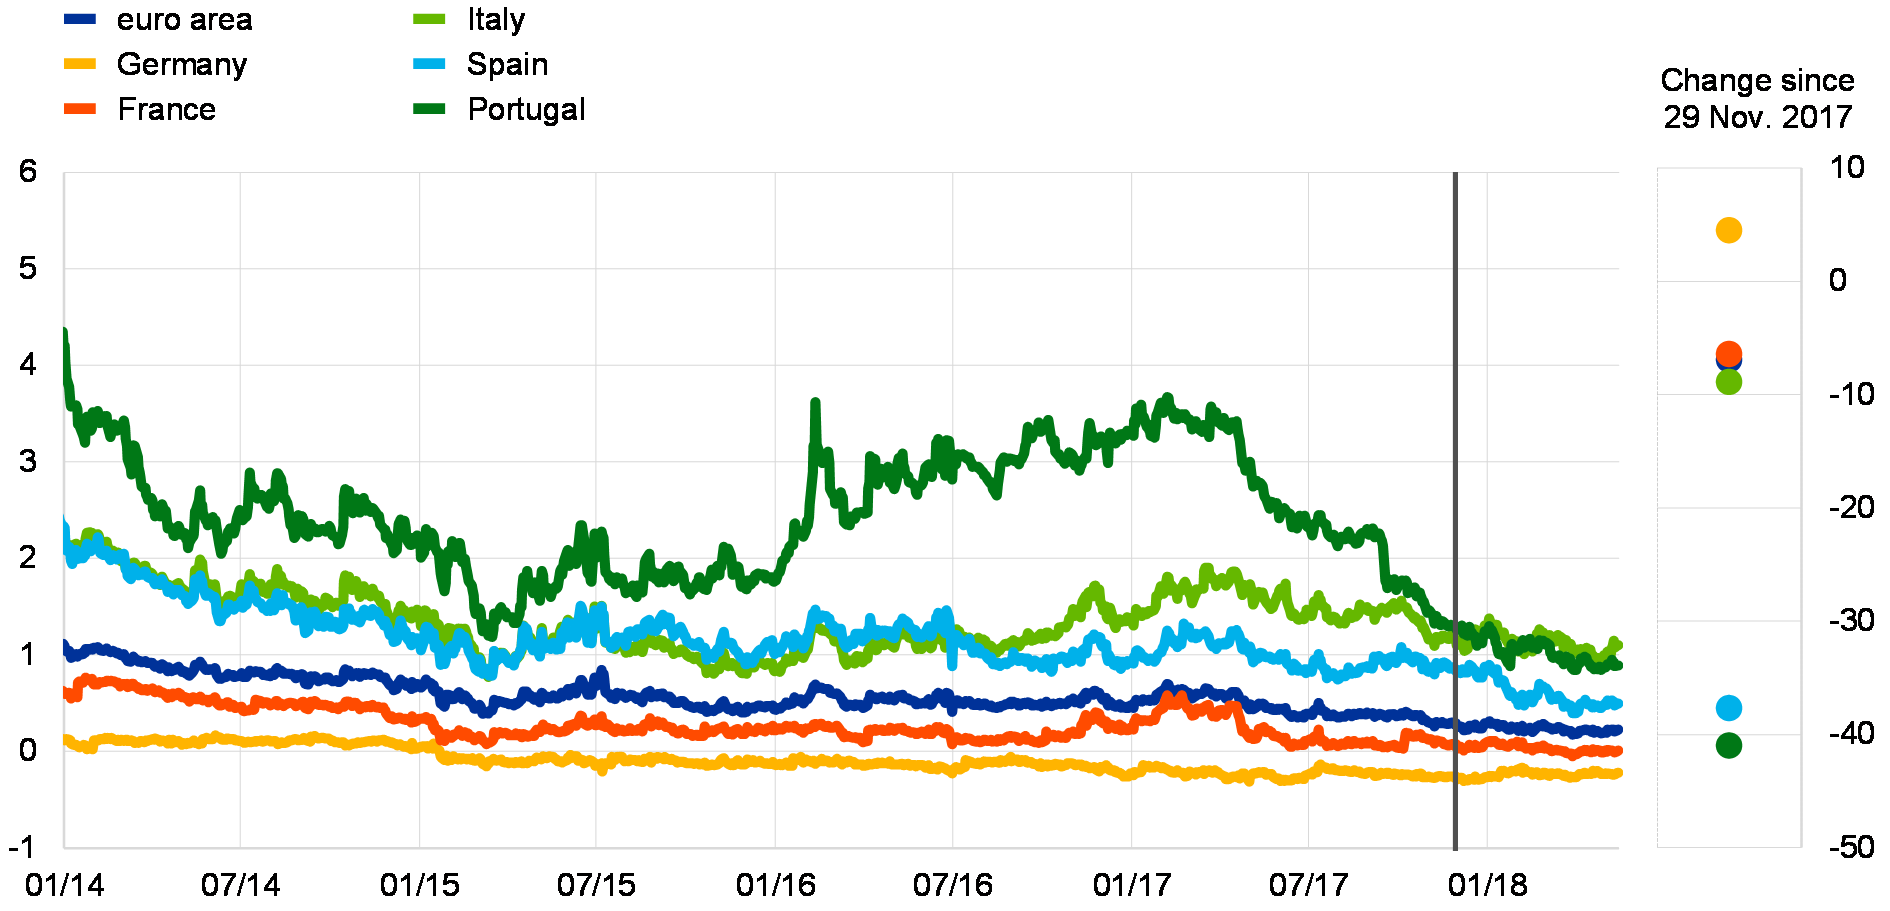
Source: ECB calculations. Notes: The spread is calculated by subtracting the OIS rate from the sovereign yield. “Euro area” refers to the GDP-weighted average of ten-year sovereign yields in the euro area. The vertical line indicates the publication of the previous Financial Stability Review on 29 November 2017. The latest observation is for 15 May 2018.
Despite some retrenching since February, US equity prices remain close to all-time highs, while euro area equity prices have declined over the review period. The section on valuations discussed the fact that, at the current levels, the valuation of US equities remains high, while equity valuations in the euro area are in line with historical levels. Chart 2.15 shows that the recent rise in US equity prices has been mainly due to growth in expected corporate earnings. A second driver has been a decline in the US equity risk premium, which started in November and partially offset the increase in the risk-free discount rate that started in December. The decline in the equity risk premium can be explained by greater confidence around the path of future earnings growth, following broad-based fourth quarter positive earnings surprises and the approval of lower US corporate taxes in December. By contrast, euro area equity prices were relatively flat over the review period, as the impact of higher earnings expectations was more than offset by the twin effect of a higher discount rate and higher equity risk premium following February’s volatility episode.
Chart 2.15
The increase in market volatility in February affected euro area equities more than US equities
Drivers of equity prices in the euro area (left panel) and United States (right panel)
(Jan. 2017 to May 2018; index: 1 Jan. 2017 = 100; weekly data)
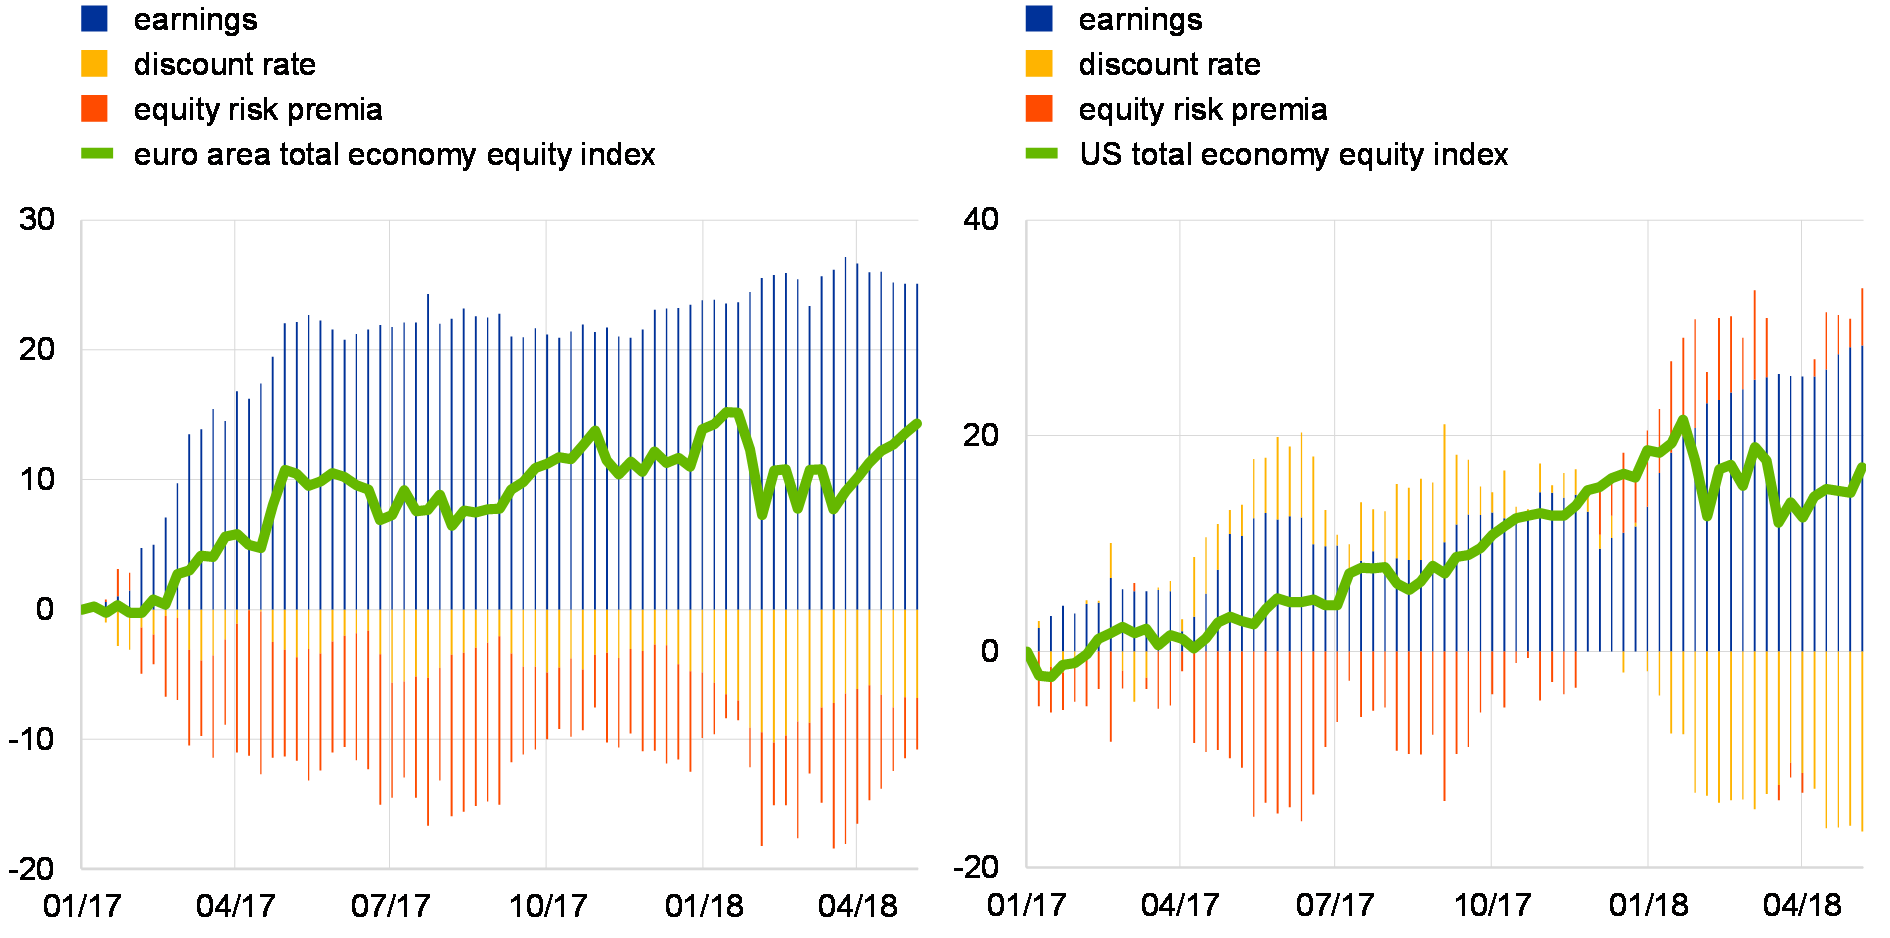
Sources: Thomson Reuters and ECB calculations.
Notes: The charts show the decomposition of indices for the broad euro area (1,446 companies) and US (993 companies) economies. The decomposition is based on an approximation of the three-stage dividend discount model (DDM). The latest observation is for 11 May 2018.
European money markets have generally functioned well in the period under review, and some market segments exhibited higher resilience to year-end tensions than in 2016. In particular, a marked improvement could be seen in the repo market in a year-on-year comparison. Balance sheet rationing continued to play a key role in reducing repo market activity over the year-end, pushing the repo rate significantly lower than usual. Nevertheless, the end of 2017 saw less disruptive developments than at the end of 2016, as market participants anticipated year-end tensions more accurately and made appropriate preparations. Chart 2.16 shows that the implied repo market rates for transactions spanning the 2017 year-end were more closely aligned with realised rates than in 2016. On the other hand, some year-end tensions were also visible in the foreign exchange swap market, where the cost of borrowing USD against EUR in a three-month transaction increased more than in previous years (Chart 2.17). This probably also reflects regulatory optimisation of banks’ balance sheets – in particular in response to the G-SIB methodology, which is based on year-end balance sheet data – that large USD liquidity providers, mainly US banks, may face when providing USD funding at the year-end via FX swaps.
Chart 2.16
The functioning of the European repo market was more orderly at the end of 2017 than at the end of 2016
German collateral repo realised and implied rates at the year-end
(Dec. 2016 and Dec. 2017, percentages per annum)
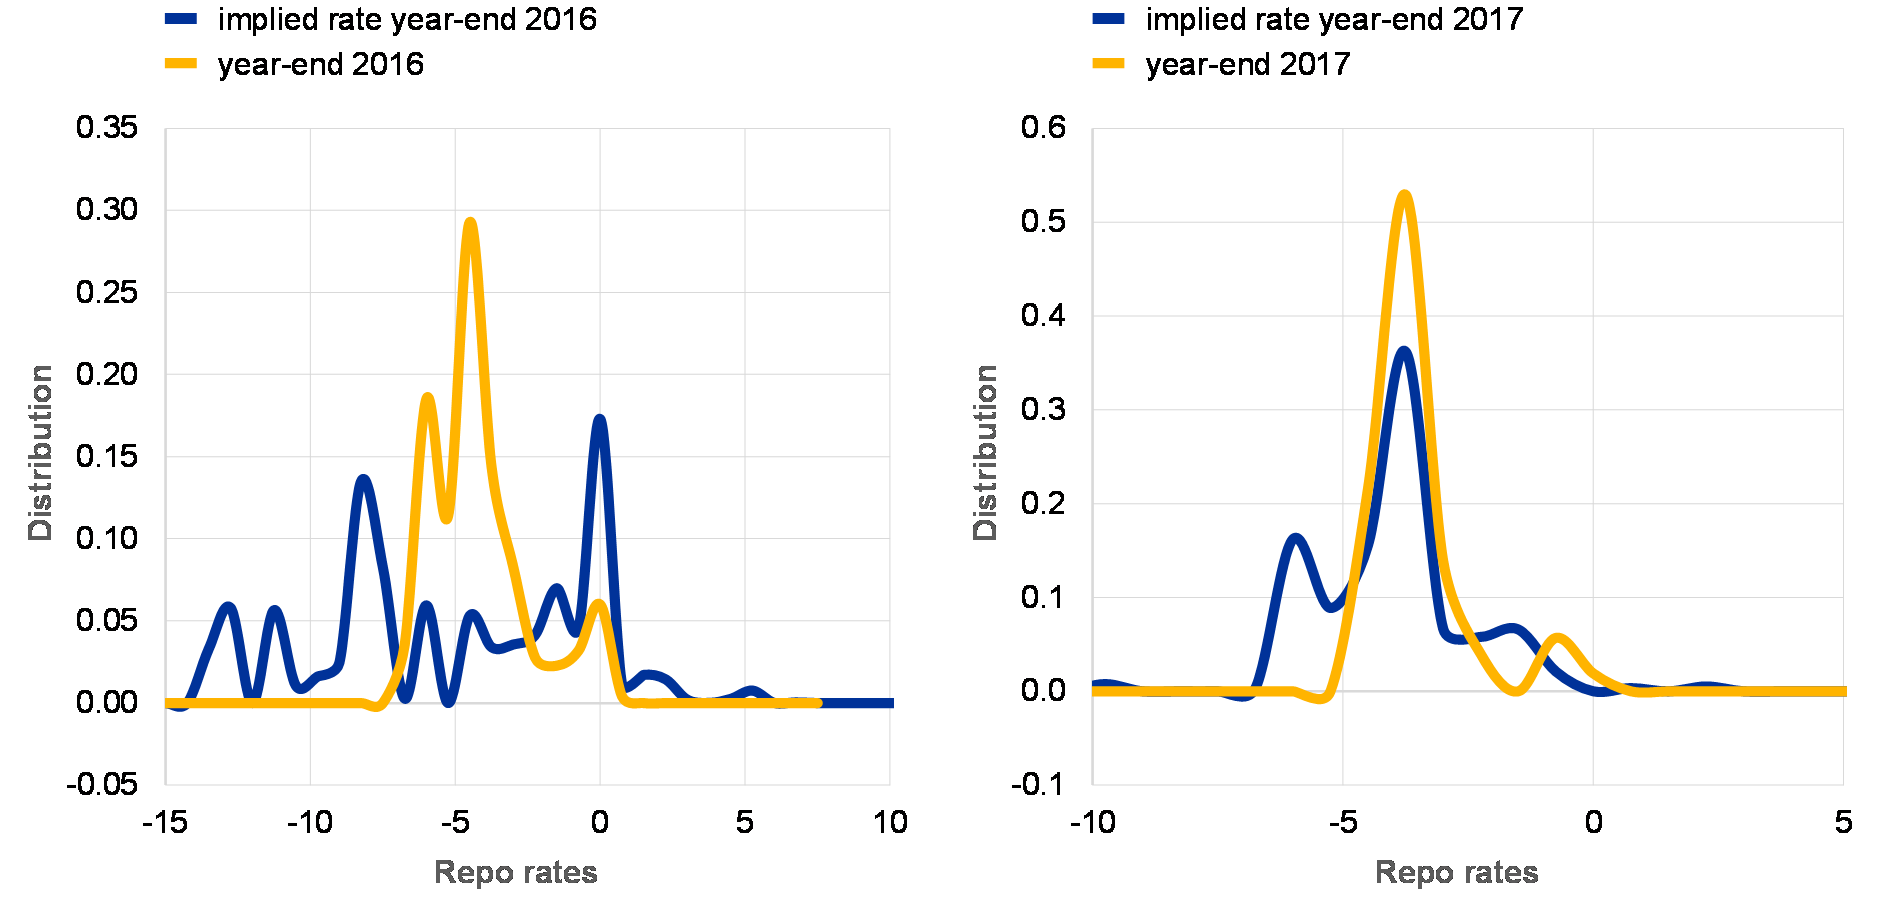
Source: ECB calculations based on MMSR data.
Notes: Charts show the distribution, by repo volumes, of overnight and T+1 repo rates implied by transactions taking place on the 24 December in 2016 and 2017 and spanning the year-end.
The likely discontinuation of the EONIA raises financial stability concerns, given the transition complexities and short time frame. The decision of the European Money Market Institute (EMMI) on 1 February to cease EONIA reform efforts owing to a lack of feasibility had no visible market impact, which may suggest market anticipation that the EONIA will be replaced with a suitable reference rate in a timely manner.[32],[33] However, the lack of a reform solution for the existing benchmark, and the need to transition to a new one, raises some financial stability concerns, given the need to identify suitable alternatives within the tight deadline of 1 January 2020 set by the Benchmarks Regulation[34] and the complexities of the transition to one or more new benchmarks.[35] Work has started, via the working group on euro risk-free rates, on identifying suitable EONIA replacements.
Chart 2.17
Unlike during the crisis, the increase in short-term USD interbank funding costs has decoupled them from funding costs in other currencies
Spreads of selected three-month interbank funding rates and the three-month T-bill rate to the three-month OIS rate and the three-month EUR/USD FX basis
(Jan. 2007 to May 2018; percentages per annum)
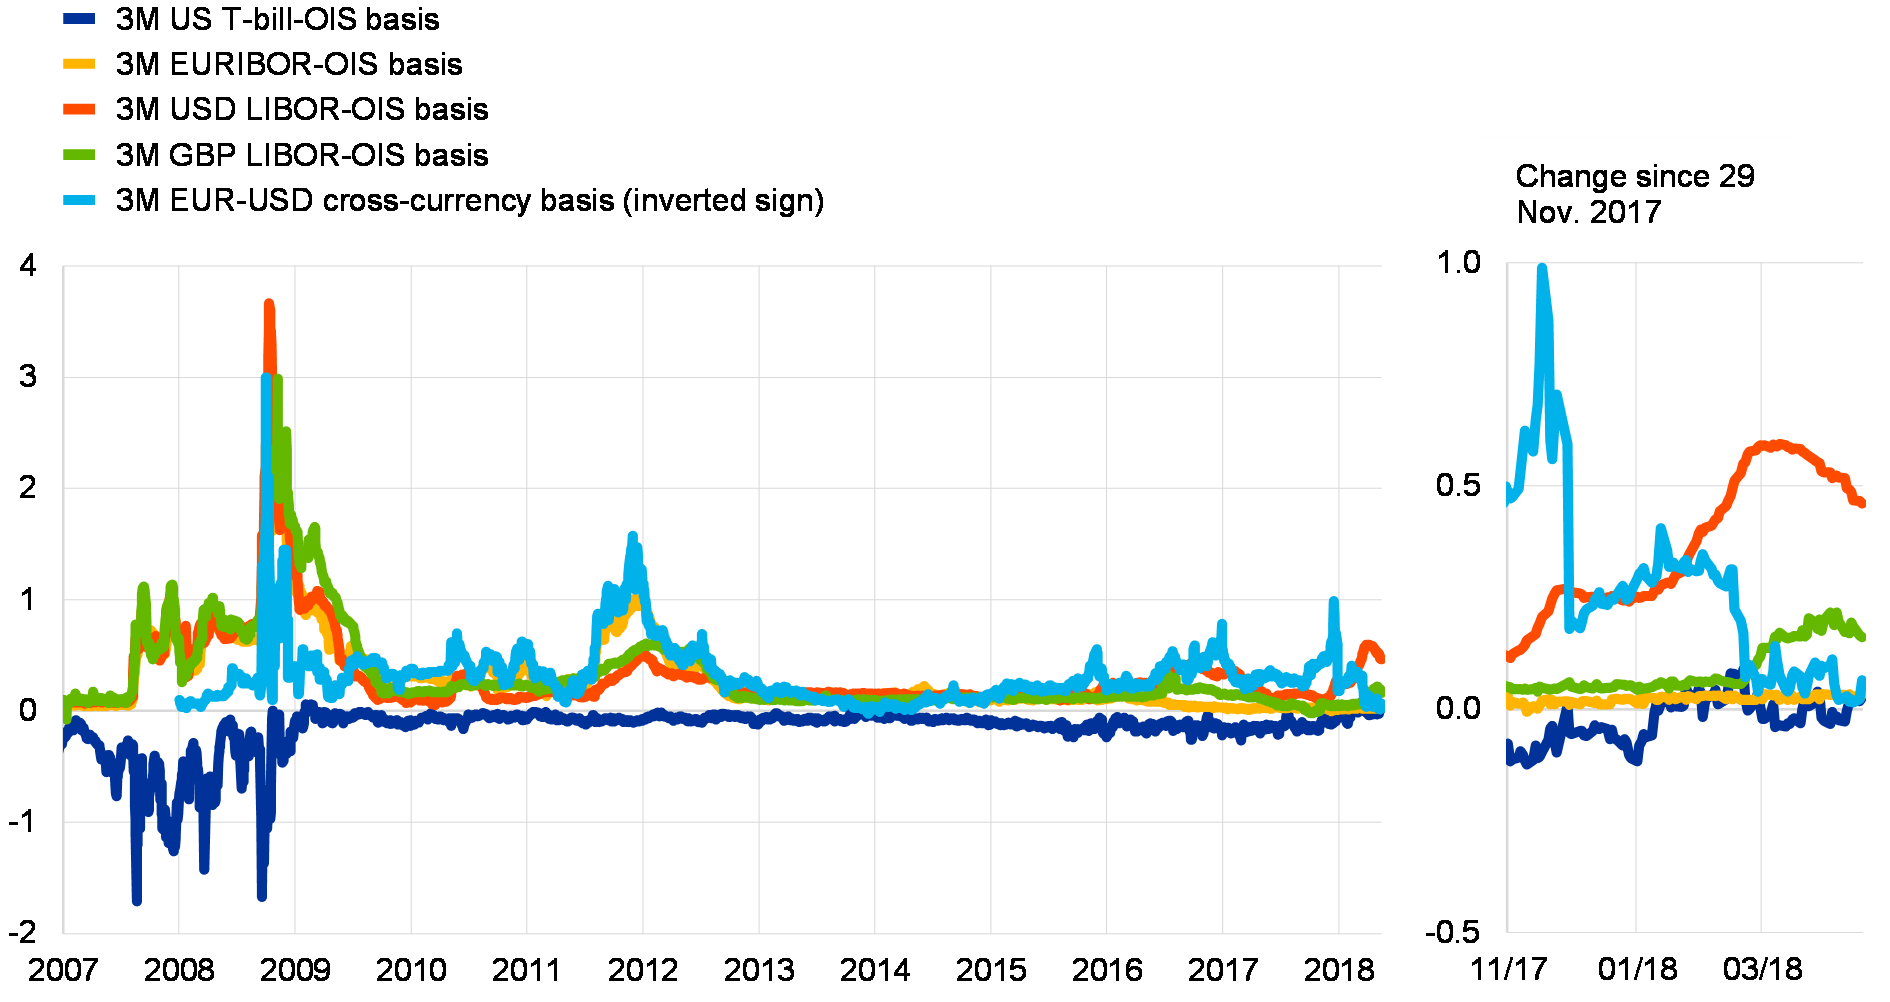
Sources: Bloomberg and ECB calculations.
Money market and forex swap developments suggest that the recent increase in the USD LIBOR-OIS spread does not reflect increased bank risk or a decrease in the availability of USD funding to European banks. Chart 2.17 shows that, unlike during the crisis, comparable funding premia in euro did not increase in line with the rise in the USD LIBOR-OIS spread. Moreover, the three-month cross-currency EUR-USD basis has not widened (disregarding the year-end effect), unlike during the crisis periods when some European banks had difficulty in accessing USD funding. Finally, outside balance sheet reporting dates, the demand for USD at the ECB’s liquidity providing operations has generally remained subdued this year. The recent widening of the three-month USD LIBOR-OIS basis probably reflects an increase in overall short-term funding rates in the United States, also visible in the less negative basis between the three-month T-bill yield and the three-month OIS swap rate. This is probably driven by idiosyncratic factors linked to the US tax reform.
3 Euro area financial institutions
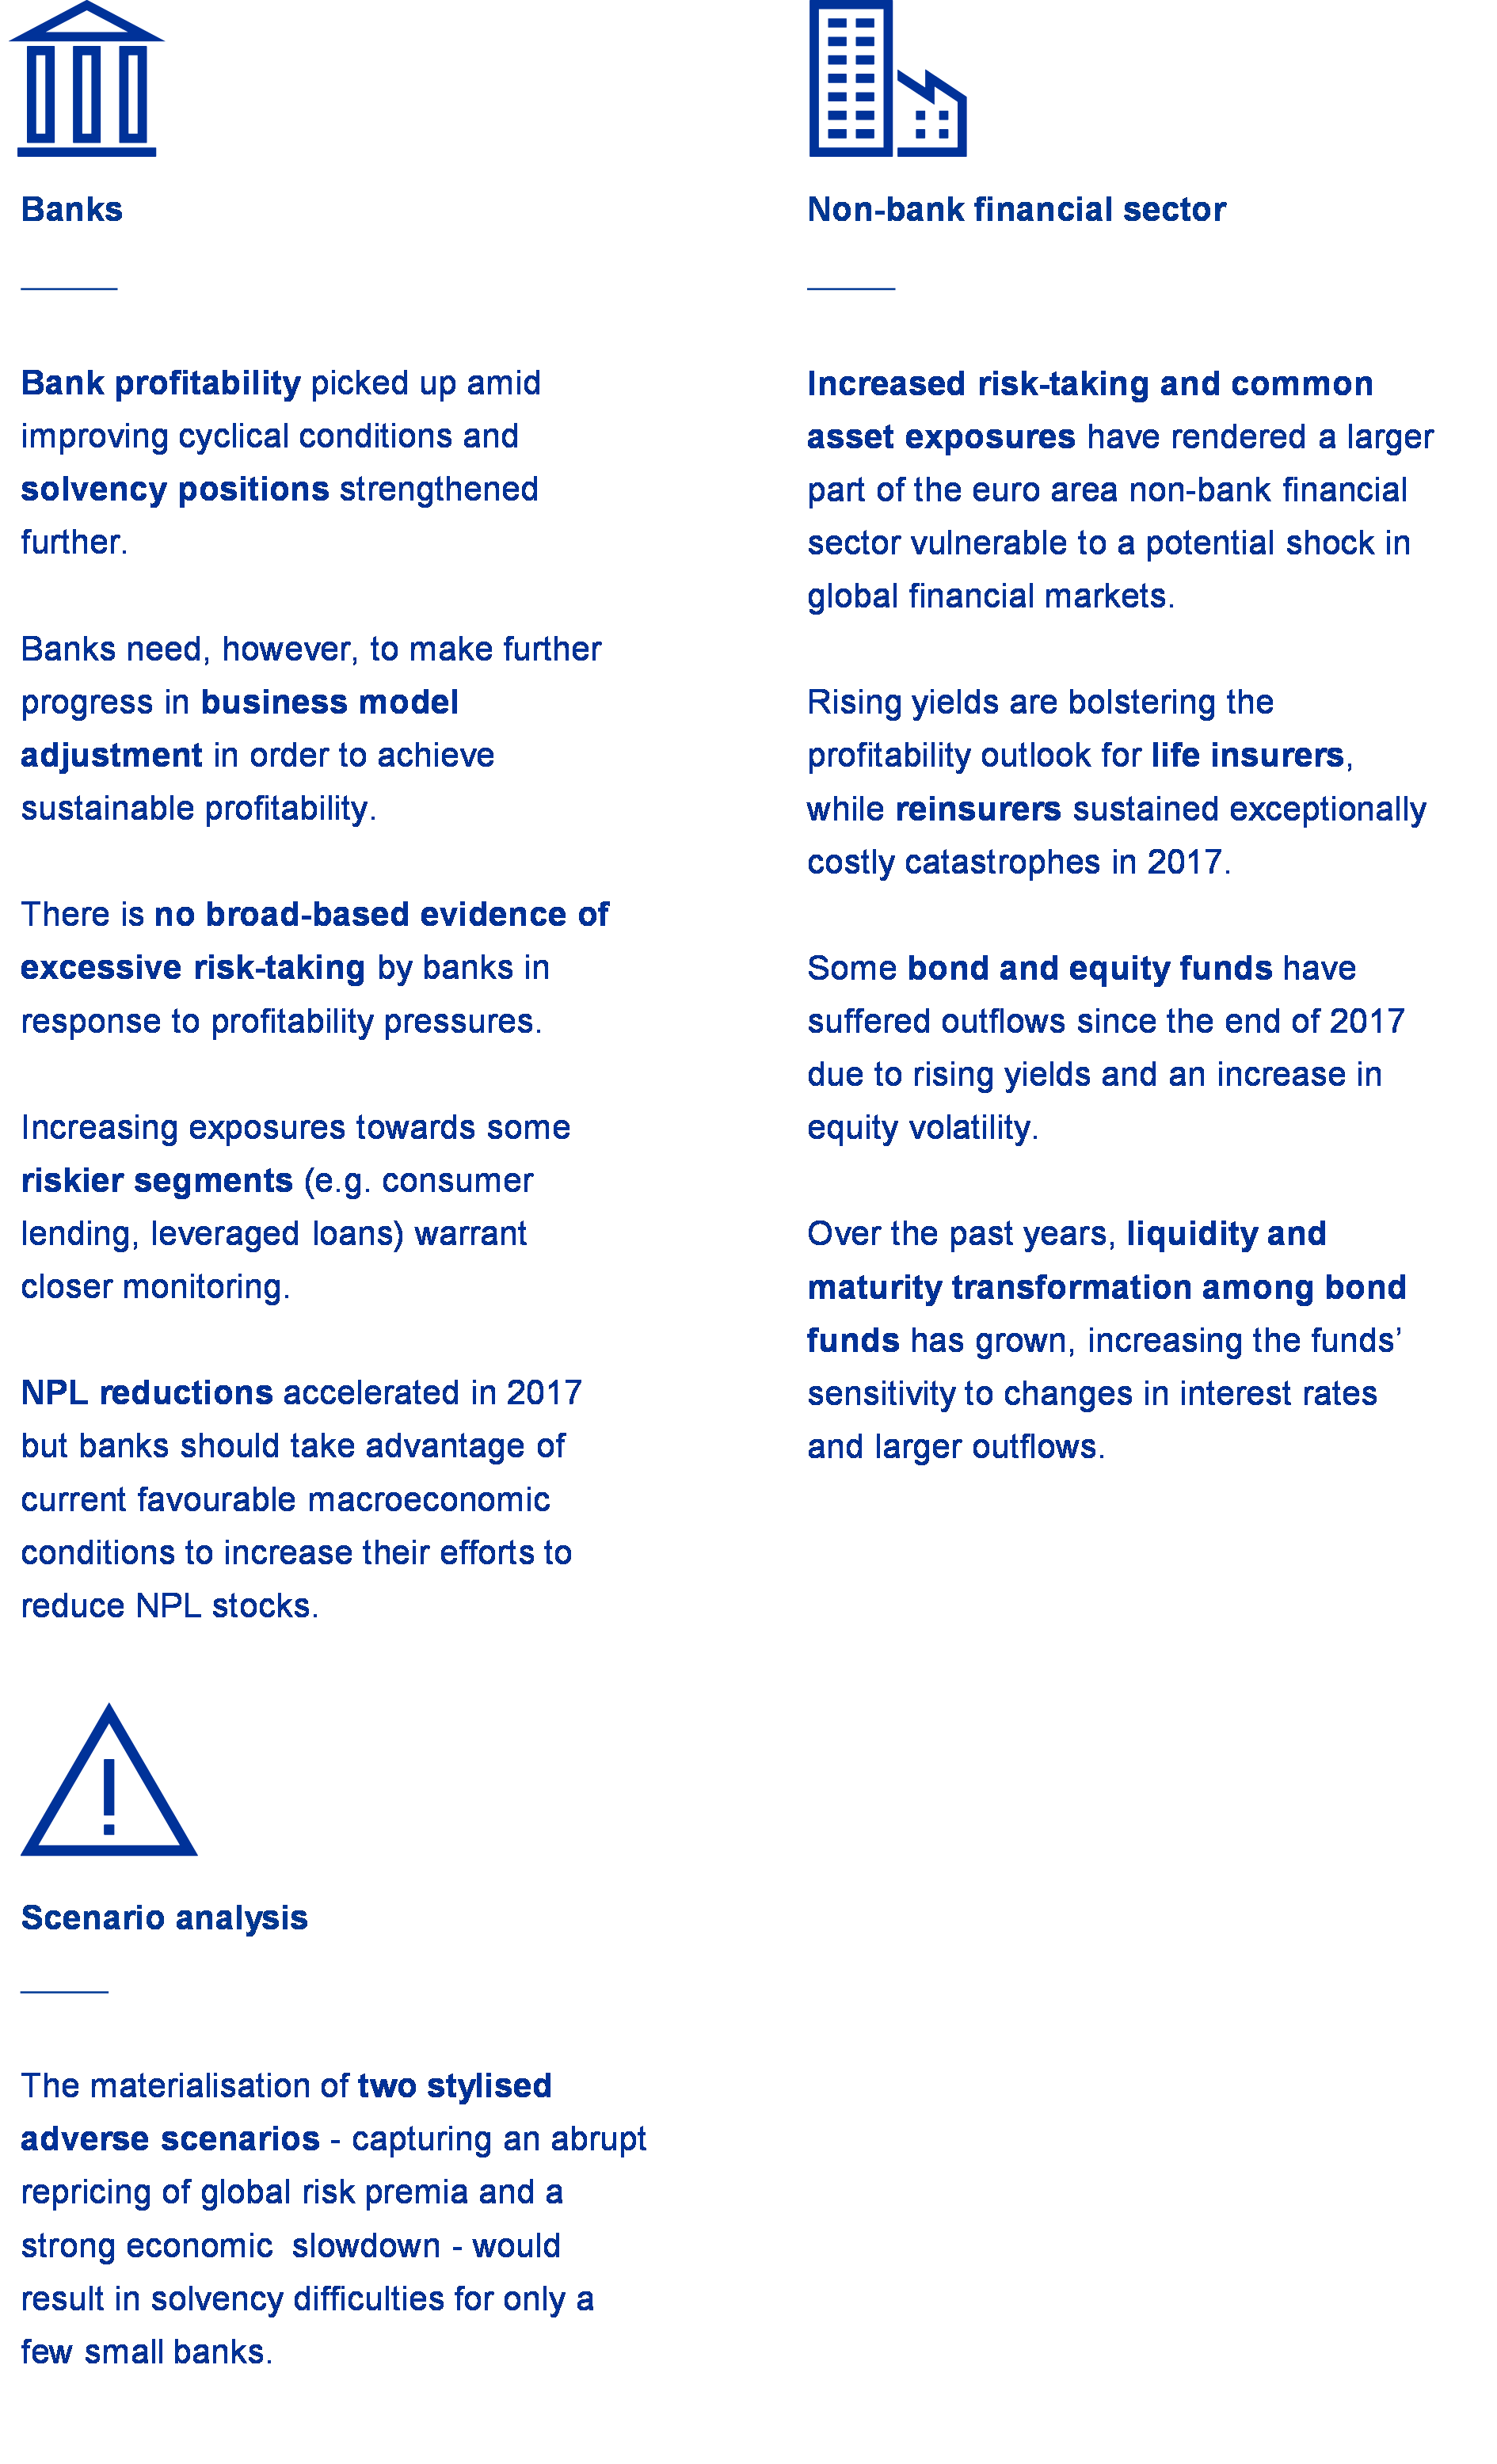
3.1 Banks’ profitability and resilience improved, but further progress is needed in addressing structural challenges
Euro area significant banks’ profitability picked up in 2017 amid improving macroeconomic conditions.[36] Significant institutions’ aggregate return on equity (ROE) reached 6% in 2017, a level similar to that in 2010, i.e. before the onset of the sovereign debt crisis.[37] The annual improvement in banks’ financial performance was mainly driven by lower impairment costs (see Chart 3.1). This in turn reflects a better macroeconomic backdrop, as new non-performing loan (NPL) formation has slowed, but it is also due to base effects as some banks booked large one-off impairment charges in 2016 relating to NPL reductions.
Chart 3.1
Bank profitability improved in 2017, mainly due to lower impairments
Decomposition of the change in euro area significant institutions’ aggregate ROE from 2016 to 2017
(2016-17, percentage points)
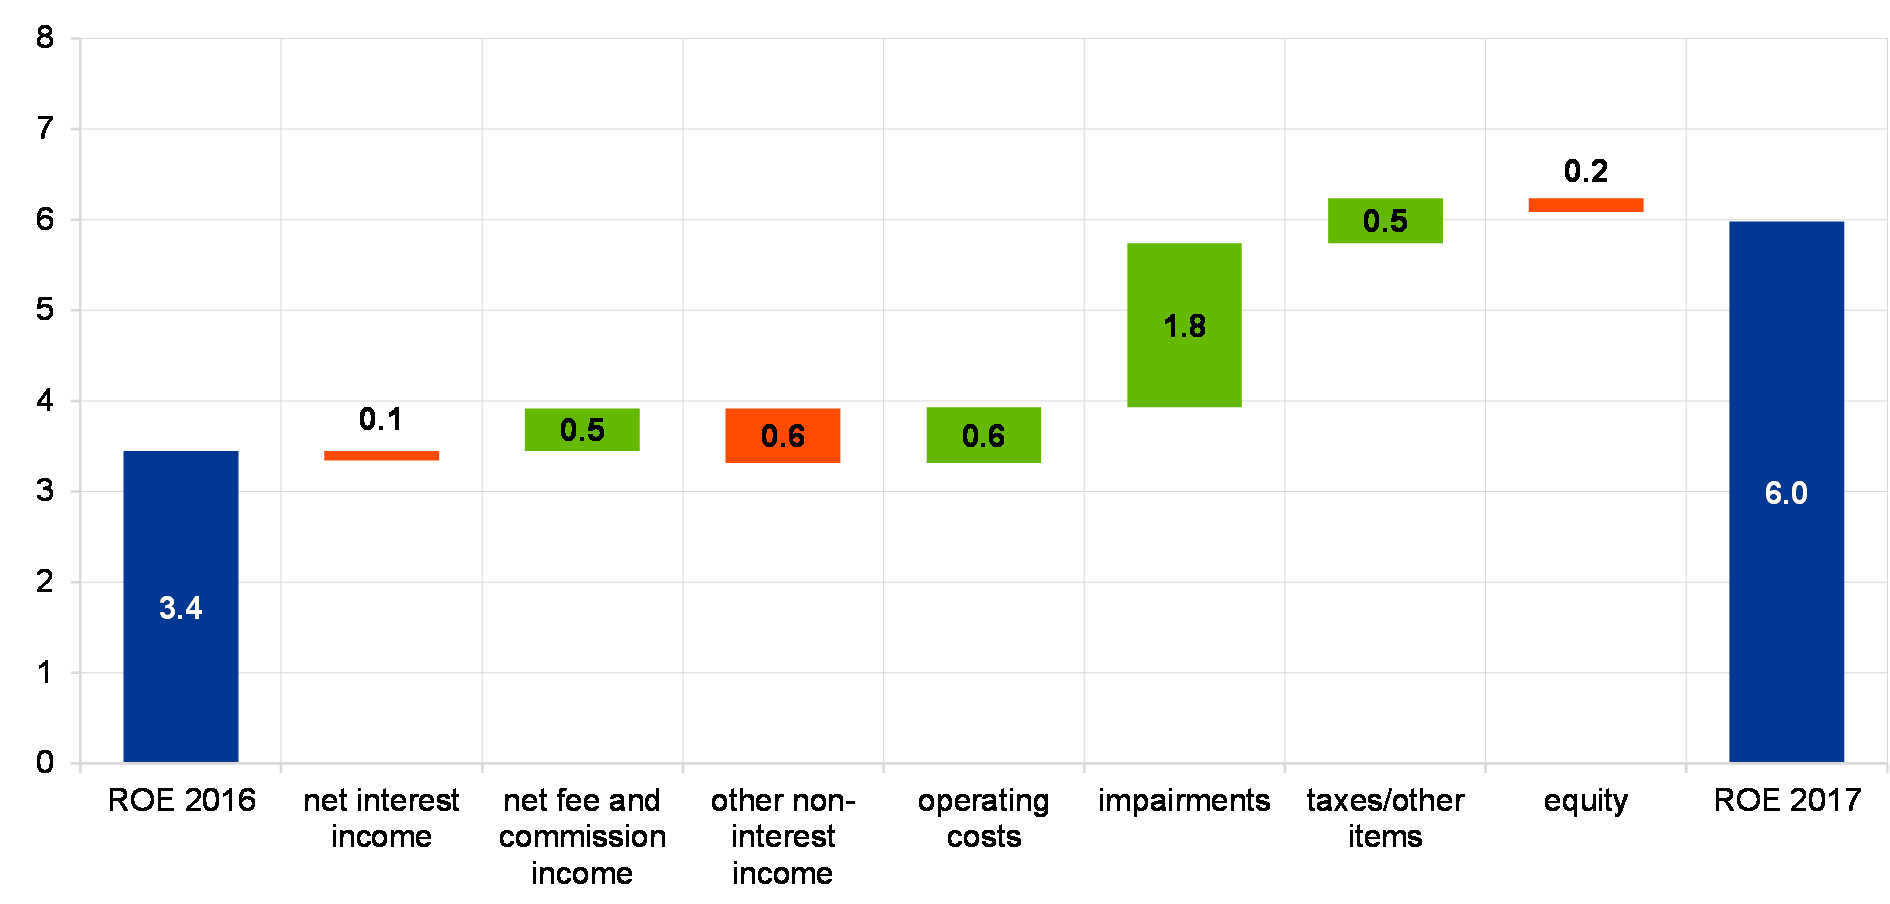
Sources: ECB and ECB calculations.
Notes: Based on a balanced sample of 112 significant institutions (adjusted for mergers and acquisitions). The green and red bars denote positive and negative contributions, respectively.
The overall contribution of operating profits to the improvement in banks’ aggregate profitability was modest. On the revenue side, net interest income slightly declined (following a more marked drop in 2016), as continued pressure on margins was largely, but not fully, offset by expanding volumes. By contrast, the growth of net fee and commission income picked up as banks benefited from the increased cross-selling of fee-generating products (e.g. investment funds, insurance). At the same time, other non-interest income items made an overall negative contribution to the change in profitability, with the positive impact of increasing trading income being outweighed by declines in other income items.[38] On the cost side, the moderate reduction of operating expenses also contributed to the improvement in banks’ aggregate profitability, although this masks some heterogeneity at bank level, with more than half of significant banks reporting increases in costs.
Looking at a breakdown of recent profitability trends by country group, much of the improvement was driven by banks in the countries more affected by the crisis (see Chart 3.2). On aggregate, bank profitability in these countries recovered thanks to lower impairment costs, increasing revenues as well as some one-off factors.[39] That said, the bulk of the improvement in these countries was concentrated within the largest banks, while profitability levels remained subdued at other banks (see Chart 3.2 – left panel). At the same time, the aggregate profitability of banks in countries less affected by the crisis remained broadly stable as the positive impact of declining impairment and operating costs was offset by somewhat lower revenues.
Chart 3.2
Much of the overall improvement was driven by banks in countries more affected by the crisis
Change in significant institutions’ aggregate ROE from 2016 to 2017 and main drivers by country group
(2016-17, percentages, percentage points)
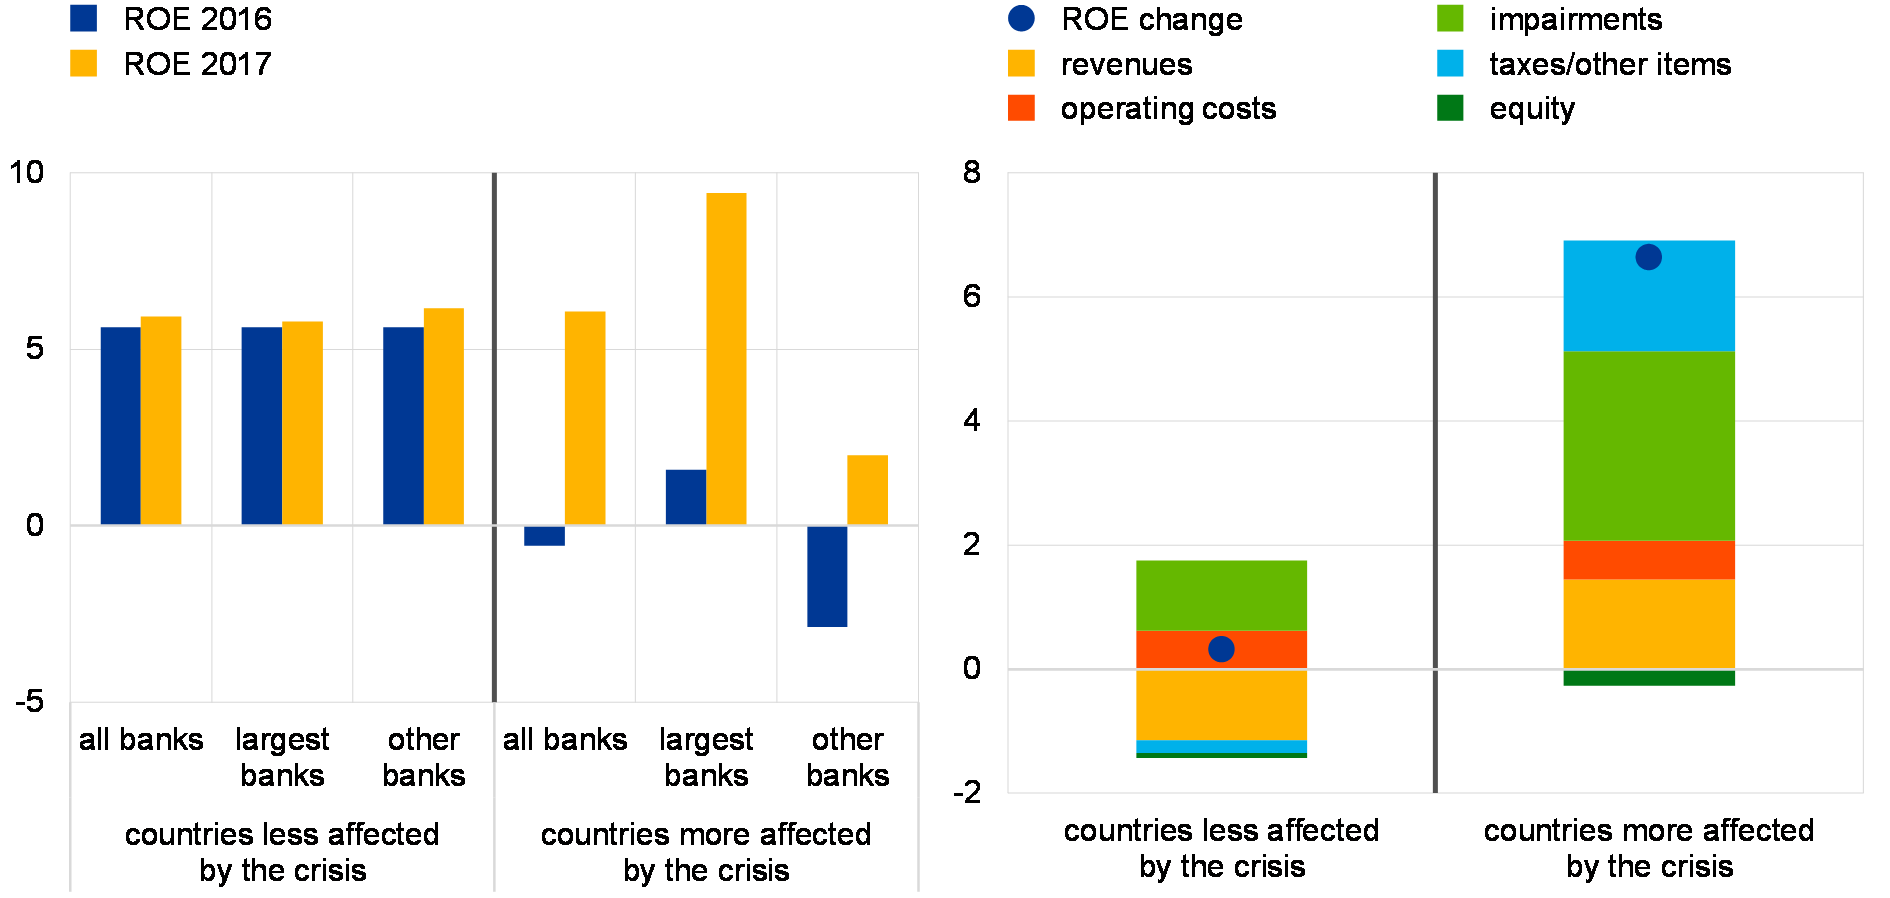
Sources: ECB and ECB calculations.
Notes: Based on a balanced sample of 112 significant institutions (adjusted for mergers and acquisitions). Countries more affected by the crisis include Cyprus, Greece, Ireland, Italy, Portugal, Spain and Slovenia. The largest banks are defined as those with at least €500 billion of total assets.
Financial performance improved across most (though not all) business models, although profitability levels continued to diverge somewhat (see Chart 3.3). Universal banks tended to outperform banks with other business models in 2017, possibly benefiting from a greater diversification of their business activities. At the other end of the spectrum, retail lenders and diversified lenders typically displayed lower profitability levels than banks in other categories, partly due to their greater reliance on net interest income-generating activities. It should be added, however, that divergences in profitability levels across business models partly reflect disparities between country groups as the majority of banks classified under the weaker-performing business models (diversified and retail lenders) are located in the countries more affected by the crisis. By contrast, retail banks in the countries less affected by the crisis were among the better performers within their country group.
Chart 3.3
Recent profitability trends diverged across business models
Median ROE of significant institutions by business model
(2016-17, percentages)
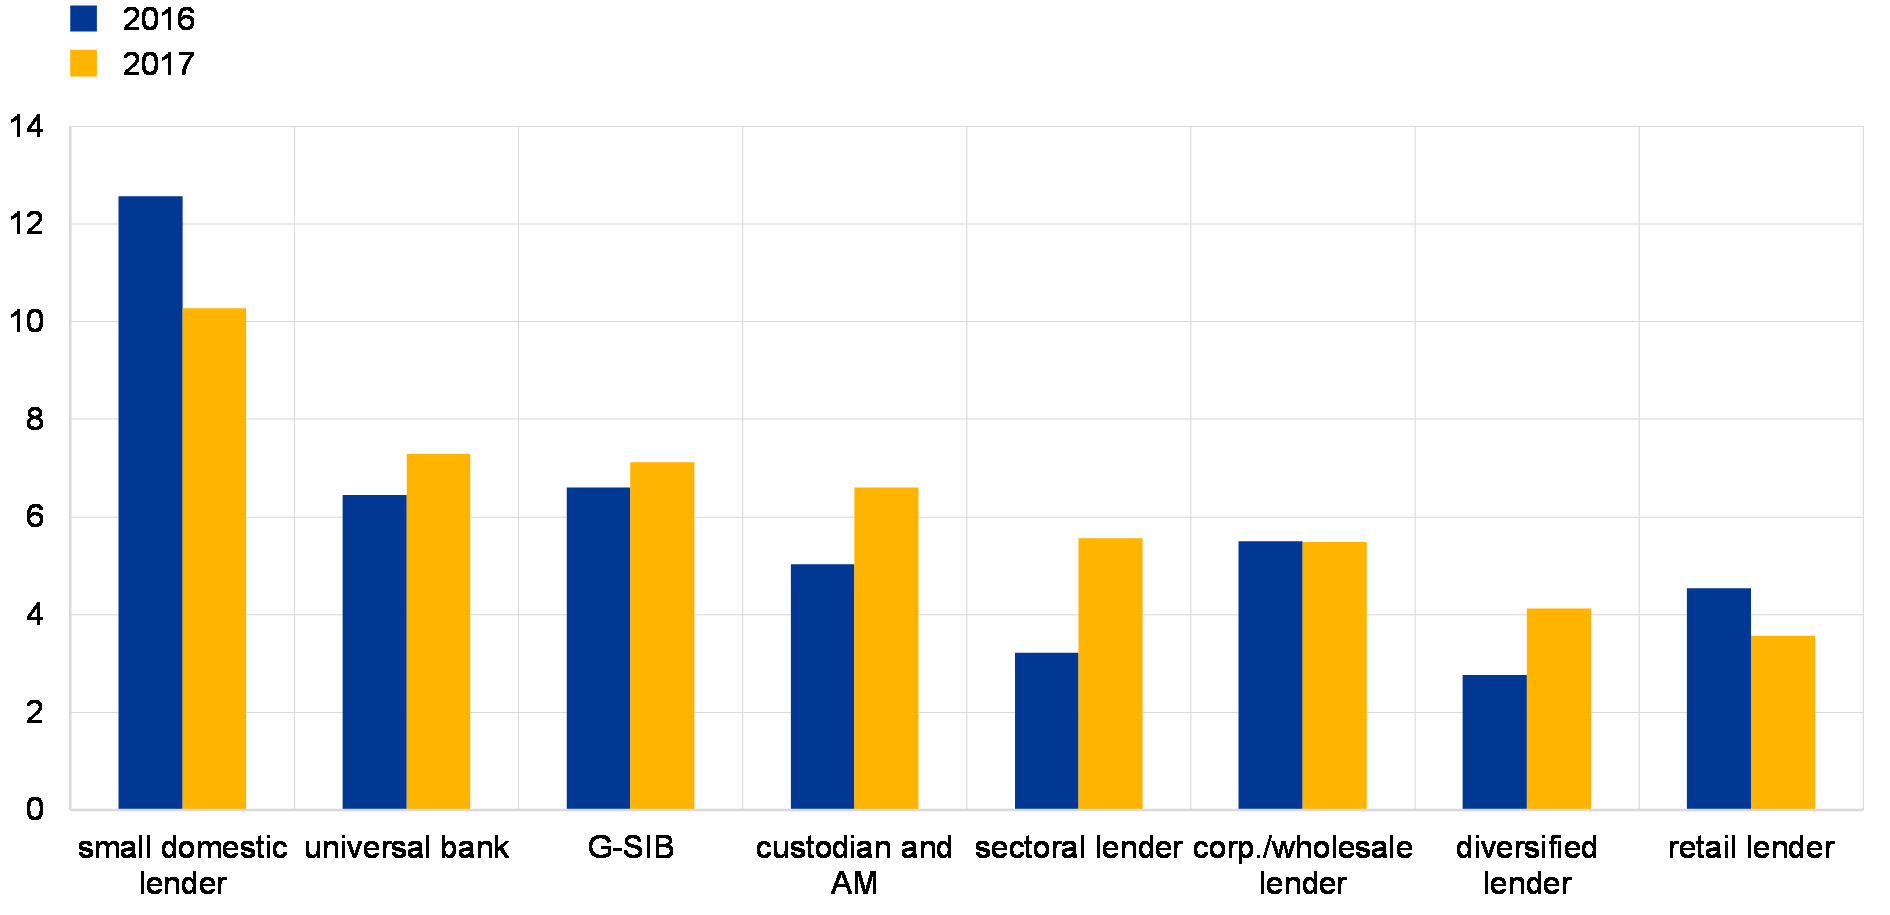
Sources: ECB and ECB calculations.
Notes: Based on a sample of 108 SIs. G-SIB stands for global systemically important bank and AM for asset manager.
Analysts expect a continuation of the gradual improvement in bank profitability in the next few years. The median ROE for listed euro area banks (based on a sample of 41 SIs) is expected to be in the range of 6-7% in 2018 and 2019, before reaching 8% in 2020 (see Chart 3.4). The cross-sectional dispersion of profitability is expected to narrow somewhat, with gradual improvements anticipated also for weaker banks. Analysts’ expectations of higher bank earnings partly reflect robust growth prospects, and thus a better revenue outlook, as well as lower provisioning needs, in particular in high-NPL countries, driven by expectations of further progress in balance sheet repair. That said, profitability for a number of banks is still expected to remain at subdued levels, suggesting that cyclical improvements may not be sufficient for these banks to reach a sustainable level of profitability, which highlights the importance of tackling structural challenges.
Chart 3.4
Analysts’ forecasts suggest a gradual improvement in bank profitability in the next few years
Actual ROE for 2016-17 and mean ROE estimates for 2018-20 for euro area banks
(2016-20, percentages; median (blue dot), interquartile range and 10th-90th percentile range)
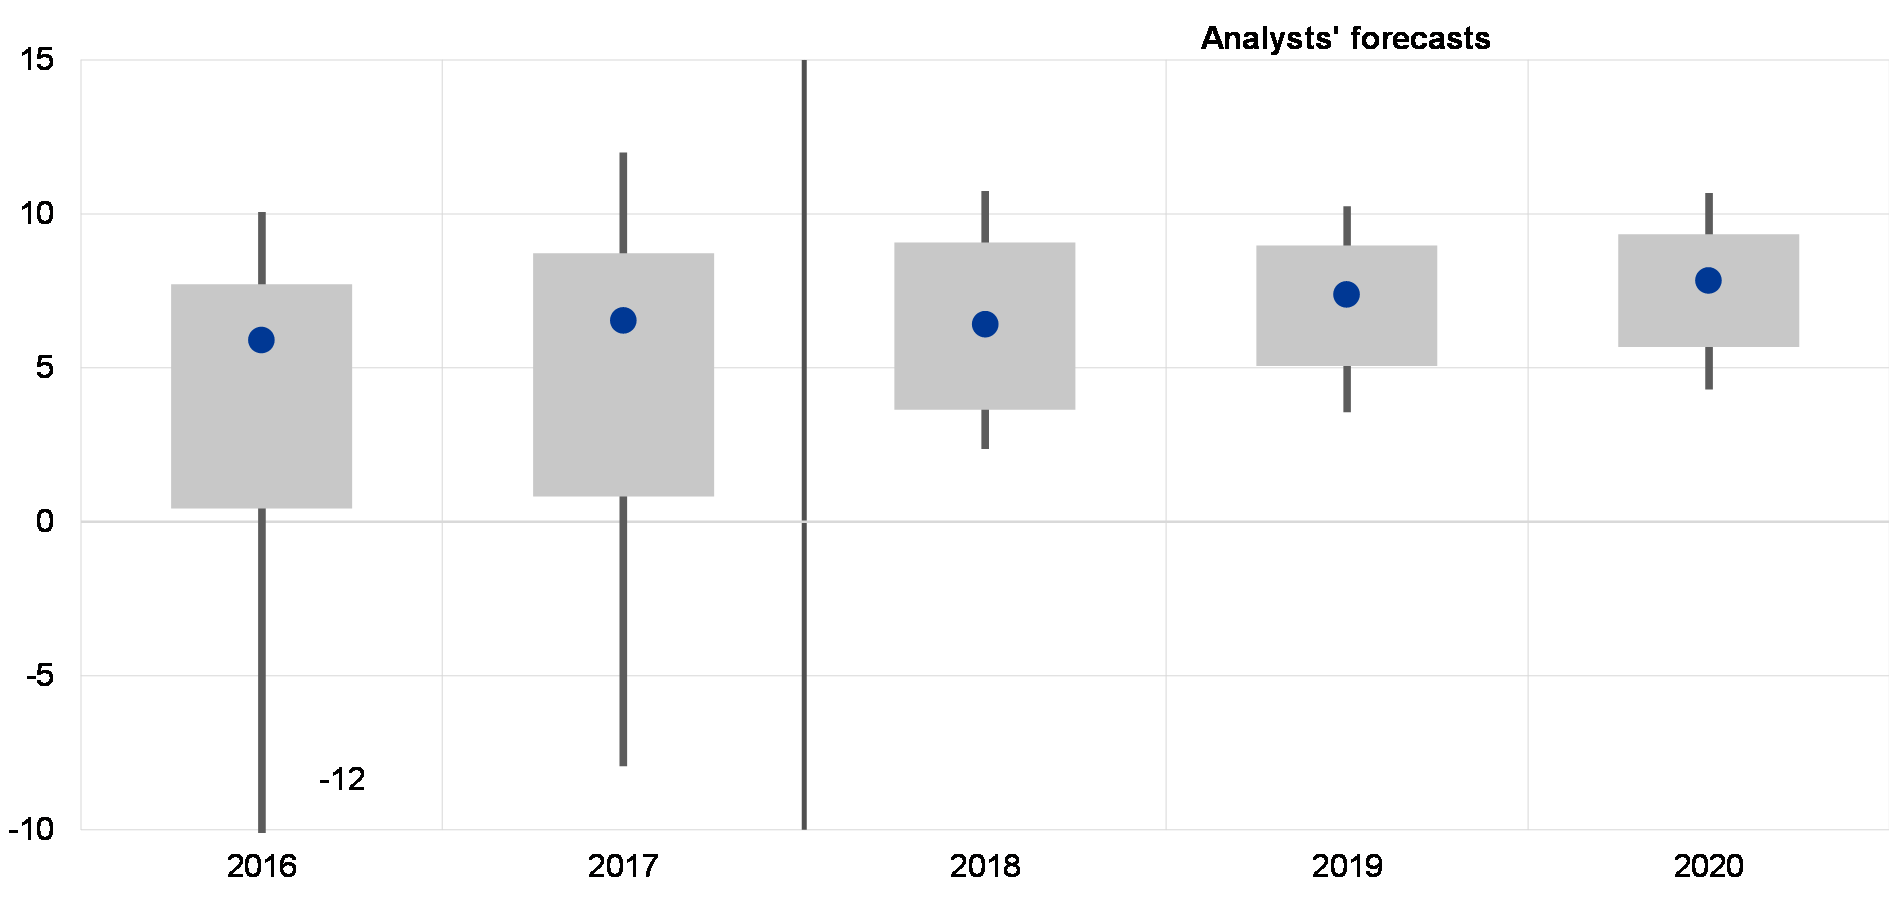
Sources: SNL and S&P Capital IQ.
Note: Based on a sample of 41 listed SIs.
Turning to one of the key challenges in this regard, despite recent and ongoing restructuring efforts, euro area banks have been unable to cut costs significantly. Taking a longer-term perspective, euro area significant institutions’ operating expenses have grown by over 5% since 2010, despite a 3% decline in total assets in the same period.[40] Focusing on more recent developments, SIs’ aggregate cost-to-assets ratio has remained broadly unchanged over the last two years (at around 1.4%). However, cost developments have diverged markedly across business models over this period. For instance, euro area G-SIBs and small domestic lenders were more successful in reducing their cost-to-assets ratios than other SIs, while corporate/wholesale lenders and diversified lenders saw the strongest increases in cost-to-assets ratios (see Chart 3.5).
Chart 3.5
Costs have increased across all business models in the last two years, with the exception of G-SIBs
Change in the cost-to-assets ratio and contributions of the cost and assets components broken down by type of bank
(change from 2015 to 2017, weighted aggregates, percentage point changes)
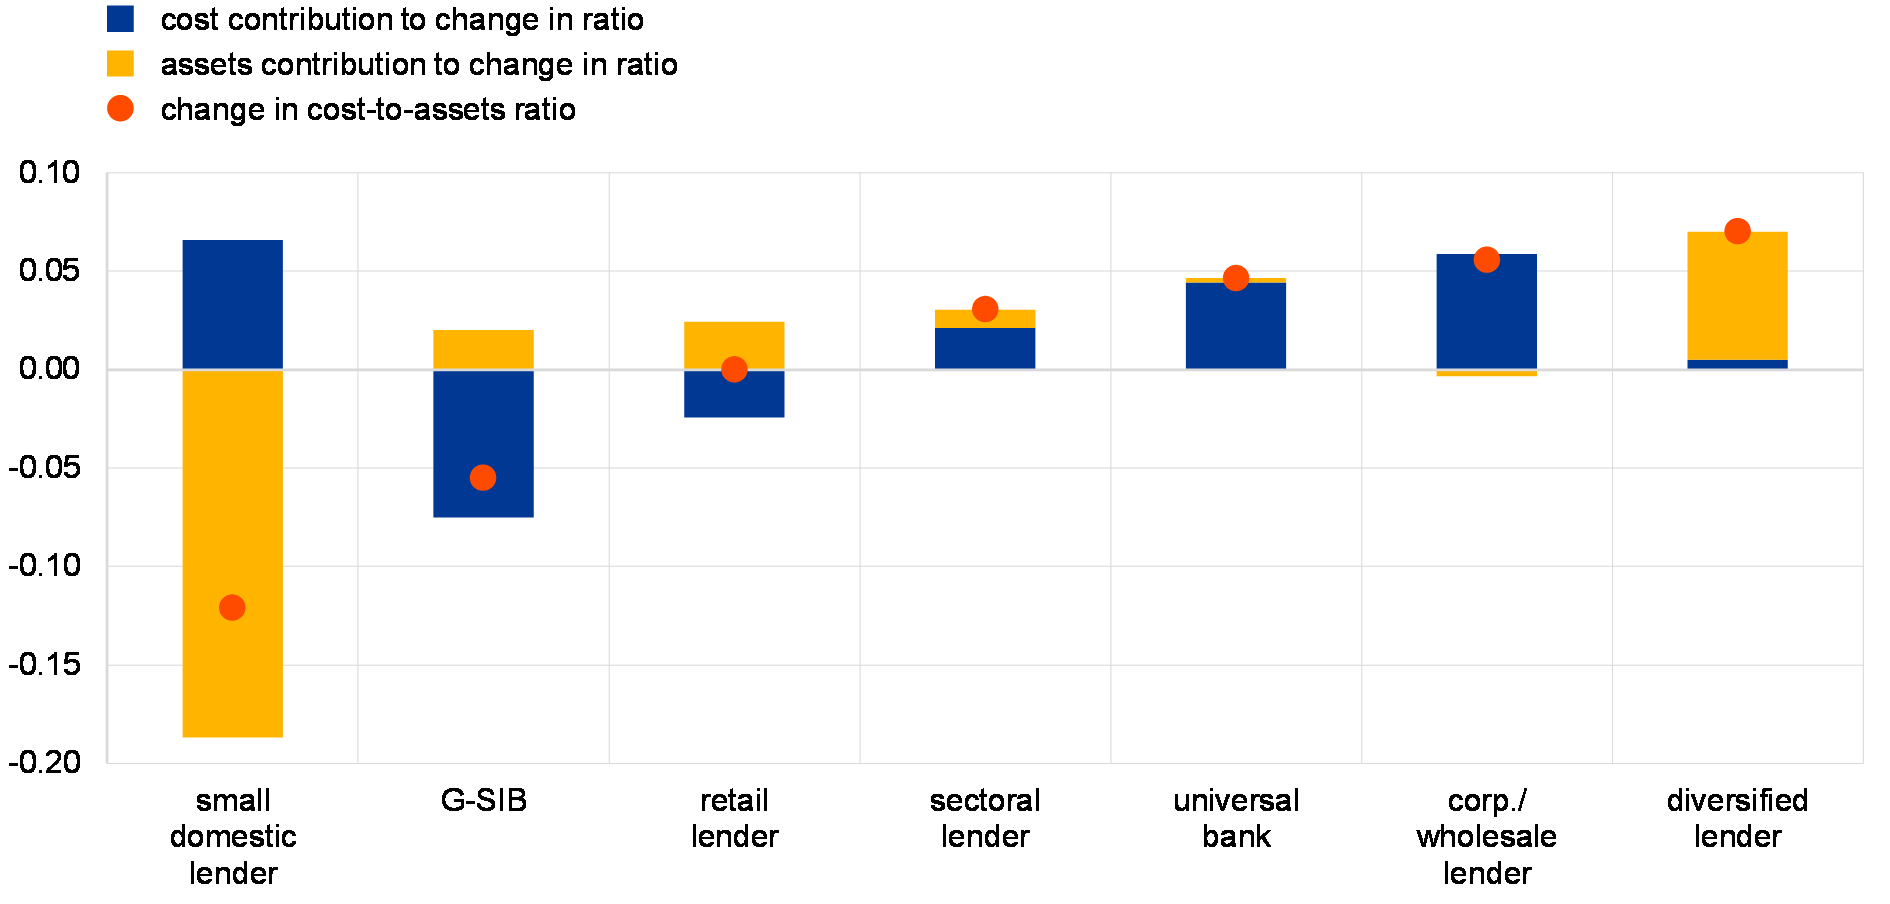
Sources: ECB and ECB calculations.
Note: Based on a balanced sample of 93 SIs.
Looking at cost structures, the growth of non-staff operating expenses has outpaced that of staff costs since 2010. Euro area SIs’ aggregate staff costs increased by close to 3% between 2010 and 2016, as the impact of headcount reductions was more than offset by an increase in staff costs per employee. In the same period, banks’ non-staff costs have increased by 10%. Public disclosures for a sub-sample of SIs suggest that the growth in non-staff-related expenses has been mainly driven by other provisions and IT costs (see Chart 3.6). For this sample of banks, IT costs still only amount to 10% of total operating costs, but their relatively rapid growth (14%) reflects increased investments in digital technologies. At the same time, occupancy and equipment costs – mainly related to office and branch space – have declined over the last seven years driven by branch closures of over 10%.
Chart 3.6
Other provisions and IT costs have contributed the most to the growth of non-staff costs since 2010
Change in selected non-staff cost items between 2010 and 2016 and their contribution to the change in operating costs (for a sub-sample of SIs)
(2010-16, percentage point contributions and percentage changes)
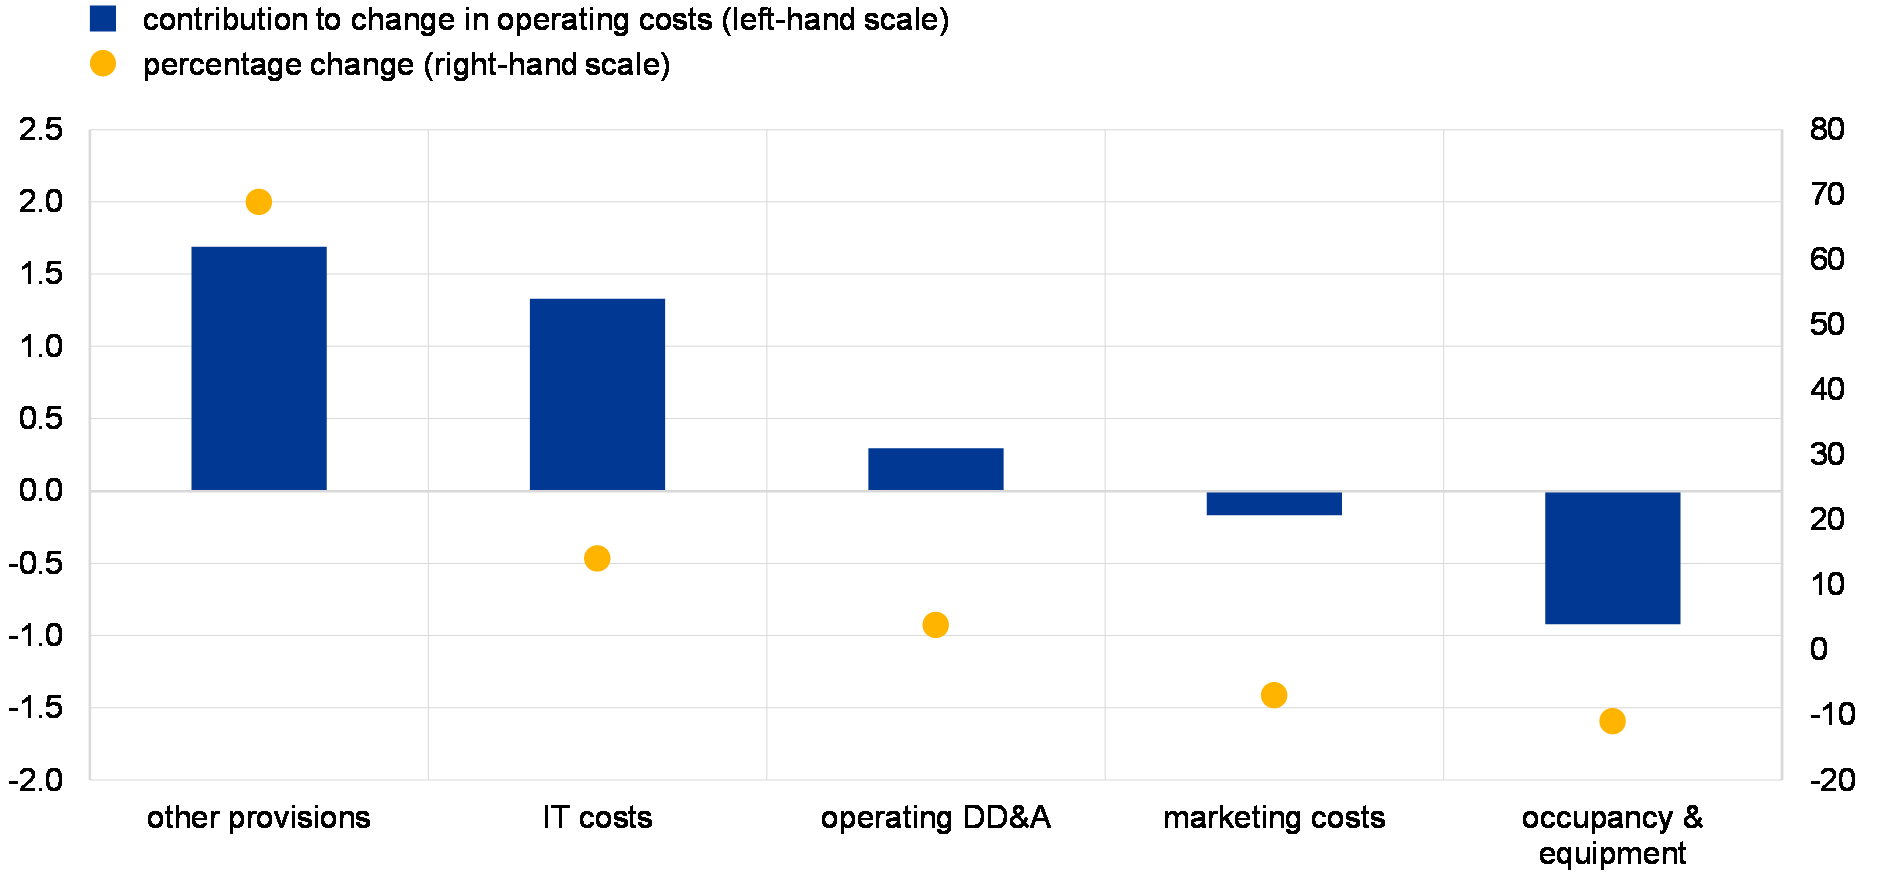
Sources: SNL and ECB calculations.
Notes: Sample includes 48 SIs covering close to 50% of total SI assets. Operating DD&A stands for operating depreciation, depletion and amortisation.
The rapid pace of technological advances in finance, along with a change in the competitive landscape, represent a key strategic challenge for banks in the medium-to-long term. On the one hand, a further shift away from physical branch networks to digital banking may offer a structural cost saving opportunity for banks (see Box 6). However, the ability of banks to cut costs by exploiting digital banking will vary across countries depending on structural factors, such as labour laws, market structure (with fragmented banking systems offering more scope for cost savings) as well as branch efficiency (with over-branched countries having more opportunities for cost savings). On the other hand, technological innovation and heightened competition from other players (e.g. digital banks, fintech companies) may also increase pressure on retail banking revenues (e.g. via more intense price competition for deposits or a potential loss of overdraft and payments-related income).
Box 6
Cost efficiency of euro area banks
Improving operating efficiency is key if euro area banks are to raise their profitability to sustainable levels. The FSR has been consistently reporting on the basis of accounting indicators, such as the cost-to-income ratio (CIR) and the cost-to-assets ratio, that, on aggregate, euro area banks’ cost efficiency has deteriorated somewhat since 2010. While the improving cyclical environment is supporting bank profitability, raising it to levels that can ensure banks are able to provide financing to the real economy in a sustainable manner would benefit from improving their cost efficiency.
This box uses frontier analysis to estimate banks’ cost efficiency, focussing on the parameters that are under the effective control of management.[41] This approach is a useful complement to the accounting indicators typically used to assess efficiency in the banking sector.[42] A cost function is used to estimate banks’ relative ability to convert inputs into outputs while minimising costs. The most efficient bank is the one that incurs the lowest cost to generate a given amount of output at predetermined input prices. An advantage of this technique is that the resulting measure of cost efficiency controls for the fact that banks produce different outputs (loans and investments) and pay different prices for inputs (financial capital, labour and fixed assets), thereby allowing a better comparison across banks of different size, ownership structure, specialisation, etc. The bank on the frontier represents best practice in the banking sector and the remaining banks are measured against this benchmark.[43] Importantly, the technique distinguishes persistent inefficiency from time-varying inefficiency.
The analysis is based on a comprehensive set of euro area banks. The sample consists of commercial, cooperative and savings banks from 17 euro area countries over the period from 2006 to 2015 gathered from Bankscope.[44] After removing institutions with unreliable or low quality data and institutions that might have been misclassified, the resulting sample is an unbalanced panel of between 1,727 and 2,248 banks, depending on the year.[45]
The scope for efficiency gains by emulating best performers is sizeable (Chart A). The relative cost efficiency of the median euro area bank fluctuated between 82% and 83% over the period from 2006 to 2015. These findings suggest that if the median bank operated on the efficiency frontier, it could produce the same level of output at only 82% to 83% of its current costs.[46] In other words, about 17-18% of costs can be attributed to cost inefficiency relative to the most cost-efficient bank. Looking across bank specialisations, overall efficiency is lower for commercial banks than for cooperative and saving banks on account of lower persistent inefficiency in the latter two (see below). There is also wider dispersion of efficiency within the commercial bank category than in the other categories.
Chart A
Overall efficiency has declined slightly in the euro area banking sector
Overall efficiency by bank specialisation
(percentages; 25th, 50th and 75th percentile for all banks and each bank specialisation)
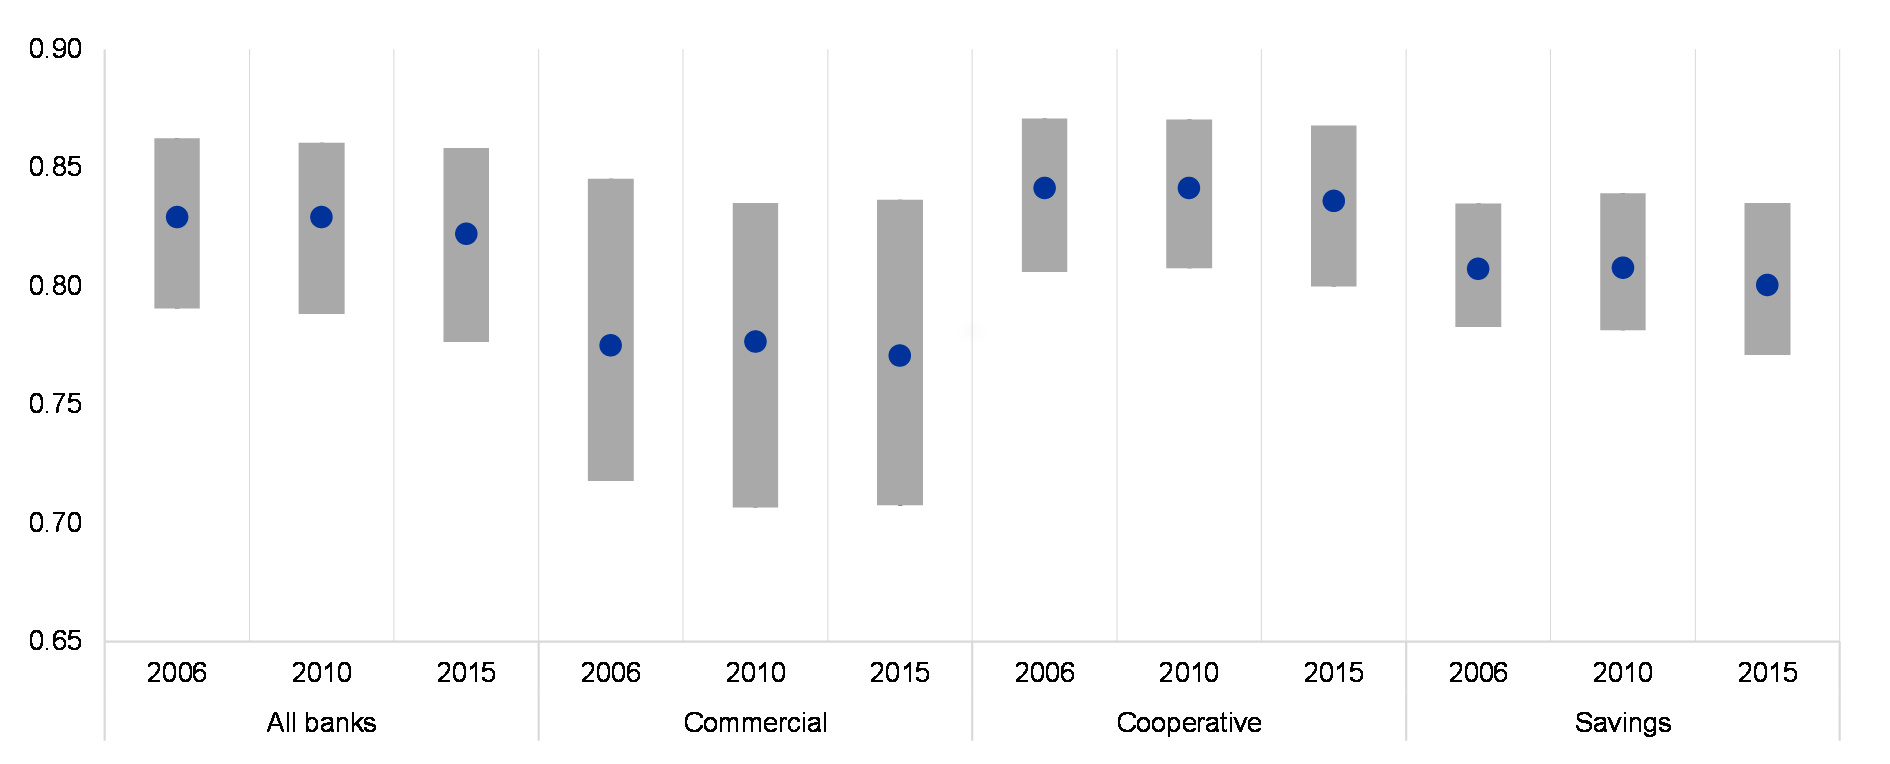
Sources: Bankscope and ECB calculations.
The results also suggest that the relative efficiency of the median bank has decreased over time, as the overall efficiency score fell by about 0.8 percentage points between 2010 and 2015. The decline in efficiency is observed across all three categories of bank. The results also confirm previous findings in the FSR suggesting that progress to date in the area of cost efficiency gains remains limited.
Chart B
Persistent inefficiency is the largest component of overall inefficiency
Persistent efficiency by bank specialisation
(percentages; 25th, 50th and 75th percentile for all banks and bank specialisation)
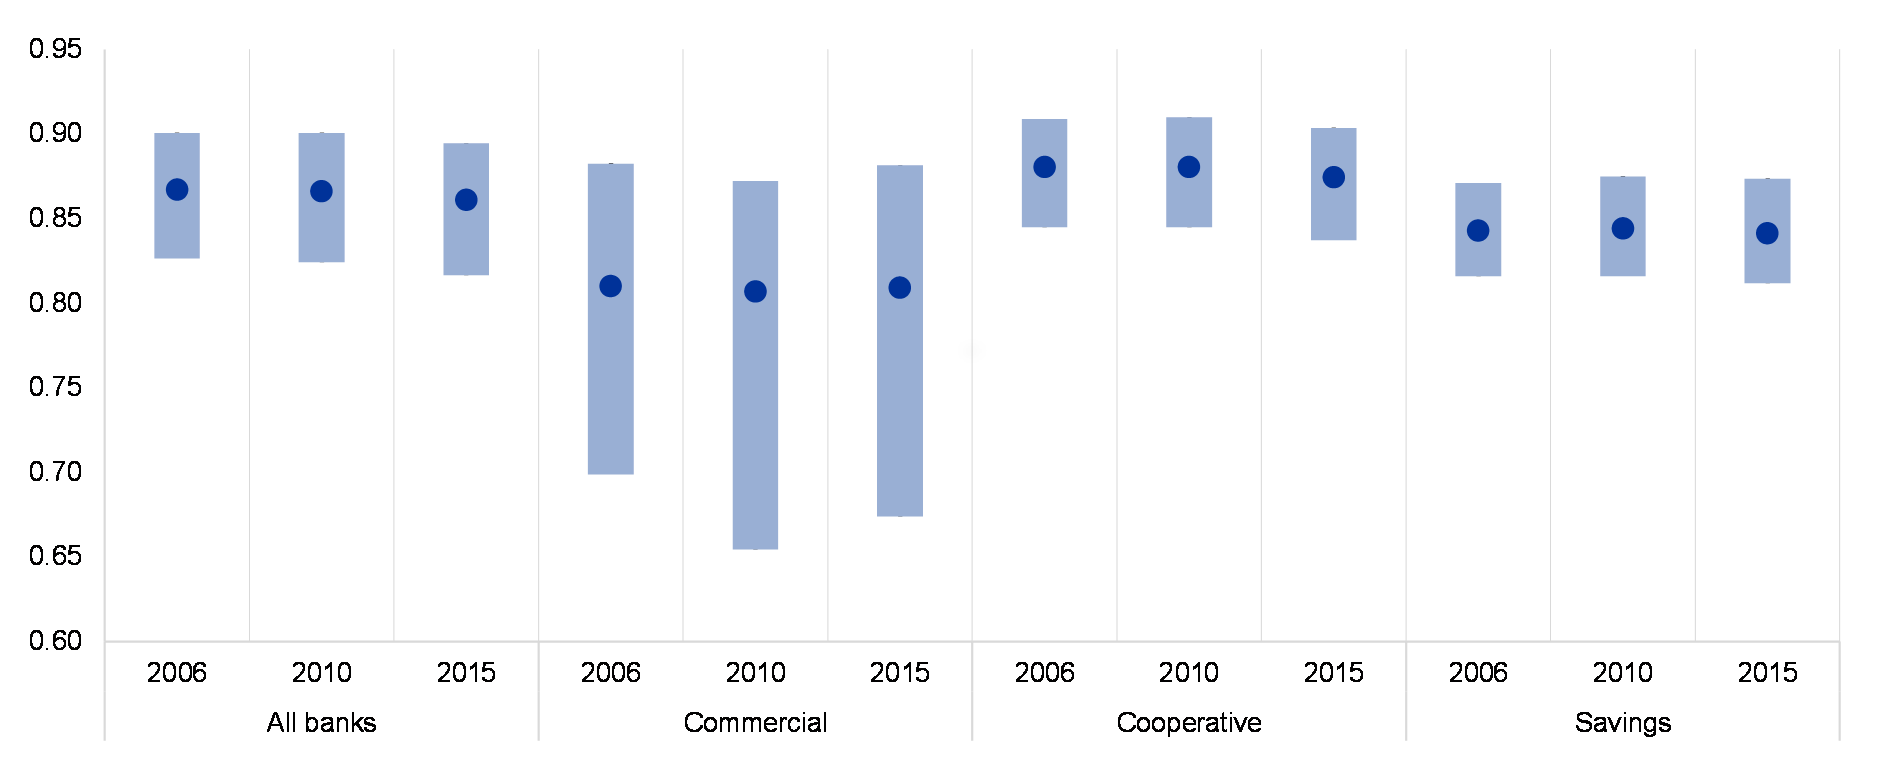
Sources: Bankscope and ECB calculations.
The largest contribution to bank inefficiency comes from persistent inefficiency (see Charts B and C). In fact, persistent efficiency scores point to inefficiency levels in banks of between 11.9% and 20.4% (across time and business models), whereas the results for time-varying inefficiency suggest that the median bank uses only between 3.6% and 4.4% of its resources (across time and business models) inefficiently as a result of time-varying factors.[47] Looking at the evolution of time-varying efficiency across bank specialisations, the largest decline can be seen in commercial banks between 2010 and 2015.
Chart C
Time-varying efficiency has declined, particularly for commercial banks
Time-varying efficiency by bank specialisation
(percentages; 25th, 50th and 75th percentile for all banks and each bank specialisation)
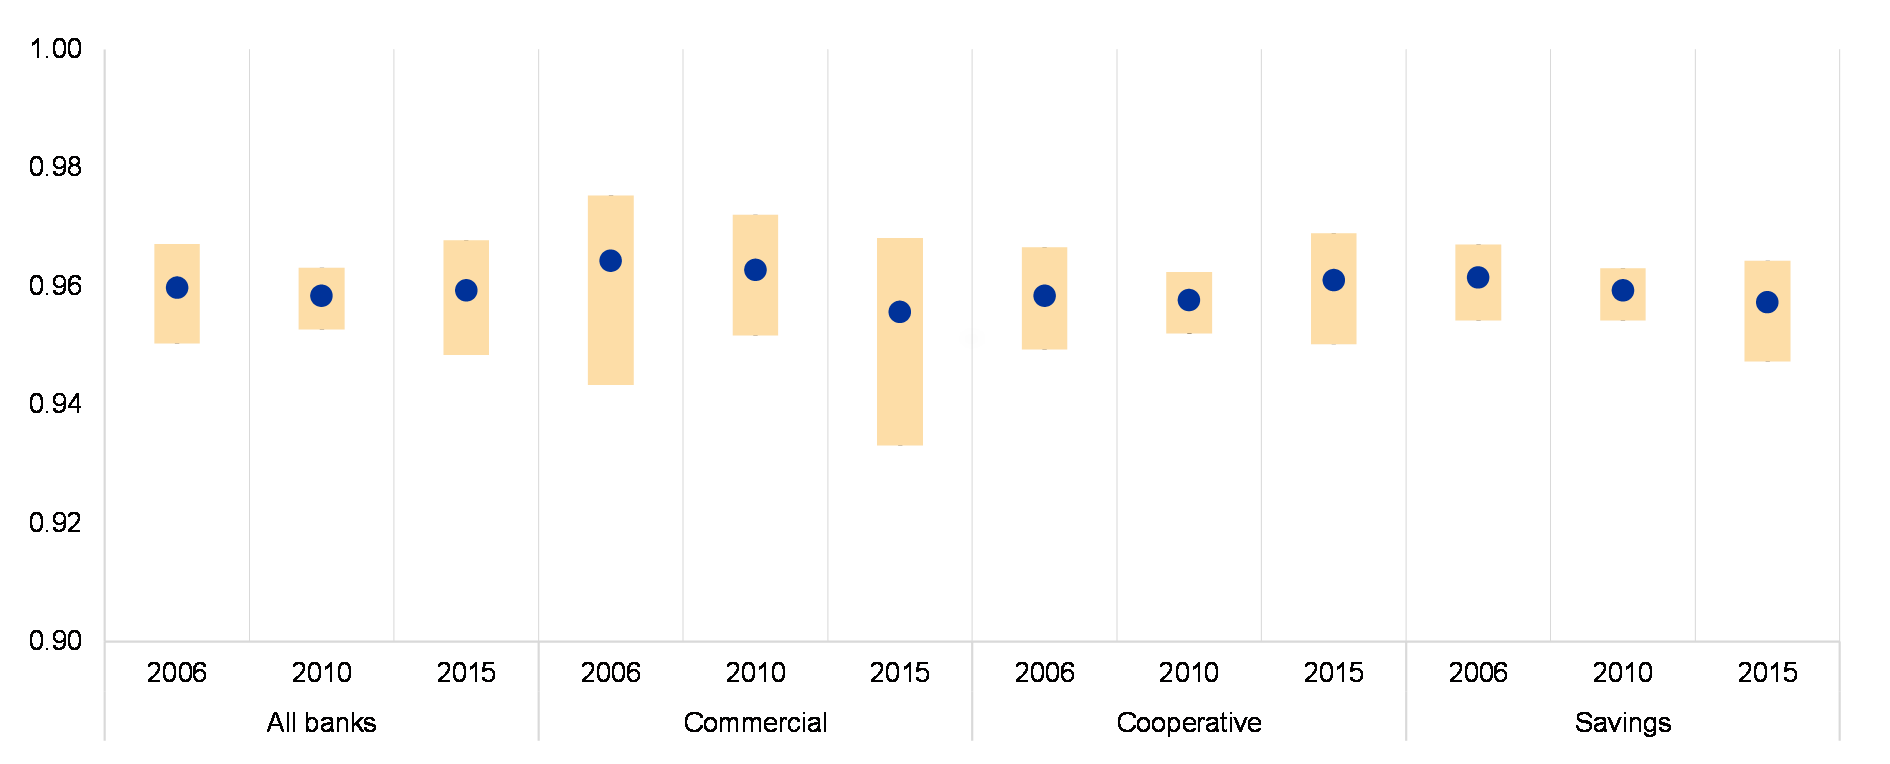
Sources: Bankscope and ECB calculations.
These results suggest that long-term structural factors, such as location, client structure, macroeconomic environment, regulation, etc., play a significantly bigger role in bank efficiency than time-varying factors.[48] They also underline the importance to improve structural efficiency. Options could include (further) branch network and staff rationalisation, increased digitalisation (particularly in the case of countries where the distribution of banking products remains overly reliant on branch networks) and mergers and acquisitions both within countries and at the euro area level (to achieve economies of scope and scale).
NPL reductions accelerated in 2017, but further progress is needed
The reduction of NPL stocks gathered pace in 2017. Euro area significant institutions’ aggregate NPL stock shrunk by over €150 billion last year, nearly twice as much as in 2016, while their aggregate NPL ratio dropped to 5% (see Chart 15 in the Overview). The improvement in asset quality metrics was broad-based across countries, reflecting banks’ increased efforts to address legacy NPL portfolios as well as favourable macroeconomic conditions. The rate of progress varied across high-NPL countries, with NPL ratio declines ranging between 1 and 5.7 percentage points, while the reduction in the absolute stock of NPLs ranged between 10% and 28% (see Chart 3.7). NPL declines in the NFC sector accounted for over 70% of the overall reduction in the NPL stock in 2017, almost equally split between SME and other NFC loans.
Chart 3.7
The rate of progress in NPL reduction varied across countries
Change in NPL ratios and stocks in high-NPL countries between 2016 and 2017
(2016-17, ratios, percentage changes)
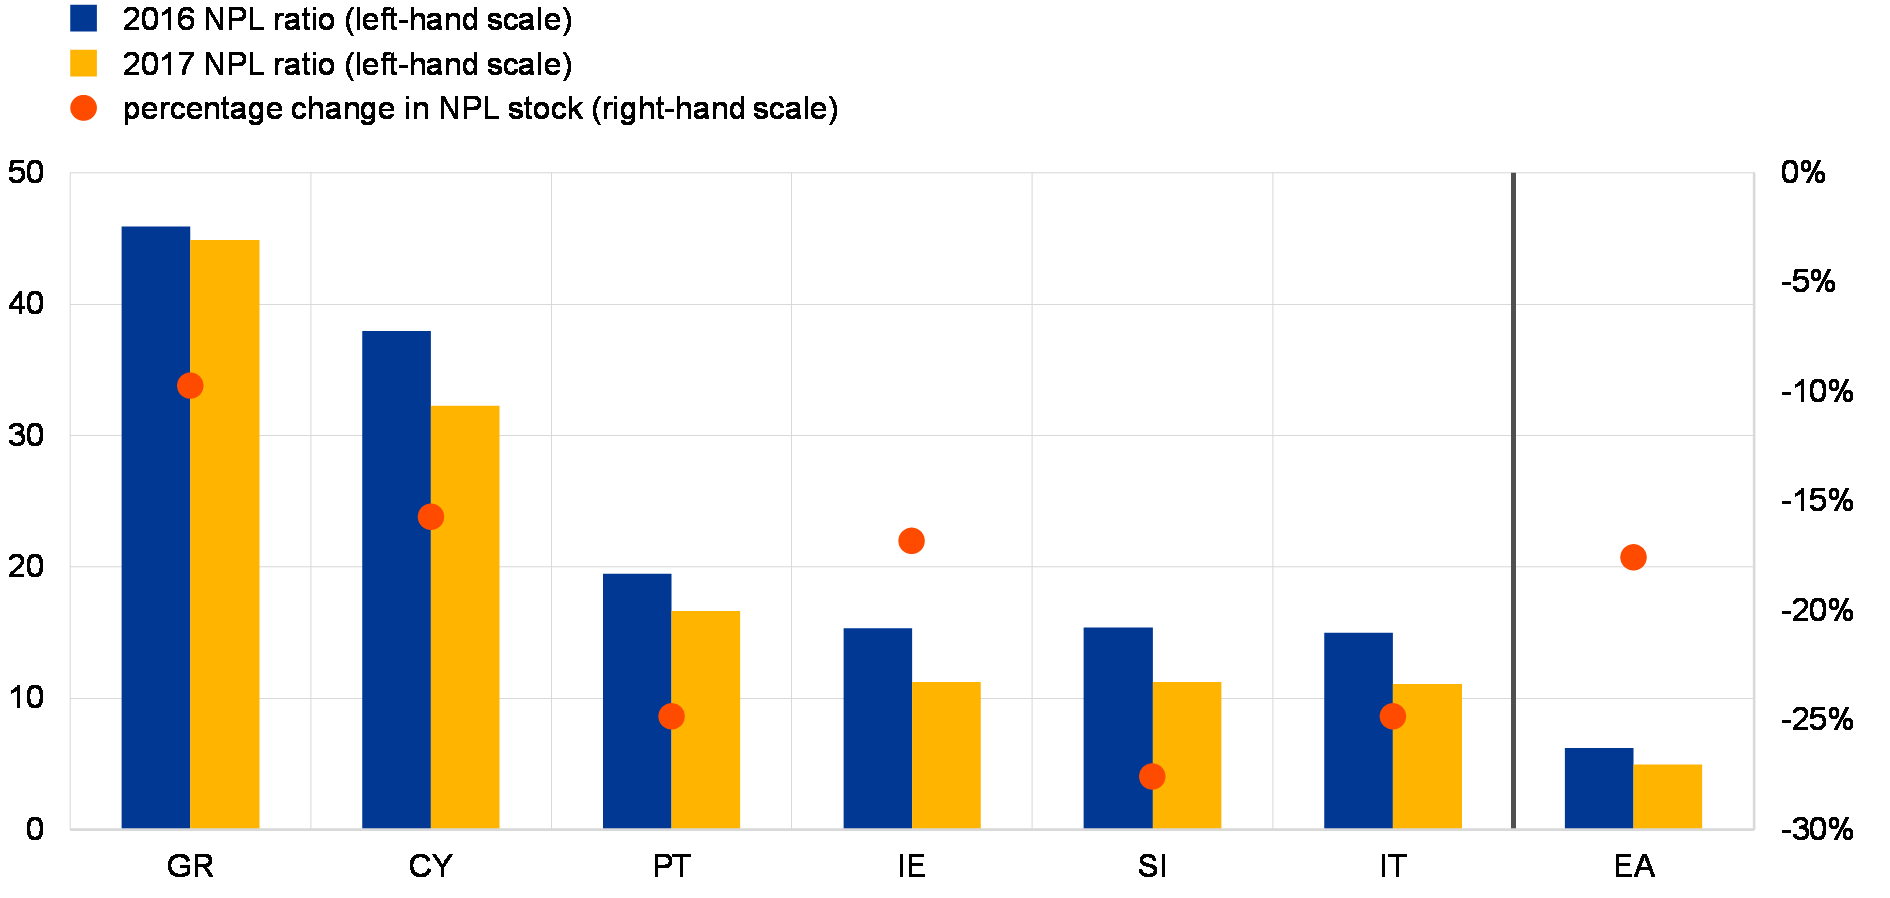
Source: ECB.
Notes: Based on country-level aggregates for SIs. In line with FINREP reporting on non-performing exposures, loans and advances also include cash balances at central banks and other demand deposits.
Notwithstanding these improvements, a number of banks are still burdened with high NPLs and need to accelerate NPL reductions. While the share of significant institutions with double-digit NPL ratios has nearly halved over the last three years (see Chart 3.8), a number of banks need to continue to strengthen their efforts to bring down NPL ratios to sustainable levels. To this end, banks with elevated NPL levels are implementing ambitious NPL reduction plans over the next few years. For a sample of 17 high-NPL banks publicly disclosing their quantitative targets, the median reduction in NPL ratios would be around 7 percentage points by the end of their target horizon (varying from 2019 to 2022).
Chart 3.8
The share of significant institutions with double-digit NPL ratios has nearly halved in the last three years, but a number of banks need to accelerate NPL reductions
Share of euro area significant institutions by NPL ratio bracket
(2014-17, percentage shares)
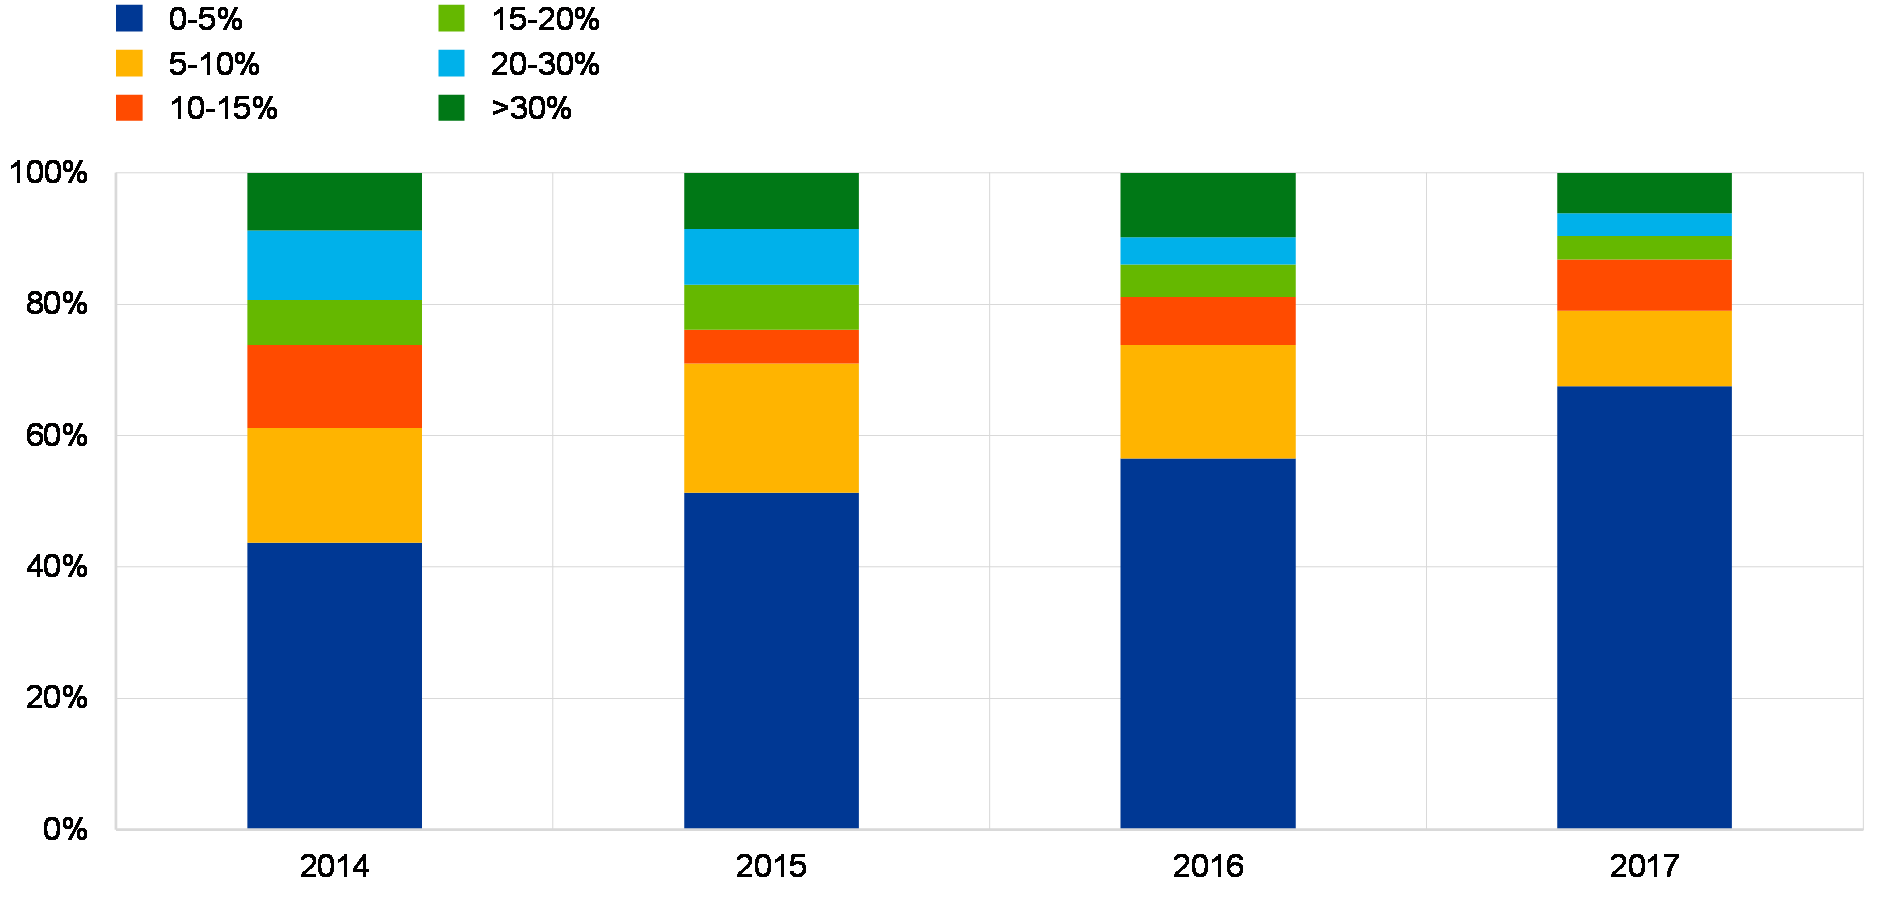
Source: ECB.
NPL coverage continued to edge up in high-NPL countries, partly reflecting the first-time adoption of IFRS 9. While the aggregate NPL coverage ratio remained broadly stable in 2017, NPL coverage continued to improve in the majority of high-NPL countries, with the median coverage ratio increasing from 47% to 49% over the last year. Furthermore, a number of banks used the first-time adoption of IFRS 9 rules to significantly improve the coverage of NPLs as of 1 January 2018. Based on public disclosures for a sub-set of high-NPL banks applying transitional arrangements under IFRS 9, the median estimated increase in NPL coverage due to IFRS 9 first-time adoption from the beginning of 2018 was 4 percentage points relative to stated end-2017 coverage levels.
Chart 3.9
A number of banks target significant NPL reductions in the medium term
End-2017 NPL ratios versus medium-term targets for selected banks
(percentages; median, interquartile range and 10th-90th percentile range)

Source: Individual banks’ disclosures.
Notes: Based on a sample of 17 high-NPL banks.
Policy initiatives underway aim to address legacy NPLs and to prevent the build-up of high NPL stocks in the future. Significant progress has been made in implementing the EU Council’s NPL action plan, including the European Commission’s proposal on a prudential provisioning backstop for newly originated loans that become non-performing (applying to loans originated after 14 March 2018), measures aimed at fostering growth of secondary NPL markets by removing undue impediments to selling NPLs (see Box 7), as well as guidance on a blueprint for national asset management companies. For its part, the SSM published an addendum to its NPL guidance setting out its supervisory expectations for the prudential provisioning of new NPLs (applying to NPLs which were classified as such after 1 April 2018). National authorities could complement these measures with initiatives to foster the development of NPL markets, such as setting up NPL transaction platforms (see Special Feature A of the November 2017 FSR).
Chart 3.10
Coverage ratios continued to improve in the majority of high-NPL countries
Median coverage ratios in high-NPL and other countries
(Q4 2014 – Q4 2017, percentages)
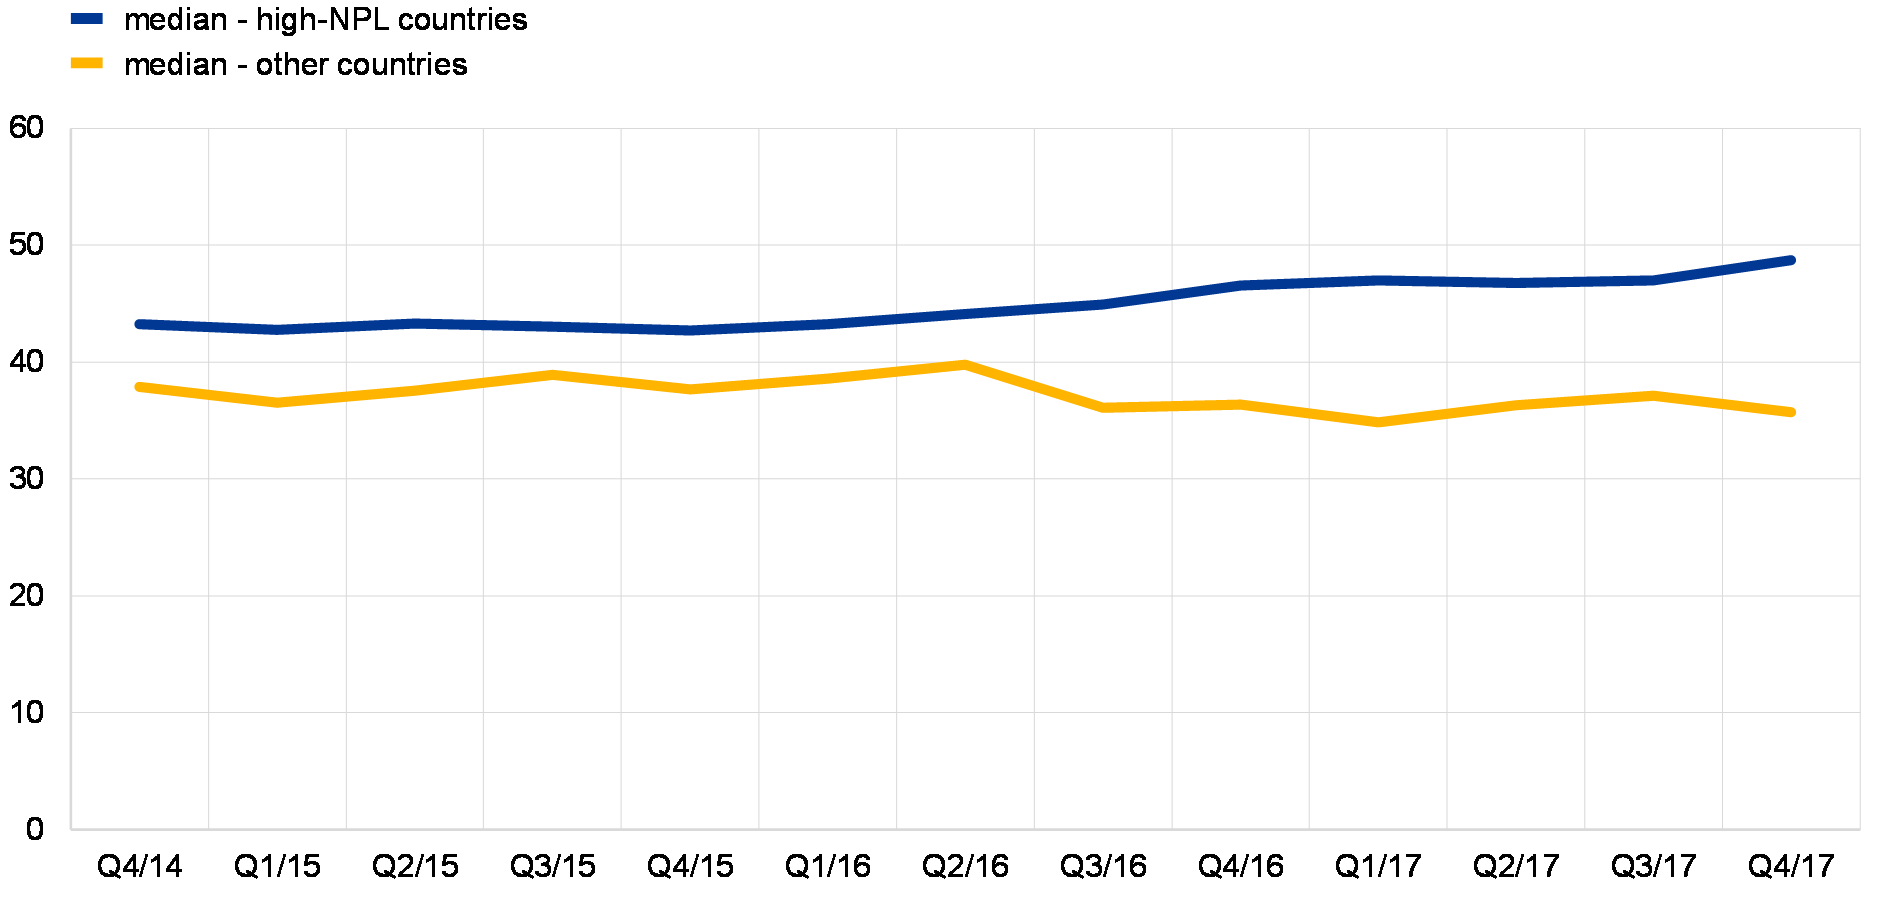
Source: ECB.
Notes: Based on country-level aggregates for significant institutions. High-NPL countries include Cyprus, Greece, Ireland, Italy, Portugal and Slovenia.
Box 7
Recent developments in pricing of non-performing loan portfolio sales
The market for NPLs in Europe has become more active in recent years. The total amount and volume of transactions has continuously increased in the last three years (see Chart A), although part of the increase in volumes can be attributed to just a few large transactions. Italy and Spain account for the majority of the market turnover. However, the geographical scope of NPL markets in the euro area has also widened, with transactions starting in Greece in 2017 and in Cyprus in 2018. At the same time, market activity in more mature NPL markets, such as Ireland, has weakened against the backdrop of a diminishing supply of NPLs.
Chart A
Transaction volumes in secondary markets for NPLs are on the rise
Total gross book value of traded NPL portfolios in the euro area
(Q3 2015 – Q1 2018; EUR billions)
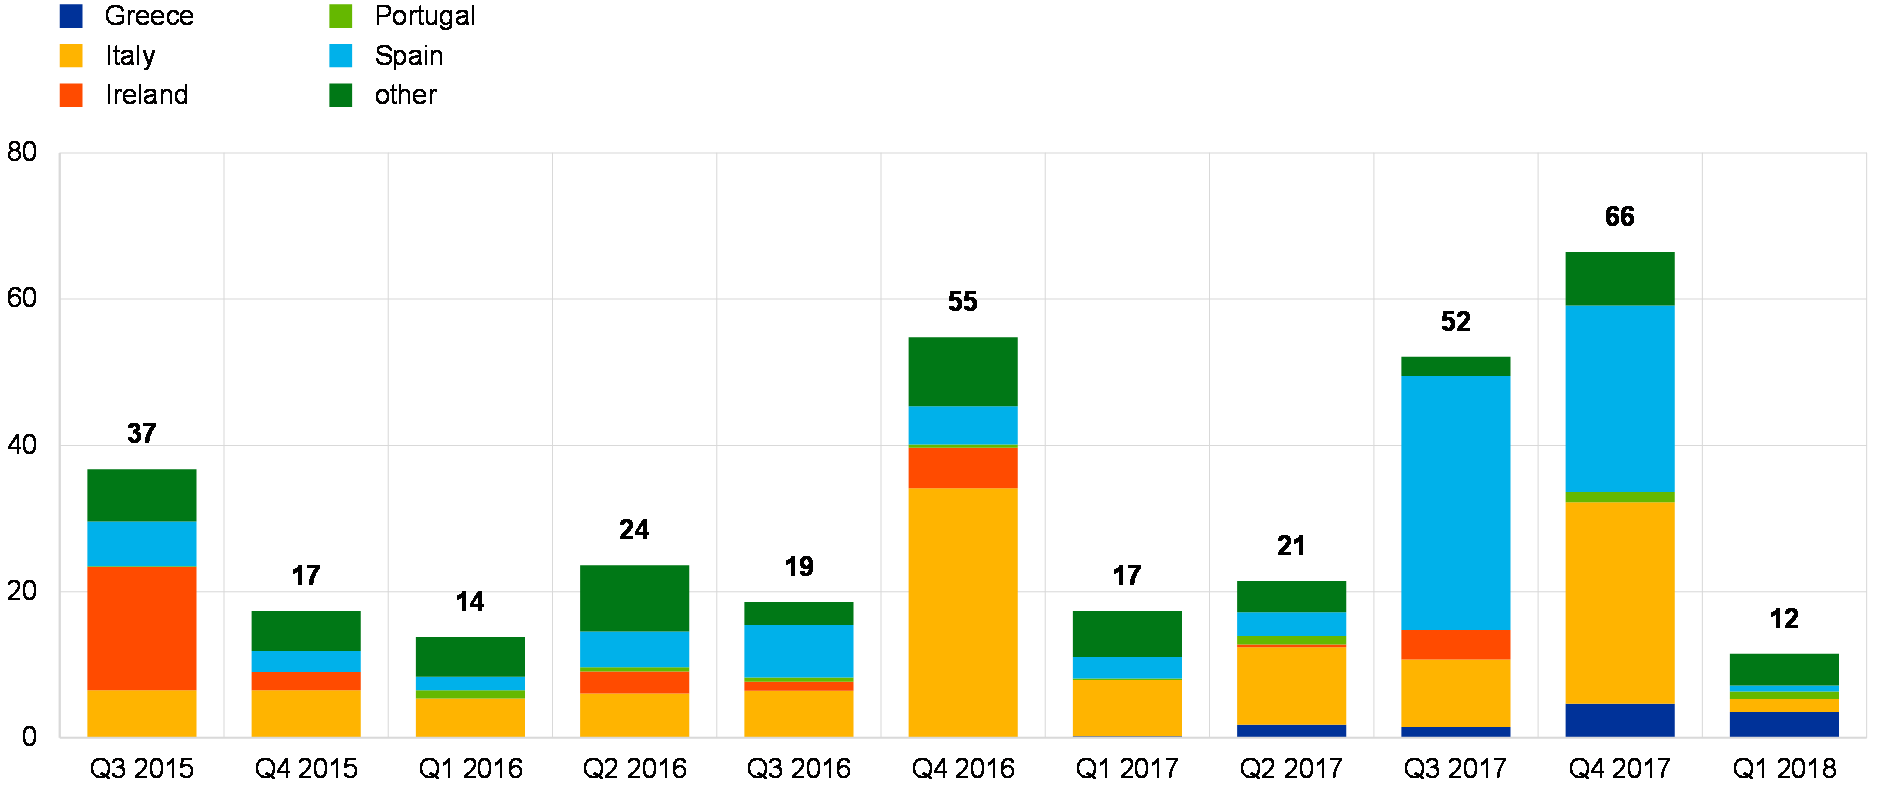
Sources: KPMG Debt Sales Monitor and ECB calculations.
Notes: €115 billion of transactions were reported as ongoing at the cut-off date of this FSR. Numbers above bars indicate total European transaction volumes for each quarter.
Data on actual NPL portfolio sales can be brought to bear to estimate the rates of return demanded by investors in recent transactions. The transaction prices reported for around 30 portfolio sales[49] were matched with supervisory data on provision and collateral coverage reported by seller banks at the time of the transaction to estimate the spread between the sale price and the net book value at which the seller held the NPLs. To account better for the differences in collateralisation levels of various portfolios, the internal rate of return (IRR) achieved by the NPL buyers was also estimated. In doing so, it is assumed that the NPL investor will recover the book value of collateral, taking on average four years until the recoveries materialise. Moreover, it is assumed that the unsecured part of the NPL portfolios will produce recoveries of 5%.[50]
Contrary to anecdotal evidence, the data do not show that increased market activity is accompanied by a tightening of the spreads between the book and market values of NPLs. These spreads are to a large degree explained by market frictions and information asymmetry, which give rise to a market scenario in which investors take advantage of market power. Earlier ECB analysis placed these spreads in the region of 20-40% of the gross book value of NPLs in high-NPL euro area countries.[51] Recently observed sale prices corroborate these estimates and show that these spreads have not declined substantially over the last few quarters (see Chart B). The dispersion of the estimated spreads remains wide.
NPL transaction prices do not imply any clear downward trend in IRRs. Pricing is consistent with average IRRs within a range of 13% to 20% over the past few quarters (see Chart B). As with spreads, estimated transaction-level IRRs are widely dispersed. The interquartile range of the IRR of transactions executed in 2017 lies between 9% and 19%. However, these results may not be fully conclusive, owing to three types of limitation. First, the sample of transactions is small and possibly not fully representative. Second, detailed data on the composition of NPL portfolios sold is not available, and it is therefore simply assumed that these portfolios are homogenous with the portfolios retained by banks. Finally, it is assumed that the time needed to complete recoveries is constant for all portfolios and across time.
Chart B
Pricing of NPL sales does not show a clear improvement over time
Estimated IRRs earned by NPL buyers and spreads between net book value and sale price
(Q3 2015 – Q4 2017; percentages, spread in percentages of gross book value)
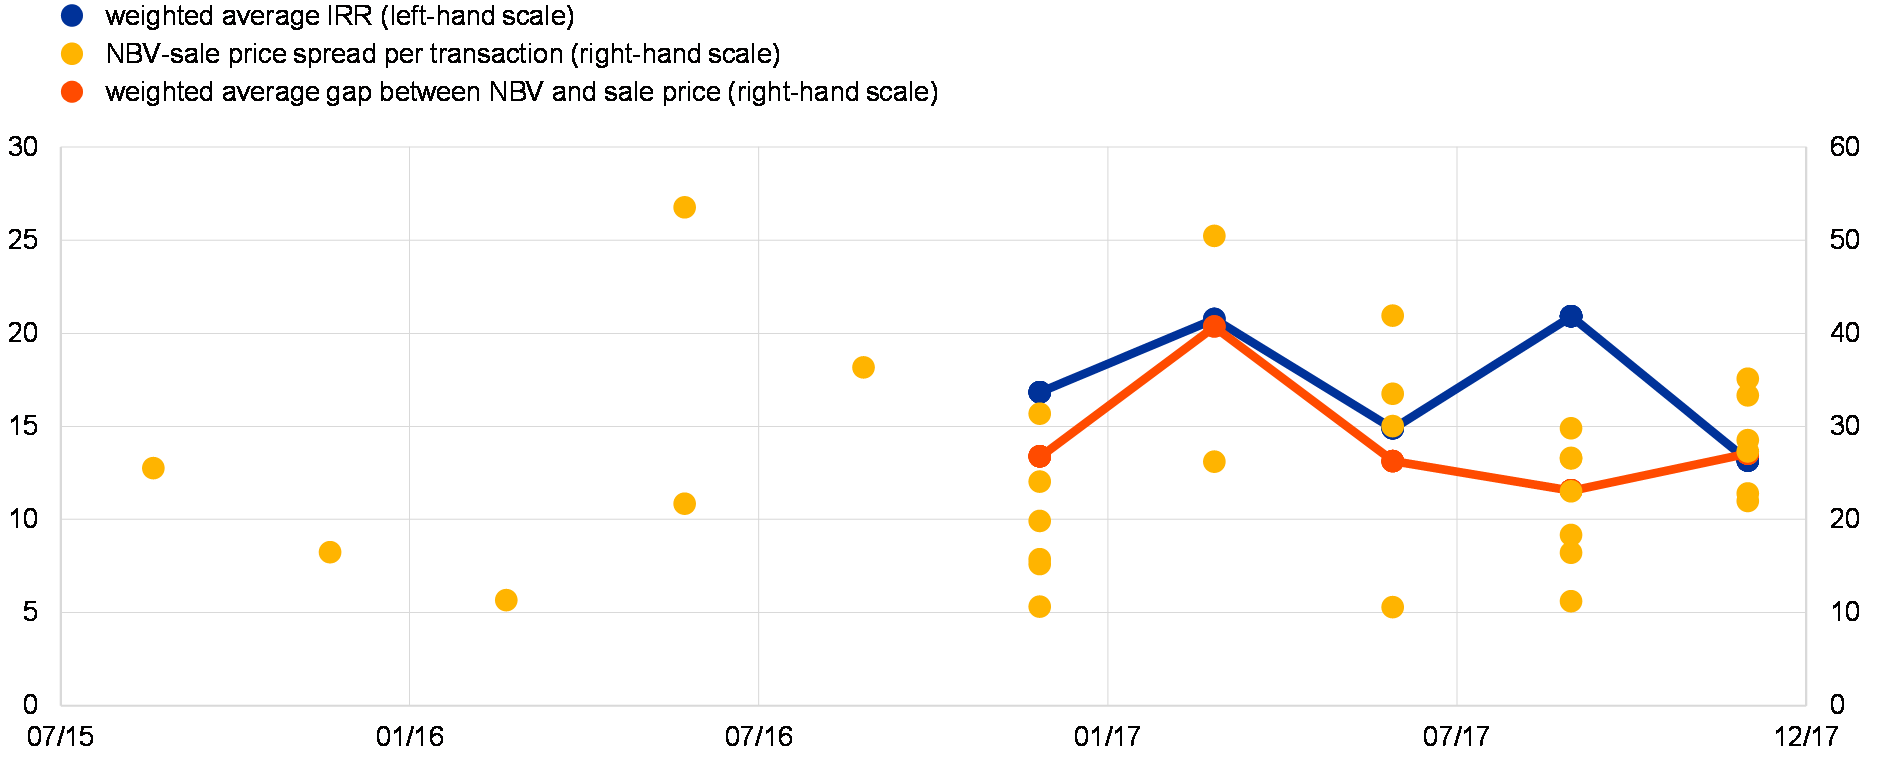
Sources: KPMG, Banca IFIS Market Watch, bank announcements and ECB calculations.
Notes: NBV – net book value. Averages are not calculated prior to the fourth quarter of 2016 owing to the very limited number of observations.
From a policy perspective, these results support the view that the secondary market for NPLs continues to be afflicted by several types of market failure. The increase in market turnover has not translated into substantially lower bid-ask spreads. This further reinforces the case for determined implementation of the European Council’s NPL Action Plan and for accompanying national reforms that would facilitate debt recovery, speed up insolvency processes and increase transparency around the value of NPLs.
Recovery in bank lending continues, but there are few signs of a significant increase in risk-taking
Aggregate credit risk measures reported by banks continued to improve in 2017. The riskiness of banks’ loan books, as measured by the global charge indicator[52], declined in most portfolios between 2016 and 2017 amid improving cyclical conditions (see Chart 3.11). At the same time, the recovery of bank lending to the private sector has continued, with consumer lending growing at a faster pace than other types of credit. Increasing risk-taking in this segment may have been motivated by profitability considerations as consumer loans offer higher lending margins than other loans (see Chart 1.15 in Section 1.3). Strong consumer lending growth was broad-based in the euro area, albeit with some dispersion across countries, with some countries experiencing double-digit growth rates over the past year (see Section 1.3). Such credit developments warrant close monitoring as higher risk-taking – if not fully compensated for by higher risk premia – may lead to a build-up of vulnerabilities in the medium term.
Chart 3.11
Measures of credit risk reported by banks continued to improve in 2017
Global charge indicator for non-defaulted standardised and IRB credit risk exposures
(2014-17, percentages)
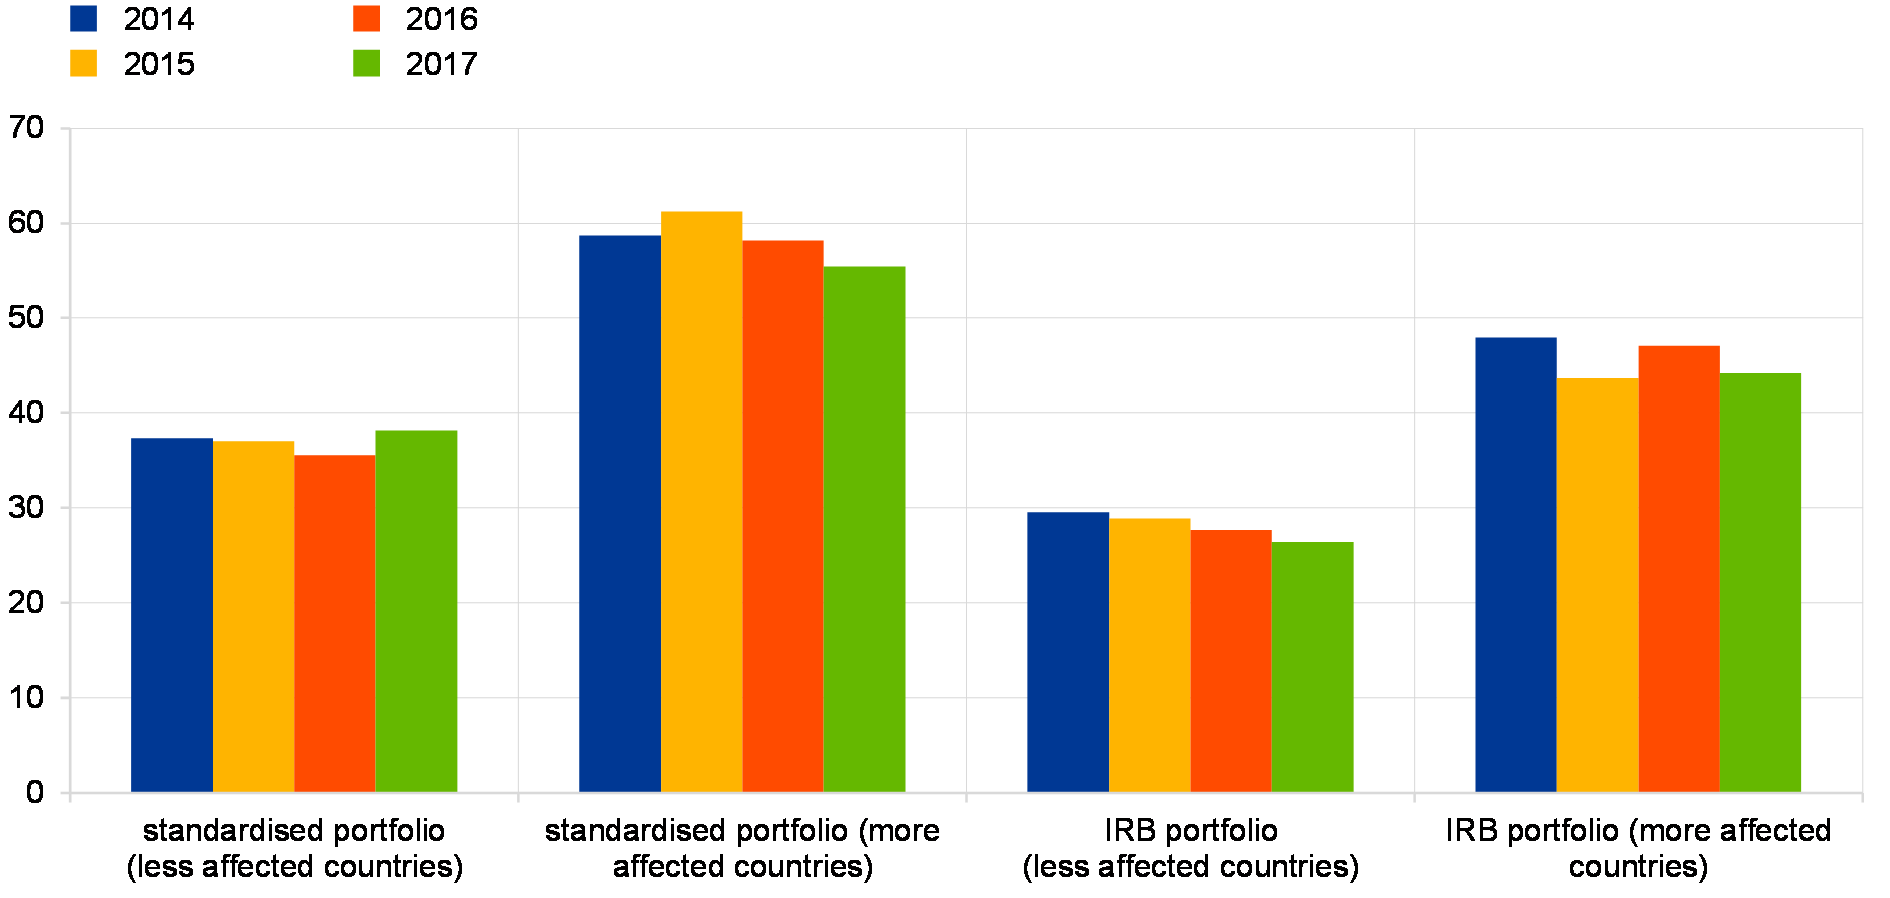
Sources: ECB and ECB calculations.
Notes: The global charge indicator is calculated as (risk-weighted assets+12.5*expected losses)/exposure at default and (risk-weighted assets+12.5*impairments)/exposure at default for the IRB (internal ratings-based) and standardised approaches, respectively. Excludes exposures in default; based on weighted averages for a sample of 101 SIs. Countries more affected by the crisis include Cyprus, Greece, Ireland, Italy, Portugal, Slovenia and Spain.
The acceleration of consumer lending was accompanied by an increase in the average duration of newly originated loans (see Chart 3.12). Countries with above-average consumer lending growth tend to have a higher share of loans with longer repricing periods (above one year). On the one hand, this development may benefit household borrowers by reducing their vulnerability to interest rate increases – and consequently banks’ credit risk – in the next few years. The flipside of the lengthening duration of banks’ consumer loan portfolios is that it may expose banks to higher interest rate risk under a scenario of rising rates. At the same time, the results of the ECB’s bank lending survey do not signal a broad-based easing of credit standards over the past year and there appears to be no relationship between lending growth and credit standards at the country level (with one exception).
Chart 3.12
Rapid growth in consumer lending along with a lengthening of average interest rate fixation periods
New business volumes for consumer lending by interest rate fixation period
(Jan. 2013 – Jan. 2018, € billions, 12-month cumulated new business)
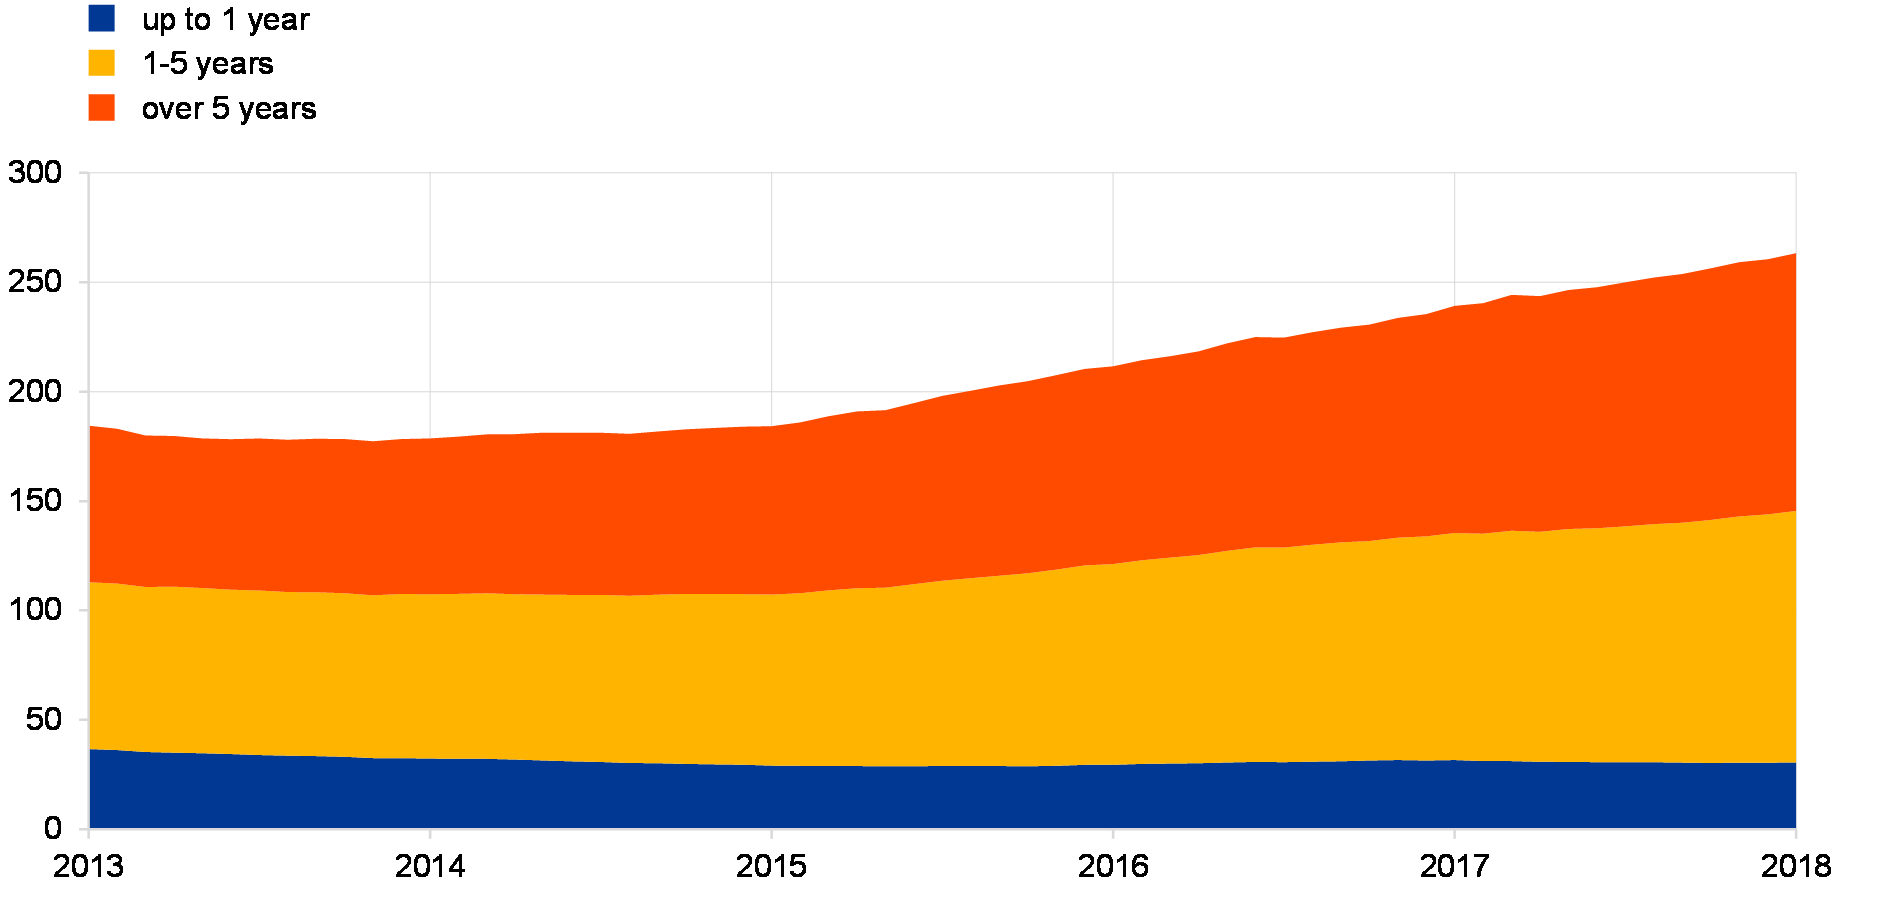
Source: ECB.
Growth in consumer lending is being spearheaded by banks that are lending to riskier borrowers. Based on IRB portfolios, the median bank’s expected losses on consumer loans (when measured in terms of exposure at default (EAD) or risk-weighted assets (RWAs)) are the highest of all loan portfolios, but they have remained broadly stable over the past year (see Chart 16 in the Overview). At the individual bank level, credit risk measures are higher for banks with stronger consumer loan growth, which may suggest that these lenders are adopting more aggressive loan origination practices, including targeting riskier borrowers. This notwithstanding, the gap in both reported probabilities of default (PDs) and losses given default (LGDs) narrowed between this group of banks and other institutions (see Chart 3.13).
Chart 3.13
Credit risk measures are higher for banks with stronger consumer loan growth
Expected losses as a percentage of EAD, PDs and LGDs on consumer loans by group of banks
(Q4 2014 – Q4 2017, percentages)
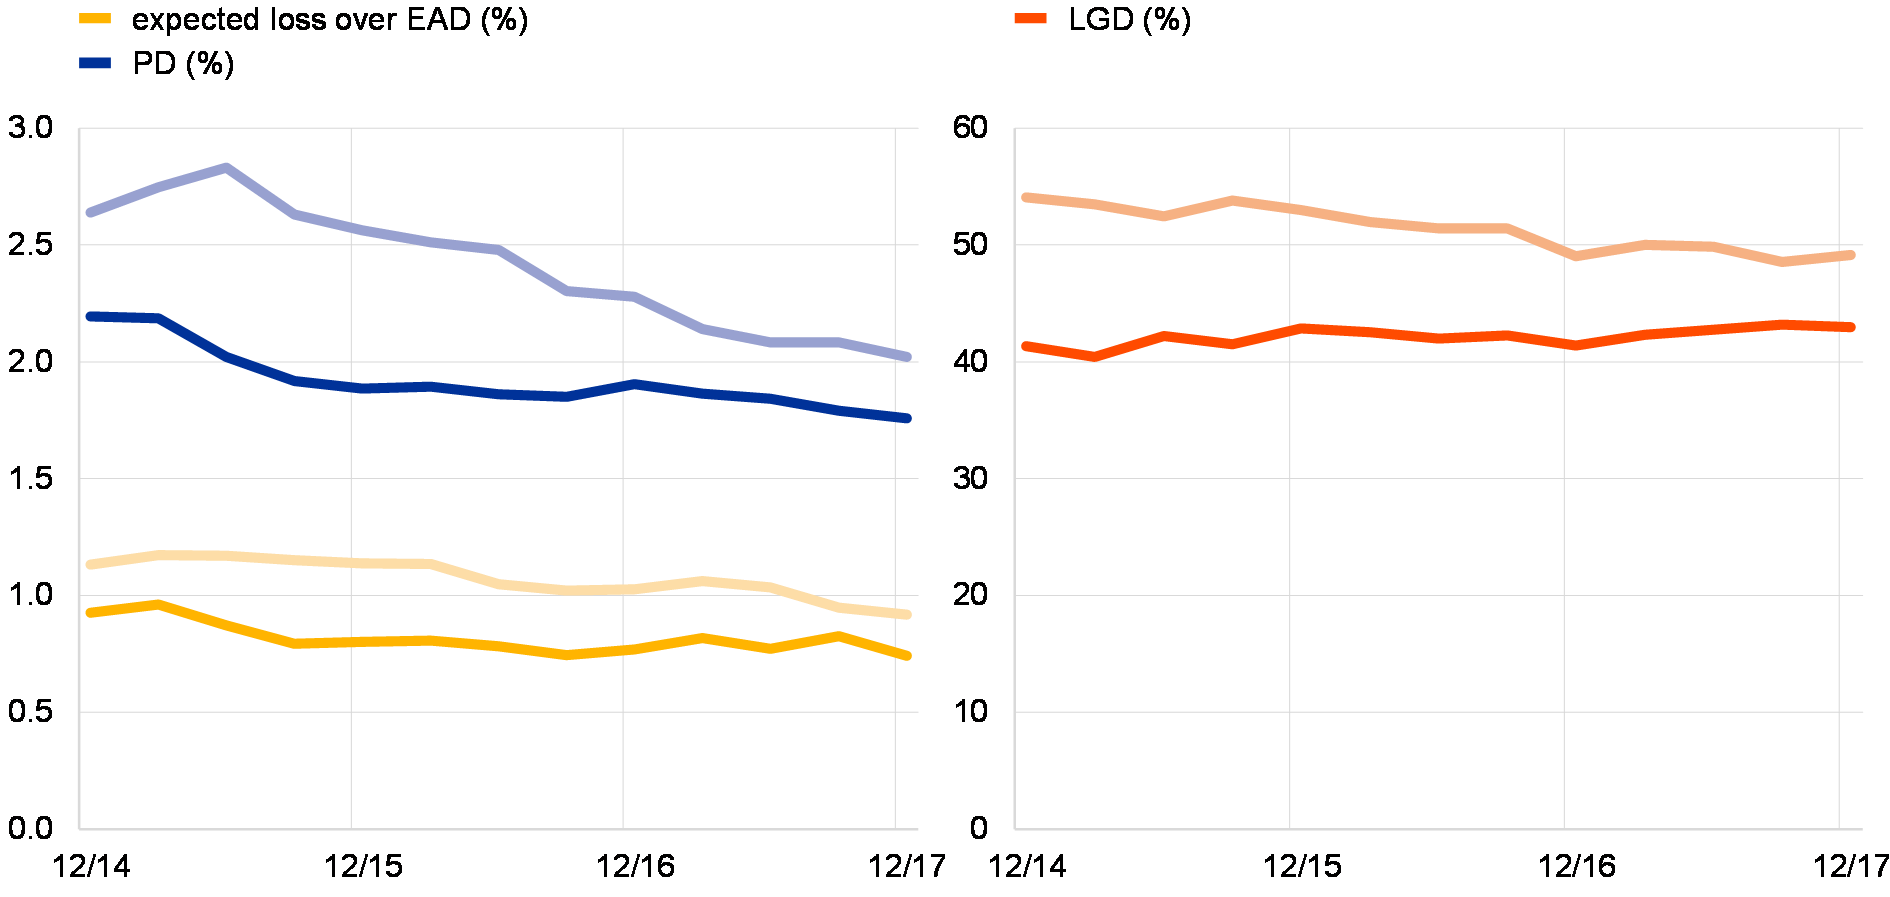
Sources: ECB and ECB calculations.
Notes: Based on 45 SIs with consumer loans in IRB portfolios. The lighter-coloured lines represent the top quartile of banks that saw a stronger increase in the ratio of consumer loans to total assets in the last two years.
The banks with the strongest consumer lending typically charge higher lending spreads (see Chart 3.14). While this partly reflects the fact that consumer lending growth was among the strongest in some of the countries more affected by the crisis – where borrower PDs remain higher relative to other countries[53] – the pricing behaviour of these banks appears to be commensurate with the higher credit risk in their portfolios. However, this analysis is subject to some caveats. First, it is based on information extracted only from banks’ IRB portfolios. Second, different types of consumer loan have different risk characteristics and pricing, but there is a lack of granular data on the composition of consumer loan portfolios.
Chart 3.14
Banks with the strongest consumer lending growth typically charge higher lending spreads
Lending growth, loan-deposit spread and prudential credit risk measures for banks with stronger consumer lending versus other banks
(2017, percentages; median, interquartile range and 10th-90th percentile range)
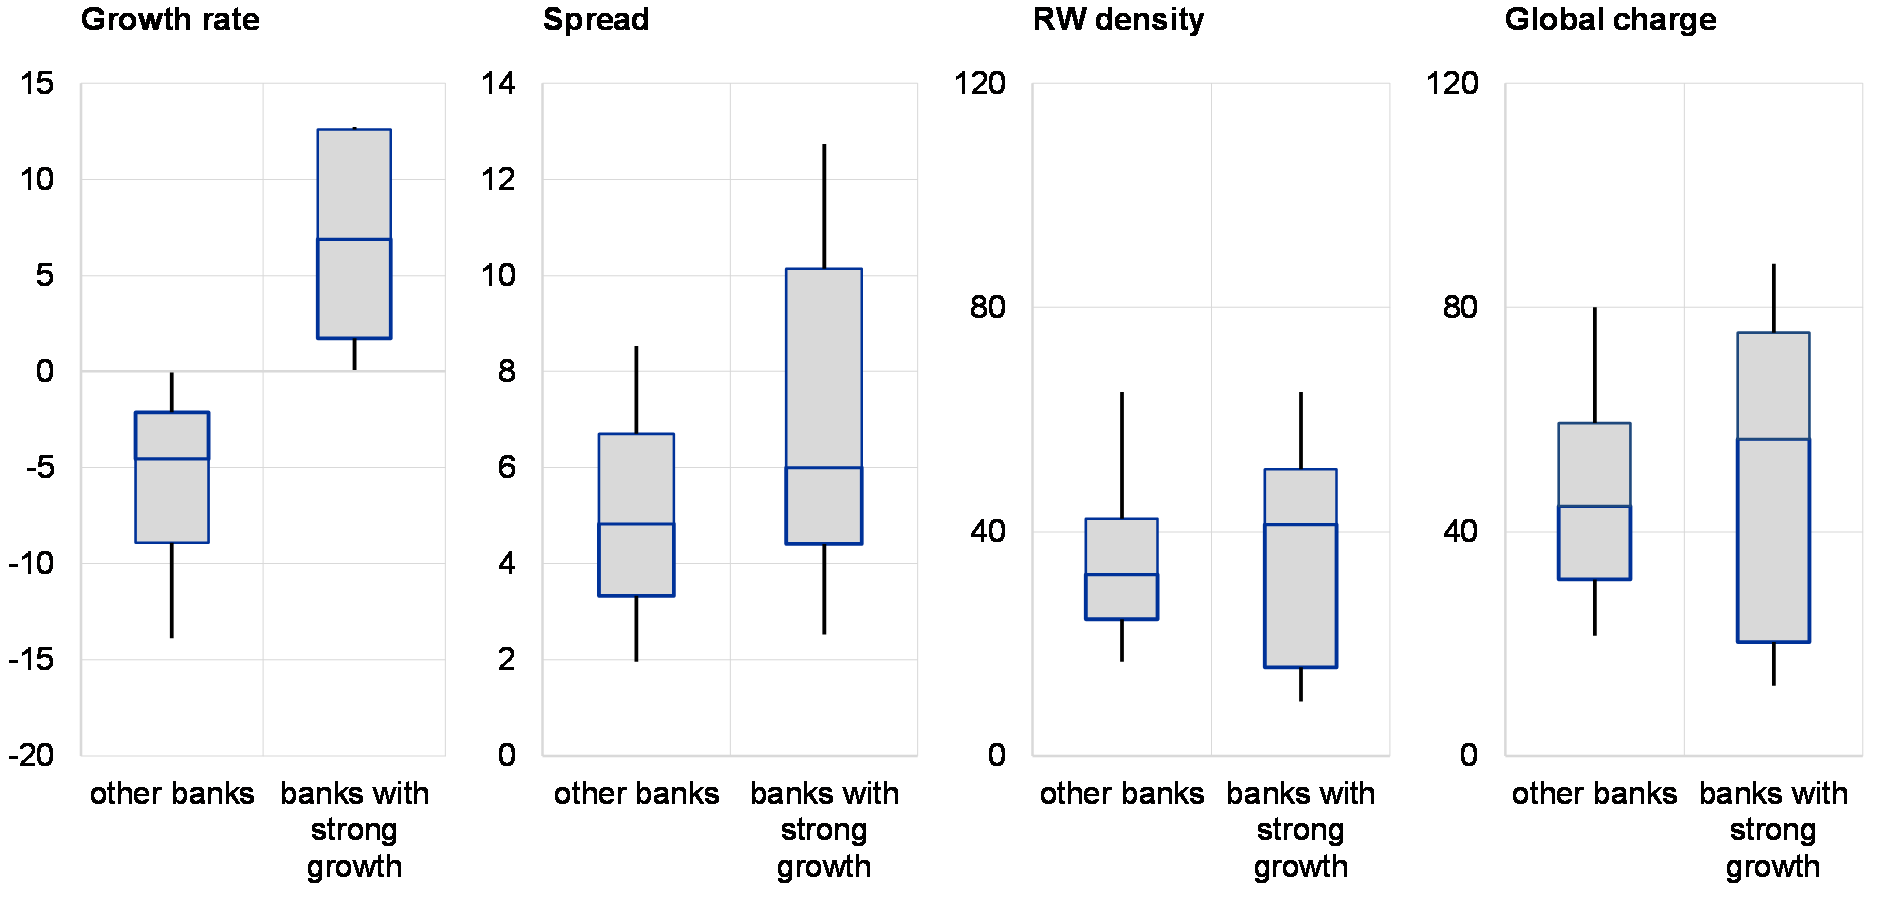
Sources: ECB and ECB calculations.
Notes: “Banks with strong growth” represent the top quartile of banks in terms of loan growth for consumption and other purposes. RW stands for risk weight.
Banks’ lending activity in regions outside the euro area declined slightly in 2017. Euro area significant institutions’ loans to the non-financial private sector in these regions dropped by 2% in 2017, mainly driven by reduced credit exposures to the US. Banks’ exposure towards EMEs remained broadly stable, with increases towards emerging Europe largely offsetting declines for most other EME regions. Amid favourable conditions in the global economy, asset quality improved across most advanced economy and EME regions (see Chart 3.15). On aggregate, banks’ NPL ratio on loans in economies outside the euro area stood at 4.5% at end-2017.
Chart 3.15
Euro area banks’ asset quality improved across most advanced economy and EME regions
Euro area significant institutions’ NPL ratios in regions outside the euro area
(2014-17, percentages)

Source: ECB.
Taking a closer look at banks’ credit exposures to the UK, their share remained stable at around 7% of total loans with exposures concentrated in a limited number of banks. By sector, loans to the non-financial private sector accounted for 51% of significant institutions’ total UK loans at end-2017, followed by interbank loans (24%), loans to other financial corporations (15%) and claims on government and the central bank (10%). Asset quality has improved over the last two years and banks’ aggregate NPL ratio for UK loans stood at a low level at end-2017 (1.3%). This improvement was broad-based across sectors and loan types, with the exception of consumer loans where the NPL ratio edged up in 2017. Looking at other exposures, despite a 33% decline over the last two years, euro area significant institutions’ UK-based derivative exposures accounted for over 30% of total derivatives. Therefore, without sufficient mitigating actions, a “hard Brexit” scenario could have an adverse impact on the euro area banking sector and more broadly on the end-users of centrally cleared derivatives due to their current reliance on UK central counterparties (in particular for interest rate swaps).
Turning to banks’ exposures to interest rate risk, on aggregate, risks in the banking book associated with potentially rising interest rates remain limited for euro area significant institutions. Under the scenario of an upward parallel interest rate shift of 200 basis points (bps), the change in the economic value of the banking book would equal only around 2% of own funds (see Chart 3.16 – left panel). Similarly, banks’ interest rate risk, on aggregate, remains moderate when measured by the sensitivity of their net interest income to rising interest rates (see Special Feature C).
Chart 3.16
Interest rate risk of significant institutions remains limited on aggregate, with banks in countries with fixed rate loans more vulnerable to rising interest rates
Change in the economic value of the banking book given a parallel upward interest rate shift of 200 basis points
(left panel: Q4 2015 – Q4 2017, percentages; right panel: Q4 2017; x-axis: percentages; y-axis: percentiles)
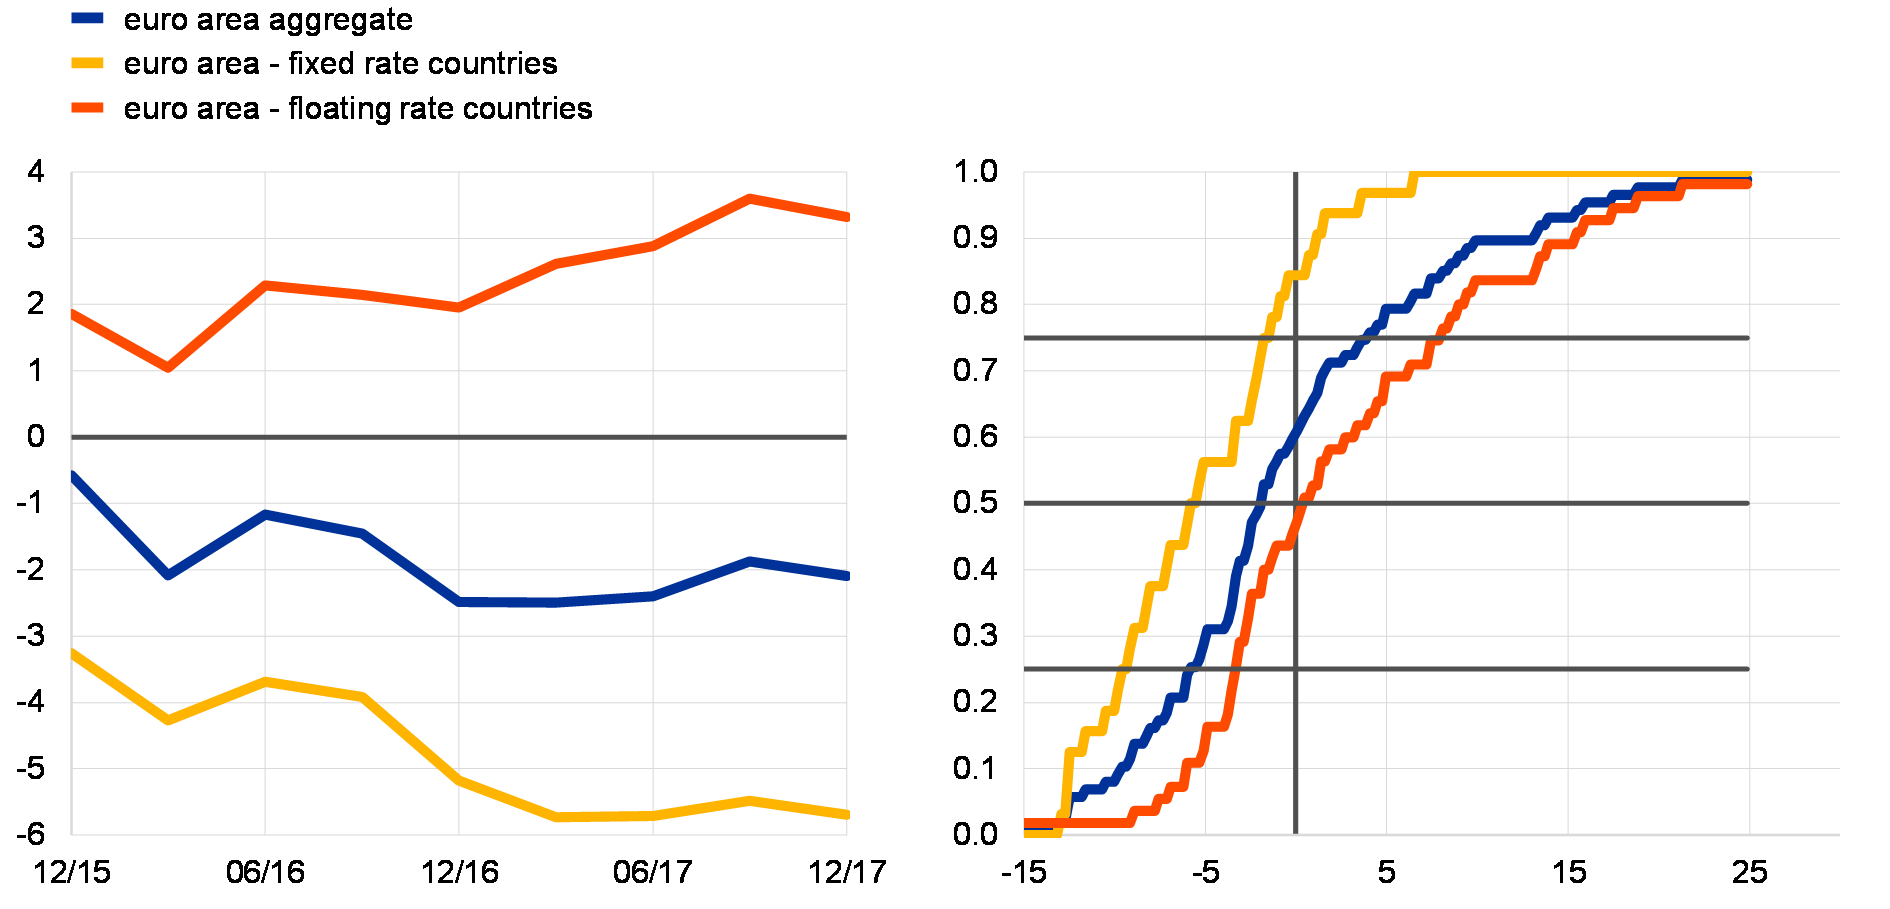
Sources: ECB and ECB calculations.
Notes: The chart shows the evolution over time of the impact of a rise in interest rates (left panel) and the empirical cumulative distribution of this impact for the most recent reporting period across individual banks (right panel). The impact of a rise in interest rates is measured by the change in economic value of the banking book as a share of regulatory own funds. The analysis is based on a sample of significant institutions which is split into fixed and floating rate countries based on the share of floating rate loans in total loans for house purchase. Fixed rate countries include Belgium, France, Germany, the Netherlands and Slovakia, while in all other euro area countries floating rates are considered to prevail. The black horizontal lines in the right panel represent the 25th, 50th and 75th percentiles of the distribution across individual banks.
Limited aggregate exposures, however, mask substantial heterogeneity at bank level, mainly driven by differences in loan-rate fixation practices. In particular, significant institutions operating in countries with predominantly fixed interest rates would be, on aggregate, adversely affected under the scenario of rising interest rates, with an estimated decline in economic value of close to 6% of own funds. By contrast, banks in floating rate countries appear to benefit on aggregate from rate increases, with an estimated economic value increase of over 3% of own funds. Banks’ interest rate risk exposures also vary significantly across institutions within these two country groups. For instance, around 25% of the significant institutions operating in fixed rate countries report a present value loss of more than 10% of own funds, while more than 40% of significant institutions in floating rate countries would see a decline (rather than an increase) in economic value (see Chart 3.16 – right panel).
Bank solvency positions continued to improve, mainly due to increases in capital
The resilience of euro area banks continued to improve in 2017. The strengthening of banks’ capital positions accelerated somewhat in 2017 following only a modest improvement in 2016. As a result, by end-2017, euro area significant institutions’ aggregate fully loaded common equity Tier 1 (CET1) ratio reached a solid level of above 14%. While the improvement was broad-based across countries, differences remain in banks’ capital strength between country groups in the euro area. On aggregate, banks’ fully loaded CET1 ratio in the countries more affected by the crisis remained well below that of banks in the other countries, mainly reflecting the lower level of internal capital generation through retained earnings (see Chart 3.17).
Chart 3.17
Solvency ratios continued to increase in 2017, but some heterogeneity remains in the levels, partly reflecting differences in internal capital generation
Euro area significant institutions’ aggregate fully loaded CET1 ratios and the composition of CET1 capital
(2015-17, percentages)
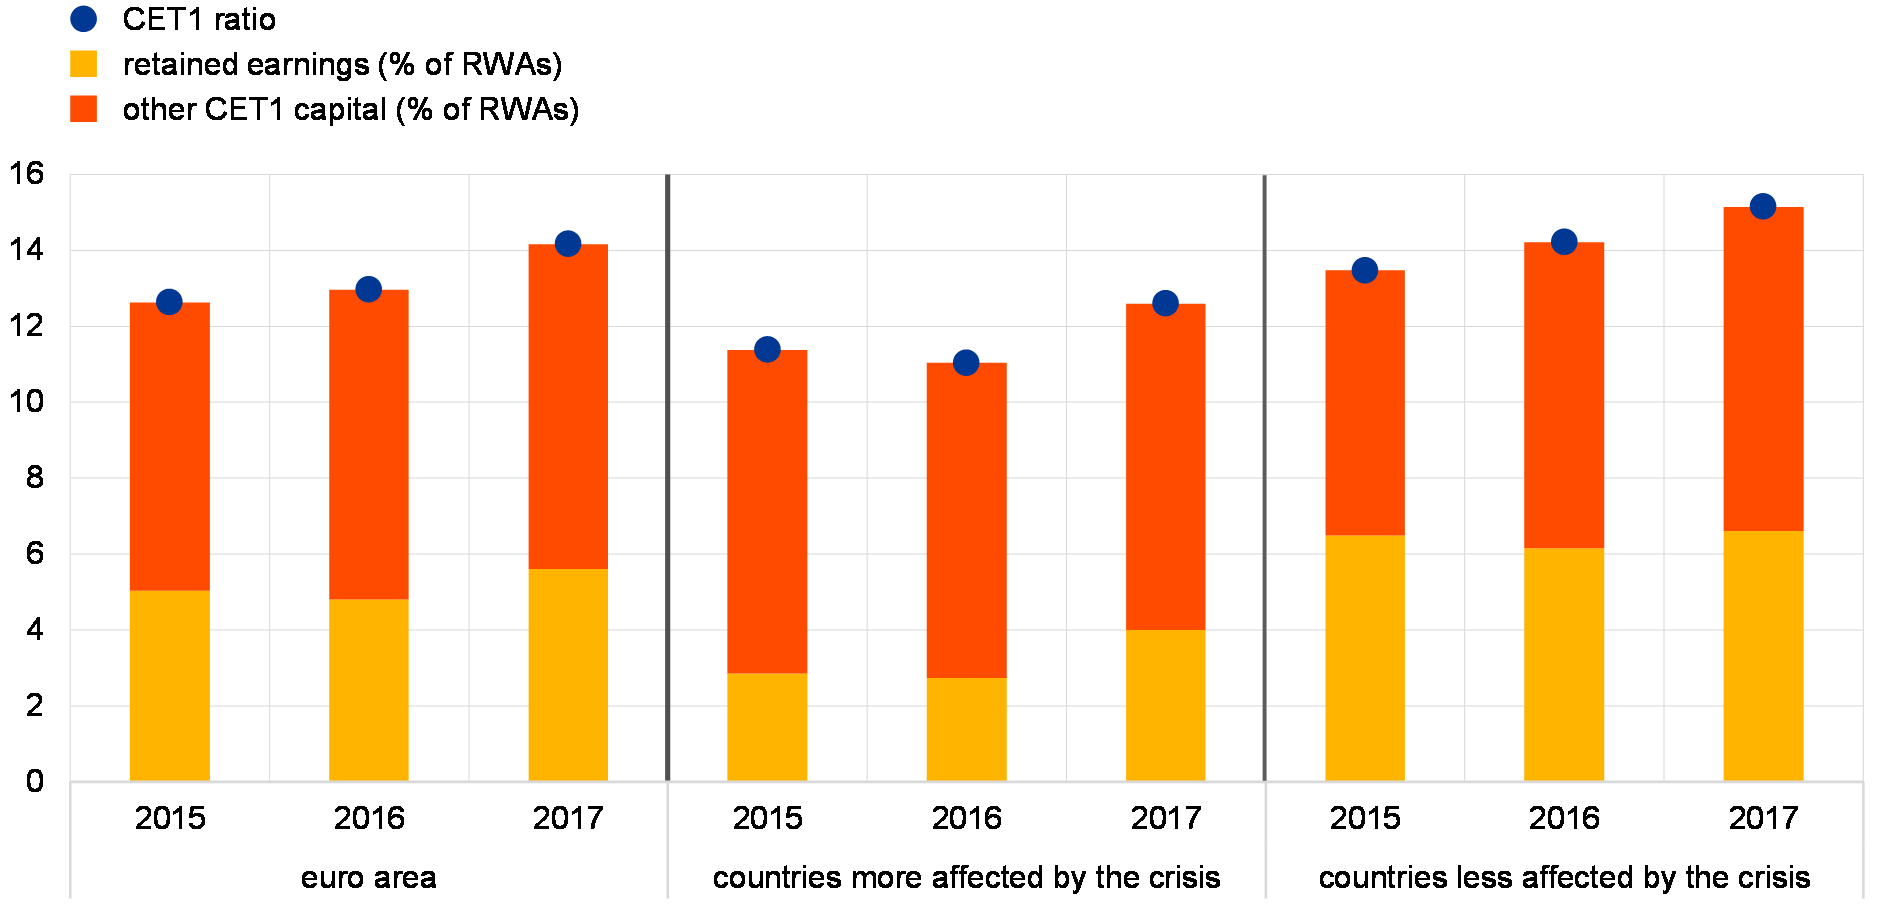
Sources: ECB and ECB calculations.
Notes: Based on a balanced sample of 100 SIs. Countries more affected by the crisis include Cyprus, Greece, Ireland, Italy, Portugal, Slovenia and Spain.
The improvement in solvency ratios in 2017 was mainly driven by increases in capital, while asset deleveraging contributed to a lesser extent. A decomposition of changes in banks’ aggregate fully loaded CET1 ratio reveals that higher retained earnings accounted for more than half of the annual improvement (see Chart 3.18), driven by banks in the countries more affected by the crisis (see also the section on profitability).[54] Regarding other factors, a decline in total assets made a positive contribution (driven by banks in the countries less affected by the crisis), while patterns in average risk weights diverged between the two country groups.
Chart 3.18
The improvement in banks’ aggregate fully loaded CET1 ratio in 2017 was mainly driven by increases in capital
Decomposition of changes in euro area significant institutions’ aggregate fully loaded CET1 ratios in 2016 and 2017
(2016-17, percentage point contributions)
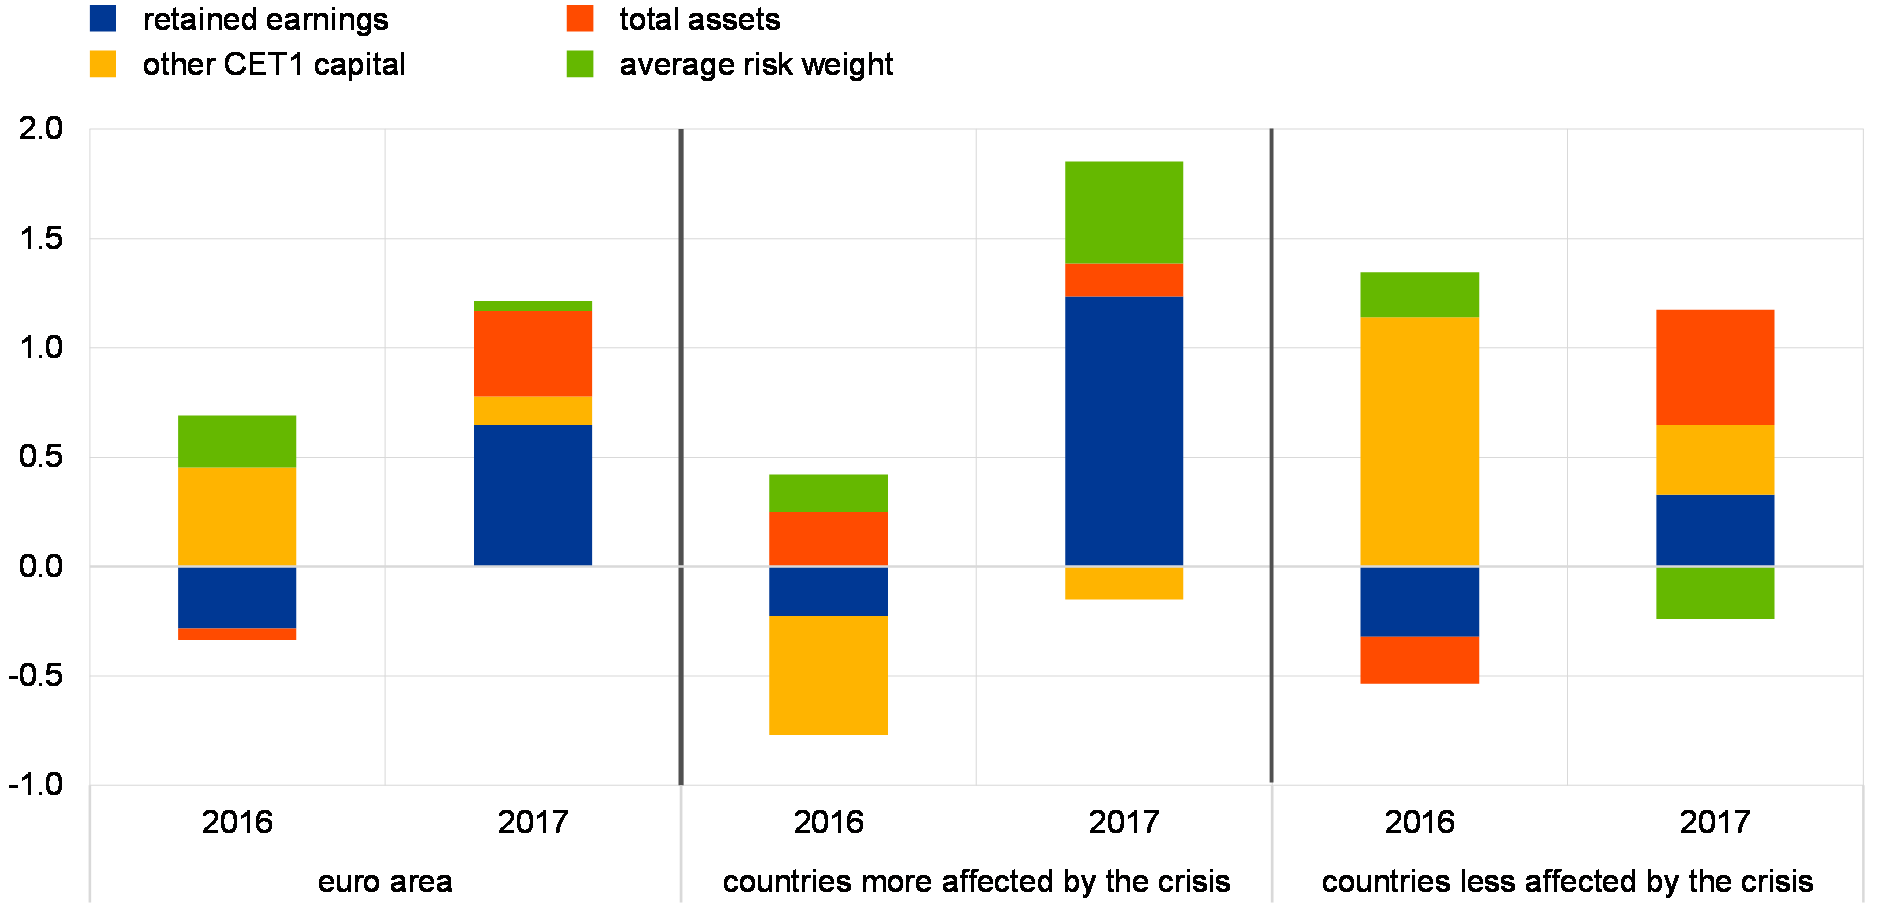
Sources: ECB and ECB calculations.
Notes: Changes in average risk weights and total assets are shown with the opposite sign as their decline (increase) indicates a positive (negative) contribution to the capital ratios. Based on a balanced sample of 100 SIs. Countries more affected by the crisis include Cyprus, Greece, Ireland, Italy, Portugal, Slovenia and Spain.
Looking ahead, banks’ capital requirements will be impacted by the revised Basel III framework. The impact assessment carried out by the EBA showed that, under the revised international standards, the minimum required capital for the EU sample subject to the exercise would increase by around 13% (on aggregate), corresponding to a 0.6 percentage point decline in the aggregate CET1 ratio. According to the EBA’s analysis, the aggregate output floor is the main driver of the capital impact under the new standards, while revisions to the credit risk and operational risk frameworks have a more moderate impact.[55]
Debt funding costs remain close to historical lows, but spreads on hybrid debt instruments may be susceptible to repricing
Conditions remained favourable across all segments of the market for bank debt. Euro area bank bond spreads remained close to historical lows despite a bout of volatility in financial markets in February. Looking over a longer time horizon, spreads on subordinated bonds have narrowed significantly since mid-2016 in a period when the prices of most risky global asset classes have increased (see Chart 3.19). That said, the cost of hybrid securities in the euro area may be susceptible to repricing, as illustrated by, for instance, the decoupling of the price behaviour of additional Tier 1 (AT1) instruments from historical patterns as well as by the markedly increased sensitivity of AT1 spreads to changes in bank default risk (see Box 8).
Chart 3.19
Bank bond spreads remain close to historical lows
Bond spreads of large euro area banks by debt instrument
(Nov. 2012 – May 2018, median Z-spreads in basis points)
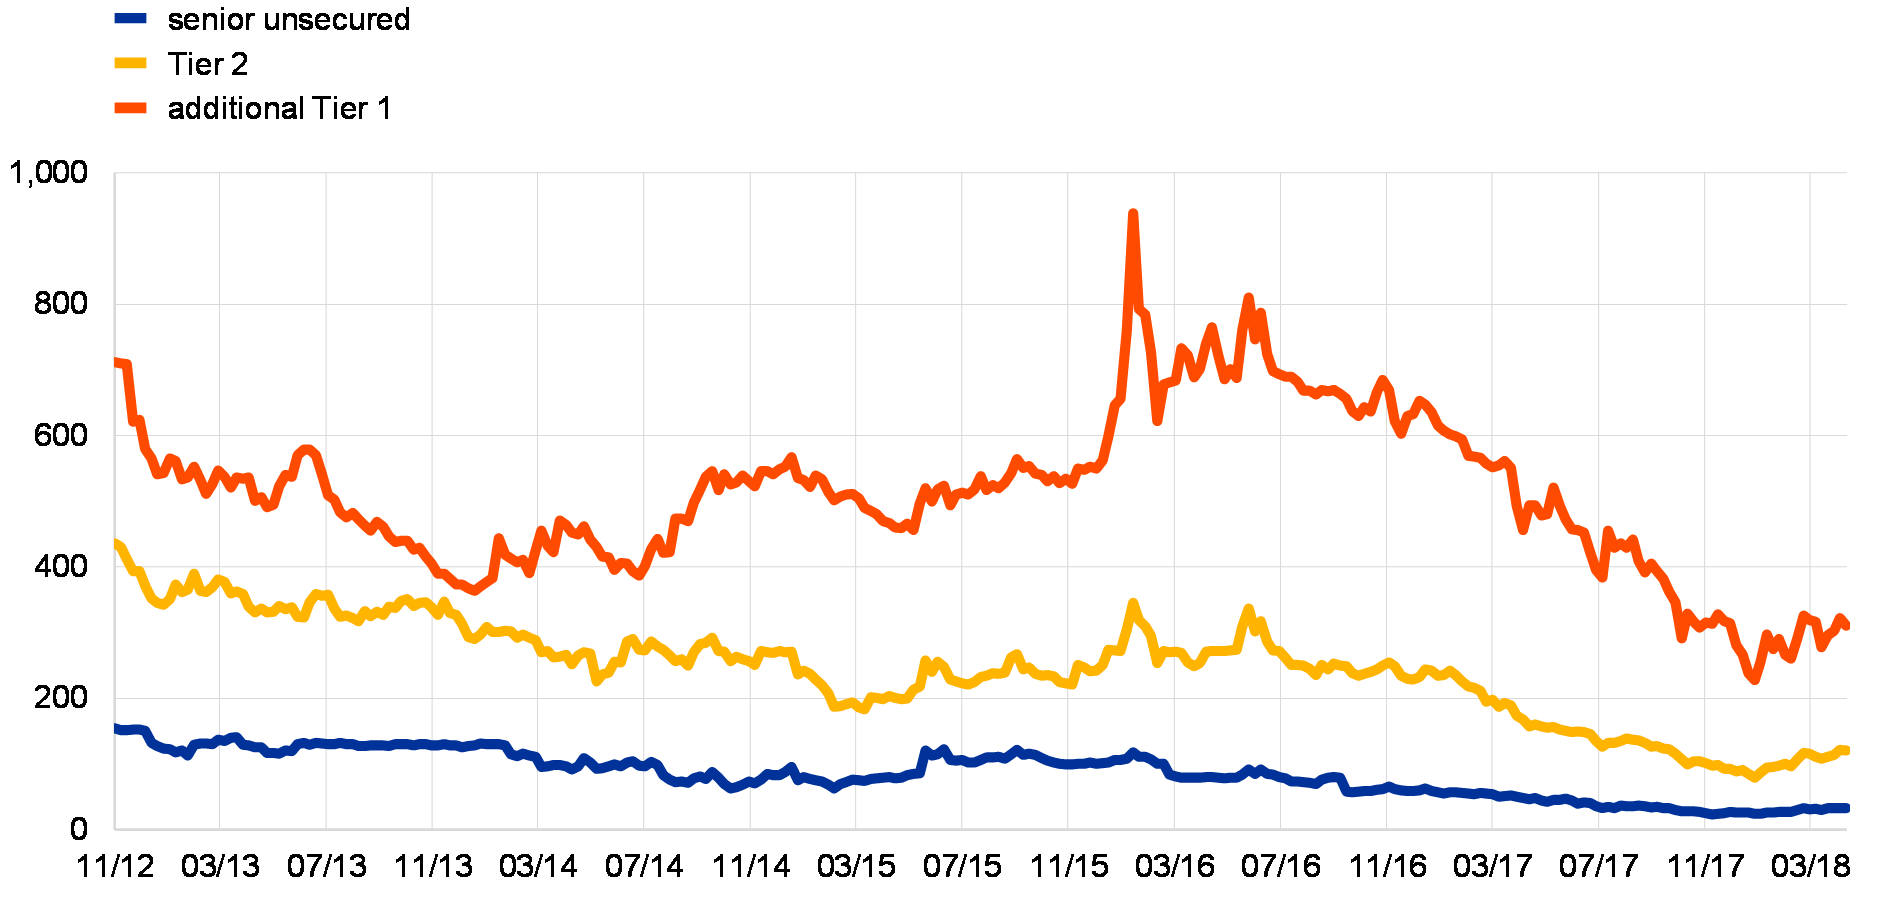
Sources: Bloomberg and ECB calculations.
Notes: Based on a sample of 21 large euro area banks. Z-spreads are defined as the difference (in basis points) between the yield to maturity of a bank’s bond and the yield of a maturity-matched euro swap.
At the same time, banks’ debt issuance activity is increasingly focused on building up loss-absorbing capacity. In particular, the share of non-preferred senior debt in total debt issuance further increased to around 25% in the first five months of 2018, more than double the share in the same period last year (see Chart 3.20). In the market for subordinated bonds, the share of Tier 2 (T2) debt increased at the expense of AT1 instruments, with issuance activity in the latter segment being affected by the bout of higher market volatility in February.
Chart 3.20
Banks’ bond issuance is increasingly being driven by efforts to build up loss-absorbing capacity
Bond issuance by euro area banks by debt type
(2007-18, € billions; left panel: full-year; right panel: year-to-date)
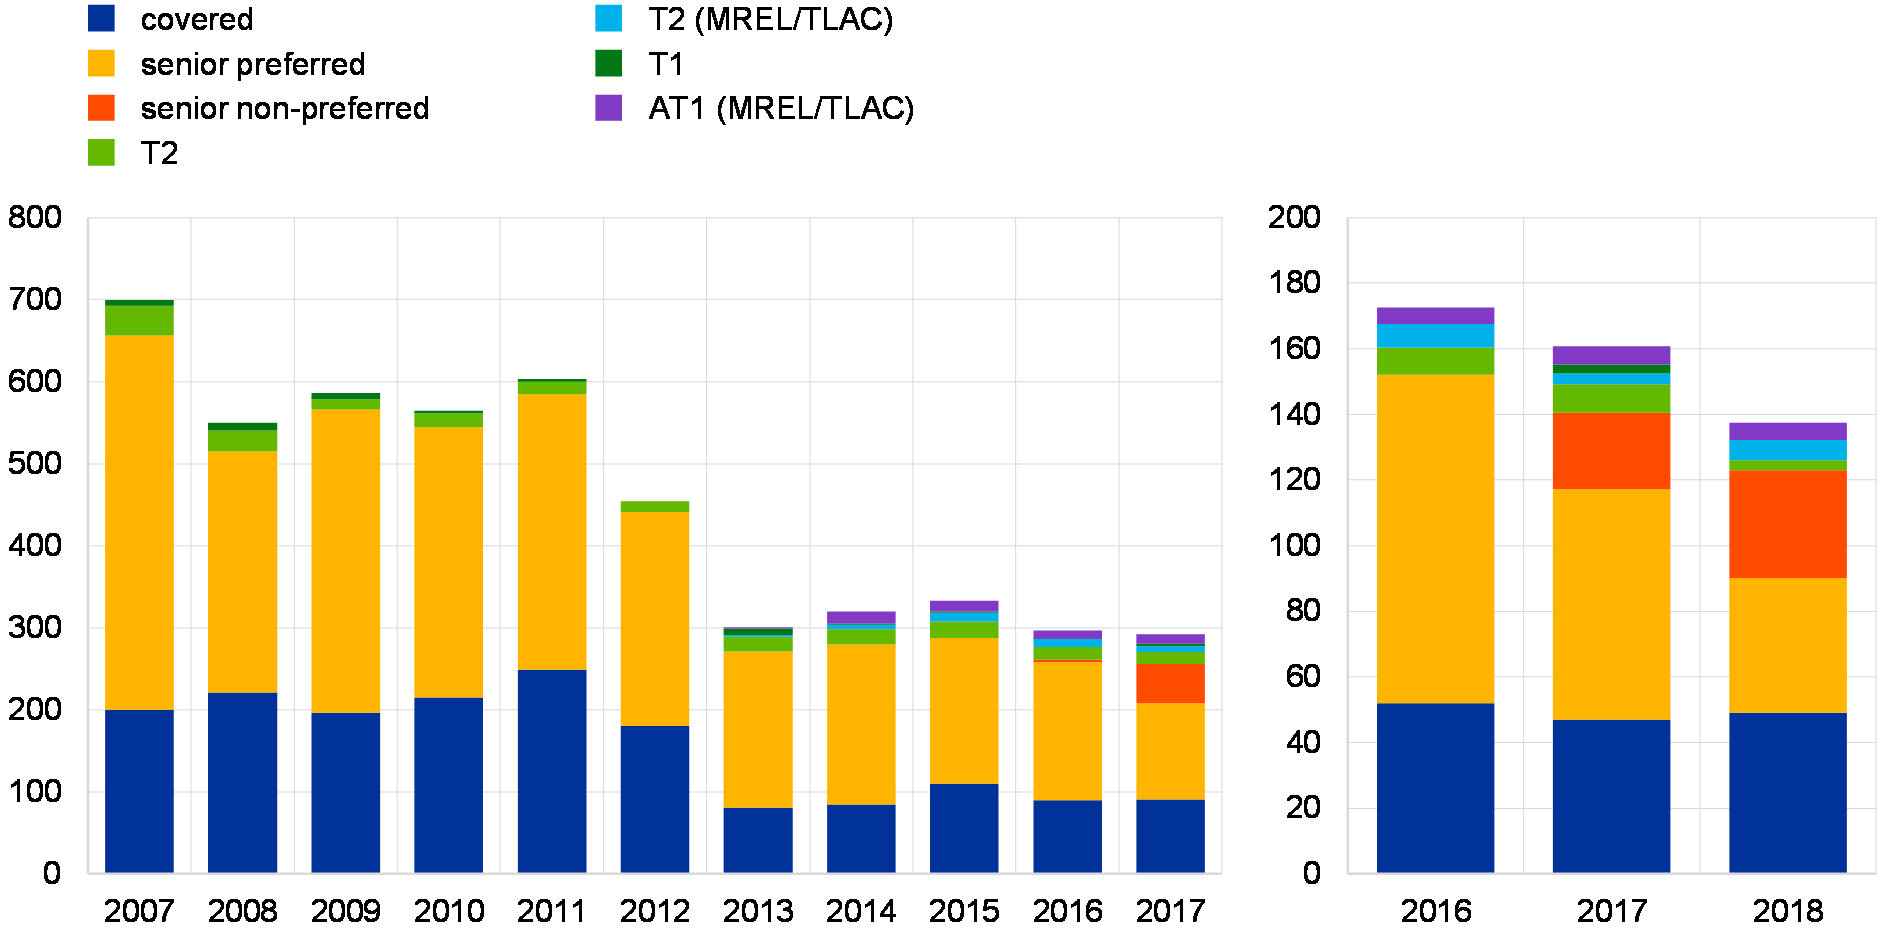
Source: Dealogic.
Note: MREL stands for minimum requirement for own funds and eligible liabilities and TLAC for total loss-absorbing capacity.
In the past few years there has also been a notable extension in the maturity of newly issued debt. The share of debt with an original maturity of less than five years has nearly halved since 2014, with banks aiming to lock in low debt funding costs for a longer period. The lengthening of bond maturities has been accompanied by a lowering of the cost of debt issuance since 2014 in both senior unsecured debt and covered bond markets (see Chart 3.21).
Chart 3.21
Banks have lengthened the maturities of newly issued bonds in a period of low funding costs
Yield at issuance and original maturity of senior unsecured debt and covered bonds
(2007-18, years, yields in percentages (lighter-coloured lines))

Sources: Dealogic and ECB calculations.
Note: Excludes non-preferred senior debt.
Nevertheless, a significant part of bank debt will mature in the next few years. Close to one-third of outstanding bank debt will mature in the period from May 2018 to end-2020 (see Chart 3.22). Therefore, banks’ funding costs remain vulnerable to an unexpected rise in long-term yields and risk premia, in particular in the market for subordinated bonds where pricing appears to have become increasingly sensitive to default risk (see Box 8). In addition, the market’s ability to absorb the still significant volumes of MREL-eligible non-preferred senior debt that need to be issued could also be tested in an environment of reduced risk appetite, especially regarding issuances by banks with weaker fundamentals.[56]
Chart 3.22
A significant part of outstanding bank debt will mature in the next few years
Outstanding bank debt by year of maturity and debt type
(€ billions and percentages)
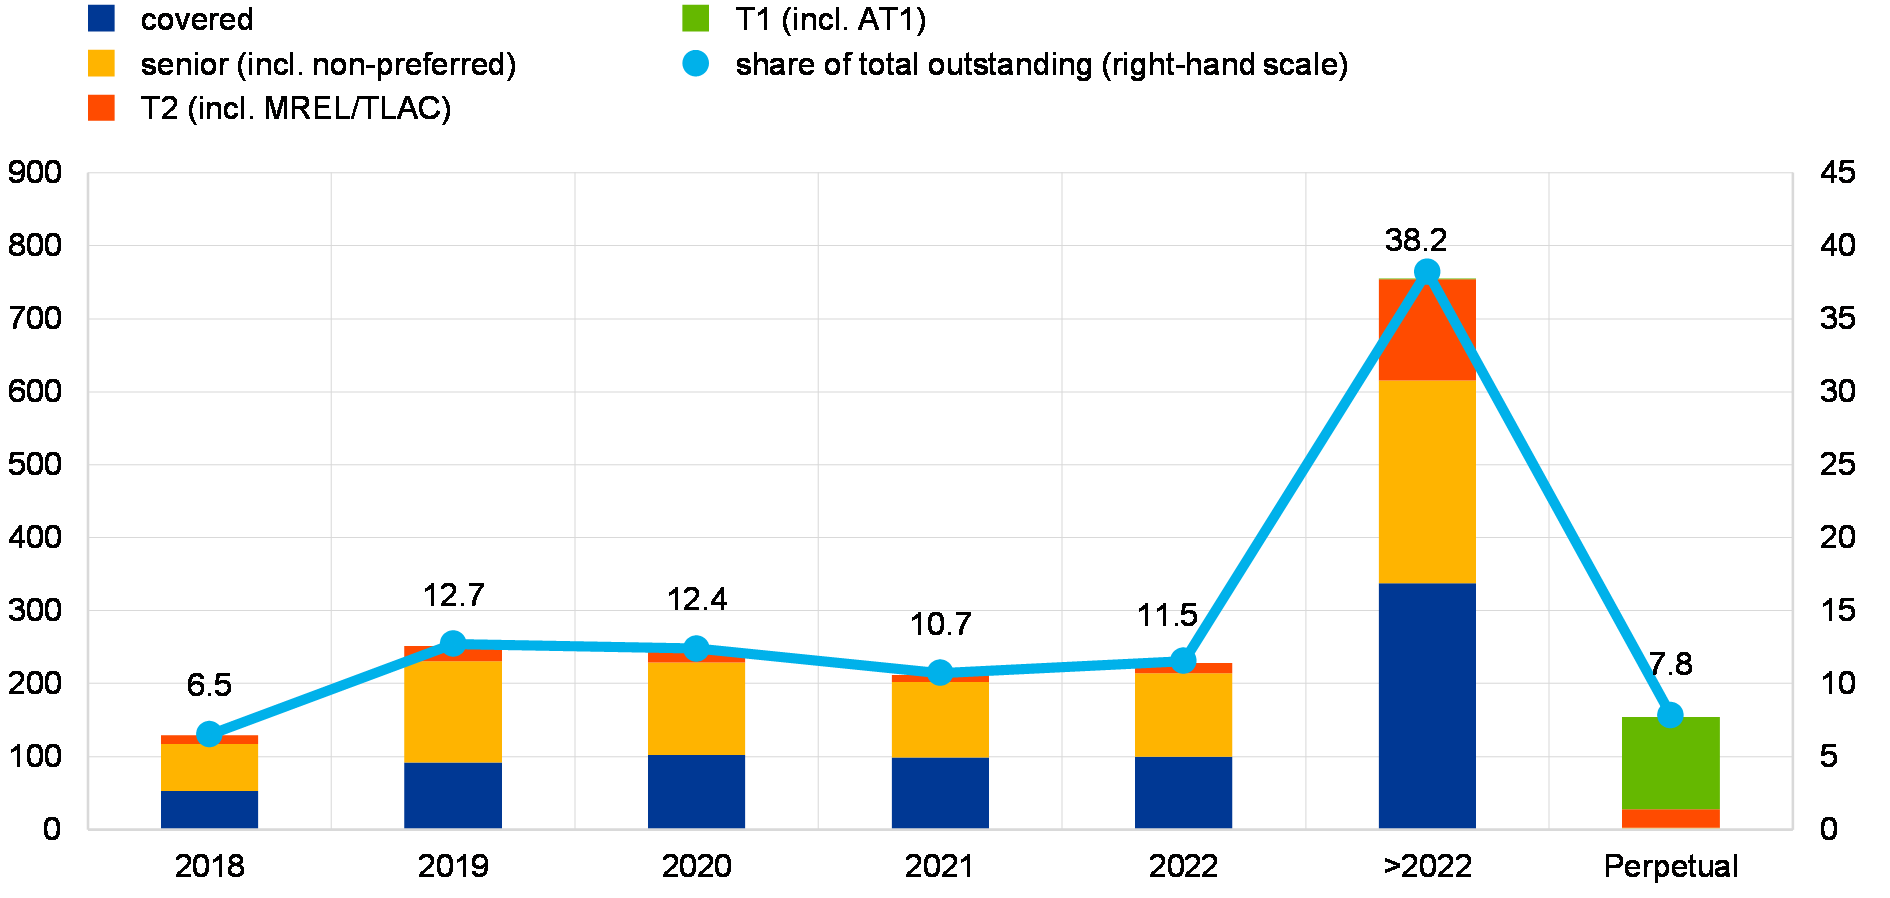
Sources: Dealogic and ECB calculations.
Regulatory liquidity ratios have increased over the last year and remain at solid levels. Euro area significant institutions’ aggregate liquidity coverage ratio (LCR) stood at 144% at end-2017, up from 136% a year earlier. The improvement was mainly driven by the significant increase in LCRs in euro, from 135% to around 160%. Regarding liquidity positions in the most significant foreign currencies, however, LCRs have declined over the last year or remained below 100%. In particular, banks’ aggregate USD-based LCR dropped to 84% from 91% at end-2016, with some heterogeneity at bank level. This implies that while overall LCRs remain at comfortable levels, banks with LCRs of below 100% in foreign currencies (in particular USD) rely – to a varying extent – on well-functioning FX swap markets to cover short-term foreign currency mismatches, thereby leaving them vulnerable to periods of stress in these markets.
Box 8
Assessing the financial stability risks of a possible repricing in the market for subordinated bank bonds
The cost of subordinated bank debt in the euro area is low and may be susceptible to repricing. Euro area bank bond yields and spreads have narrowed significantly since mid-2016, reaching levels last observed prior to the global financial crisis. The reductions have been particularly noticeable in the markets for subordinated bonds.[57] Against this background, this box first evaluates whether there are indications that the prices of these bonds may be vulnerable to a correction. It then assesses the potential financial implications stemming from a spread reversal in euro area subordinated bank bonds. The box focuses in particular on the holders of these instruments and examines the sectors that may be particularly vulnerable to a turnaround in this market.
Chart A
Yields on subordinated bank debt decoupling from expected returns on bank equities
One-year-ahead dividend and earnings yield expectations and AT1 yields for euro area banks
(Jan. 2010 – May 2018; percentages per annum, median AT1 yield, index-average of earnings yield)
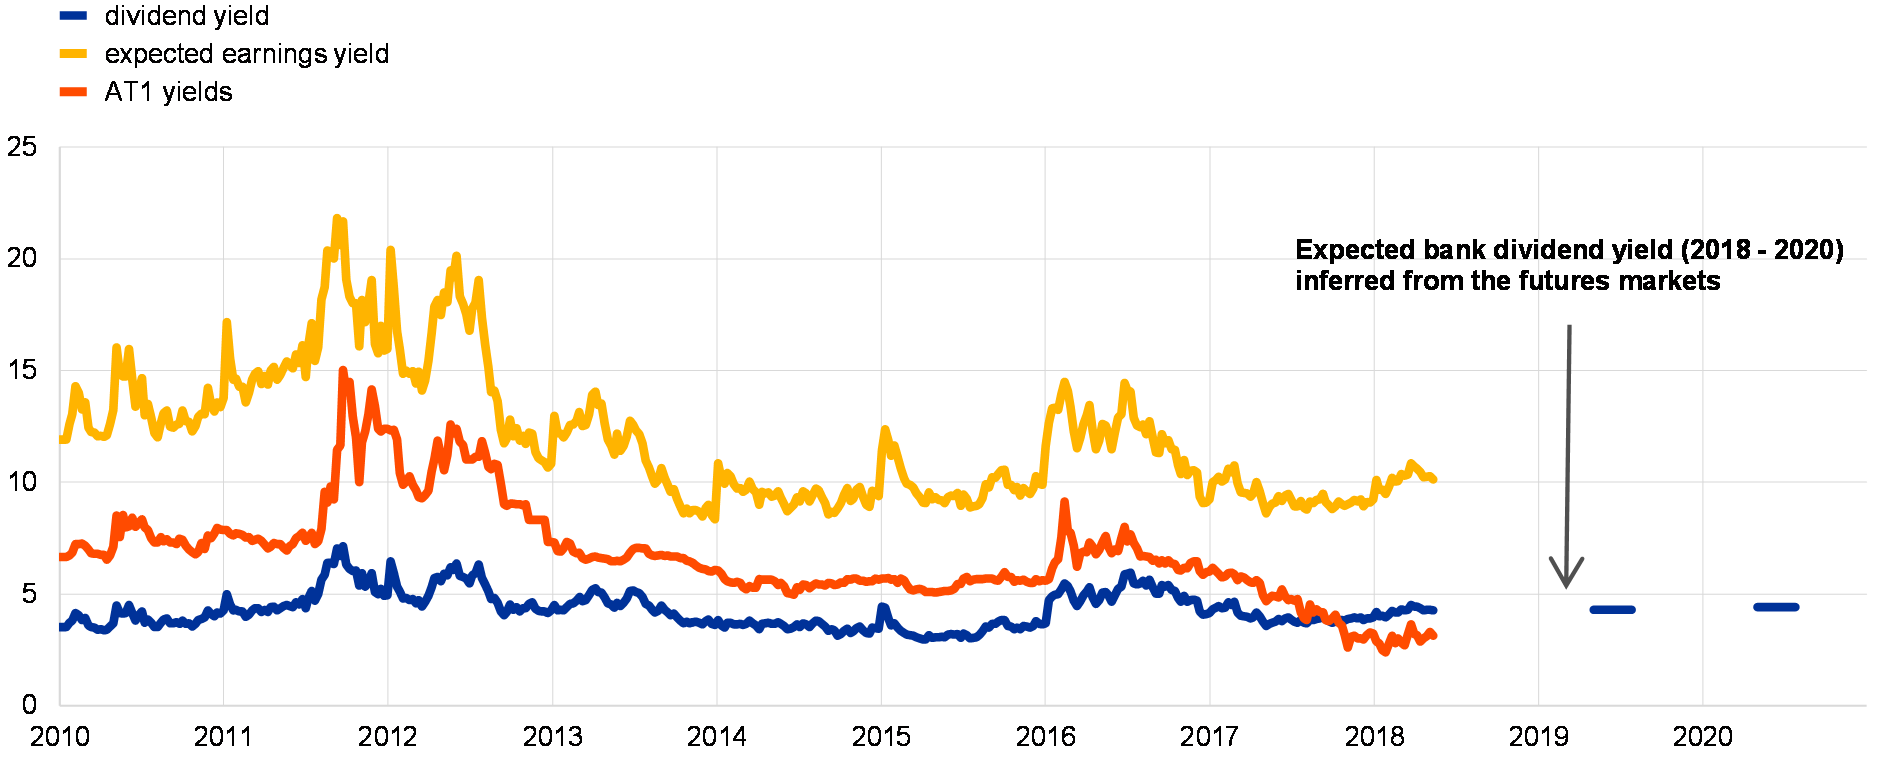
Sources: Bloomberg and ECB calculations.
Notes: The dividend and earnings yield series are based on the EURO STOXX bank index. The AT1 sample of banks consists of 21 large euro area banks.
The price behaviour of euro area subordinated bank debt has decoupled from historical patterns. Additional Tier 1 (AT1) bonds bear some similarities to bank equity owing to their hybrid features, and it would not be unreasonable to expect these similarities to be mirrored in the expected returns on AT1 debt and bank equity. Indeed, until mid-2016, yields on these instruments fluctuated broadly in tandem. Since then, however, yields on AT1 bonds have dropped sharply, thereby decoupling from the stable expected returns observed for bank equities (see Chart A).[58] This suggests that there is scope for a widening of spreads in AT1 bonds should the historical relationship be reinstated.[59] Furthermore, the sensitivity of AT1 spreads to changes in bank credit default swap (CDS) spreads (the latter being an indicator of bank default risk) has increased markedly in the past few years (see Chart B). This suggests that the introduction of the Bank Recovery and Resolution Directive (BRRD) may have clarified the level of risk attached to bank bonds and the relative riskiness of different instruments. At the same time, it points to sizeable upward risks to spreads on subordinated bank debt instruments should markets reassess the outlook for bank solvency.
Chart B
The pricing of subordinated bank debt is increasingly sensitive to default risk
AT1 bond spreads (y-axis) against CDS spreads (x-axis) (left panel) and impact of a 100 bp CDS spread shock on AT1 spreads (right panel)
(2013 and 2017; weekly data; basis points)
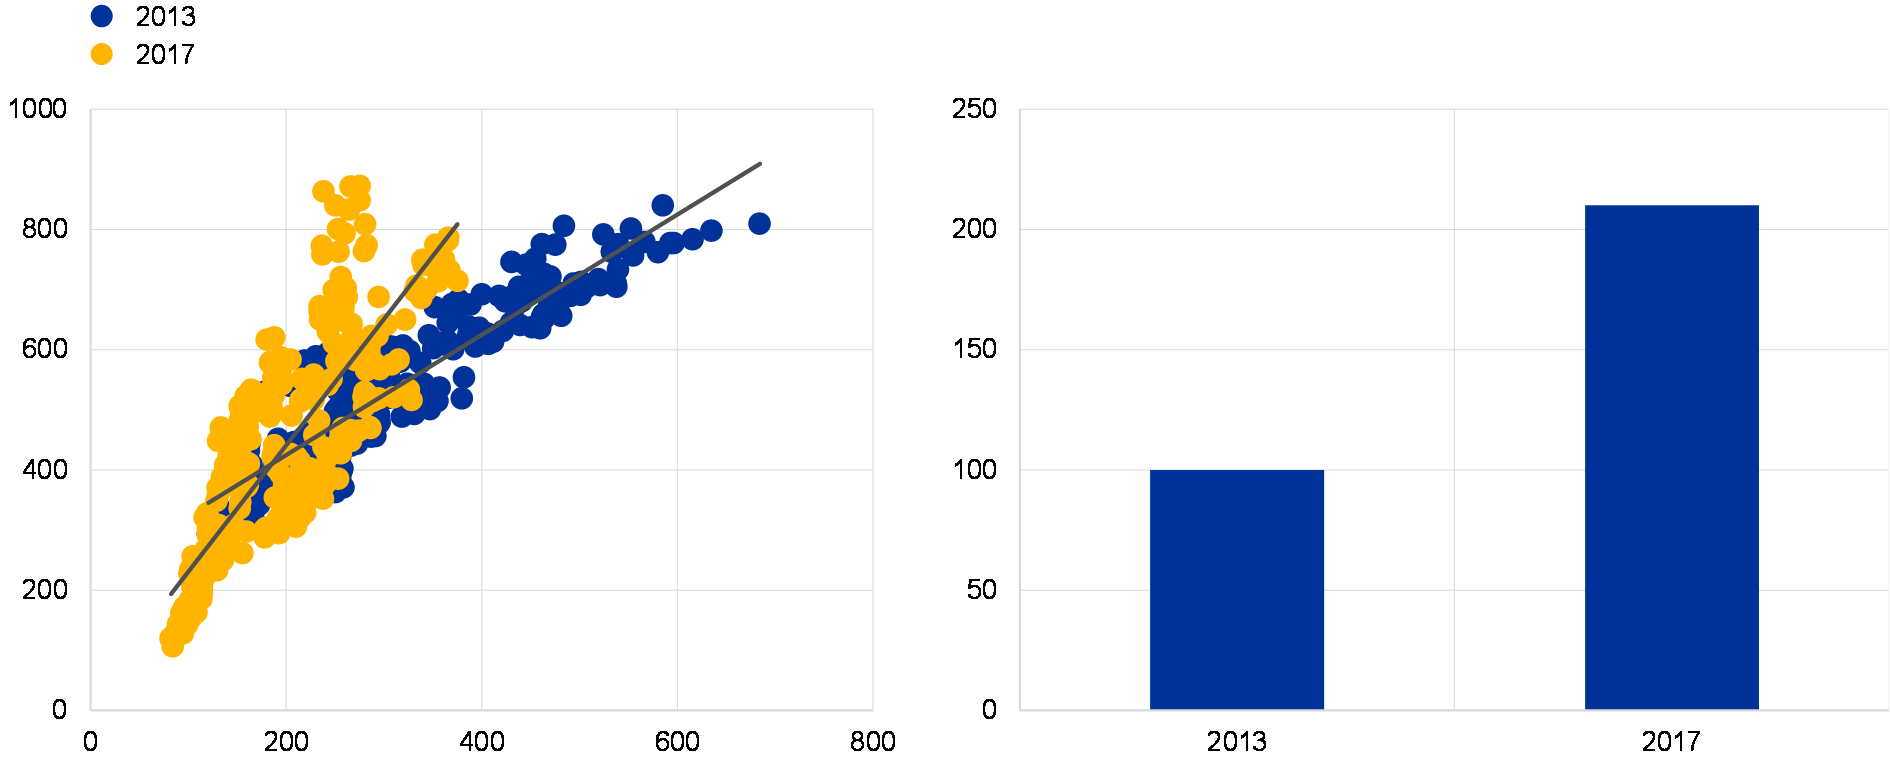
Sources: Bloomberg and ECB calculations.
Notes: The AT1 sample of banks consists of 21 large euro area banks. CDS spreads are for five-year subordinated instruments. The impact of a CDS spread shock on AT1 spreads as shown in the right panel reflects the relationship of both variables in each year as shown in the left panel.
Euro area investors have increased their holdings of subordinated bonds issued by euro area banks, but with marked differences across sectors. The market for subordinated debt has grown sharply since 2013[60] (see Chart C – left panel). Both supply and demand factors can explain this increase. From a bank perspective, these instruments have gained in importance owing to regulatory changes aimed at enhancing the resilience of the banking system, such as the minimum requirement for own funds and eligible liabilities (MREL). From an investor viewpoint, these instruments can provide an attractive vehicle to earn somewhat higher returns compared to other fixed-income assets in a low interest rate environment. Two significant dynamics across sectoral holdings can be observed over the same period (see Chart C – right panel). First, investment funds have increased their holdings of AT1 debt considerably and have become the main investors in these instruments, representing 62% of total euro area holdings in the second quarter of 2017, up from 15% in the fourth quarter of 2013. Second, the reliance of banks on household funding for subordinated debt has been reduced quite significantly since 2013. Nonetheless, the household sector still accounted for 22% of euro area holdings of Tier 2 (T2) instruments in the second quarter of 2017, down from 38% in the fourth quarter of 2013.
Chart C
Euro area investors have increased their holdings of subordinated bank debt and the investor base has shifted substantially towards investment funds
Euro area holdings of debt securities of significant banks by type of debt (left panel) and euro area holdings of debt securities of significant banks by holding sector and type of debt (right panel)
(Q4 2013 and Q2 2017; EUR billions and percentages)
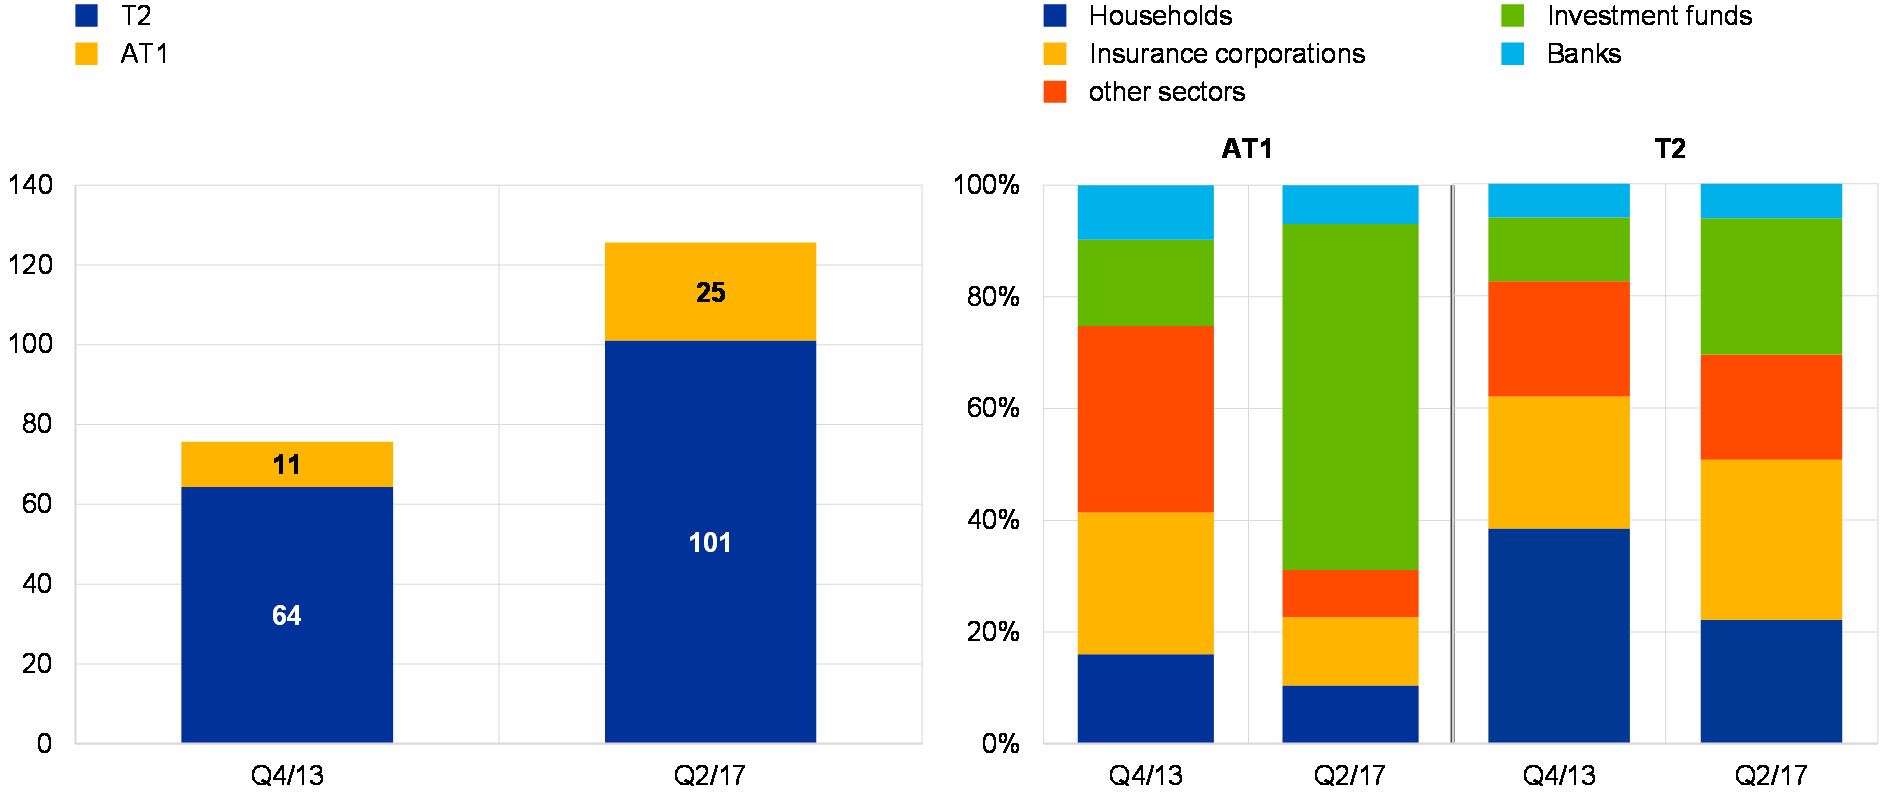
Sources: Bloomberg, ECB and ECB calculations.
Notes: The sample consists of around 100 euro area significant banks. The large share of AT1 bonds held by “other sectors” in the fourth quarter of 2013 (right panel) was due to a government intervention in an ailing bank.
The financial stability implications of a potential increase in spreads on euro area bank bonds partly depend on who the holders of these bonds are. Although investment funds are professionally managed and should therefore have a sufficient understanding of the risks of investing in such assets, they are often “open-ended” funds which promise investors daily liquidity. Consequently, they could amplify price movements as a result of outflows if the bonds trigger losses. Furthermore, if the widening of bank bond spreads is associated with profound concerns about a bank’s solvency, large household exposures to T2 instruments might reduce the resolvability and loss-absorption capacity of the issuing bank owing to, for example, concerns about mis-selling and associated legal liabilities.[61] This may render a market solution and resolution more difficult. Finally, banks themselves have very low exposures to T2 instruments, and this limits the scope for direct contagion effects in such a scenario.
3.2 The non-bank financial sector continues to become larger, more interconnected and more exposed to risks
Assets of the key components of the non-bank financial sector continued to grow in the second half of 2017. The investment fund sector expanded by close to 4% over this period and thus continued on its longer-term growth path. This sector has accounted for much of the expansion of the non-bank financial sector since the crisis (see Chart 3.23). The assets of insurers and pension funds also grew in the last two quarters of 2017, but at a slower pace. The rapid growth of the broader non-bank financial sector seen after the global financial crisis nevertheless stalled in the second half of 2017, mainly reflecting a decline in the assets of the remaining other financial institutions (residual OFIs). At the end of 2017, the share of total financial sector assets held by the broader non-bank financial sector stood at about 56% though some of these assets are closely linked to the banking sector – for instance, through asset management operations controlled by banks or through banks’ securitisation activities.
Chart 3.23
Key components of the euro area non-bank financial sector continued to grow in the second half of 2017
Assets of the non-bank financial sector
(Q1 1999 – Q4 2017, € trillions, percentage of total assets of the financial sector)

Sources: ECB (euro area accounts and balance sheet data of individual sectors) and ECB calculations.
Notes: A breakdown of data for investment funds, money market funds, financial vehicle corporations, and insurance corporations and pension funds is available only from the indicated dates onwards. Remaining OFIs (sometimes also referred to as the “OFI residual”) refer to non-monetary financial corporations excluding the sectors depicted in the chart (where data for these sectors are available).
The medium-term growth of the non-bank financial sector reflects its role in financing the euro area economy. In the aftermath of the euro area sovereign debt crisis, non-bank financial institutions continued to provide funding to non-financial corporations (NFCs) when the net flow of bank loans turned negative (see Chart 3.24). More recently, the share of non-bank financials in lending to the euro area economy has declined, as lending by banks has been recovering. At the same time, non-banks continue to provide a steady net flow of financing to NFCs, especially through the purchase of debt securities, which helps NFCs to diversify their funding sources.
Chart 3.24
The relative importance of non-banks in the financing of the euro area economy has declined somewhat
Debt financing of NFCs from the euro area financial sector
(Q4 2013 – Q4 2017, € billions, annual flows)
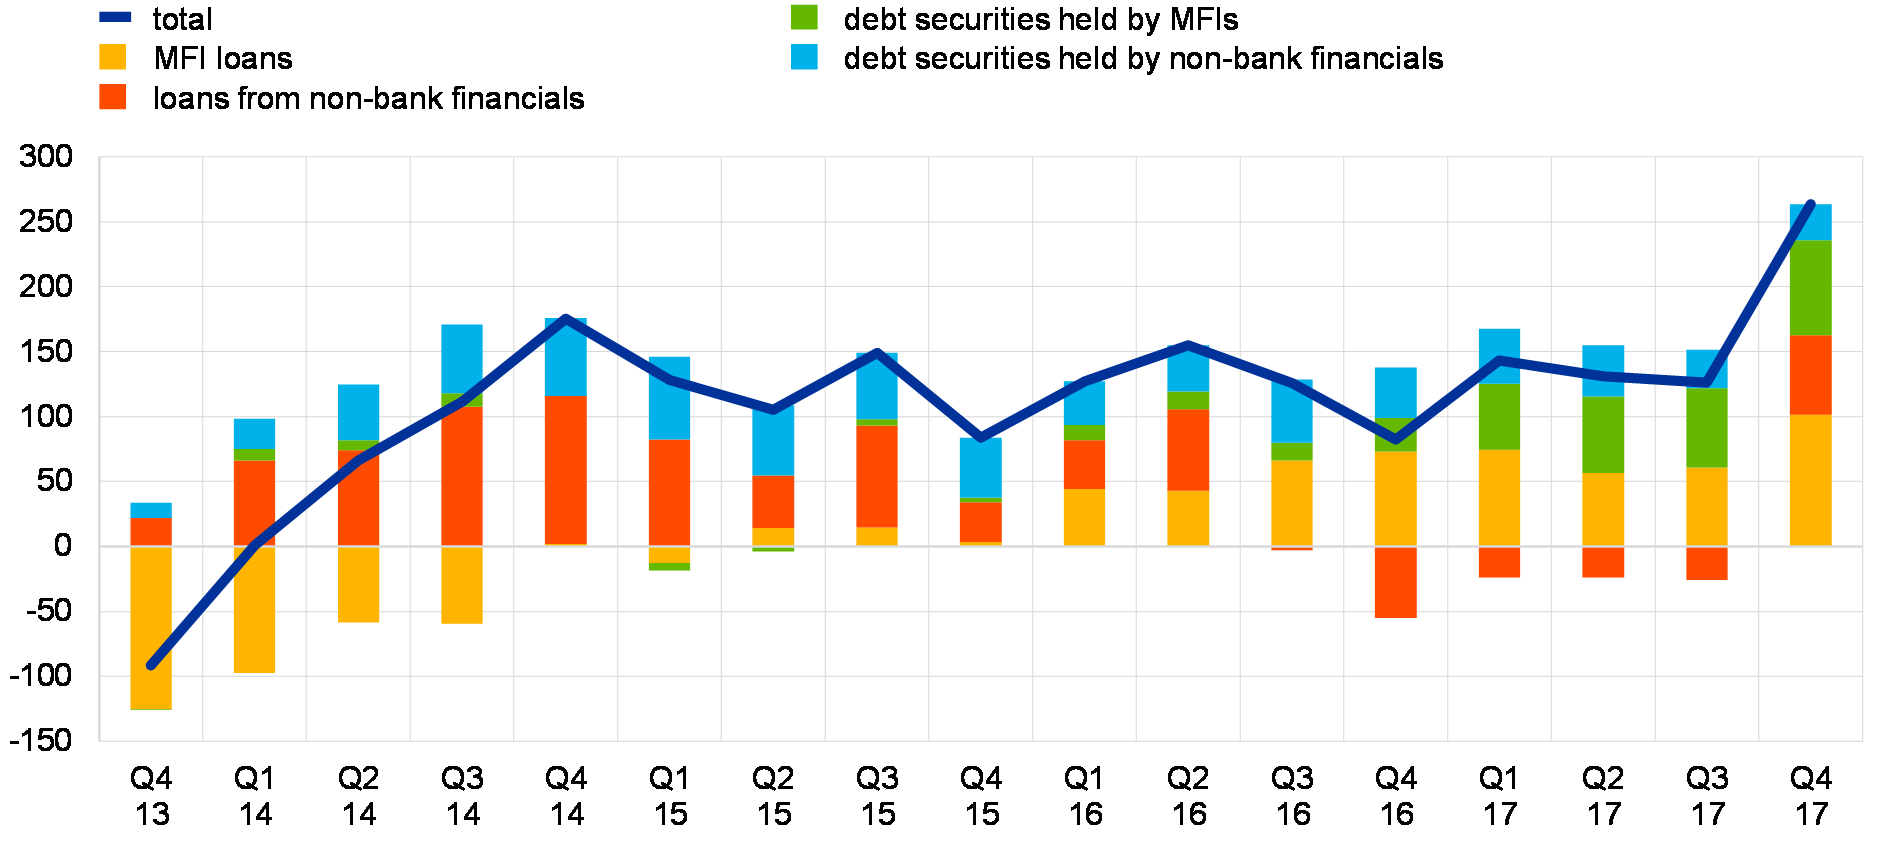
Sources: ECB euro area accounts and ECB calculations.
The increasing size of the non-bank financial sector has also been accompanied by greater interconnectedness within this sector. Insurance corporations and pension funds (ICPFs) represent by far the largest and most rapidly growing investor base for investment funds (see Chart 3.25). At the end of 2017, they held around €3.3 trillion of investment fund shares, accounting for 34% of ICPFs’ financial assets, up from €2.0 trillion at the end of 2012.[62] Furthermore, investment funds themselves invest 18% of their portfolio in other investment funds. These intra-sectoral holdings have doubled over the past five years, amounting to almost €2.0 trillion at the end of 2017. This contrasts with the relatively low exposure of banks to investment funds, which accounts for only around 1% of their financial assets.
Chart 3.25
Euro area non-bank entities are highly interconnected through direct exposures…
Holdings of investment fund shares by euro area sectors
(Q4 2012 – Q4 2017, € trillions (left-hand scale), percentage of total financial assets of the corresponding sector (right-hand scale))
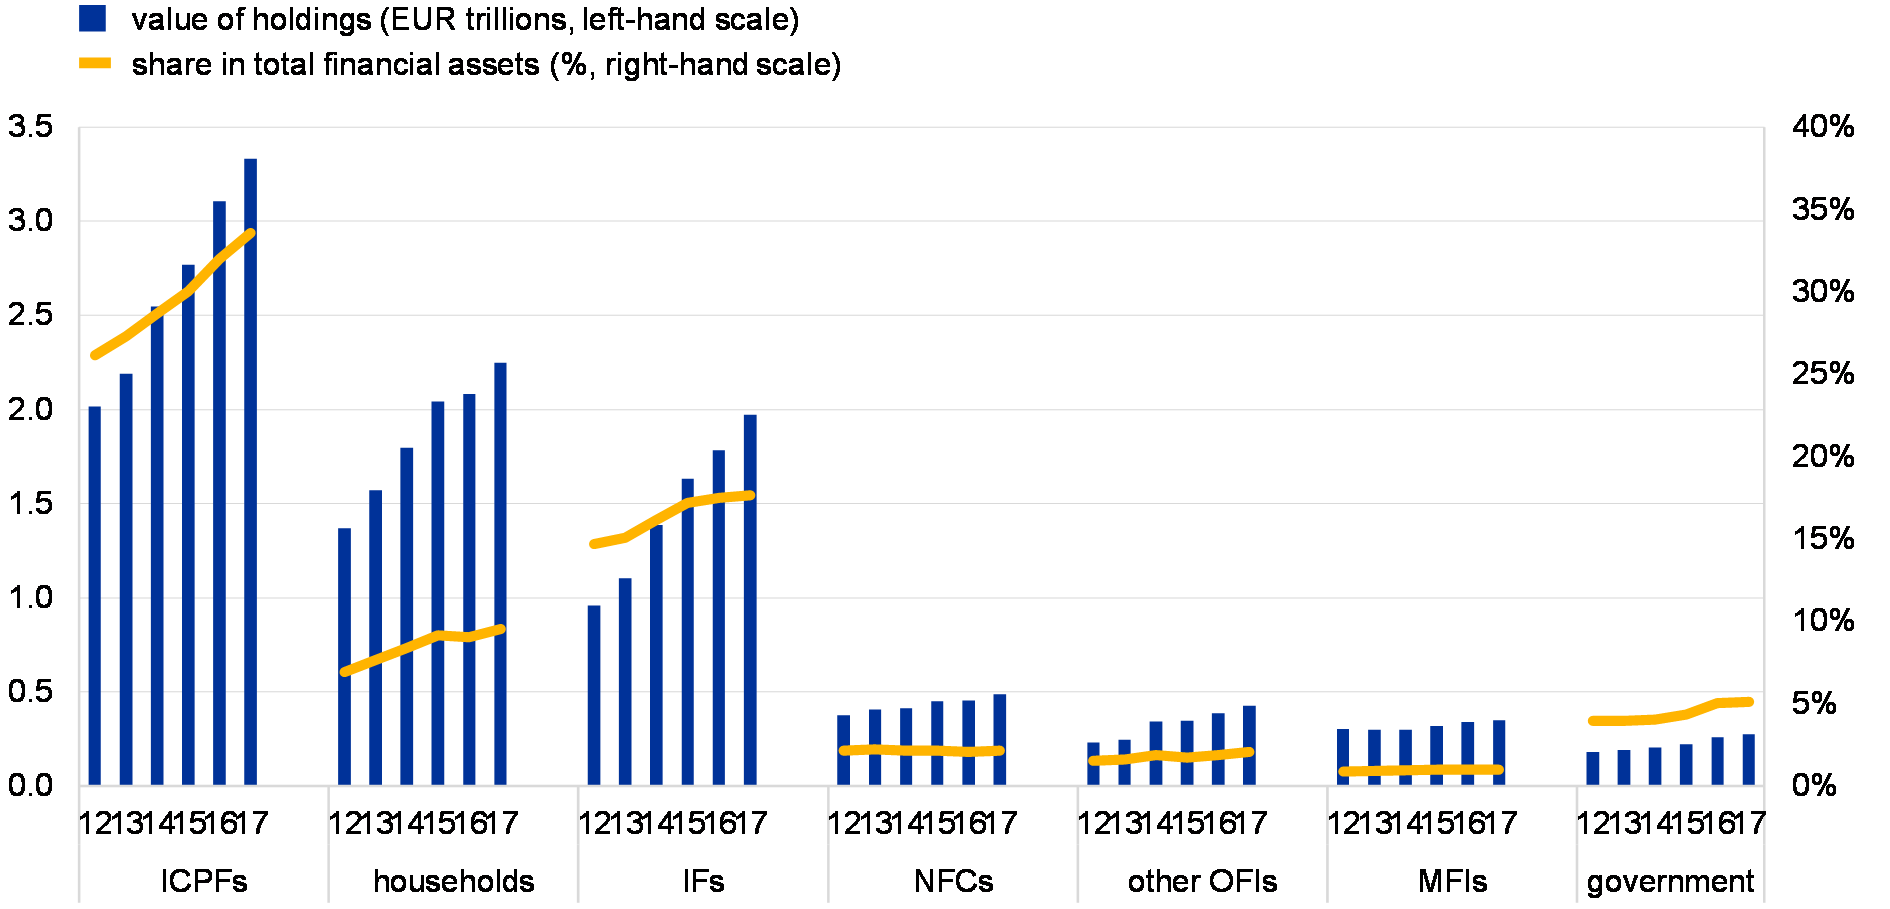
Sources: ECB euro area accounts and ECB calculations.
Non-banks’ interconnectedness through common asset holdings has been on the rise, which has increased the risk of contagion via this channel. Both ICPFs and investment funds (IFs) tend to allocate their portfolio holdings more broadly across countries and sectors compared with banks that invest a larger share of assets domestically. As a result, the securities portfolios of ICPFs and IFs show a high degree of similarity across euro area countries – both within and between the two sectors (see Chart 3.26). Compared with the end of 2013, the similarity indicator has increased significantly, mostly across ICPFs and IFs, indicating higher cross-border interconnectedness through common asset holdings. The degree of portfolio similarity exhibited in the banking sector is smaller, but indirect contagion via common exposures may still play a role if asset prices are correlated across countries or sectors. In general, cross-border investments of euro area non-banks have the benefit of international portfolio diversification, but they may also become a channel for inward spillovers originating from shocks in global financial markets.[63]
Chart 3.26
…and the same applies to indirect exposures via common asset holdings
Similarity of portfolios
(white colour = no similarity, dark blue colour = identical portfolios; Q3 2017)
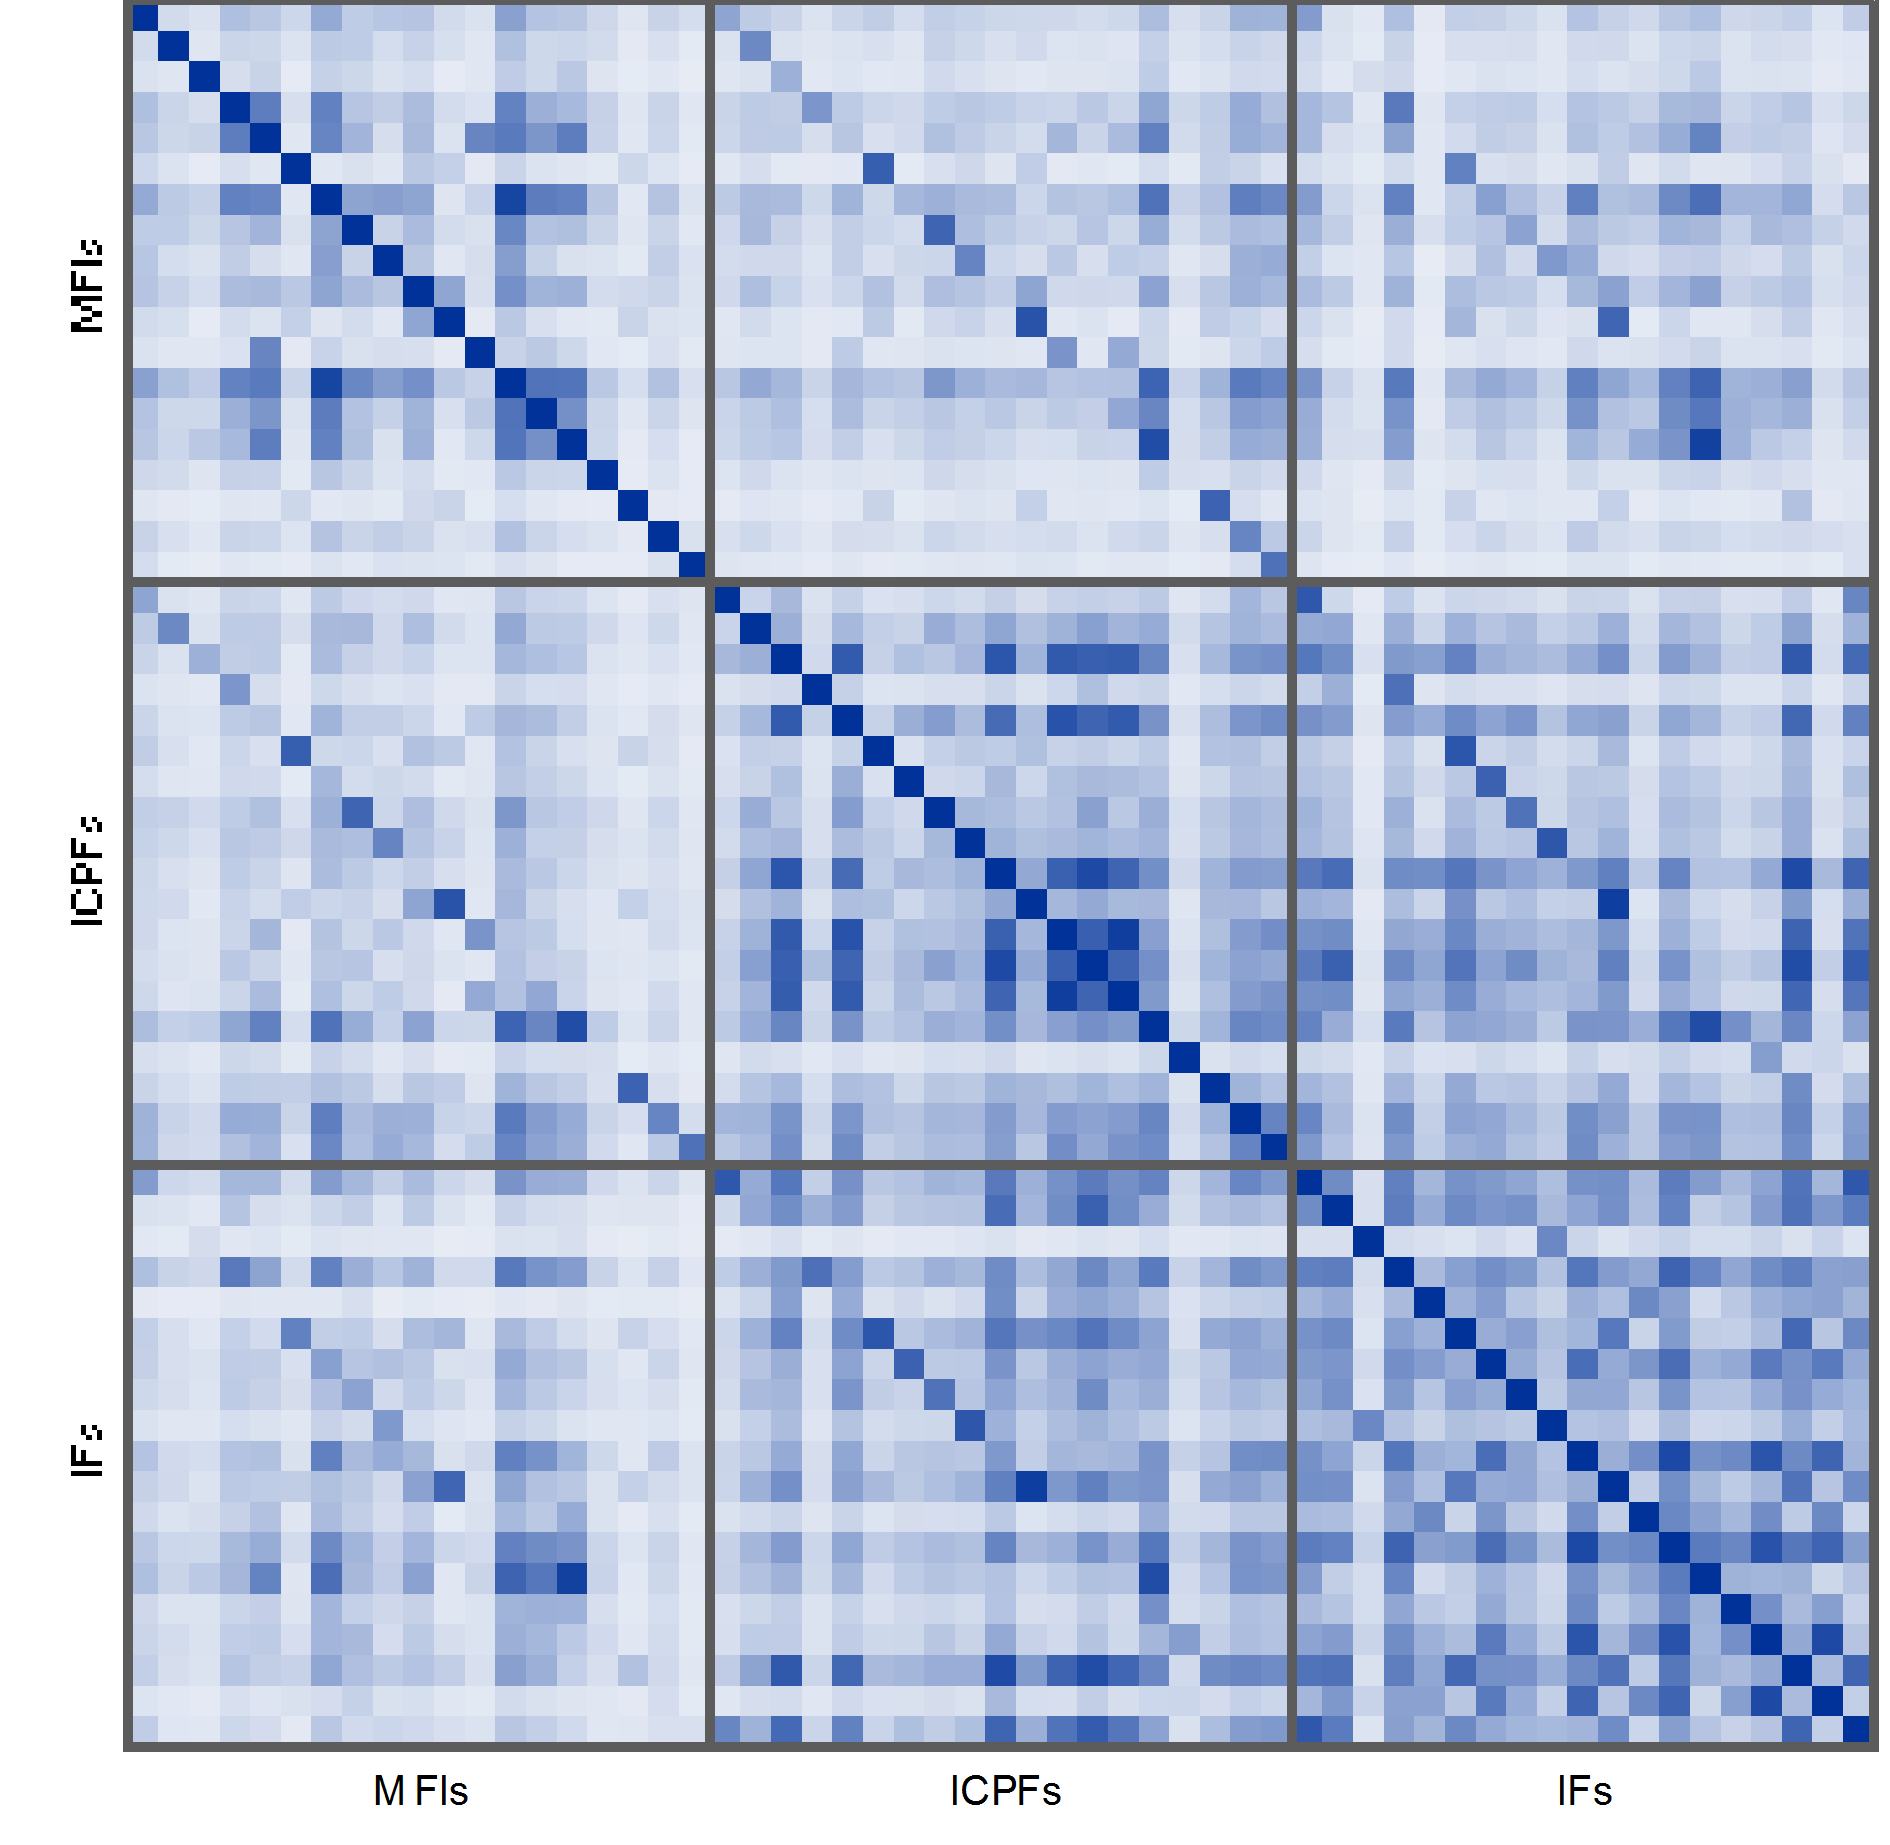
Sources: ECB Securities Holdings Statistics by Sector and ECB calculations.
Notes: Based on the cosine similarity indicator, which measures the level of commonality between pairs of portfolios (see Getmansky, M., Girardi, G., Hanley, K.W., Nikolova, S. and Pelizzon, L., 2016, “Portfolio similarity and asset liquidation in the insurance industry”, working paper). The indicator equals zero (white colour) if the portfolio allocations of two country-sectors are uncorrelated and equals one (dark blue colour) if they are the same. Colours within this range quantify the degree of similarity. Assets belong to the same group if they are issued in the same country/region, by the same sector and are of the same instrument type. The chart is symmetric. Euro area countries (not shown) are ordered alphabetically.
Shifts in the composition of the corporate bond portfolios of euro area non-banks suggest that risk-taking has gone up. The exposure of euro area non-banks to credit risk – as measured by credit ratings – has increased over the past few years (see Chart 3.27). The overall shifts in portfolio composition have largely been driven by an actual reduction in the holdings of higher-rated securities and an increase in lower-rated securities holdings, rather than by a decline in the rating quality of the securities held.[64] Between the end of 2013 and mid-2017, the share of riskier financial and non-financial corporate bonds – namely those with a credit rating of BBB or below – in the total bond portfolio of ICPFs and investment funds and within their corporate bond portfolios has increased, while decreasing sharply for banks (see Chart 3.28). These developments expose ICPFs and investment funds to greater credit and market risk against the backdrop of potentially stretched valuations in high-yield corporate bond markets (see Chapter 2).
Investment funds have also significantly increased the duration of their portfolios, as proxied by residual maturity (see Chart 3.27). These portfolio shifts have further exacerbated the maturity mismatch among bond funds offering daily redemptions and increased their sensitivity to changes in interest rates. By contrast, the slight increase in the duration of ICPFs’ portfolios is less of a concern, given that many euro area ICPFs have a negative duration gap and so an increase in the duration of assets may actually reduce duration risk on ICPFs’ balance sheets.
Chart 3.27
Investment funds increased their holdings of lower-rated debt securities and the residual maturities of their portfolios
Euro area financial institutions’ holdings of debt securities, broken down by rating and sector
(Q4 2013 – Q3 2017; percentage points of total assets and average residual maturity in years)
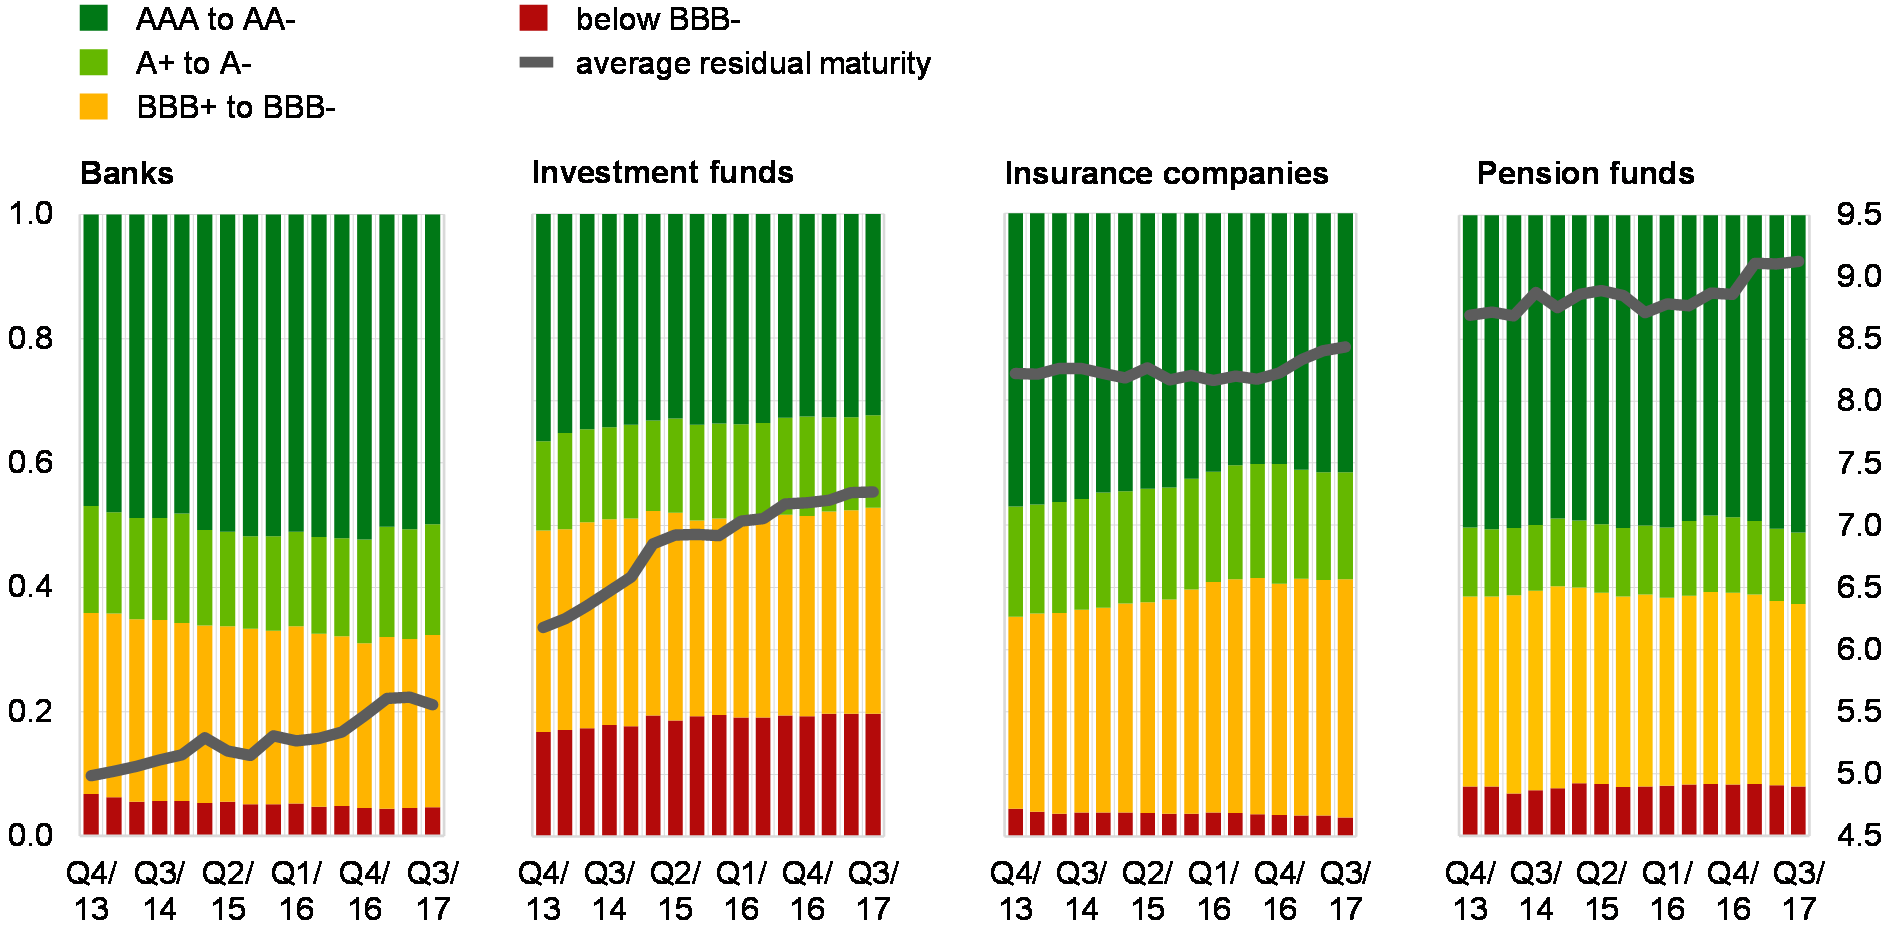
Sources: ECB Securities Holdings Statistics by Sector and ECB calculations.
Notes: The first three rating categories correspond to credit quality steps defined in accordance with the Eurosystem credit assessment framework (ECAF). A fourth category is added which includes all rated securities with a rating below credit quality step three (i.e. below BBB-). The analysis is based on the nominal amounts of euro- and foreign currency-denominated securities, including “alive” and “non-alive” securities. The investment fund sector excludes money market funds. Long- and short-term, euro- and foreign currency-denominated debt securities are included in the computation of residual maturity only if they have an ISIN reported, are considered “alive” and have a residual maturity of up to 30 years. Banks hold a particularly large share of securities with a reported maturity exceeding 30 years for which precise information is less reliable (e.g. for securities without a definite date of maturity) and which are therefore excluded. In order to estimate the average, residual maturities are weighted by the nominal amount held of each security by each sector over the total debt holdings of each sector.
Increasing exposures to US corporate bonds and equities account for a significant part of the shift in non-bank portfolios (see Chart 3.28). In the euro area, the OFI sector (including investment funds) is the main holder of US corporate bonds and listed shares in terms of both volume and the share of these securities in total holdings. US corporate bonds and listed shares currently represent about 40% and 25% respectively of OFIs’ corporate bond and equity portfolios. ICPFs and MFIs have also increased their exposures to US non-financial corporates in recent years. US equity valuations are historically high and have further increased over the review period (see Chapter 2). These exposures can represent an elevated risk in non-banks’ portfolios in the event of a sudden correction.
Chart 3.28
Euro area non-banks have increased exposures to riskier corporate bonds and to US corporate bonds and equity
Holdings of riskier corporate bonds (left panel) and US corporate securities (right panel)
(left panel: Q4 2013 – Q3 2017, € billions, y-axis: percentage of corporate bond portfolio; x-axis: percentage of total bond portfolio; right panel: Q4 2013 – Q4 2017, € billions, percentage of corporate bond and equity portfolios of the corresponding sector)
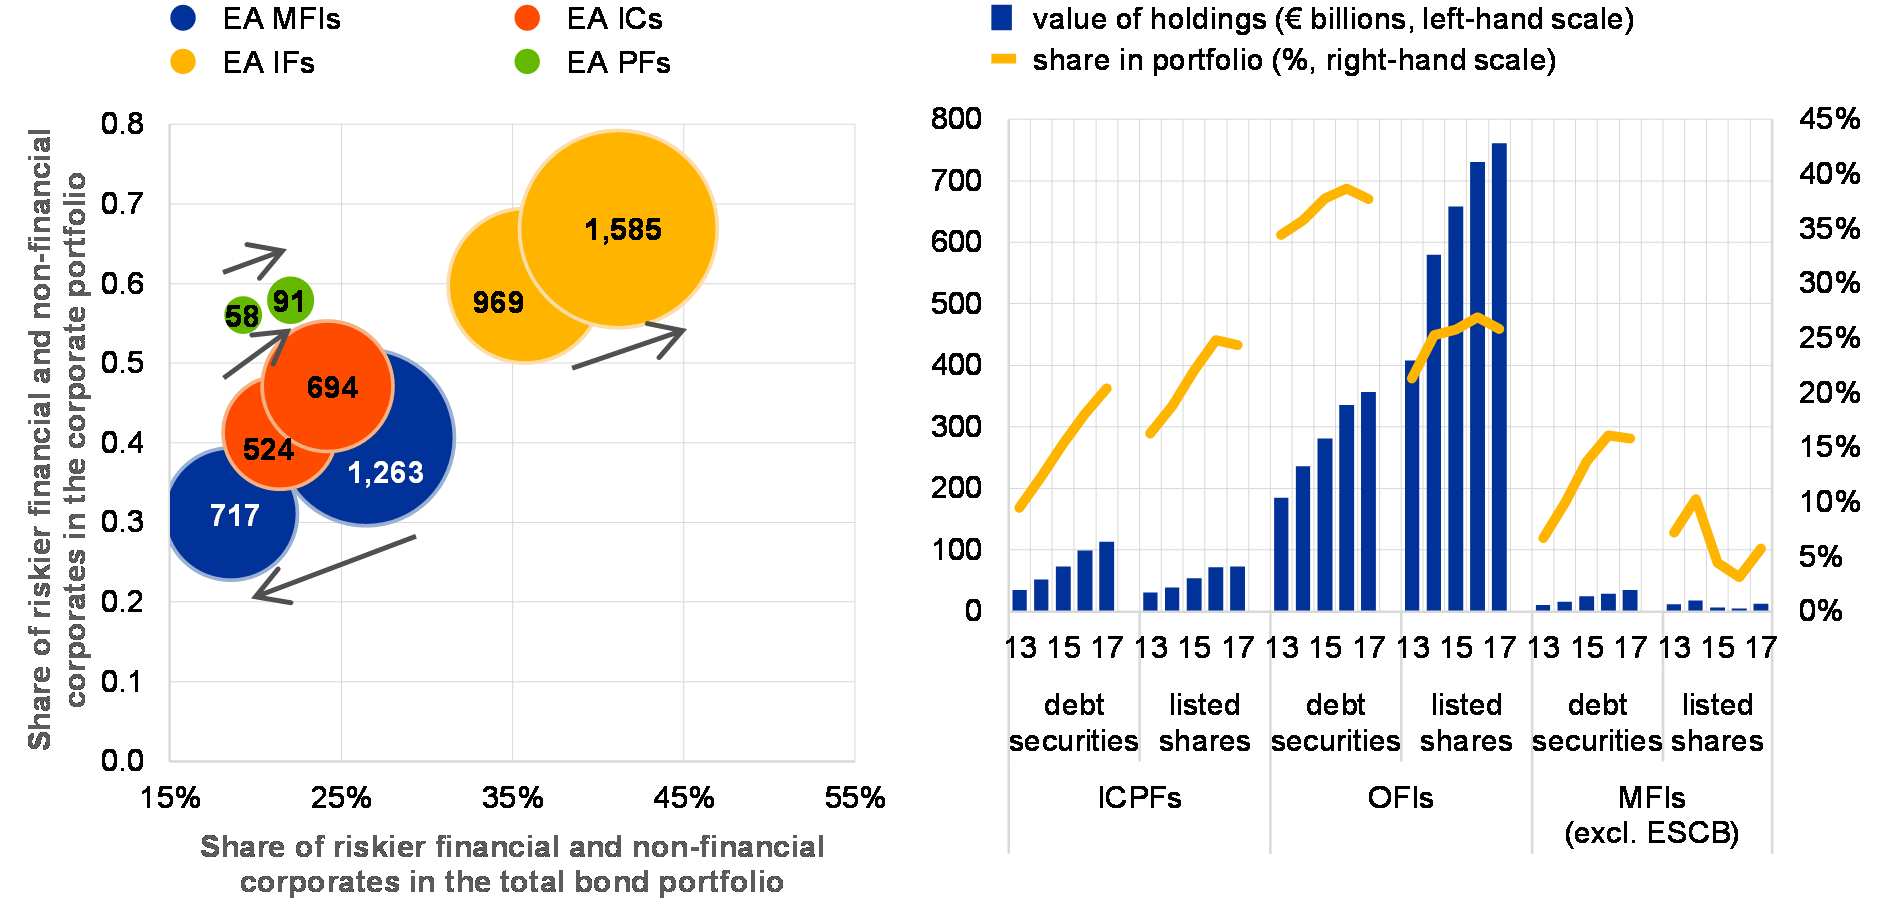
Sources: ECB Securities Holdings Statistics by Sector and ECB calculations.
Notes: “Riskier” bonds refer to BBB and lower-rated bonds, as well as unrated bonds. The size of the bubble reflects the value of risky corporate bonds. The MFI sector excludes the European System of Central Banks (ESCB). US corporate bonds and equities refer to bonds and equities issued by US non-financial firms only.
Euro area non-bank financial institutions are also exposed to vulnerabilities in the real estate market, which are high in some countries. As previously highlighted in the FSR, mortgage lending to households by euro area non-bank financial institutions grew over the last decade and has reached significant volumes in some euro area countries. For instance, in the Netherlands, ICPFs financed 28% of new mortgages in 2016.[65] According to EIOPA, insurers are exposed to the real estate sector, both directly by investing in mortgages and in loans and equity of real estate corporations, and indirectly via shares of investment funds operating in real estate. [66] Such exposure accounts for around 7% of the total assets of the euro area insurance sector but is much more pronounced in some countries, particularly those with stretched property prices. In particular, insurers in the Netherlands (17%), Finland (13%), Belgium (12%) and Austria (11%) have the largest exposures and these were all countries which received a warning on residential real estate vulnerabilities from the ESRB in 2016.[67]
Euro area insurers continued to weather the low-yield environment and sustained exceptionally costly catastrophes in 2017
The market outlook for euro area insurers differs across insurer types. Life insurers’ equity prices continued to appreciate during most of the review period, supported by stronger economic growth, favourable global financial sentiment and solid premium growth (see Chart 3.29). This was also reflected in improving price-to-book ratios of life insurers, which climbed from around 0.7 to over 0.8 over the last year. By historical standards, however, the price-to-book ratios remain at very low levels as life insurers continue to face profitability headwinds from the still low level of yields. By contrast, price-to-book ratios of non-life insurers have been hovering above 1 in recent years since non-life business is somewhat less affected by the prevailing low-yield environment. In early 2018, the ratios declined slightly, owing inter alia to exceptionally large catastrophe costs in the second half of 2017, but they rebounded to over 1.3 towards the end of the review period.
Chart 3.29
Financial performance differed by type of business
Stock prices, price-to-book ratios and gross premium growth
(left panel: 1 Jan. 2017 – 4 May 2018, daily observations, stock prices indexed to 100 on 29 Nov. 2017; right panel: 2012 – Q4 2017, percentages, median, interquartile range and 10th-90th percentile range)
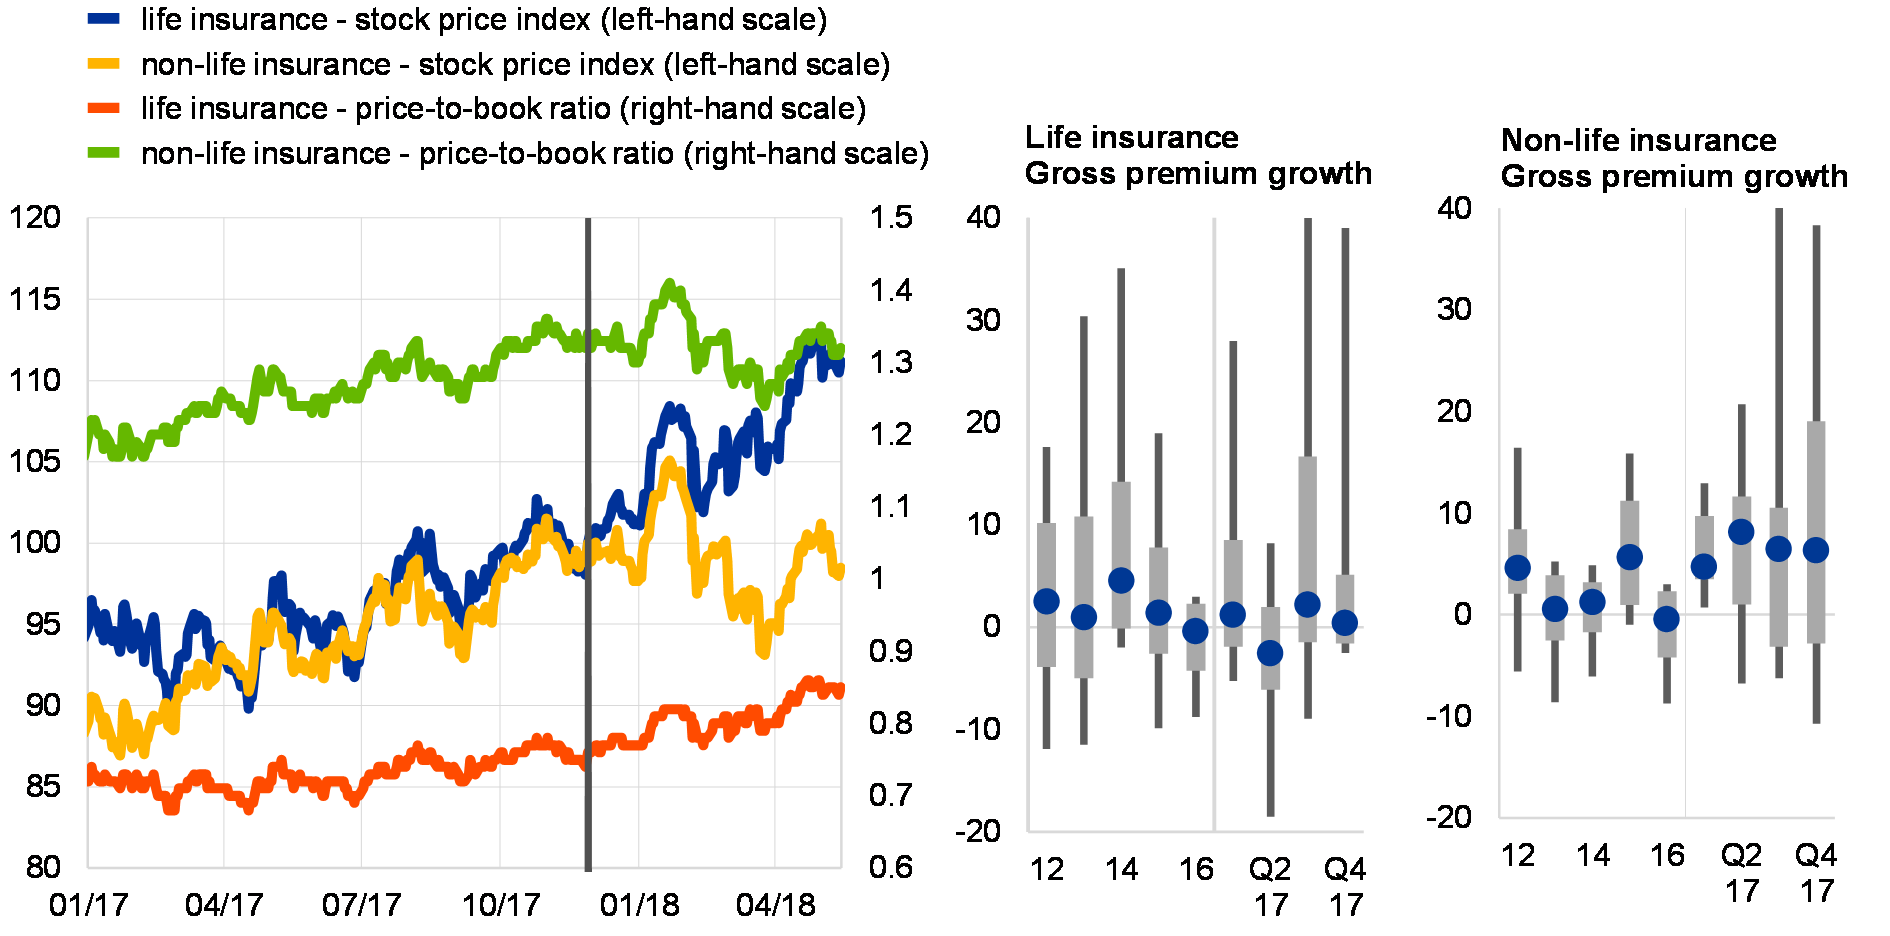
Sources: Thomson Reuters Datastream, Bloomberg, individual institutions’ financial reports and ECB calculations.
Notes: The vertical line in the left panel indicates the publication date of the November 2017 FSR (29 November 2017). The right panel is based on a sample of 27 large insurers and reinsurers with total combined assets of about €4.98 trillion in 2017, which represent around 62% of the assets in the euro area insurance sector. Quarterly data are only available for a sub-sample of these insurers.
Recently rising yields are bolstering the profitability outlook for the life insurance sector. Increasing yields help life insurers with a significant share of guaranteed-rate policies to overcome recent difficulties in generating investment returns above the average guaranteed rate on existing business. In addition to this slow-moving “income channel”, higher long-term yields also have an immediate effect on the valuation of insurers’ balance sheets (“balance sheet channel”). Specifically, an increase in the “risk-free” rate of interest induces declines in the values of both assets and liabilities but the drop on the liabilities side typically exceeds that on the assets side, thereby resulting in a positive balance sheet effect. Although life insurers have shifted their product mix away from policies with guaranteed rates towards unit-linked products, i.e. products in which investment risk is borne by the policyholder (see Chart 3.30), new business represents only a small fraction of existing policies. So the recent rise in yields is likely to have been an important driver of the overall improving outlook for life insurers. However, future rises in yields – should they be too abrupt and pronounced – could also bring some drawbacks such as an increase in policy lapses, i.e. premature terminations of insurance policy contracts.
Chart 3.30
Unit-linked life insurance business has been growing
Life insurance business broken down by product type
(2008-17, percentage of life insurance policies (left-hand scale), annual growth rate (right-hand scale))
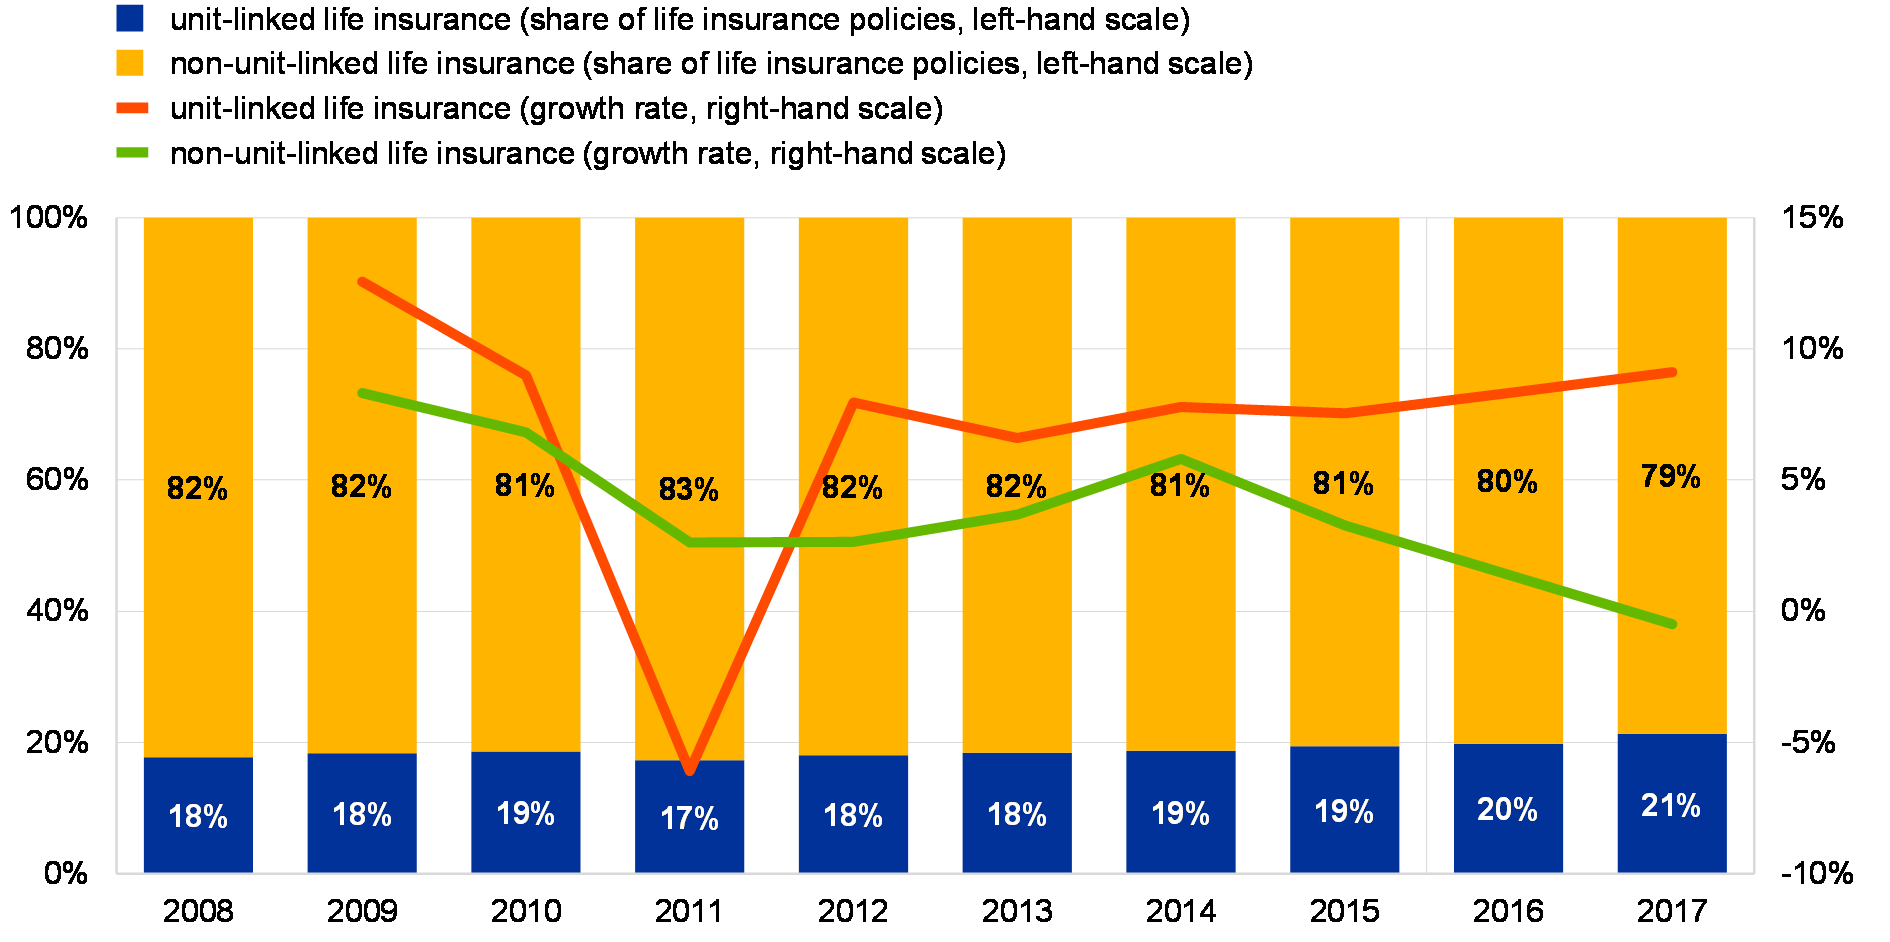
Sources: ECB (insurance corporation balance sheet statistics) and ECB calculations.
Notes: The solid vertical line indicates a structural break due to the changes in the ECB’s insurance corporation balance sheet data. The growth rates in 2016 are interpolated using the values in 2015 and 2017.
On the non-life insurance side, reinsurers weathered in 2017 the most costly year on record in terms of insured natural catastrophe losses.[68] The exceptionally large losses dented in particular the earnings of the three large euro area reinsurers in the third quarter of 2017, with negative repercussions for their return on equity (see Chart 3.31). The costs also pushed up the combined ratios of reinsurers to levels over 100% in that quarter.[69] But overall, they only had a limited impact on Solvency Capital Requirement (SCR) ratios, which remained well above 200% for all three large euro area reinsurers. In January 2018, reinsurance premiums increased on the back of elevated demand for reinsurance after the string of large catastrophes – but at a lower rate than anticipated by some market participants. As a result, the outlook for reinsurers’ profitability has not changed materially.
Chart 3.31
Reinsurers’ return on equity dropped in the second half of 2017, owing to high catastrophe costs
Return on equity for a sample of large euro area insurers
(left panel: 2012 – Q4 2017, percentages, median, interquartile range and 10th-90th percentile range; right panel: 2012 – Q4 2017, percentages, minimum and maximum)
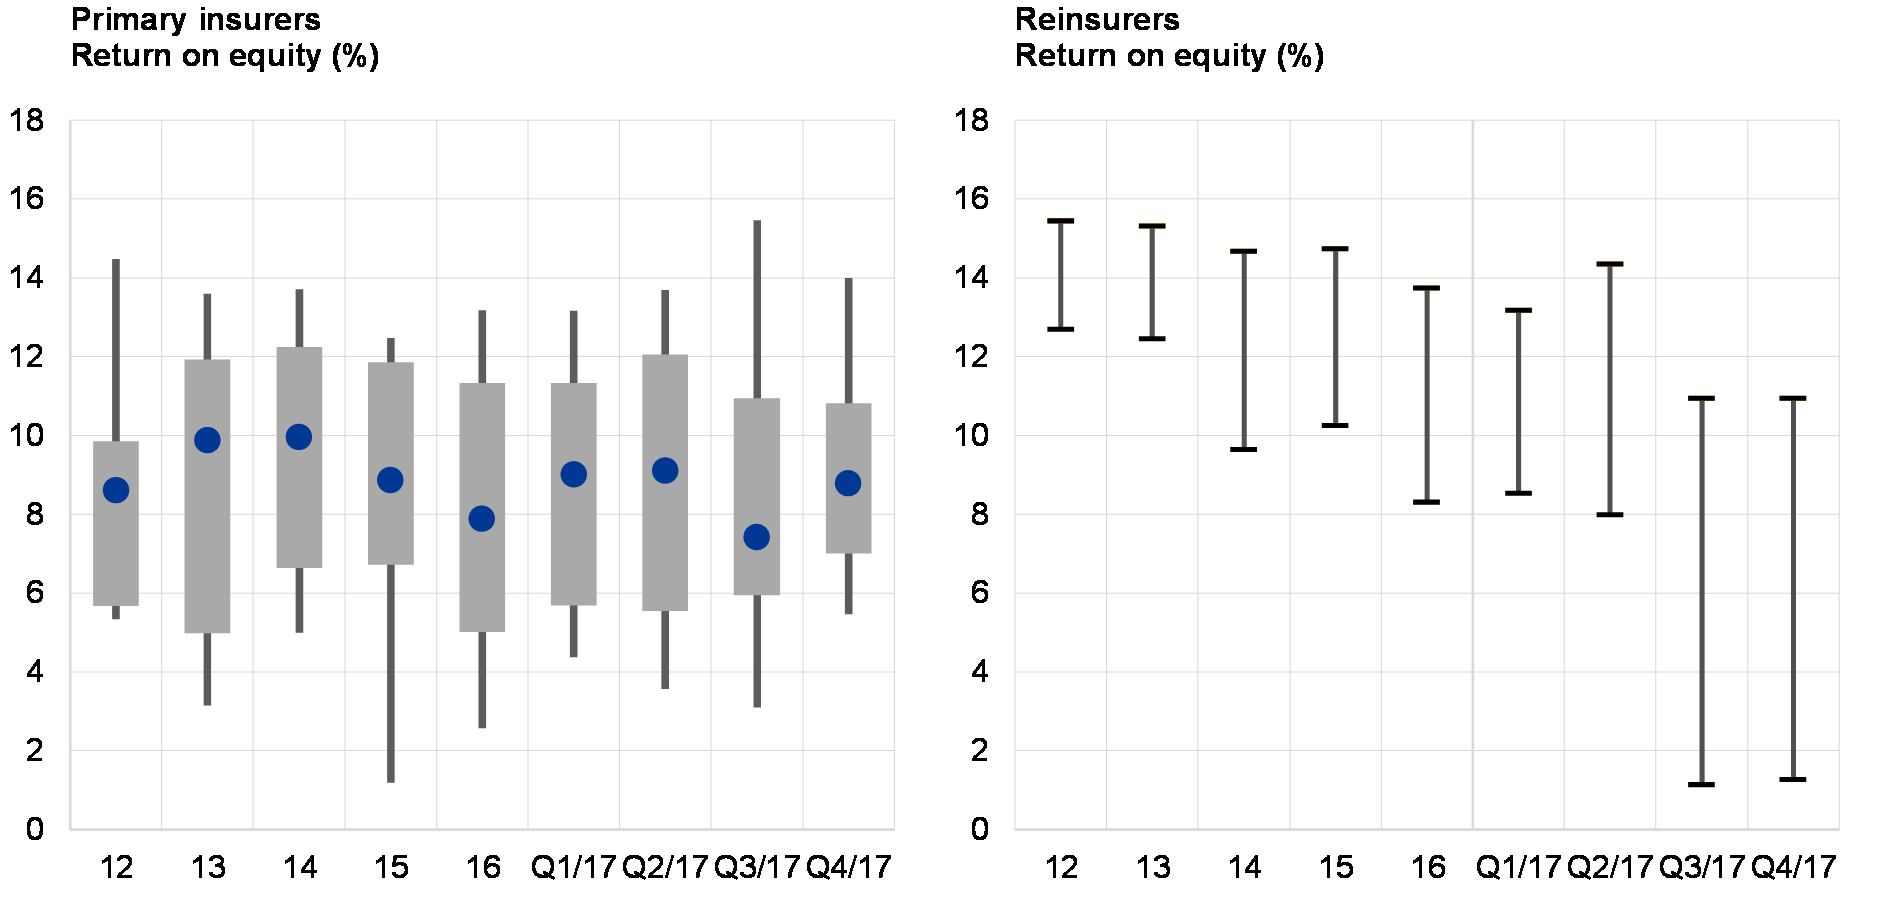
Sources: Bloomberg, individual institutions’ financial reports and ECB calculations.
Notes: Quarterly data are annualised. Based on a sample of 24 large insurers and 3 reinsurers with total combined assets of about €4.98 trillion in 2017, which represent around 62% of the assets in the euro area insurance sector. Quarterly data are only available for a sub-sample of these insurers.
The solvency positions of euro area insurers vary widely across countries, but the majority of SCR ratios remain well above the regulatory requirement of 100% (see Chart 3.32). In some countries, SCR ratios have even been increasing slightly, owing to rising yields. However, the comparability of reported SCR ratios is affected by several factors such as the option to use (full or partial) internal models and a number of long-term guarantee (LTG) and equity risk measures.[70] In particular, a recent report published by EIOPA confirms a high degree of cross-country heterogeneity both in terms of the type and number of measures used and of the impact they have on the solvency position.[71] Overall, the results show that the LTG measures produce lasting positive effects on the regulatory solvency position of some insurers even in situations of low market volatility. EIOPA is conducting impact assessments to consider whether a revision of the rules is warranted.
Chart 3.32
SCR ratios vary widely across countries, but remain well above the regulatory requirement of 100% for the majority of euro area insurers
SCR ratios
(Q3 2017, percentages, median, interquartile range and 10th-90th percentile range)
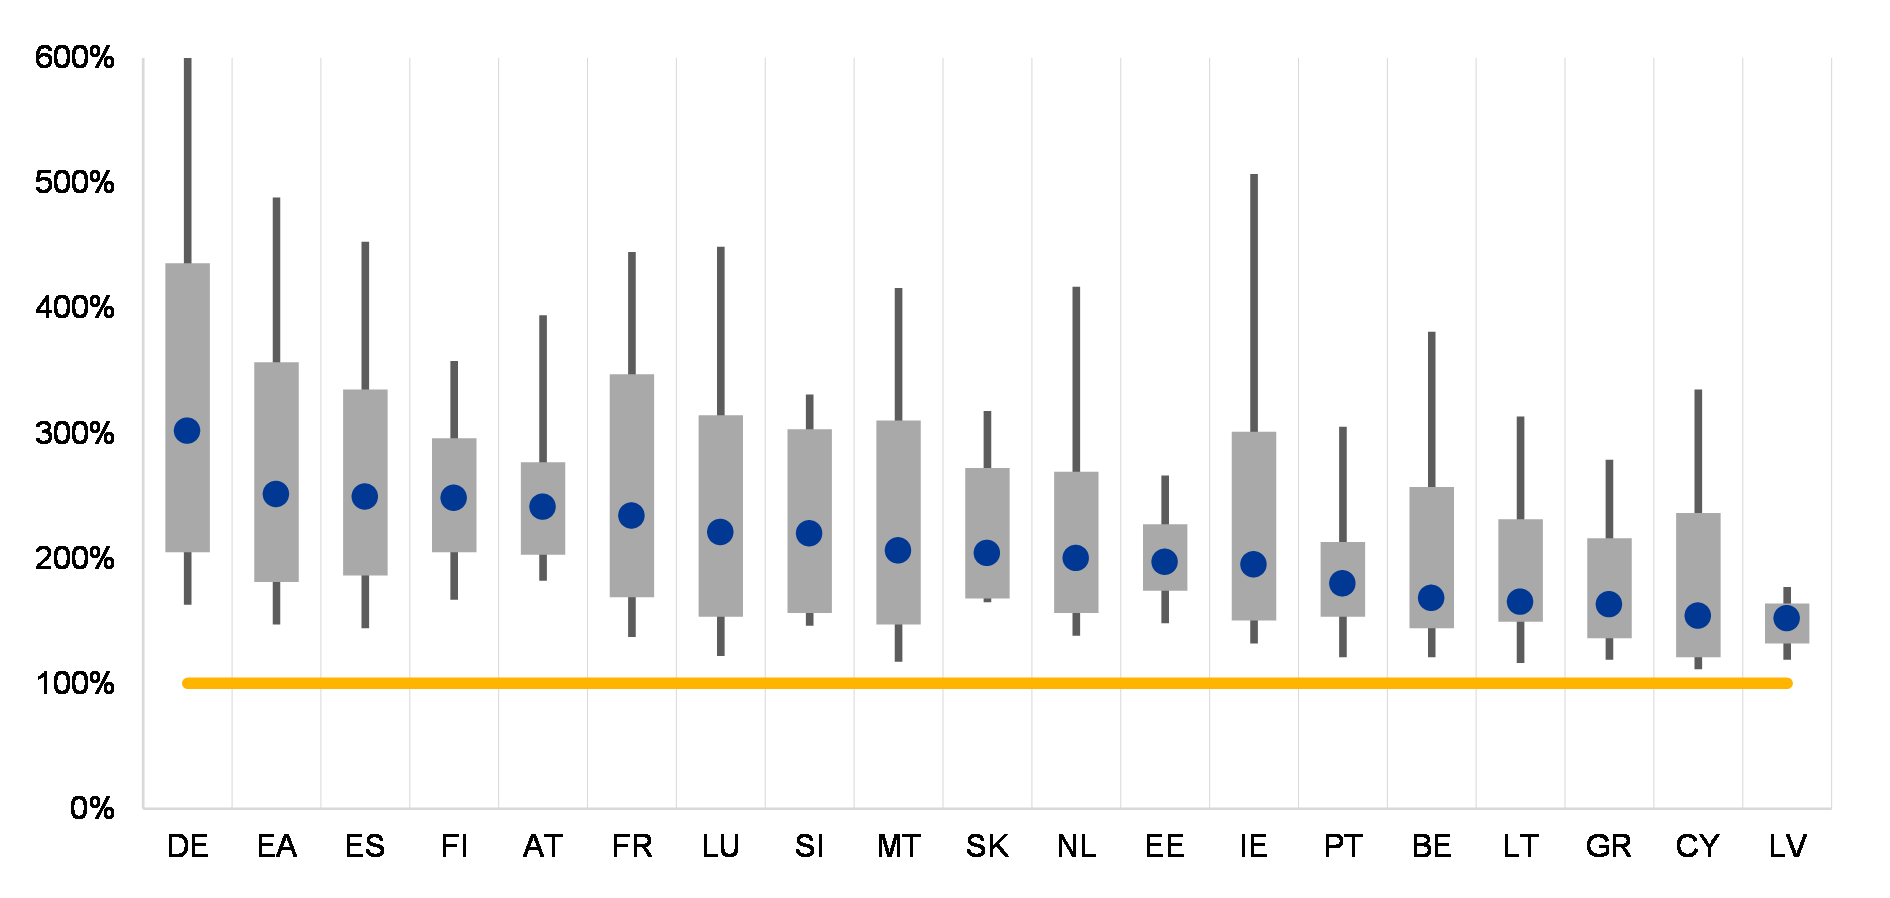
Sources: EIOPA (quarterly solo data) and ECB calculations.
Notes: The SCR ratio (sometimes referred to as the “Solvency II ratio”) is calculated as total available capital resources over the Solvency Capital Requirement (SCR). The latter is calibrated using the value at risk (VaR) of the basic funds of a company subject to a confidence level of 99.5% over a one-year period. A ratio over 100% indicates that an insurance firm has available capital resources that exceed the SCR, i.e. the capital levels exceed the regulatory requirement for a “healthy” insurer.
Although several indicators suggest that insurers continue to cope with the prevailing low-yield environment, this has been accompanied by increased risk in investment portfolios of some firms. Looking ahead, these portfolio shifts need to be monitored carefully, also in light of the potential pro-cyclicality of insurers’ investment behaviour which might aggravate the impact of a potential repricing of risk premia in global financial markets.[72]
Investment fund inflows weaken in the wake of rising yields, lower returns and increased volatility
Bond fund returns have gradually deteriorated since the beginning of last year and have recently become negative. Taking on more credit and duration risk over the past few years has helped asset managers generate attractive returns on a risk-adjusted basis amid generally low yields across the globe. Average returns for euro area bond funds deteriorated markedly over the past year due to rising yields in global bond markets. These funds were on average still yielding a significant gain on an annual basis (see Chart 3.33). But incentives to place new money in these funds have gradually diminished, due to stretched bond valuations and the slowly vanishing advantage of holding bond fund shares compared with holding cash. The performance of high-yield and investment-grade corporate bond funds, as well as emerging market funds, deteriorated further in the review period.
Chart 3.33
Average returns for all bond fund types declined substantially during the last year
Annual returns for euro area bond funds in comparison with bank deposits and MMF returns
(Jan. 2017 – Apr. 2018, percentages)
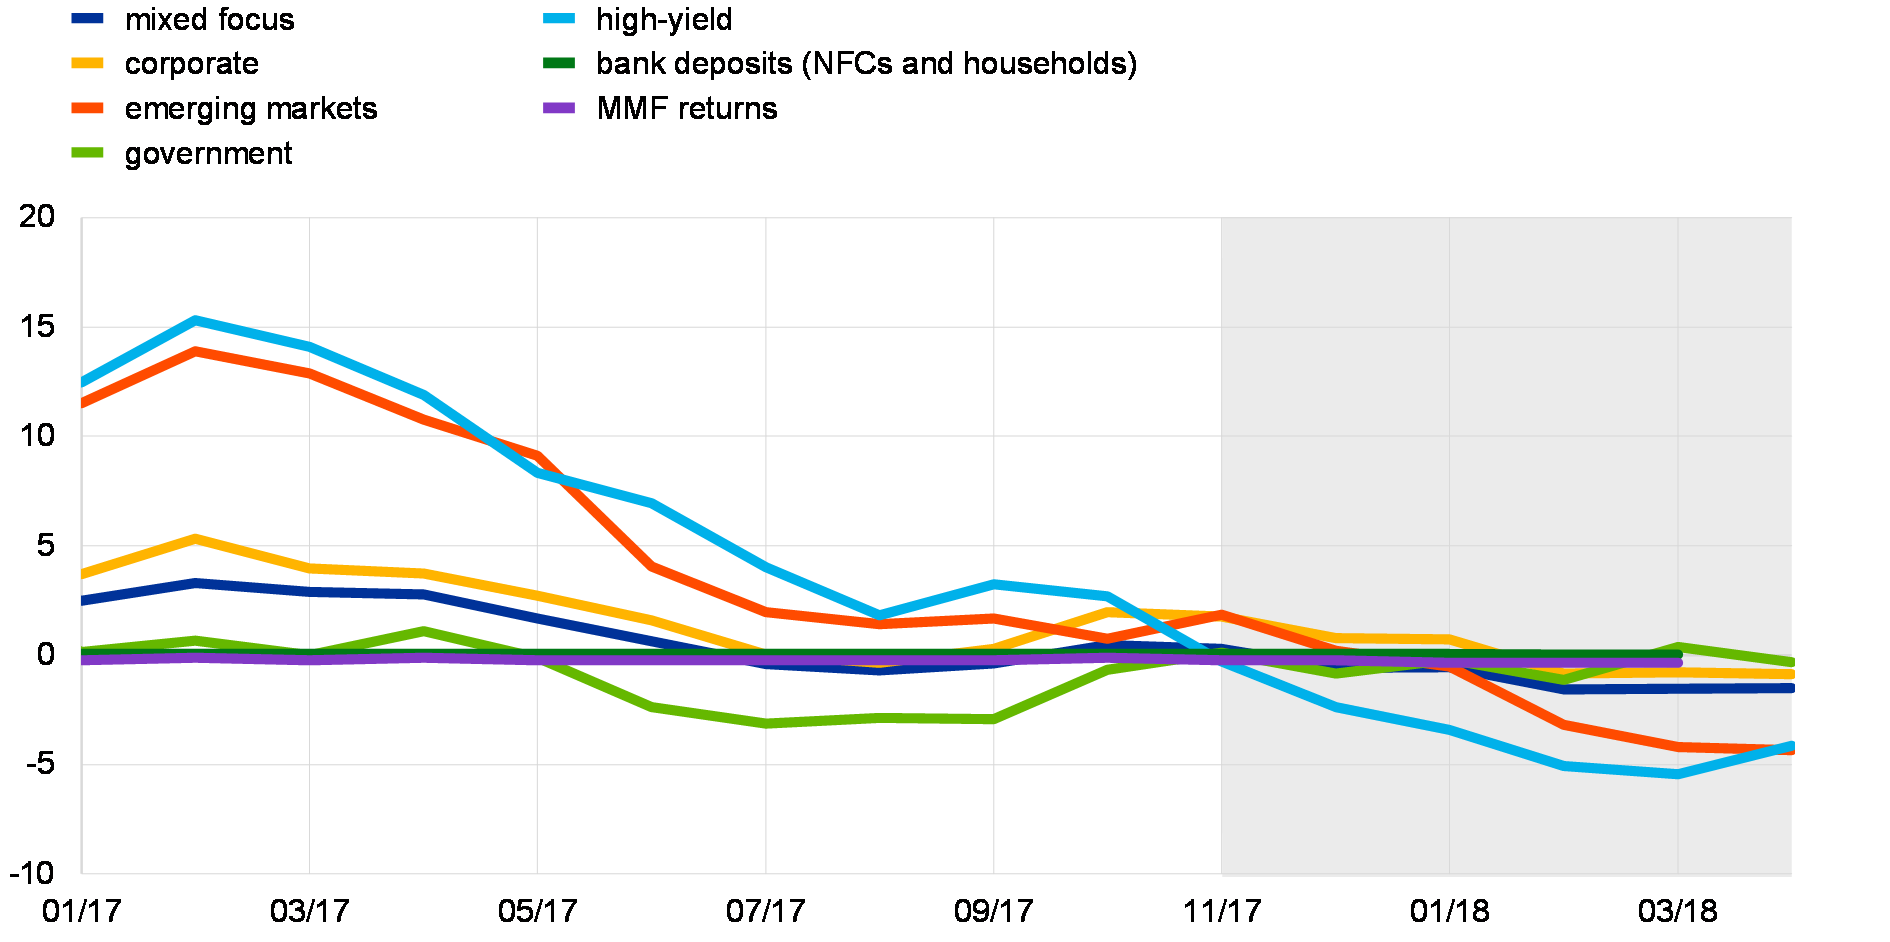
Sources: Lipper, EPFR, ECB and ECB calculations.
Notes: Based on a selected sample of traditional bond funds and exchange-traded funds (ETFs); euro area fund domicile. Annual returns are weighted by the fund value. The grey-shaded area indicates the period since the last FSR was published in November 2017.
Broader-based outflows from bond funds could be observed as returns have deteriorated since the end of last year. Since November 2017, most bond fund types have experienced net outflows, except for emerging market bond funds which continued to receive net inflows, although much less than previously (see Chart 3.34). In addition, the outflows from government bond funds observed before November 2017 have attenuated in response to better performance. Interestingly, most bond funds still attracted net inflows until November 2017, which was exceptional from a historical perspective, as investors responded to deteriorating returns by withdrawing their money much later compared with previous episodes.
Chart 3.34
Broader-based net outflows from bond funds as returns deteriorated since the end of last year
Performance and cumulative flows of euro area bond funds for selected periods
(Jan. – Nov. 2017, Dec. 2017 – Apr. 2018; x-axis: average monthly returns; y-axis: cumulative flows as a percentage of NAV)
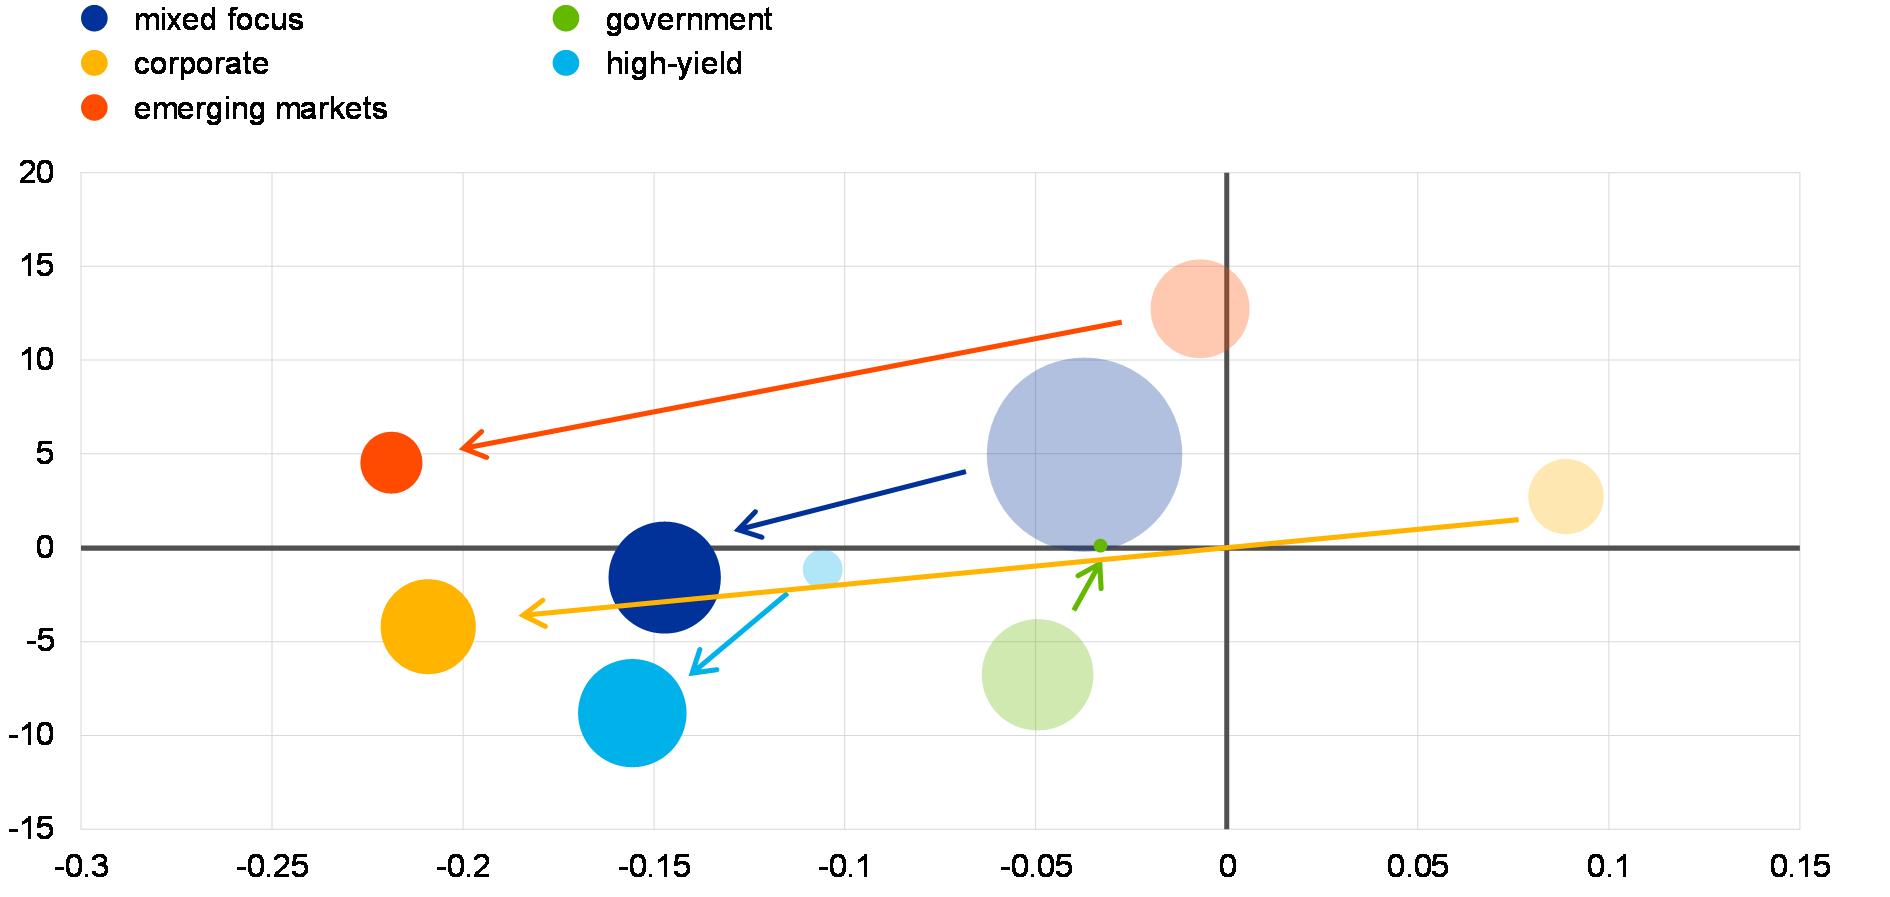
Sources: Lipper and ECB calculations.Notes: Based on a selected sample of traditional bond funds and ETFs; euro area fund domicile. The size of the bubbles corresponds to cumulated net flows for the respective period. The transparent bubbles represent the period Jan.-Nov. 2017, while the solid bubbles represent the period Dec. 2017-Apr. 2018 (i.e. the period since the last FSR was published in November 2017). The arrows indicate shifts over time.
Earlier this year, the corporate bond fund sector experienced some more pronounced net outflows. From February, high-yield and investment-grade bond funds experienced outflows as credit spreads widened from previously very low levels. In particular, funds invested in the US high-yield segment – and to a lesser extent in the investment-grade segment – experienced significant outflows following a repricing of risk at the beginning of February (see Chart 3.35). Following the volatility spike in early February, high-yield corporate credit spreads saw an orderly and persistent widening, while high-quality corporate bonds and euro area sovereign bonds were only affected marginally (see Chapter 2). Correspondingly, outflows from high-yield bond funds started to accelerate, while net flows into funds focusing on investment-grade corporates turned just negative. Outflows from ETFs invested in high-yield and investment-grade corporate debt were, on average, smaller than those from non-ETFs invested in the same asset classes, while net asset value (NAV) spreads widened.
Chart 3.35
Acceleration of outflows from high-yield bond funds and a possible turning point for investment-grade funds
Cumulative net inflows into high-yield and investment-grade corporate bond funds invested in the US and Europe
(Jan. 2009 – Apr. 2018, USD billions)
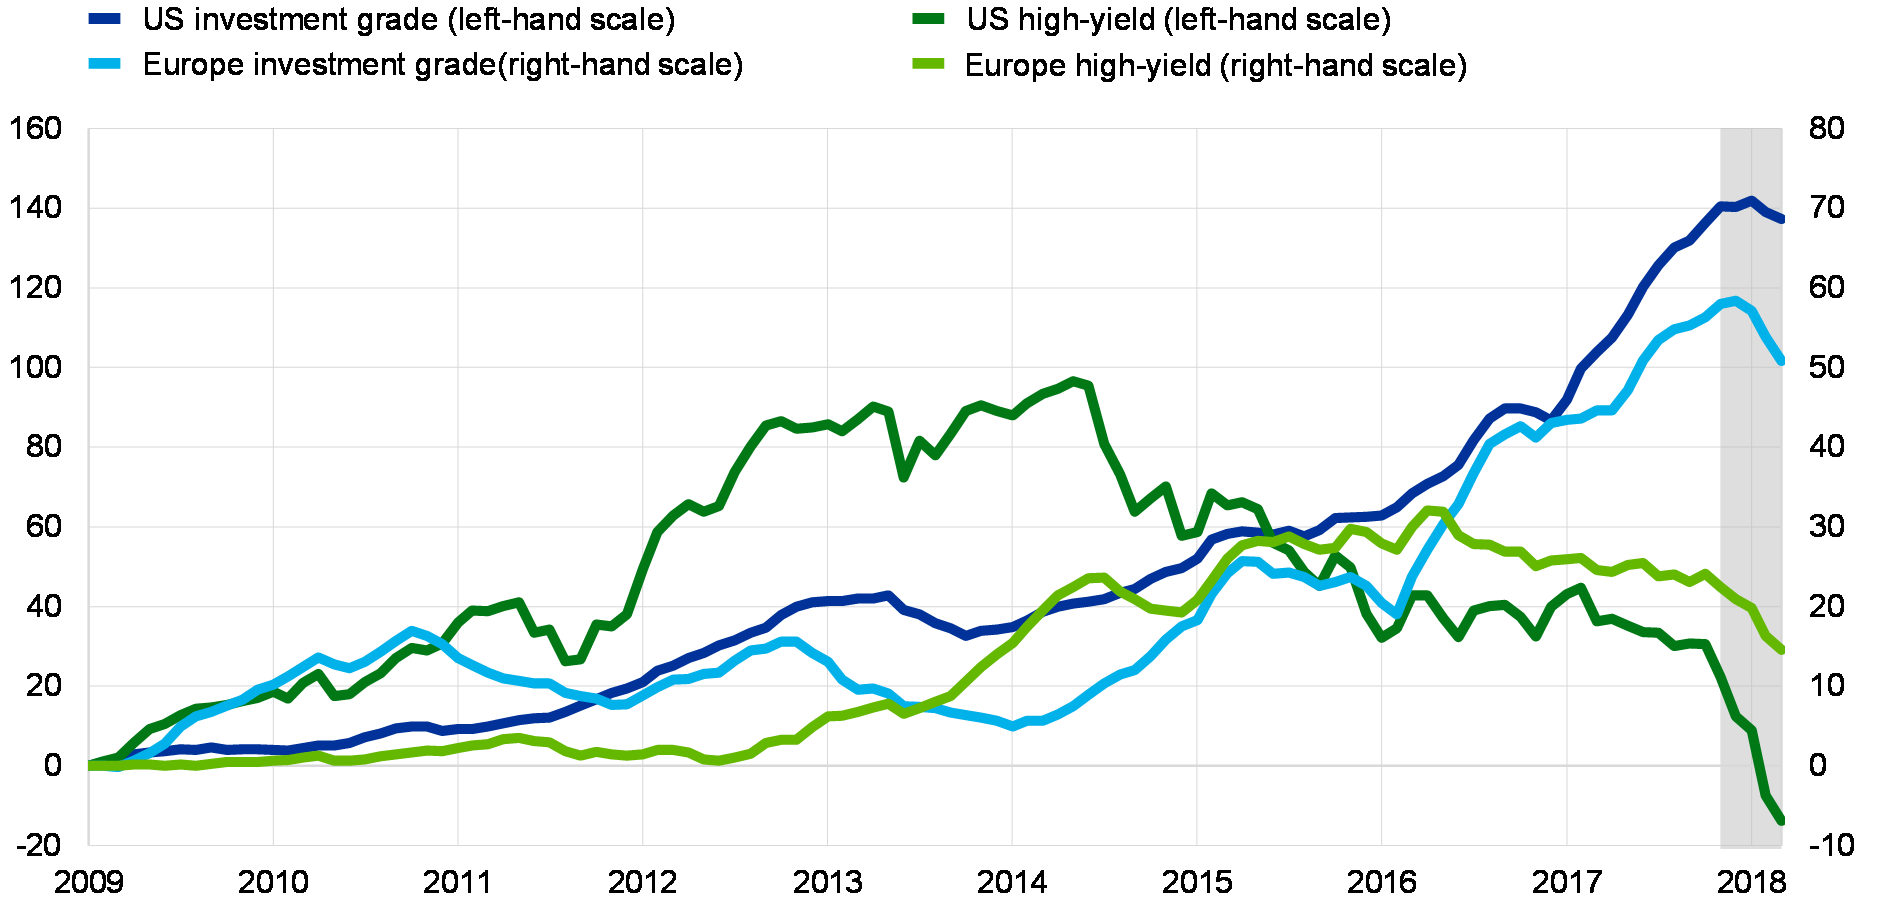
Source: EPFR.
Notes: Cumulative net inflows into corporate bond funds, traditional investment funds and ETFs; global domicile. Investment-grade corporate bond funds represent the sum of funds invested over the short, medium and long term. The grey-shaded area indicates the period since the last FSR was published in November 2017.
Despite the outflows from bond funds, the broader investment fund sector continued to grow. Euro area equity funds, mixed funds, hedge funds and other funds continued to receive net inflows over the review period (see Chart 3.36). Anecdotal evidence during the recent volatility spike in US equity markets in February this year suggests that some investors withdrew money from euro area equity funds, in particular from those invested in US markets. Against this background, it remains to be seen whether the secular trend of prolonged growth in the sector will continue amid periods of increased market volatility and intermittent outflows.
Chart 3.36
The broader investment fund sector continued to grow
Monthly net flows by type of fund and total assets
(Jan. 2009 – Feb. 2018, net flows in € billions (left-hand scale), total assets in € trillions (right-hand scale))
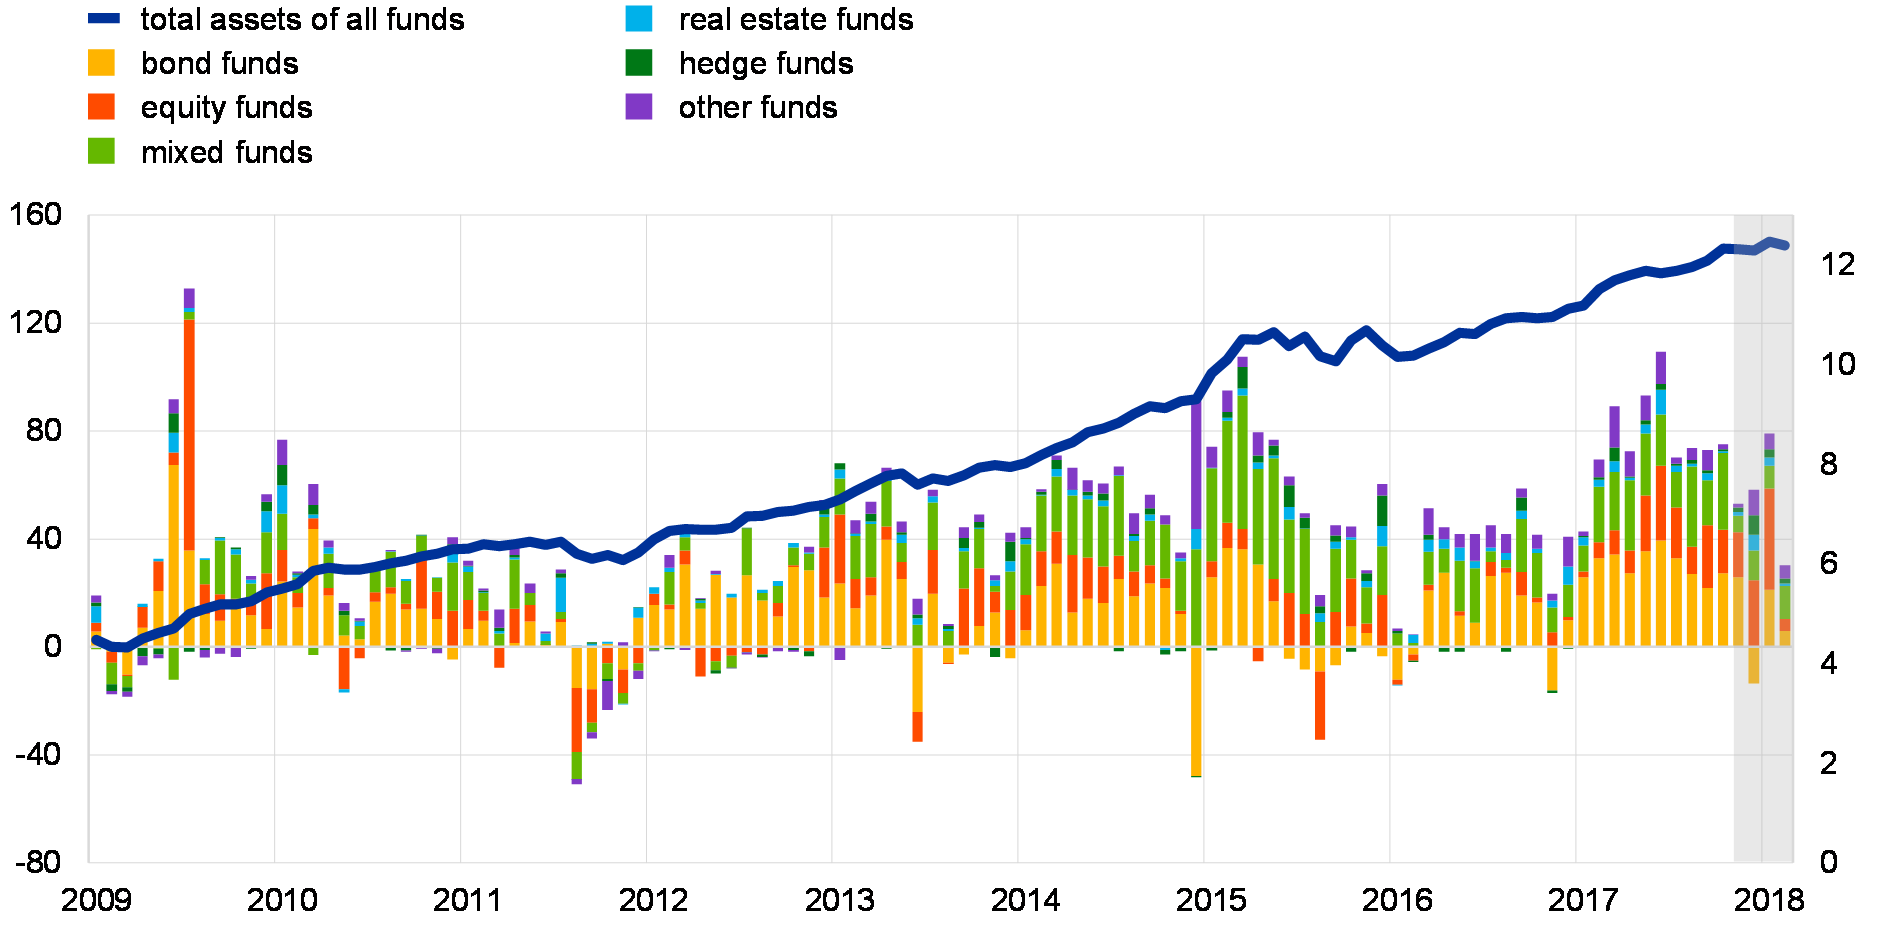
Source: ECB investment fund statistics.
Notes: The data do not cover money market funds. The grey-shaded area indicates the period since the last FSR was published in November 2017.
Investors speculating on a continued low-volatility environment were caught by surprise in February, suffering significant losses. Exchange-traded products (ETPs), such as leveraged and inverse volatility ETPs linked to the VIX, were affected the most.[73] The resulting losses forced asset managers to withdraw some of the well-known inverse volatility products from the market (see Chapter 2). The abrupt and sizeable increase in the VIX in early February also created difficulties among leveraged ETPs trying to hedge their positions in a timely manner. Over the recent years, growth in these products has been reflected in increased holdings also by euro area counterparties. But exposures of euro area investors to this market segment remain very small and are concentrated among a few market participants. Considering some larger products which comprise more than USD 5 billion in total net assets, only about 2-4% is held by euro area counterparties. Losses of, and outflows from, the much larger segment of ETFs tracking the underlying S&P 500 index were significant, yet still within the range of historical experience (see Chart 3.37).
Chart 3.37
The recent spike in volatility also affected traditional ETFs tracking the S&P 500
Performance and flows of US equity ETFs versus the S&P 500
(Jan. 2014 – Apr. 2018; left-hand scale: percentage of total net assets; right-hand scale: index)
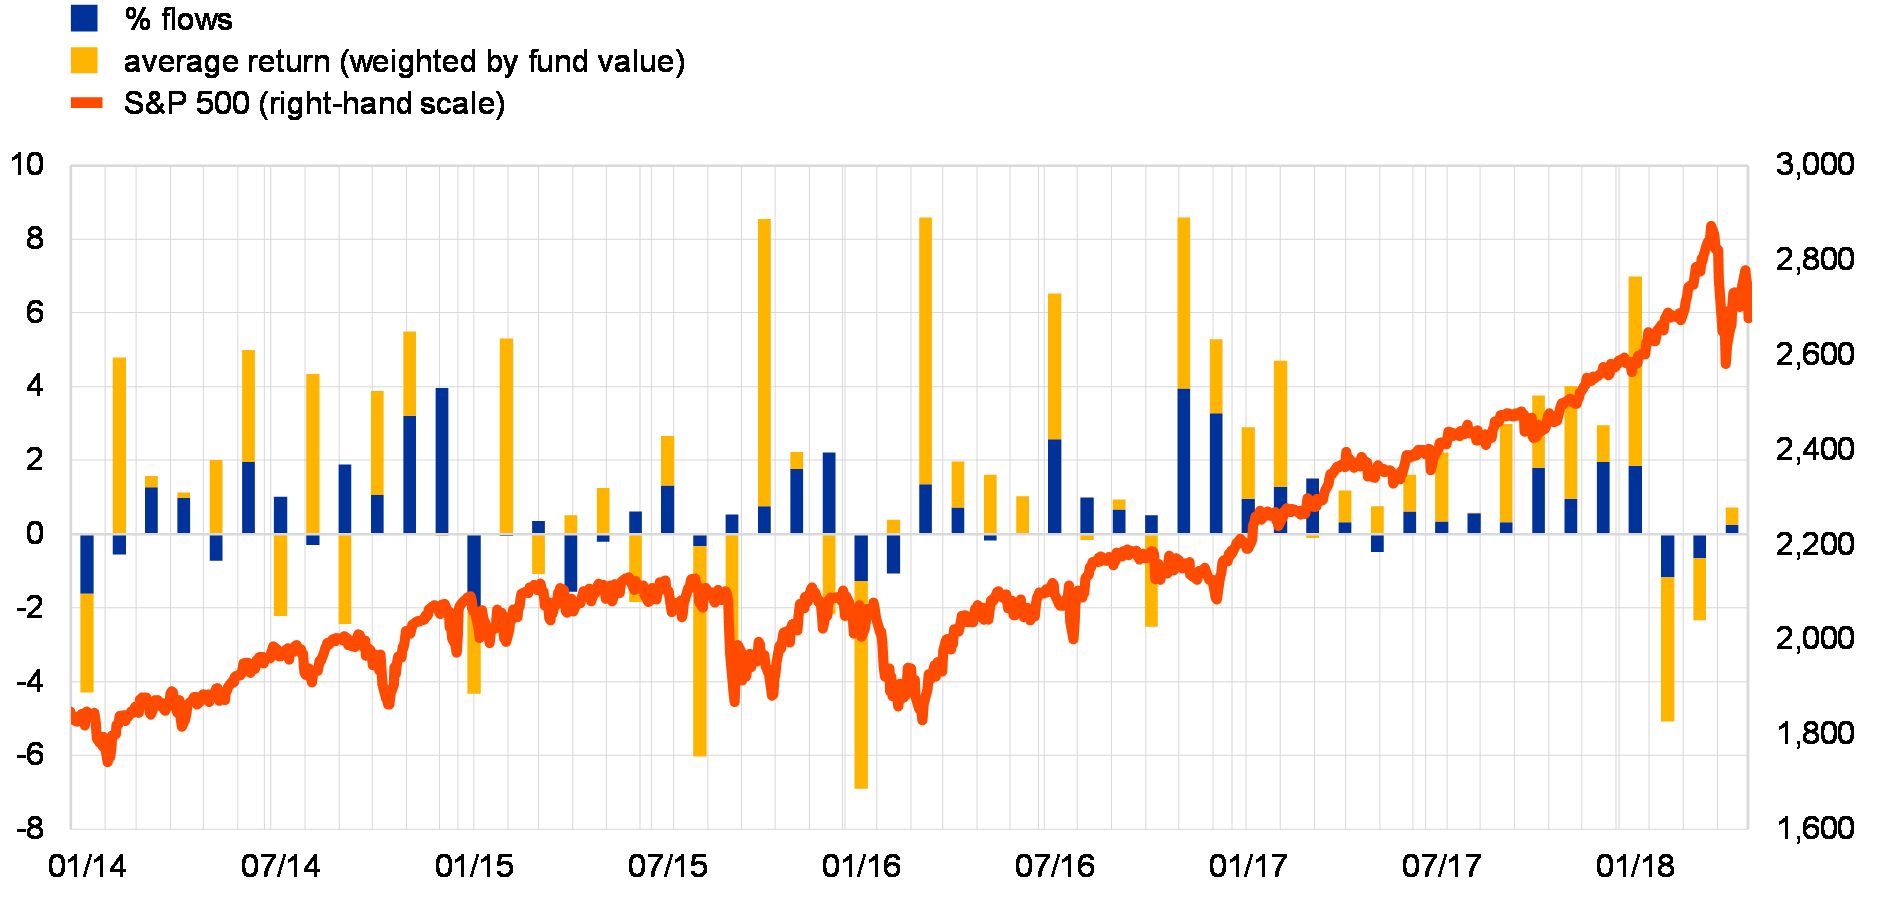
Sources: Lipper, Bloomberg and ECB calculations.
Notes: Weighted averages of net flows and returns for a sample of 1,114 US equity ETFs; monthly data for flows and return; daily data for index.
The low-volatility environment has engendered risk-taking by asset managers in the form of short volatility and long-carry strategies. Such strategies are implemented in both equity and fixed income markets. They include, for instance, low volatility risk premia strategies, some risk parity and volatility targeting strategies, as well as strategies implemented by some commodity trading advisors (CTAs). These strategies, which typically benefit from a low-volatility environment, are likely to respond in a pro-cyclical manner if volatility rises (see Chapter 2).
Investors in funds position themselves in a pro-cyclical manner in line with the signals that they receive from past returns. Net flows tend to rise when returns increase and tend to fall when returns deteriorate. This flow-return correlation has weakened over the past year, as bond funds in the euro area experienced sustained inflows despite deteriorating performance (see Chart 3.38). Flow-return correlations for bond funds have increased recently, in line with previous periods of market stress when the correlation between flows and returns increased. Outflows may spike again in the event of a large repricing, thus adding to the pro-cyclicality inherent in investor behaviour and to selling pressures on the underlying instruments.
Chart 3.38
Flow-return correlations have increased recently
Estimated sensitivity of flows to past returns for euro area bond funds
(Jan. 2007 – Mar. 2018; coefficient estimates and confidence interval)
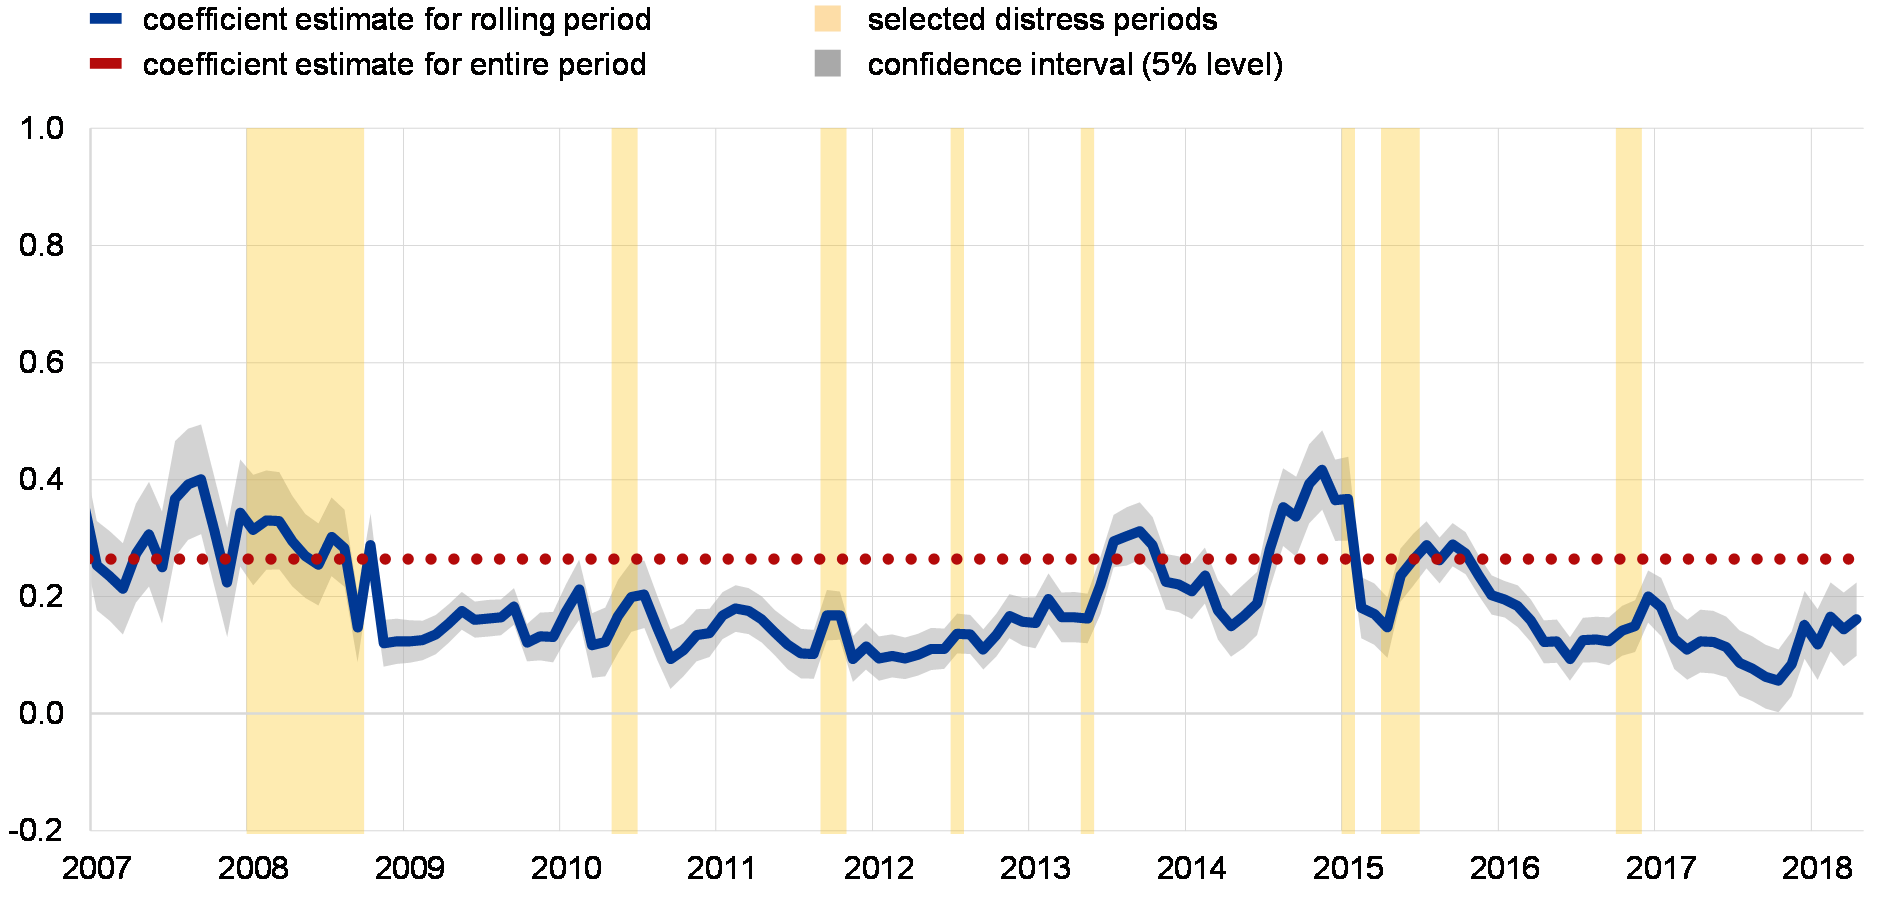
Sources: Lipper IM and ECB calculations.
Notes: Highlighted periods include: acceleration of sub-prime crisis/Lehman collapses (Jan.-Sep. 2008); emergence of sovereign debt crisis/start of the Securities Markets Programme (May/June 2010); deepening of sovereign debt crisis/Italian bond yields peak (Sep.-Oct. 2011); ECB President’s speech (26 July 2012); Fed talks of tapering (22 May 2013); PSPP announcement (22 Jan. 2015); German Bund sell-off (Apr.-May 2015); Greek sovereign crisis re-emerges (June 2015); reversal of yields/US presidential election (Oct./Nov. 2016). The sample includes all euro area bond funds covered by Lipper IM. The blue (dotted red) line depicts the beta coefficient estimates (
) for a fixed effects panel regression
using a 12-month rolling window (fixed period).
A shock to bond prices would give rise to first- and second-round losses for bond funds, particularly those invested in less liquid markets and with low liquidity buffers. Cash buffers available in euro area bond funds have been gradually shrinking across all market segments since 2009 (see Chart 3.39). In addition, sector-wide data point to a broader-based decrease in funds’ most liquid positions, including debt securities issued by euro area governments. From a systemic risk perspective, losses could propagate through the financial system if negative returns trigger investor outflows, eventually resulting in forced sales of less liquid securities. Such sales have the potential to amplify the original shock to bond prices, with wider financial stability implications in the form of impaired market liquidity and possible spillovers to the real economy via negative wealth and confidence effects.
Chart 3.39
Bond funds’ liquidity buffers remain low across all main types of bond funds
Cash holdings for bond funds domiciled in the euro area
(percentage of total assets, median and interquartile range)
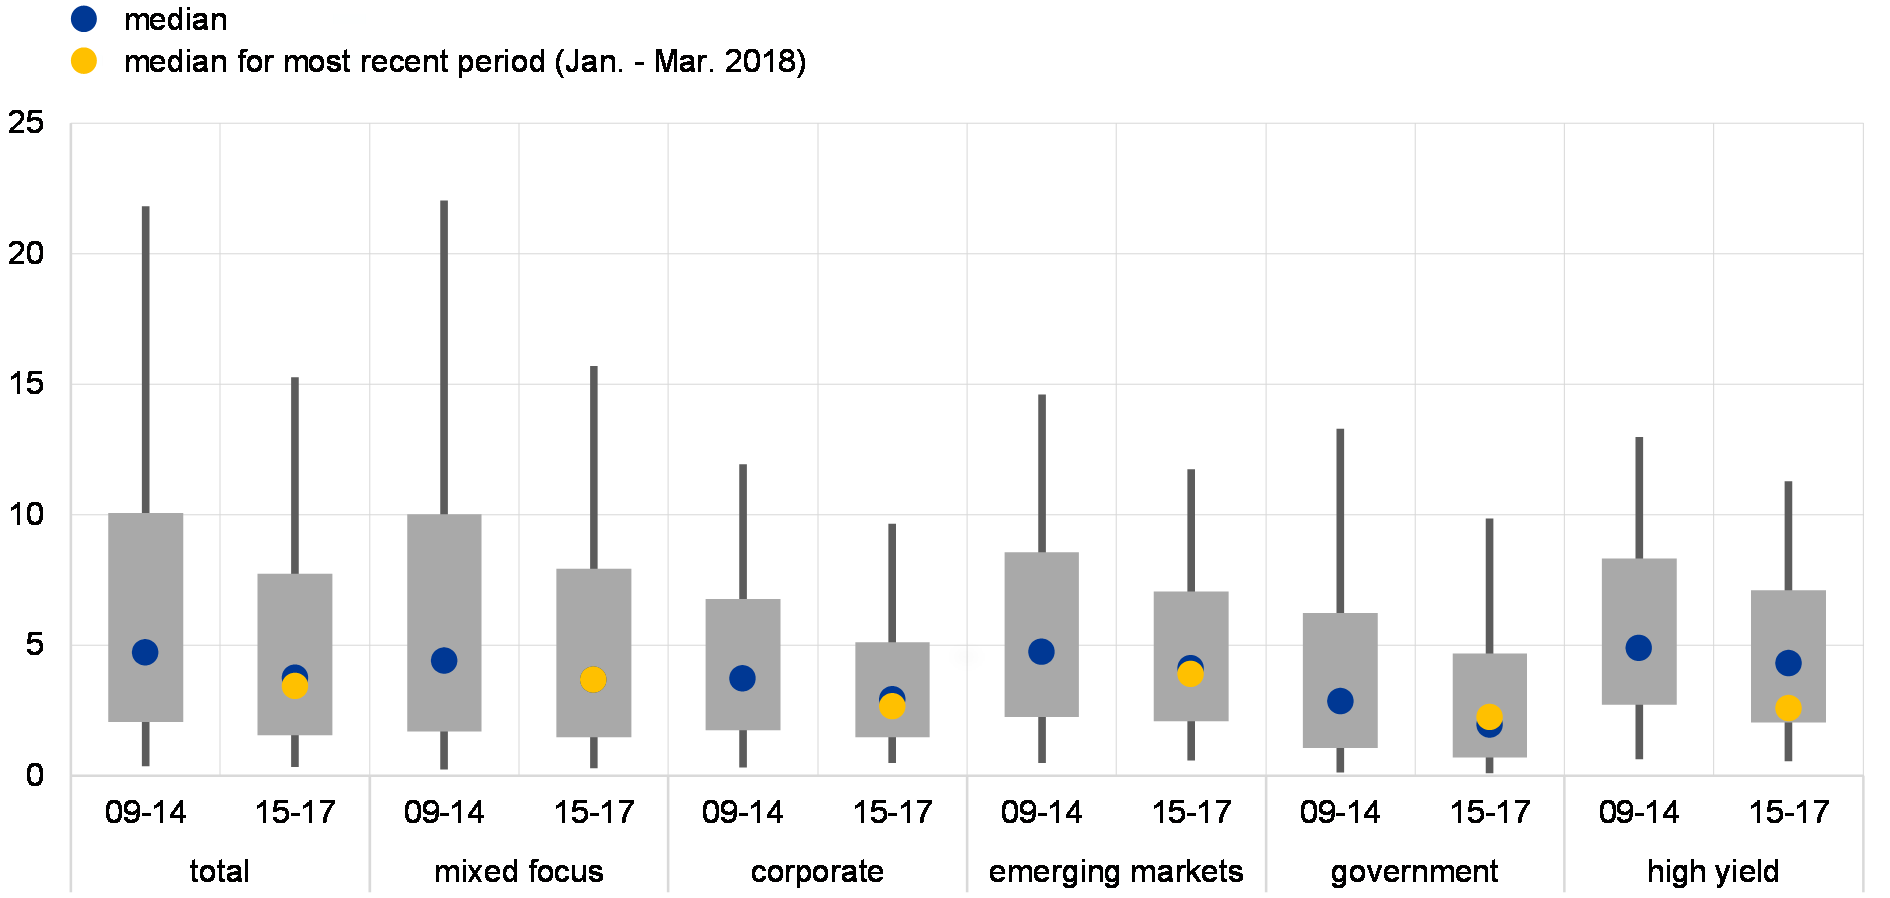
Sources: Lipper IM and ECB calculations.
Notes: The sample of the first period (2009-14) consists of end-of-year fund-level holdings from December 2009 to December 2014. The second period (2015-17) contains the end-of-year holdings for December 2015 to December 2017. The median for the most recent period (Jan.-Mar. 2018) is shown as a yellow dot. The boxplots show the 10th, 25th, 50th, 75th and 90th percentiles of the distributions.
3.3 In aggregate terms, the euro area banking sector is assessed to be resilient to the materialisation of the main financial stability risks
This section provides a quantitative assessment of the resilience of euro area financial institutions to a materialisation of the main systemic risks identified in this review. The assessment of the impact of macro-financial shocks on euro area banks is based on a macroprudential simulation exercise involving top-down stress-testing models[74] and covers about 100 large and medium-sized banking groups directly supervised by the ECB. More specifically, the main risks presented in the Overview are mapped into two adverse scenarios to assess the resilience of the euro area banking sector. Owing to methodological, scenario and sample differences, the results presented in this section should not be compared with the results of supervisory stress-test exercises, such as those coordinated by the European Banking Authority and the Single Supervisory Mechanism (SSM) or those conducted in the context of the IMF Financial Sector Assessment Program (FSAP). Due to the limited availability of disaggregated data on assets, liabilities, capital and profitability of non-bank financial institutions, this section does not assess the resilience of these parts of the financial sector.
Main features of the adverse macro-financial scenarios
The assessment of the resilience of the euro area banking sector is based on two adverse scenarios. These adverse scenarios have been designed using the ECB stress-testing models.[75] The narratives of the scenarios have been developed so as to reflect the materialisation of the systemic risks presented in the Overview. Although the scenarios are assumed to be independent of each other in the analysis presented in this section, the materialisation of the first scenario might also lead to the materialisation of the second scenario. The mapping between the main exogenous shocks assumed to trigger these scenarios and the main financial stability risks is summarised in Table 3.1. The impact of the adverse scenarios is assessed with reference to a baseline scenario, which is mainly based on the December 2017 Eurosystem staff macroeconomic projections.[76]
Table 3.1
Mapping the main systemic risks into exogenous triggers of the adverse macro-financial scenarios
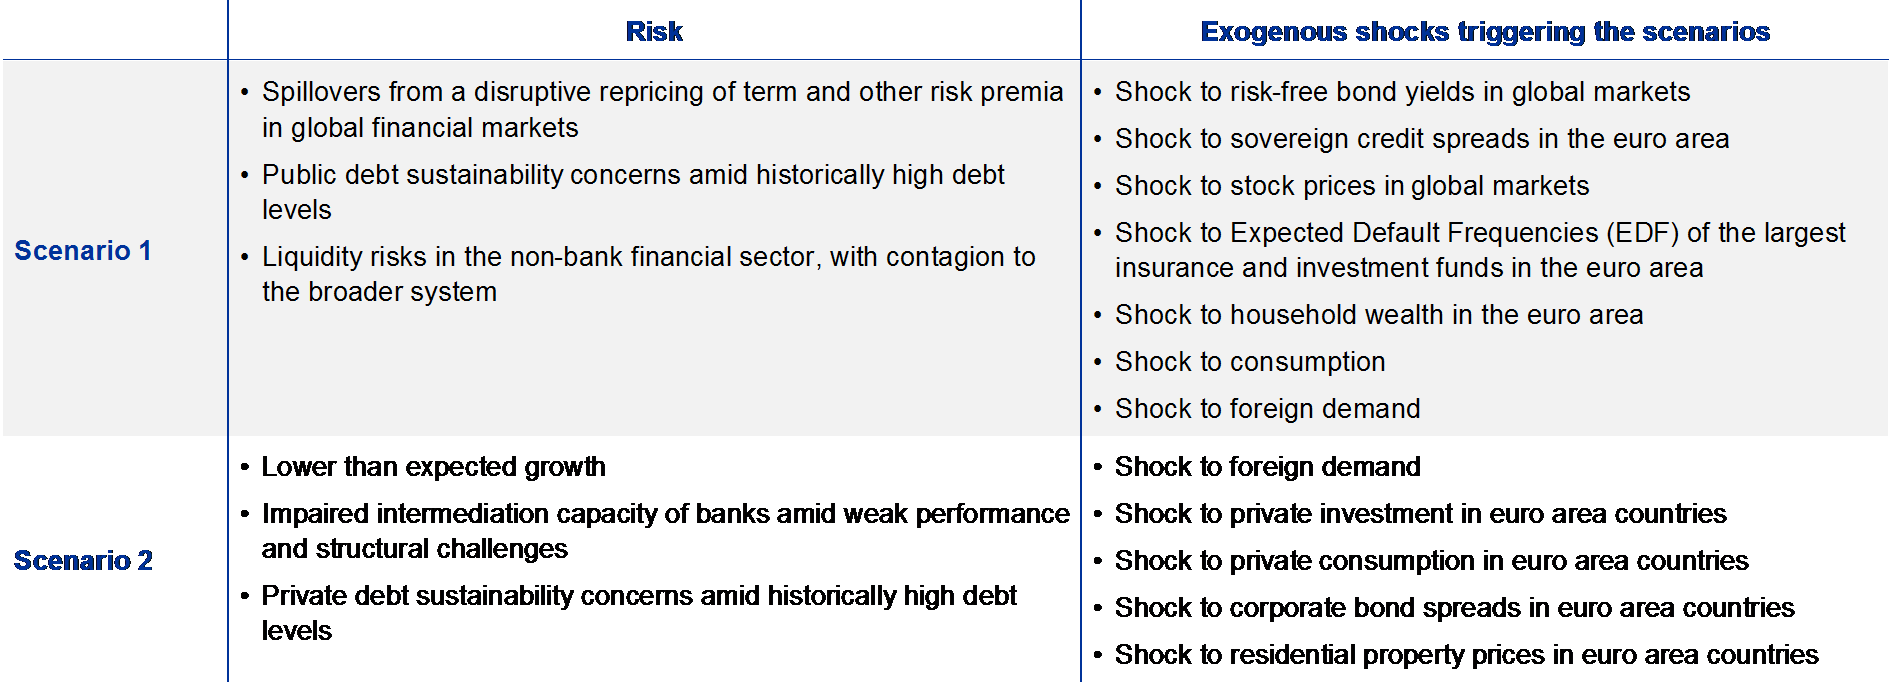
Source: ECB.
The first scenario is triggered by an abrupt repricing of global risk premia, entailing very strong financial contagion to the euro area. Changes in market participants’ expectations regarding economic policies in major economies outside the EU are assumed to trigger an abrupt repricing of risk premia which spills over to the euro area economy mainly via financial contagion in equity and bond markets. Yield curves steepen and credit spreads widen both in advanced and emerging economies. The generalised increase in sovereign bond yields triggers a re-emergence of public debt sustainability concerns for countries with lower credit ratings, leading to a greater widening of risk premia in those countries. At the same time, stock prices fall in global financial markets and the fall is amplified by a large sell-off of equities by the non-bank financial sector. Financial shocks spill over to the real economy via wealth effects. In addition, a rise in risk aversion increases precautionary savings and dampens aggregate demand.
The second scenario is generated by a strong economic slowdown resulting in a negative feedback loop between the banking sector and the real economy. Lower than expected economic growth in the United States and in emerging economies is assumed to spill over to euro area countries via trade channels. The slowdown of economic growth is amplified by trade disruptions due to more protectionist policies in some advanced economies. This generates domestic demand confidence shocks, negatively affecting private consumption and investment. Corporate bond yields increase sharply, reflecting higher levels of risk in the non-financial corporate sector. Unemployment also increases more abruptly than in the past due to the preponderance of flexible working contracts. As a consequence, households and firms face difficulties in paying back their debt, especially in countries with highly indebted private sectors. Difficulties for households in making mortgage repayments together with the slowdown in aggregate demand cause a drop in property market activity, both in the residential and commercial property segments, which diminishes the collateral value of mortgages.
The two scenarios result in different overall real economic effects. The second scenario would have the strongest impact on euro area economic activity, as reflected in real GDP growth being 5.1% below the baseline level at the end of the scenario horizon (see Table 3.2). A somewhat milder, though non-negligible, real GDP impact is entailed in the first scenario, which would imply a fall in GDP of 2.8% with respect to the baseline, mainly driven by foreign demand. The adverse scenarios already account for the endogenous response of banks to the scenario, as their calibration is based on historical data.[77] The analysis presented in the remainder of this section allows the contribution of the second-round effects due to banks’ endogenous responses to the scenario to be disentangled. The contributions of the second-round effects are reported in Table 3.2 and account for -0.3% and
-0.6% in terms of real GDP deviation from the baseline.[78]
Table 3.2
Overall impact of the two adverse scenarios on euro area macroeconomic variables

Source: ECB.
Notes: The table reports the euro area weighted average deviation from the baseline levels of some macroeconomic variables at the end of the scenario horizon. To calculate the implied decline of credit under the adverse scenario, it is assumed that banks would adjust credit in line with GDP growth in each country of exposure. The baseline growth of credit to the private sector does not reflect the credit growth assumed in the Eurosystem staff macroeconomic projections. This is due to the assumption that credit grows in line with real GDP.
In addition to the real economic impact, the scenarios also differ in terms of their effects on financial markets (see Table 3.3). The first scenario is characterised by the strongest financial shocks. The drop in equity prices would be significant across all euro area countries, reaching on average -36%. The yield curve would steepen by 50 bps on average in the euro area, exhibiting a large cross-country dispersion which would reflect debt sustainability concerns. The second scenario would be characterised by much milder financial shocks whereby stock prices would decline moderately by about 8% and interest rates and government bond yields would also slightly decrease by 12 basis points compared with baseline levels. Corporate bond yields and banks’ credit default swap (CDS) spreads would increase in both scenarios, but more prominently in the second one reflecting a higher credit risk of the non-financial corporation and banking sectors.
Table 3.3
Evolution of financial variables under the adverse scenarios
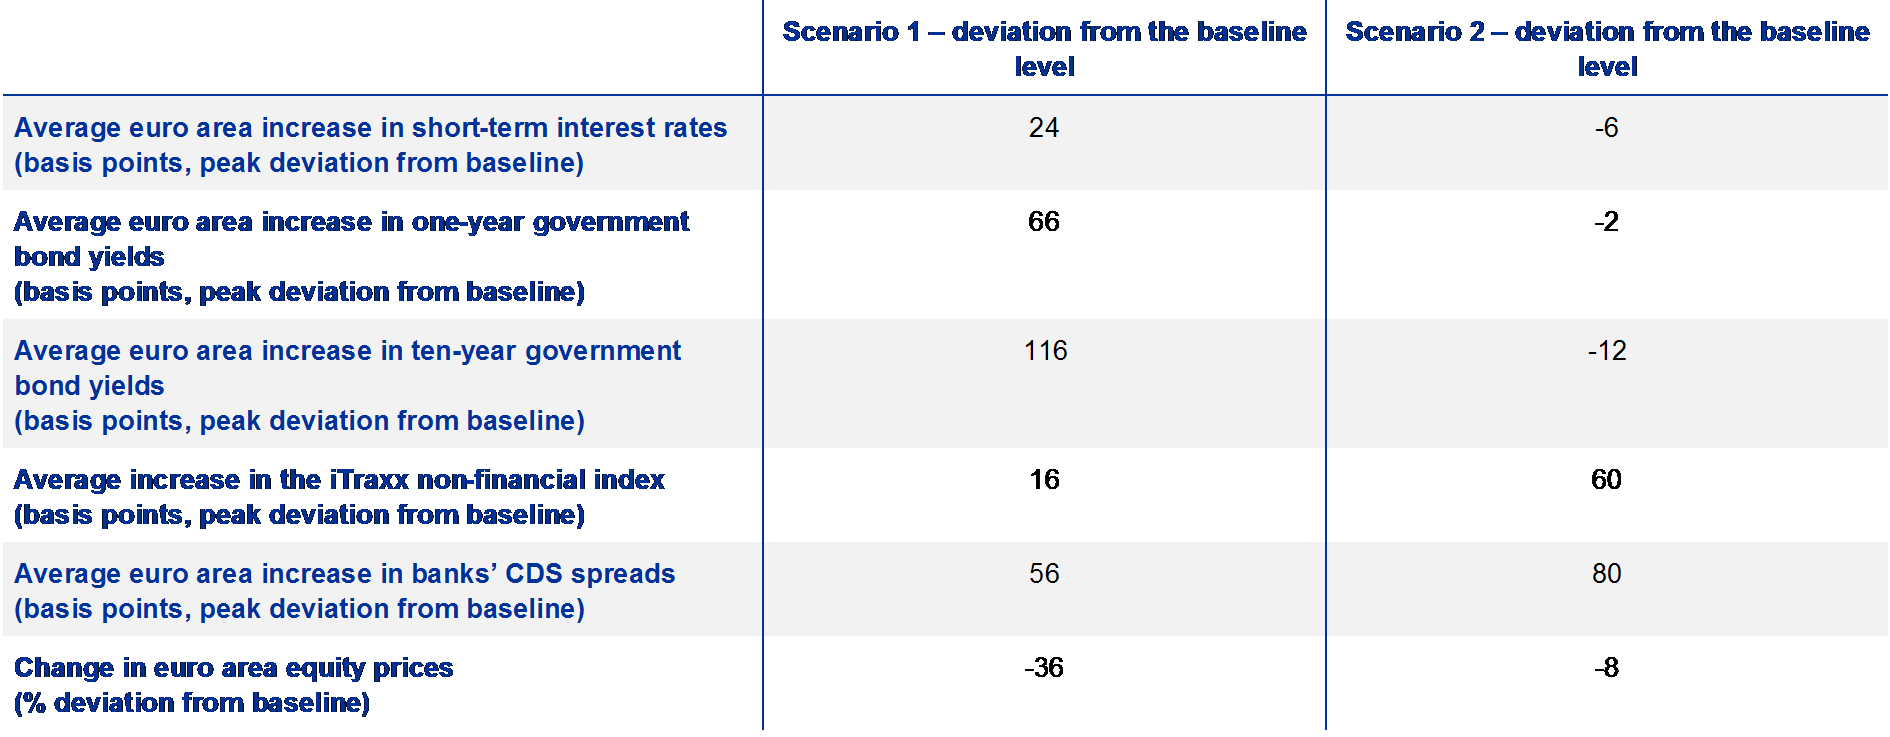
Source: ECB.
Notes: The table reports the euro area weighted average of the shocks (measured as deviations from the baseline levels) in the peak quarter. Some of the effects reported in the table coincide with exogenous shocks which trigger the scenario. The other effects correspond to endogenous responses of these variables to the triggers of the scenario.
Solvency results for euro area banking groups
The scenarios are analysed in terms of their impact on the main drivers of individual banks’ CET1 capital ratios. The main variables that determine banks’ solvency, such as credit and market risk parameters, profits and risk-weighted assets, are projected using bank-level stress-testing models. The scenario analysis covers about 100 large and medium-sized banking groups directly supervised by the ECB. The starting point for the analysis is end-December 2017. The calculations follow to a large extent the EBA methodology for the 2016 EU-wide stress test, even if some assumptions have been relaxed. Notably, the main variables of banks’ balance sheets are projected in the adverse scenario both under the assumption that they remain unchanged (static balance sheet) and that they adjust, reacting to the specific scenario (dynamic balance sheet). The static balance sheet assumption makes it possible to disentangle the effects of a scenario on banks’ solvency, abstracting from individual banks’ endogenous reactions. This assumption is in line with the EBA methodology. However, banks might react to a scenario, for example, by changing their credit exposures, raising capital or restructuring part of their activities. For this reason, results are also presented under the assumption that banks would adjust credit to the private sector in line with real GDP growth in each country of exposure, i.e. applying a dynamic balance sheet assumption. In line with this assumption, caps and floors on the interest rate pass-through have been relaxed to allow for a consistent evaluation of the impact of credit and interest rate developments on net interest income. In addition, the analysis is conducted under the assumption that both fiscal and monetary policy authorities do not endogenously respond to the scenario developments.
Under the baseline scenario, the solvency position of the sample of euro area significant institutions is projected to improve in line with the economic recovery. The aggregate CET1 capital ratio is projected to increase by about 0.3 percentage point, to 14.6% by the end of 2018 (see Chart 3.40). This improvement would be driven by net interest income and net fee and commission income, which would positively contribute 10.2 and 5.2 percentage points, respectively, to the overall increase in the CET1 capital ratio. These positive effects would, however, be partially offset by operating expenses (-11.3 percentage points). The overall positive contribution of operating profits would still outweigh the negative contribution of credit losses by about 0.9 percentage point. In the baseline projections, banks are assumed to adjust their balance sheet positions (dynamic balance sheet assumption) and, in particular, to adjust credit growth in line with GDP growth in each country of exposure. Due to the very positive baseline projections for economic growth, this would imply significant credit growth, which would lead to a negative contribution of risk-weighted assets to the CET1 capital ratio of 0.6 percentage point. Other effects on capital play a marginal role in this setting.
Chart 3.40
Under the baseline scenario, the euro area bank solvency position would continue to improve, but the materialisation of risks could lead to sizeable losses
Average contribution of changes in profits, loan losses and risk-weighted assets to the CET1 capital ratios of euro area banking groups under the baseline and adverse scenarios
(percentages, percentage point contributions)
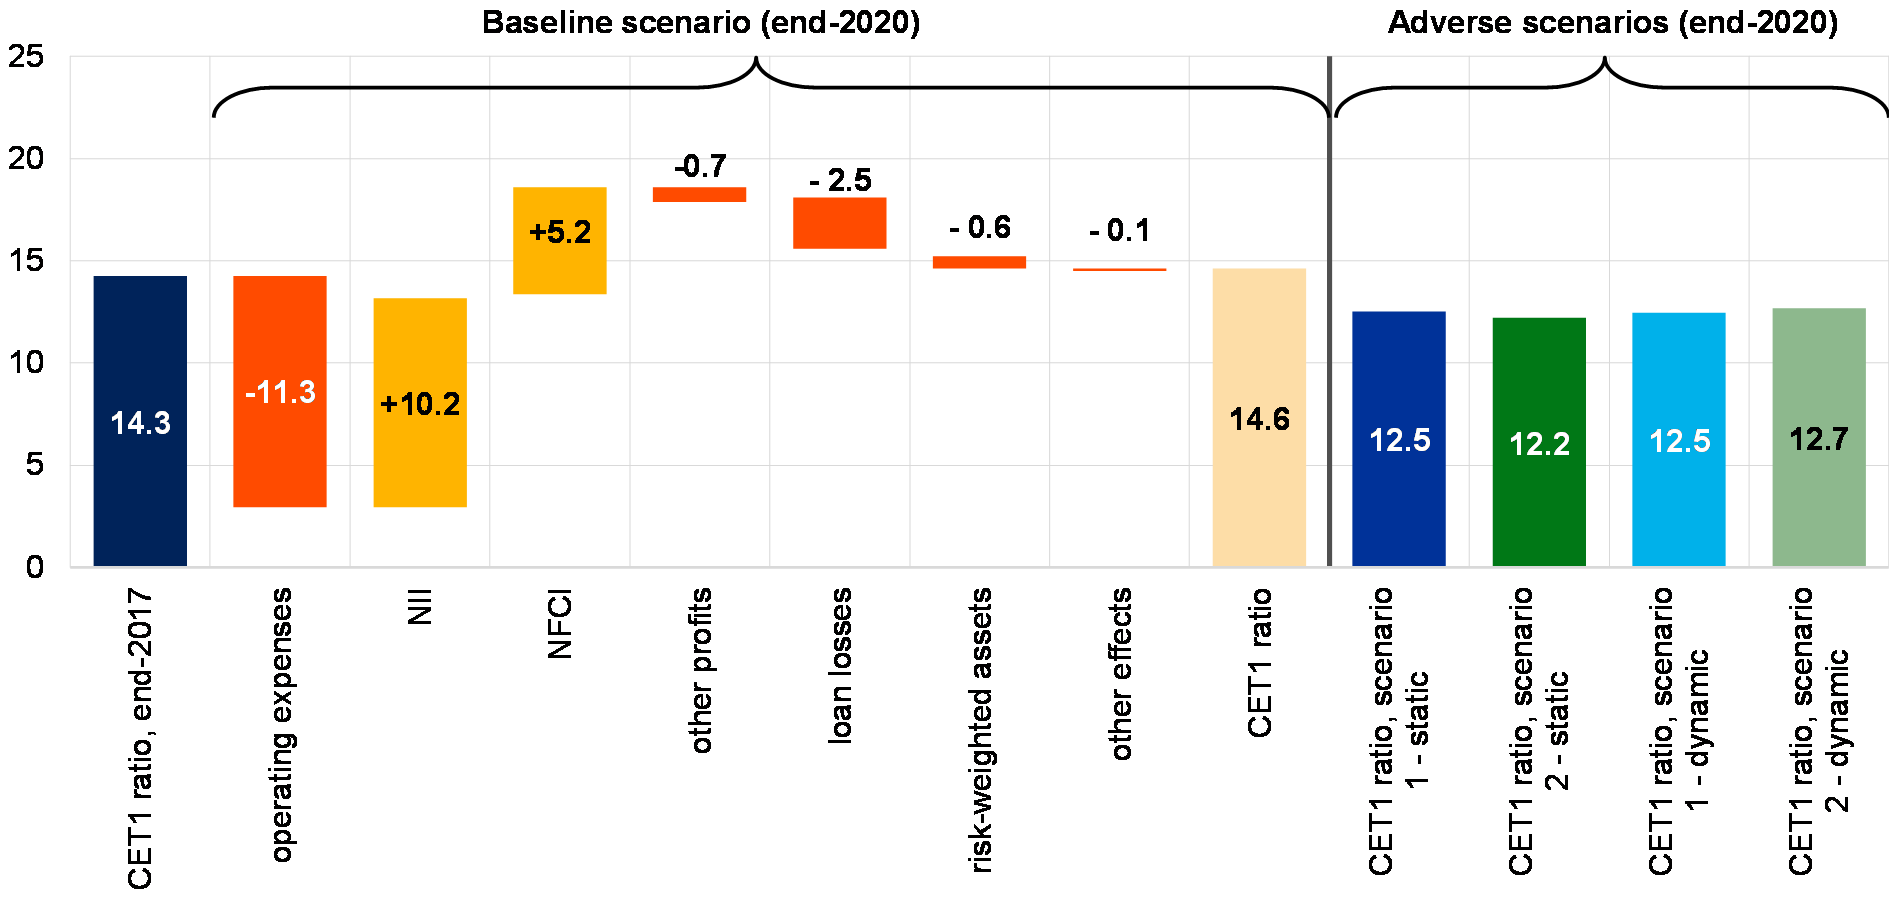
Sources: Individual institutions’ financial reports, EBA, ECB and ECB calculations.
Notes: NII stands for net interest income and NFCI for net fee and commission income. The contribution of operating expenses is independent of the specific scenario as it is calculated in accordance with the 2016 EBA stress-test methodology and thus reflects the average of the previous five years.
In aggregate terms, the euro area banking sector is assessed to be resilient to the materialisation of the main financial stability risks, but could be hit by severe losses. In the two adverse scenarios, the aggregate CET1 ratio would decline by 2.1 and 2.4 percentage points, respectively, compared with the baseline (see Chart 3.40), under the assumption that banks would not adjust their balance sheet in response to the downturn (static balance sheet). Under the assumption of dynamic balance sheets, there are two main countervailing effects on banks’ solvency with regard to the static balance sheet case: on the one hand, the reduction of credit growth with respect to the baseline would reduce risk-weighted assets; on the other hand, net interest income would also decline in line with the exposures. The impact of the overall reduction in credit growth with respect to the baseline appears to dominate, especially in the second scenario where the economic slowdown is stronger. In this case, the CET1 capital ratio would decline by 2.1 and 1.9 percentage points in the first scenario and second scenario, respectively.
Chart 3.41
A very small group of banks would need additional capital under the adverse scenarios
Distribution of banks’ assets by CET1 capital ratio
(percentages)
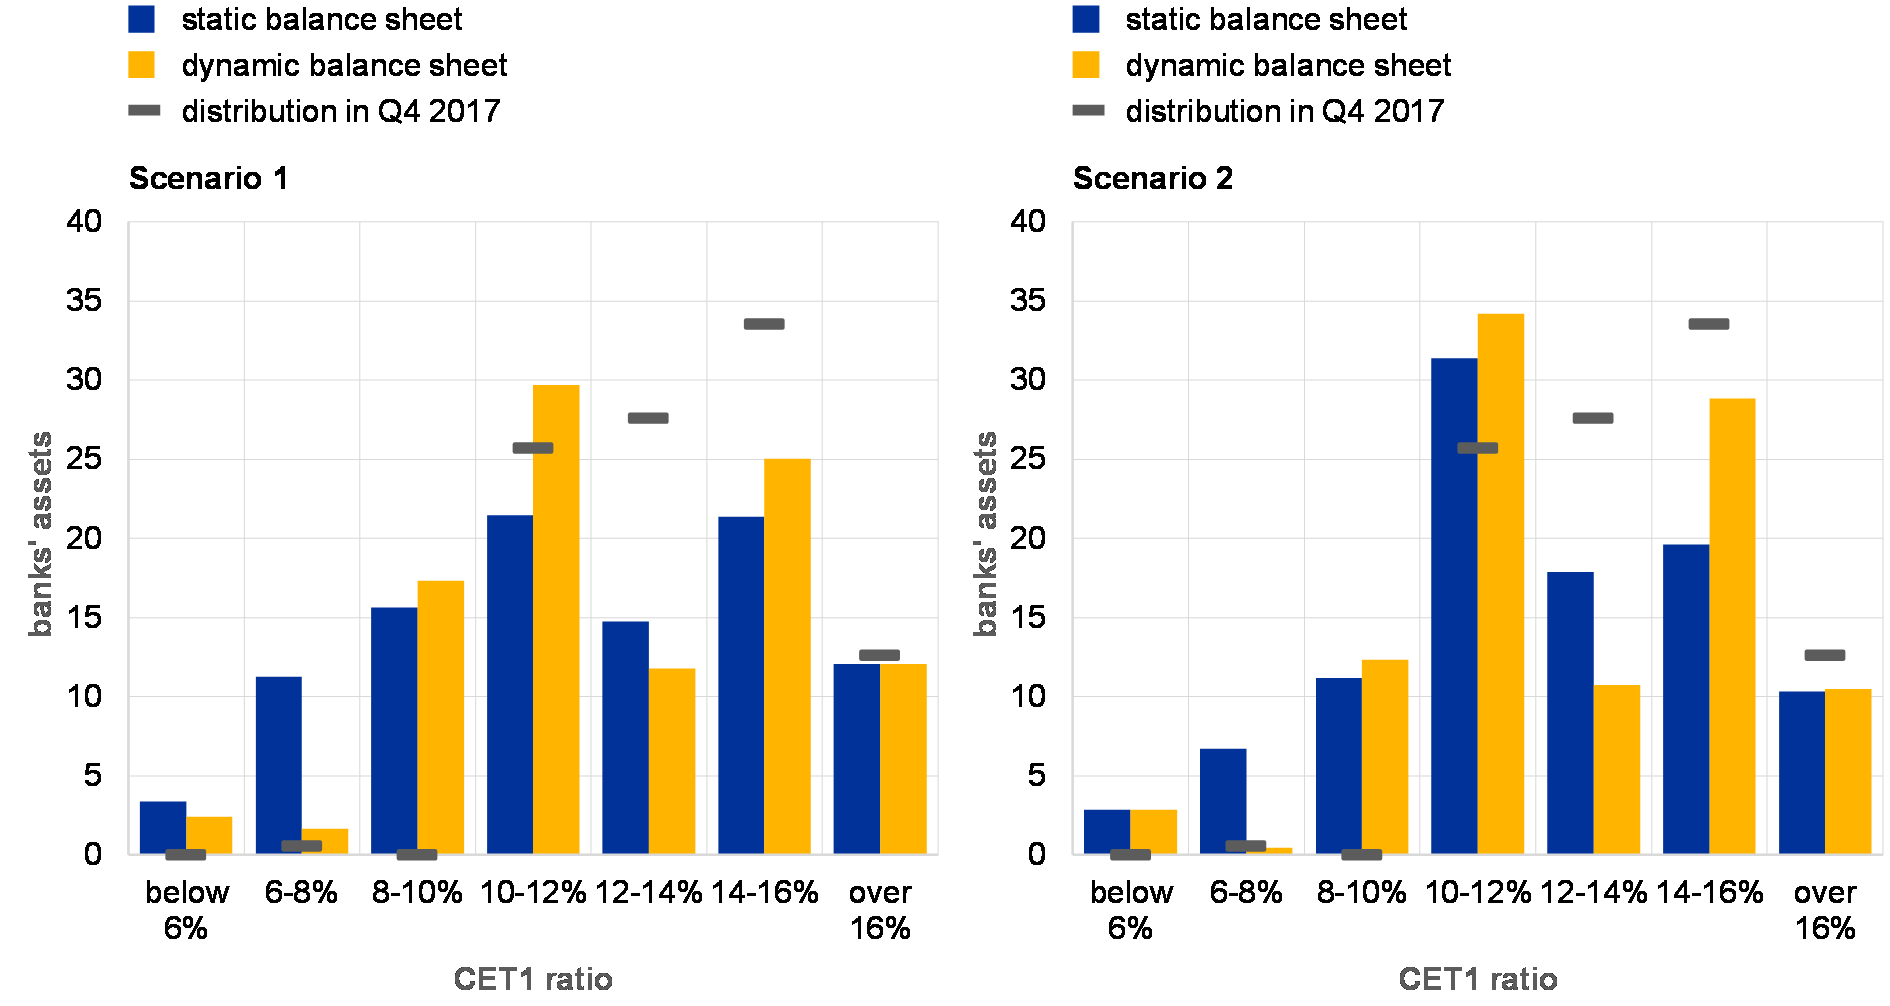
Source: ECB calculations.
The majority of euro area significant institutions would maintain their CET1 capital ratio above the average capital requirements of 10% under the adverse scenarios.[79] Nevertheless, under the static balance sheet assumption, banks representing about 30% and 20% of total assets would fall below the 10% CET1 capital ratio level under first scenario and second scenario, respectively (see Chart 3.41). These shares would be reduced to 20% and 15% when assuming a dynamic balance sheet. Only a few small banks would face severe solvency difficulties under the adverse scenarios, falling below a 6% CET1 ratio.
Different segments of the banking sector would be hit by the two scenarios asymmetrically and reflecting the composition of their lending book and portfolios (see Chart 3.42). [80] Under the first scenario, G-SIBs experience the largest decline in their CET1 ratios with respect to the baseline (-238 bps). These banks have larger trading portfolios than other banks and, for this reason, the decline in the CET1 ratio in both scenarios would be driven by severe losses on the sovereign exposures in the available-for-sale (AFS) portfolio, which is reflected in the revaluation of securities (-78 bps). In addition, the strong repricing of risk premia in the first scenario would also lead to losses in net trading income, which is included in the “Other effects” category. This would be partially netted out by the effects on the risk-weighted assets also included in the “Other effects” category (about -47 bps). Credit losses would also contribute significantly to the capital depletion (-103 and
-111 bps in the first scenario and second scenario, respectively). Banking groups classified as diversified lenders would be strongly hit by both credit losses and the AFS losses on sovereign exposures. The latter component drives the negative contribution of the revaluation of securities in the first scenario (-100 bps). The contribution of credit losses to the CET1 ratio depletion with respect to the baseline ranges from -106 bps in the first scenario to -195 bps in the second scenario. In addition, these banking groups are those suffering the most severe net interest income losses in both scenarios (-50 and -94 bps, respectively), but also exhibit the largest offsetting effects from the reduction in RWAs – captured under the “Other effects” category.[81] Retail lenders are strongly affected by credit losses, which contribute between -117 and -177 bps to the difference of the CET1 ratio with respect to the baseline. The losses on the AFS sovereign portfolio would significantly contribute to the decline in the CET1 ratio in the first scenario, driving the revaluation of securities by -119 bps. Finally, specialised lenders and universal banks would be the banking groups less affected by the adverse scenarios, with capital depletion between 134 and 163 bps, and would present a more homogenous distribution of the different factors contributing to the decline of the CET1 ratio.
Chart 3.42
Impact on the CET1 ratio explained by the variation of the main P&L elements
Contributions to changes in CET1 capital ratios compared with the baseline by group of banks under the dynamic balance sheet assumption for scenario 1 (left panel) and scenario 2 (right panel)
(basis points)
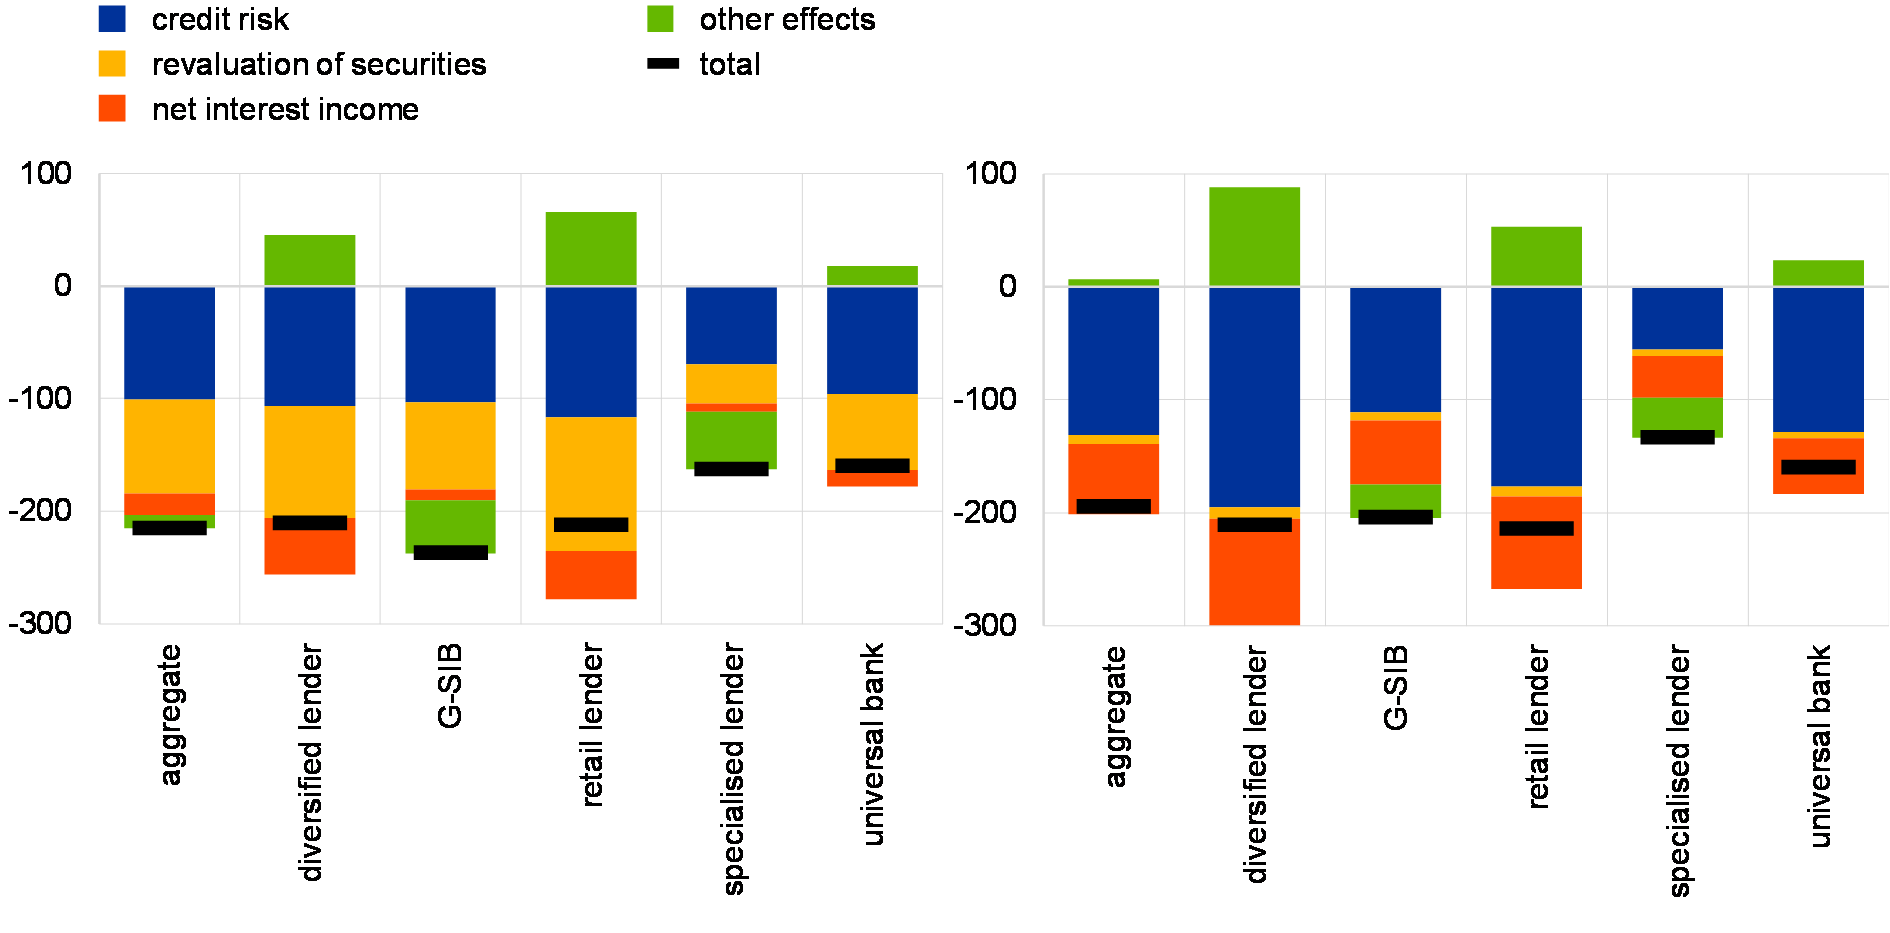
Source: ECB calculations.
Notes: Credit risk includes additional impairments on loans and the increase in risk exposure amounts. Revaluation of securities includes sovereign debt and other securities held as available for sale and designated at fair value through profit and loss. These effects are gross of tax and prudential filters. Other effects mainly include trading income, changes in risk-weighted assets, fee and commission income, operational risk, taxes and dividends. The black lines indicate the total change in the CET1 ratio.
The cost of credit risk would increase in both adverse scenarios with respect to the baseline. Credit losses would play a larger role in explaining the capital depletion in the second scenario, where GDP declines almost twice as much as in the first scenario (see Chart 3.42). Higher impairment provisions on loans are one of the largest contributing factors to the reduction in the aggregate CET1 capital ratio, declining by between 1.0 and 1.3 percentage points compared with the baseline result under the first scenario and second scenario, respectively. These provisions would be highest in the second scenario, reflecting the relative size of the shocks to the real economy. Aggregate credit losses would increase by between 50% and 60% with respect to the baseline in both scenarios (see Chart 3.43). The distribution of NPLs in the lending book would change significantly between the two scenarios. In the first scenario, NPLs in credit to institutions would more than double due to the substantial increase of long-term interest rates and the decline of stock prices. However, this would not imply a substantial increase in absolute terms and consequently would not likely lead to intra-financial contagion effects. In the second scenario, credit losses would be more concentrated in corporate and retail lending, especially if related to real estate activity.
Chart 3.43
The stock of NPLs increases by about 50% under both scenarios
Increase of NPLs with respect to the baseline by sector of exposures
(percentages)
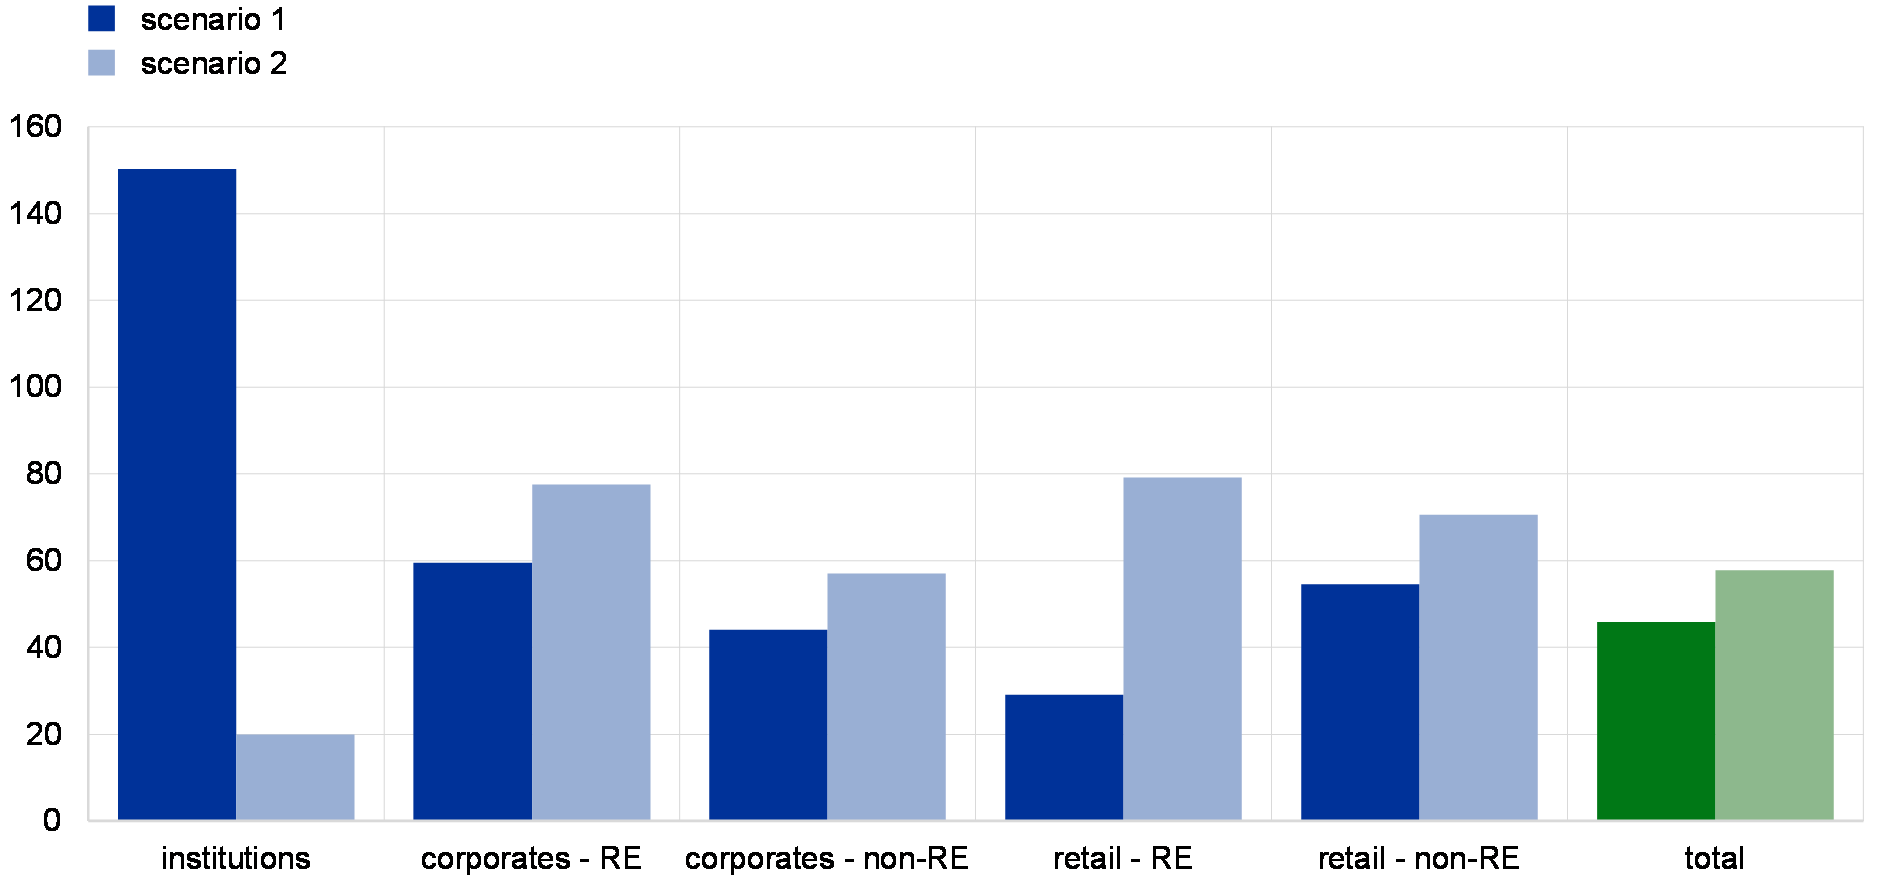
Source: ECB calculations.
Notes: “Institutions” indicates exposures towards other MFIs. RE stands for real estate. Although the increase in NPLs for institutions is very high in terms of percentage changes, in absolute terms the exposures towards other MFIs are much lower than other exposures at the aggregate level.
Net interest income would contract under both adverse scenarios, but most prominently in the second scenario. The decline of net interest income would contribute 0.6 percentage point to the drop in the CET1 capital ratio with respect to the baseline in the second scenario. This would reflect high banking sector funding cost shocks and foregone interest due to higher credit default rates and the low degree of steepening of the yield curve. Weaker effects on net interest income are observed under the first scenario, where net interest income falls by about 0.2 percentage point compared with the baseline.
Losses on securities would be an important factor under the first scenario. The impact of losses on securities on the CET1 capital ratio would be on average 0.8 percentage point in the first scenario. The losses on sovereign exposures held in the AFS portfolios drive the negative contribution of the revaluation of securities. Severe losses would also materialise in net trading income in both scenarios and are included in the “Other effects” category. At the aggregate level, the negative impact on the CET1 capital ratio of losses in net trading income would be to a large extent offset by the positive contribution of risk-weighted assets, which is also included in the “Other effects” category (see Chart 3.42). The impact of the revaluation of securities in the second scenario would be negligible as this scenario is characterised by very mild asset price declines.
4 Regulatory framework

Banking reform
A package of reforms to finalise the Basel III Accord was agreed in December 2017. The Basel III finalisation package agreed by the Governors and Heads of Supervision (GHOS) of the Basel Committee on Banking Supervision (BCBS) aims at reducing unwarranted risk weight variability and maintaining risk sensitivity. It thereby also upholds the GHOS commitment to avoid a significant overall increase in capital requirements. Completing Basel III is an important step towards restoring confidence in banks' risk-weighted capital ratios, which in turn will foster confidence in the banking sector more broadly.
A full and timely implementation of the Basel III package across all jurisdictions is key to financial stability. The high level of international cooperation that has characterised the post-crisis work on a global set of common standards should also apply in the implementation phase. Moreover, the process should be carefully monitored through comprehensive evidence-based evaluation.
The European Commission has put forward a comprehensive package of banking regulation reforms. The package, which was published on 23 November 2016, will implement in European legislation important elements of the global regulatory reform agenda, such as new global standards on bank capital adequacy and liquidity and other outstanding elements. The details of the package were looked at in the May and November 2017 issues of the FSR, and discussions on the package are ongoing in the Council of the European Union and in the European Parliament.
The ECB has contributed to deliberations on the package by publishing a related ECB Opinion.[82] EU co-legislators are invited to consider the positions put forward in this Opinion in their trialogues. In particular, they should consider introducing a requirement to establish an intermediate EU parent undertaking (IPU) for third-country groups with large operations in the EU and, to prevent regulatory arbitrage opportunities, require the inclusion of third-country branches in the regulatory EU sub-group under the IPU. Otherwise, third-country groups could partially or fully circumvent the IPU requirement by operating in the EU primarily or entirely via branches. Furthermore, once the Banking Union becomes sufficiently mature, more progress might be achieved in the harmonisation of national options and discretions as well as the introduction of cross-border capital waivers, subject to additional safeguards such as those suggested by the ECB in its Opinion.
With the aim of helping banks finance their lending activities, the European Commission has published a legislative proposal for an EU framework on covered bonds. The initiative is part of a broader Capital Markets Union (CMU) Action Plan launched in 2015 and revised in 2017[83] to strengthen capital markets and investment in the EU.
Macroprudential review
The European Commission’s package on the CRR/CRD IV review includes a number of proposals on the Pillar 2 framework that are also relevant from a macroprudential policy perspective. Notably, the package clarifies that Pillar 2 requirements (P2R) should be implemented by microprudential authorities and not be used for macroprudential purposes. The removal of Pillar 2 from the macroprudential toolkit should be accompanied by targeted revisions of the macroprudential framework to ensure that authorities have all the necessary tools to address existing and emerging systemic risks.[84]
EU co-legislators should agree on an ambitious set of targeted changes in the EU macroprudential framework, in the context of the CRR/CRD IV review. While a broad review of the framework is not foreseen in the short-term, a comprehensive review of the regulatory setup is necessary over the medium term, with the aim of making the current framework more coherent, consistent and operational. Given the uncertainty about the impact of individual measures, there is a need for an appropriate mix of tools, which can include both borrower-based measures, such as limits on loan-to-value or debt-to-income ratios, and tighter risk weights for bank exposures and capital requirements. Some of these instruments are not provided for in the CRD IV/CRR, but the review should give consideration to enlarging the set of macroprudential policy tools and simplifying the procedure for activating the macroprudential tools provided for in Article 458 of the CRR, thereby allowing macroprudential authorities to act in an efficient, effective and timely manner.
As regards the ongoing review of the European Supervisory Authorities (ESAs) and the ESRB, the ECB supports efforts aimed at fostering effective and consistent prudential supervision and regulation across Europe. In response to the package of proposals published by the European Commission to strengthen the European System of Financial Supervision (ESFS), the ECB published its opinions on the ESRB and the EBA in March and April, respectively.[85]
The review of the ESRB is of particular importance from a macroprudential perspective. Since its inception, the ESRB has played a central and successful role in preventing and mitigating systemic risks to financial stability in the Union. The ECB therefore supports a limited number of targeted changes to the ESRB’s governance and operational framework proposed by the European Commission. A case in point relates to the formalisation of ECB Banking Supervision participation in the ESRB’s General Board, Steering Committee and Advisory Technical Committee. However, the ECB would support further efforts to avoid overlaps between the ESRB and the ECB by reaping the synergies of the ECB’s role in risk assessment with respect to the euro area banking sector.
Crisis management and resolution of banks
The comprehensive package of banking regulation reforms includes revisions to the Union crisis management framework. The proposed changes are particularly aimed at implementing international standards for global systemically important institutions (G-SIIs).[86] In the related Opinion, the ECB presents its views on several amendments to MREL and on the need for transitional arrangements for MREL. The Opinion also includes concrete suggestions for removing the overlap between supervisory measures under the CRD and the SSM Regulation and the early intervention measures provided for in the BRRD, as it creates significant practical challenges.
A swift adoption of the revised framework is warranted, in order to enable risk reduction and risk sharing to move in parallel and to facilitate the completion of the Banking Union. It is important that the European Stability Mechanism (ESM) becomes a credible backstop to the SRF, covering solvency as well as liquidity support in resolution. Equally important is the setting up of the EDIS, which is necessary in order to align responsibility for and control of deposit insurance with supervision and resolution responsibilities and to ensure that deposits enjoy an equally high level of confidence throughout the euro area.
Initiatives have also been launched in the crisis management and resolution domain at the international level. The FSB has published consultations on the Funding Strategy Elements of an Implementable Resolution Plan and on Principles on Bail-in Execution. [87],[88] The main purposes of the principles are (i) to aid the development of an implementable resolution funding plan to support the ongoing work of authorities to operationalise resolution strategies and plans; and (ii) to identify actions that authorities should take as part of ex ante resolution planning to ensure that a bail-in can be implemented in a manner that is credible, timely, consistent across home and host jurisdictions, and transparent to market participants. Following the consultation, both FSB guidelines are expected to be published in the summer of this year. Authorities should subsequently make use of these FSB guidelines, as they have been developed to support the orderly resolution of G-SIBs and are important in order to achieve a level playing field at a global level.
The European Commission’s package of measures to tackle high NPL ratios was published on 14 March 2018.[89] The package includes a proposal for a directive on credit servicers, credit purchasers and the recovery of collateral which would remove legal impediments to the transfer of NPLs by banks to non-banks, including simplification of the licensing requirements for third-party loan servicers, a proposal for a regulation amending the CRR which would introduce minimum levels of provisioning for future NPLs directly in the applicable regulation, and a blueprint on the setting up of national asset management companies (AMCs). The ECB supports swift progress on the legislative proposals contained in the package which are key elements of the EU’s Action plan to tackles NPLs.[90]
Asset managers
IOSCO is currently operationalising the FSB recommendations to address risks associated with asset management activities. The FSB recommendations focus mainly on addressing vulnerabilities related to (i) the mismatch between the liquidity of fund investments and the redemption terms and conditions for fund units, and (ii) leverage within investment funds.[91] On 1 February 2018 IOSCO published its final report which is primarily addressed to asset managers.[92] As highlighted in the FSB recommendations, responsible authorities should have an important role in addressing structural vulnerabilities in the asset management sector and in providing further guidance on liquidity risk management.
The ESRB has also published recommendations addressing systemic risks related to liquidity mismatches and the use of leverage in investment funds.[93] The ESRB advocates the introduction of additional liquidity management tools, further supervisory requirements and tighter liquidity stress testing practices to address risks from liquidity mismatches. The ESRB also considers it important to operationalise macroprudential limits on leverage in order to address risks arising from excessive leverage in the investment funds sector.
The European Commission has published a legislative proposal for the prudential regulation of all investment firms. The proposal published on 20 December 2017 is aimed at addressing problems in the investment firm regulation by introducing more appropriate and risk-sensitive requirements for investment firms and a streamlined regulatory toolkit. Under the proposals put forward by the Commission, the vast majority of investment firms in the EU would no longer be subject to rules that were originally designed for banks. At the same time, by amending the definition of what is considered a “credit institution” in the CRR, the largest and most systemic investment firms would be subject to the same regulatory regime as European banks and to ECB supervision.
In view of the growing importance of non-bank financial intermediation, large and complex investment firms should fall under the same regulation and supervision as credit institutions. To prevent risks to EU financial stability, this particularly concerns large and complex investment firms with cross-border operations and those undertaking bank-like activities.
Regulatory initiatives for the insurance sector
EIOPA has published two sets of advice to the European Commission on the Solvency Capital Requirement (SCR) standard formula. The main goal of the advice is to reduce the complexity of the formula while retaining a proportionate, technically robust, risk-sensitive and consistent supervisory regime for the insurance sector. The review of the SCR standard formula, as part of the Solvency II review, should be finalised by December 2018.
EIOPA and, at international level, the International Association of Insurance Supervisors (IAIS) have initiated work on systemic risk and macroprudential policy in insurance. Specifically, EIOPA initiated the publication of a series of papers with the aim of (i) contributing to the discussion on ways in which systemic risk can be created or amplified and (ii) ensuring that any extension of this debate to the insurance sector reflects the specific nature of the insurance business. To this end, EIOPA published a first report which aims to identify and analyse the sources of systemic risk in insurance from a conceptual point of view.[94] At the same time, the IAIS is developing an activities-based approach to systemic risk in the insurance sector.
Financial market infrastructures (FMIs)
The term FMI typically refers to payment systems/instruments (PSs), central counterparties (CCPs), central securities depositories (CSDs), securities settlement systems (SSSs) and trade repositories (TRs).
Payment services
The revised Payment Services Directive (PSD2)[95] enhances the security of payment transactions and the protection of consumer data and supports innovation and competition in retail payments. EU Member States had to transpose PSD2 into national law by 13 January 2018. The main objectives of PSD2 are to contribute to a more integrated and efficient European payments market, to improve the level playing field for payment service providers by including new types of services, to make payments safer and more secure and to enhance the protection of European consumers and businesses.
Supplementary technical standards and EBA Guidelines foster financial stability through harmonised, efficient and transparent requirements for the licensing and ongoing supervision of payment services and complement the PSD2 through detailed operational and security related requirements.[96]
Central securities depositories (CSDs)
According to the new regulatory framework, the Central Securities Depositories Regulation (CSDR)[97], all EU CSDs need to undergo an authorisation process. CSDs had to submit their application for authorisation to the relevant competent authority by the end of September 2017.
The Eurosystem, as the central bank of issue for the euro, is to be consulted in the authorisation process. The Eurosystem assesses each CSD on aspects relevant for the smooth functioning of other market infrastructures, the implementation of its credit operations, public confidence in the currency and, more generally, financial stability in the euro area. More specifically, the Eurosystem assessment covers the CSD’s settlement process in euro, securities safekeeping processes, default procedures, operational set-up and legal soundness and the general conduct of business. For CSDs that also provide banking type ancillary services, the Eurosystem assesses whether the associated credit and liquidity risks are adequately managed. The first two CSDs authorised under the CSDR were Nasdaq CSD and VP Securities in September and December 2017 respectively. The authorisation of other CSDs is ongoing.
Fintech
The European Commission has published a FinTech action plan.[98] The action plan, which was unveiled on 8 March 2018, aims to foster innovation in the financial industry and EU-wide provision of financial services by improving the clarity of the regulatory framework and promoting harmonisation of national approaches consistent with the goal of a capital markets union (CMU). It was accompanied by a legislative proposal on crowdfunding which is also part of the broader CMU initiative. The EBA also published a “FinTech Roadmap”[99] on 15 March, in line with with the European Commission’s FinTech Action Plan.
The European Commission’s decision to foster innovation and cross-border crowdfunding as well as more coordinated approaches to standards for fintech by liaising and working with major standard-setting bodies is welcome. Interoperability of evolving fintech solutions with competing incumbent systems is particularly important in the area of financial market infrastructures and payment systems. The ECB is committed to working with other authorities and market stakeholders to avoid fragmentation and foster integration of the EU financial system.[100] The adoption of innovative technologies and new business models should progress without compromising the rigour of prudential requirements, as the benefits, risks and challenges of fintech innovation have yet to be fully understood and assessed. The proposed legislation on crowdfunding should enable cross-border scaling of crowdfunding services while ensuring sustainable financial intermediation.
Crypto-assets
G20 Finance Ministers and Central Bank Governors have called on international standard-setting bodies (SSBs) to continue their monitoring of crypto-assets and related risks and to assess multilateral responses. The FSB has been tasked to report in July 2018 on its work on crypto-assets in consultation with other SSBs, including the Committee on Payments and Market Infrastructures (CPMI) and IOSCO, and the Financial Action Task Force. In February 2018 concerns about emerging price bubbles in the crypto-assets market and the rapid growth of initial coin offerings (ICOs) prompted the ESAs to publish a series of regulatory warnings to consumers on the risks of crypto-assets and ICOs. At the European level, the Commission’s plan to continue monitoring developments in the area of crypto-assets and ICOs is useful in order to assess whether regulatory action at EU level is required.[101]
The ECB supports continued rigorous monitoring of and more comprehensive data collection on crypto-assets, given their rapidly evolving nature. Financial stability concerns currently appear limited (see Box 4). Nevertheless, the transmission channels to the financial sector, such as through financial institutions’ exposure to crypto-assets, market infrastructures and payment systems, as well as wealth effects might develop rapidly. In this respect, a proactive forward-looking approach is also warranted from a financial stability perspective, including reviews of the prudential treatment of such assets and consideration of measures to protect market integrity and financial market infrastructures.
Cybersecurity
Cyber threats have become a key financial stability concern with the increased adoption of technologies in the financial sector and a rising level of technical interconnectedness in financial markets. Cyber threats are a type of operational risk that has become increasingly prominent in the past few years. A cyber incident can jeopardise the confidentiality, integrity or availability of information in a given system, such as a computer network or an infrastructure. Cybersecurity consists of measures to prevent and counteract such incidents.
A cyber incident could trigger a systemic event if it impacts a significant financial institution or an FMI or is propagated to a large number of market participants. Increased interconnectedness and digitalisation increase the vulnerability of financial market participants to cyber incidents. The channels through which a cyber incident could develop into a systemic event include a potentially large disruption of central services or a loss of confidence in financial markets.[102]
Reaping the full benefits from digital innovation requires strong resilience against cyber threats at individual and collective levels. Institutions need to ensure that sound cyber risk management is in place and fully integrated in the institution-wide operational risk management framework. The Cyber Resilience Oversight Expectations for FMIs launched by the ECB in April provide further insight into how these frameworks can be strengthened.[103] Furthermore, financial institutions can perform Threat-Intelligence Based Ethical Red teaming (TIBER-EU) tests, which mimic the real life tactics, techniques and procedures of attackers and allow financial institutions to assess their protection, detection and response capabilities.[104] At a collective level, institutions and relevant stakeholders need to work closely together to enhance individual entity and sector capabilities, as well as to increase cyber awareness. Owing to the global nature of the phenomenon, international cooperation and coordination between institutions and authorities is essential.[105]
Sustainable finance
The European Commission has published an Action Plan on financing sustainable growth.[106] The Action Plan, which was published on 8 March 2018, is part of the broader CMU initiative to build deeper and more integrated capital markets and sets out an EU strategy to integrate sustainability into financial decision-making. It contains a roadmap which envisages ten actions to be completed by the end of 2019, starting with a proposal for a regulation with principles and scope for an EU taxonomy for sustainable activities in May 2018.
The Commission’s proposal to integrate sustainability into financial decision making is welcome, but this should be done without compromising on prudential regulation standards. Climate-related risks stemming from the increasing severity and frequency of natural catastrophes as well as the transition to a low-carbon economy may have a significant impact on financial stability. However, prudential regulation should not be used to attract capital towards green assets in the absence of any evidence of lower riskiness of such assets. Instead, direct policy tools such as taxes or subsidies may be more effective.
Special features
A new Financial Stability Risk Index (FSRI) to predict near term risks of recessions
The real economy repercussions of financial crises are the ultimate focus of financial stability monitoring and policymakers. By extending a standard set of financial stability indicators with indicators capturing spillover and contagion risks, this special feature proposes a financial stability risk index (FSRI) that has predictive power for the near-term risk of deep recessions. It is shown that the empirical performance of the index benefits from combining a large set of macro-financial indicators and, notably, that the information content of the spillover and contagion risk indicators is important.
MorePredicting the likelihood and severity of financial crises over the medium term with a Cyclical Systemic Risk Indicator (CSRI)
This special feature presents a tractable, transparent and broad-based cyclical systemic risk indicator (CSRI) that captures risks stemming from domestic credit, real estate markets, asset prices, external imbalances and cross-country spillovers. The CSRI increases on average several years before the onset of systemic financial crises and its level is highly correlated with measures of crisis severity. Model estimates suggest that high values of the CSRI contain information about large declines in real GDP growth three to four years down the road, as it precedes shifts in the entire distribution of future real GDP growth and especially of its left tail. Given its timely signals, the CSRI is a useful analytical tool for macroprudential policymakers to complement other existing analytical tools.
MoreThe distribution of interest rate risk in the euro area
This special feature analyses the distribution of interest rate risk in the euro area economy using balance sheet data and information on derivatives positions from significant credit institutions. On aggregate, banks’ interest rate risk exposure is small relative to their loss absorption capacity, but exposure varies across institutions. This variation is driven by loan rate fixation practices at country level. Banks use derivatives for hedging, but retain residual interest rate risk exposures. In fixed-rate countries the main vulnerability to rising interest rates lies with the banks that have the greatest interest rate risk, while households would be directly affected in countries with predominantly variable-rate loans. In the latter case, increased loan servicing costs due to rising interest rates could affect banks through lower asset quality.
More© European Central Bank, 2018
Postal address 60640 Frankfurt am Main, Germany
Telephone +49 69 1344 0
Website www.ecb.europa.eu
All rights reserved. Reproduction for educational and non-commercial purposes is permitted provided that the source is acknowledged.
The cut-off date for data included in this report was 15 May 2018.
For specific terminology please refer to the ECB glossary.
pdf ISSN 1830-2025, QB-XU-18-001-EN-N
html ISSN 1830-2025, QB-XU-18-001-EN-Q
- See the special feature entitled “Higher future financial market volatility: potential triggers and amplifiers”, Financial Stability Review, ECB, November 2017.
- See the box entitled “Preparing for Brexit to secure the smooth provision of financial services to the euro area economy”, Financial Stability Review, ECB, May 2017.
- Owing to methodological, scenario and sample differences, the results presented in this chapter should not be compared with the results of supervisory stress-test exercises, such as those coordinated by the European Banking Authority (EBA) and ECB Banking Supervision.
- Under the assumption that banks would adjust their balance sheet in response to the baseline and adverse scenarios (dynamic balance sheet).
- The 10% average requirement refers to the average total capital “supervisory demand” without systemic buffers (i.e. Pillar 1, Pillar 2 and capital conservation buffer); see the SSM SREP Methodology Booklet – 2017 edition, ECB Banking Supervision, 2017.
- See Recommendation of the European Systemic Risk Board of 31 October 2016 on closing real estate data gaps (ESRB/2016/14).
- See Addendum to the ECB Guidance to banks on non-performing loans: supervisory expectations for prudential provisioning of non-performing exposures, ECB Banking Supervision, March 2018.
- See Opinion of the European Central Bank of 8 November 2017 on amendments to the Union framework for capital requirements of credit institutions and investment firms (CON/2017/46).
- For more details, see the panel contribution by Benoît Cœuré, member of the Executive Board of the ECB, at the 29th workshop on “The Outlook for the Economy and Finance”, Villa d’Este, Cernobbio, 6 April 2018, and Quaglietti, L., “Implications of rising trade tensions for the global economy”, Economic Bulletin, ECB, Issue 3, Box 1, 2018.
- The aggregate SRISK measure includes 31 large banks from China and Hong Kong and therefore may underestimate the risks stemming from the large number of small to medium sized banks. As most banks in this aggregate are backed by the Chinese government, an elevated level of SRISK translates into higher sovereign risk – which might in turn spill back to the financial sector.
- The dynamics of the correlation coefficient need to be put into perspective, as correlations are driven by the prevailing levels of volatility – see Forbes, K. and Rigobon, R., “No Contagion, Only Interdependence: Measuring Stock Market Comovements”, Journal of Finance, Vol. 57(5), October 2002, pp. 2223-61.
- Commercial real estate refers to already developed income-producing real estate and includes office, retail, logistics and multi-dwelling residential property.
- “Dominant” means that in a specific country most of the companies included in the benchmark FTSE EPRA/NAREIT index are REITs. In the mid-1990s REIT regimes only existed in two euro area countries (Belgium and the Netherlands) and they began to expand across more countries only after 2007. Currently, specific national REIT legislation exists in ten euro area countries.
- The VIX index measures the expected volatility of the S&P 500 over the next 30 days and is a widely used barometer of market uncertainty. Its level is derived from puts and calls on the S&P 500 over a wide range of strike prices. While the VIX index is not directly tradable, the volatility measured by the index can be replicated with a portfolio of options on the underlying S&P 500 index.
- When the VIX rises, both levered long volatility and inverse volatility ETPs are required to buy VIX futures to maintain a target ratio of equity to futures notional. Long volatility funds need to buy more futures notional as the equity value increases, while inverse volatility funds need to do the same to reduce their net short position. See “Volatility is back”, BIS Quarterly Review, March 2018.
- Such risks are discussed in more depth in Andersson, M., Hermans, L. and Kostka, T., “Higher future financial market volatility: potential triggers and amplifiers”, Financial Stability Review, ECB, November 2017, pp. 172-182.
- A regime-switching autoregressive conditional heteroscedasticity (SWARCH) model is employed, as originally proposed in Hamilton, J.D. and Susmel, R., “Autoregressive conditional heteroskedasticity and changes in regime”, Journal of Econometrics, Vol. 64, 1994, pp. 307-333. In the conditional variance part, the model allows for three different regime levels and includes a leverage effect. The model errors are assumed to come from a Student’s t-distribution.
- See, for example, Dueker, M.J., “Markov Switching in GARCH Processes and Mean-Reverting Stock-Market Volatility”, Journal of Business & Economic Statistics, Vol. 15, No 1, 1997, pp. 26-34.
- Delta hedging the exposure to short positions in call options on the VIX requires the purchase of an increasingly large amount of the underlying as options move closer to being in-the-money. This increases the price of VIX futures, the delta hedging ratio and the amount of notional that needs to be purchased.
- See also “Assessment of quantitative easing and challenges of policy normalisation”, speech by Peter Praet, Member of the Executive Board of the ECB, at “The ECB and Its Watchers XIX Conference”, Frankfurt am Main, 14 March 2018.
- Crypto-assets use distributed ledger technology, which allows decentralised recording of transactions and holdings, keeping a repeated digital copy of data at multiple locations.
- The top 10,000 addresses (0.05% of the total) hold 56% of all bitcoins, while the top 1,000 addresses (0.005% of the total) hold around 35% (source: BitInfoCharts, retrieved on 15 May 2018). Moreover, these figures represent a lower bound on concentration, given that it is possible for the same investor to have multiple addresses.
- The warning can be found on the European Securities and Markets Authority (ESMA) website.
- Estimates of the gross issuance of leverage loans differ across commercial data providers. See footnote 14 in Box 5.
- While there is a general understanding that a leveraged loan is a secured loan granted to a highly indebted (levered) company, there is no generally agreed definition. The industry defines leveraged loans as secured loans where the borrower is sub-investment-grade or the spread at issuance is higher than a certain threshold.
- The actual size of the market is likely to be even greater, as an increasing share of the leveraged loan market is accounted for by direct lending, a private, bilateral type of leveraged loan transaction where financing is provided by non-banks. Such loans are likely to be only partially captured by existing data sources.
- The lower estimate of the gross issuance in the primary market is based on market data sources which capture refinancing via a repayment of the loan to existing investors followed by a re-syndication of the loan to new investors. The upper estimate also captures refinancing of leveraged loans carried out via amendments that change the pricing of the loans to existing investors. All else being equal, methodologies that include cashless amendments as part of refinancing activity result in higher gross issuance amounts. Some of the differences in the estimated primary market issuance among commercial data providers are probably also due to differences in the scope of data coverage.
- First lien leverage is leverage that considers the debt secured by the first claim on the underlying assets.
- Cov-lite leveraged loans have no maintenance covenants in the loan documentation to protect the borrower. Maintenance covenants require certain tests, such as maximum leverage, minimum interest coverage ratio and maximum capital expenditure limits, to be met by the borrower at all times. Cov-lite leveraged loans still maintain at least some incurrence covenants. Unlike maintenance covenants, incurrence covenants prevent the borrower from breaching certain thresholds only when undertaking certain actions, such as mergers, and thus offer weaker investor protection. Moreover, in recent years, investor protection has been further weakened by a marked decline in the number of incurrence covenants per loan.
- See Guidance on leveraged transactions, ECB, May 2017.
- Fitch upgraded Portugal’s rating to investment grade in December, following a similar action by S&P in September; Greece’s ratings were upgraded by one to two notches by the three main ratings agencies between January and February, and by DBRS in May. In January Fitch was the first rating agency to upgrade Spain post crisis, later followed by DBRS, S&P and Moody’s.
- EMMI reached its decision after attempts to enhance EONIA’s volumes on the lending side and to improve the geographical and bank concentration of EONIA proved unsuccessful. EMMI acknowledged that, as long as the definition and calculation methodology of EONIA remain unchanged, EONIA’s compliance with the Benchmark Regulation could not be guaranteed should market conditions and dynamics remained unchanged. See also “State of play of the EONIA Review”, EMMI, February 2018, and the presentation by EMMI’s working group on EURIBOR of 26 February 2018, available at http://www.ecb.europa.eu/paym/initiatives/interest_rate_benchmarks/WG_euro_risk-free_rates/html/index.en.html.
- See the box entitled “Update on reference rate reforms in the euro area”, Financial Stability Review, ECB, November 2017.
- Regulation (EU) 2016/1011 of the European Parliament and of the Council of 8 June 2016 on indices used as benchmarks in financial instruments and financial contracts or to measure the performance of investment funds and amending Directives 2008/48/EC and 2014/17/EU and Regulation (EU) No 596/2014 (OJ L 171, 29.6.2016, p. 1).
- The Benchmarks Regulation allows the use of EONIA as a reference rate until 31 December 2019, after which its provider, EMMI, can only provide it if authorised by its regulator, the Belgian Financial Services and Markets Authority (FSMA), and only for use in legacy contracts. EMMI’s conclusion that EONIA cannot achieve compliance with the Benchmark Regulation implies a need to have an alternative viable reference rate in place by 1 January 2020.
- The analysis of profitability developments in 2017 is based on a balanced sample of 112 significant institutions (adjusted for mergers and acquisitions).
- The aggregate ROE of 74 significant institutions (SIs) representing around 90% of total SI assets was 5.8% in 2010.
- These offsetting negative effects were mainly related to gains/losses on financial instruments designated at fair value through profit or loss, as well as gains/losses on financial instruments not measured at fair value (e.g. available-for-sale assets) and, to a lesser extent, exchange differences.
- The largest one-off items include the recognition of negative goodwill resulting from a merger (i.e. the negative difference between the share purchase price and the fair value of net assets), capital gains related to asset disposals and a public cash contribution related to the acquisition of certain assets of liquidated banks.
- Based on a sample of 88 SIs.
- The analysis is based on Kumbhakar, S.C., L. Gudbrand and J.B. Hardaker (2014), “Technical efficiency in competing panel data models: a study of Norwegian grain farming”, Journal of Productivity Analysis, Vol. 41, Issue 2, pp. 321–337. It is assumed that banks use funds (liabilities), labour and fixed assets to produce loans and investments. To control for risk and technical change, the equity ratio and a time trend are included as semi fixed inputs. The function used is a standard trans-log cost function with the price of labour used to normalize the dependent variable and all input prices.
- While very easy to compute, caution is needed when using accounting indicators as a measure of efficiency. The average cost for a bank is highly dependent on the business model of the institution, its size and various country-specific factors which are outside the control of bank management. The CIR captures simultaneously several aspects of bank performance, such as productivity, efficiency and various bank-specific and country-specific factors. The CIR is also affected, at least indirectly, by credit risk, which distorts the estimation of efficiency.
- Efficiency scores in frontier analysis are relative in nature and are scaled to the best-performing bank. An additional caveat with measures based on frontier analysis is that it approximates total banking activities with loans and investments, while in reality banks offer a variety of products.
- In this analysis, banks are classified as commercial if they are active mainly in retail, wholesale and private banking (i.e. universal banks), while savings and cooperative banks are mainly active in retail banking (the latter having a cooperative ownership structure).
- The following types of bank were dropped from the sample: banks that recorded a change in the gross value of total assets of more than 50% in a particular year; banks which have less than one third of their total assets in the form of gross loans (in order to remove institutions that do not perform maturity transformation or do not provide loans to the economy); and very small banks, i.e. those with average assets for the whole period of below €50 million.
- Overall bank efficiency is computed as the product of persistent (time invariant) and residual (time variant) efficiency. Efficiency scores are computed on the basis of a common frontier across bank categories.
- Looking across business models, there seems to be little difference in time-varying efficiency, while the differences are larger for persistent efficiency (which is lower for commercial banks than for cooperative and savings banks). This is probably due to the fact that commercial banks (which are larger institutions) are more difficult to manage. At the same time, the methodology utilises two outputs (namely loans and other earning assets), while commercial banks tend to also be involved in other activities (such as derivatives trading, asset management, etc.) that are not counted as outputs in this framework but still generate additional costs.
- Likely reasons for this finding are that there are large sunk costs associated with starting a bank and several years of deposit base formation are required to succeed in the business. Moreover, it tends to be very costly to restructure a bank (downsize the number of staff, merge with another institution, etc.) and banks have a heavy reliance on information technologies, which can take a long time to put in place.
- This bespoke dataset was collected from several market sources, including in particular Banca IFIS Market Watch, KPMG Debt Sales Monitor and individual bank announcements. It covers transactions related mainly to commercial real estate and corporate loan portfolios.
- This is broadly equivalent to the assumption that NPLs are valued on a gone-concern basis, that is, the recoveries would be derived mainly from collateral and that the unsecured part would generate very limited cash flows. As data on recoveries from unsecured corporate loans are not available, the assumed 5% recovery rate on the unsecured part is based on market pricing of unsecured consumer loans.
- See Fell, J., Grodzicki, M., Krušec, D., Martin, R. and O’Brien, E., “Overcoming non-performing loan market failures with transaction platforms”, Financial Stability Review, ECB, November 2017, pp. 130-144.
- The global charge indicator is a measure of risk relative to the size of exposures that allows standardised and IRB portfolios to be jointly taken into account in a meaningful way. It is calculated as (risk-weighted assets+12.5*expected losses)/exposure at default and (risk-weighted assets+12.5*impairments)/exposure at default for the IRB and standardised approaches, respectively.
- In 2017, the weighted average PD of IRB portfolios was 2.5% in the countries more affected by the crisis, compared with 1.1% in the other countries.
- The negative contribution of retained earnings in 2016 in the countries more affected by the crisis was mainly due to an aggregate loss recorded by banks in this country group.
- See “Ad hoc cumulative impact assessment of the Basel reform package”, EBA, 20 December 2017.
- See also the article entitled “MREL: financial stability implications”, Macroprudential Bulletin, Issue 4, ECB, December 2017.
- It should be noted that this trend is not specific for the banking sector. Euro area non-financial firms’ financing costs have also developed favourably over the same period.
- Some caution should be taken when interpreting dividend yields from a valuation perspective as banks (and non-financial corporations) tend to smooth their dividends out by varying the payout ratio.
- When drawing inferences from this historical relationship, the significant differences in liquidity in the respective markets need to be borne in mind.
- The first reference period is the fourth quarter of 2013 as this is the first period for which the securities holdings statistics data are available. In addition, this period reflects the portfolio holdings of the different sectors ahead of the implementation of the BRRD.
- See Opinion of the European Central Bank of 8 November 2017 on revisions to the Union crisis management framework (CON/2017/47).
- ICPFs have various incentives to invest their asset holdings in funds. For instance, the Deutsche Bundesbank has recently pointed out that such incentives can be related to a specific institutional framework. In the case of German life insurers, fund earnings that are paid out are recognised as income and are required to be allocated among policyholders and shareholders. However, earnings retained by a fund are not taken to insurers’ income statements and, therefore, can be used by insurers to cushion possible future losses. See Financial Stability Review 2017, Deutsche Bundesbank, p. 93.
- See Financial integration in Europe, ECB, May 2018, Special Feature B.
- See Financial Stability Review, ECB, November 2015, Box 7.
- See Financial Stability Review, ECB, May 2017, Box 7.
- See Financial Stability Report, EIOPA, December 2017, Box 5.
- See Vulnerabilities in the EU residential real estate sector, ESRB, November 2016.
- According to Swiss Re, insured natural catastrophe losses in 2017 totalled USD 144 billion and were pushed up by a number of devastating Atlantic hurricanes (Hurricanes Harvey, Irma and Maria). For more details, see Financial Stability Review, ECB, November 2017, pp. 86-88.
- Combined ratios measure incurred losses and expenses as a proportion of premiums earned, so that values above 100% indicate that incurred losses and expenses exceeded premiums earned. Typically, a one-off rise in combined ratios due to exceptionally large losses is not a source of concern. But combined ratios that remain above 100% over a prolonged period may indicate that insurers are not managing the balance between the costs and underwriting profits of their ongoing business in a sustainable manner.
- The LTG and equity risk measures that affect the calculation of the SCR ratio include the volatility and matching adjustments, the symmetric adjustment mechanism to the equity risk charge, extrapolation and transitional benefits. These measures mitigate artificial volatility in insurers’ balance sheets, but they also make the reported SCR ratios more difficult to compare.
- See “Report on long-term guarantees measures and measures on equity risk”, EIOPA, 20 December 2017.
- See Financial Stability Review, ECB, November 2017, Chapter 2 and Box 5.
- See Sushko, V. and Turner, G., “The equity market turbulence of 5 February – the role of exchange-traded volatility products”, BIS Quarterly Review, March 2018.
- For a more detailed description of the tools, see Dees, S., Henry, J. and Martin, R. (eds.), “STAMP€: Stress-Test Analytics for Macroprudential Purposes in the euro area”, ECB, February 2017.
- For a more detailed description of the scenario design toolkit, see Dees et al. (op. cit.) and Henry, J and Kok, C. (eds.), “A macro stress testing framework for assessing systemic risks in the banking sector”, Occasional Paper Series, No 152, ECB, October 2013.
- For more details on the baseline projections, see the December 2017 Eurosystem staff macroeconomic projections for the euro area. Eurosystem staff projections have been used for the main macroeconomic variables for EU countries. For other non-EU countries, the baseline projections are based on the October 2017 IMF World Economic Outlook or the November 2017 OECD Economic Outlook.
- A caveat to this is the fact that the models used for the scenario design are estimated on a long data sample and do not allow for stochastic volatility or time-varying coefficients. For this reason, the second-round effects already accounted for in the scenario might be under-estimated.
- The Stress Test Elasticities (STEs) used to design the scenario for macroeconomic variables do not allow the contribution of credit growth to the decline of GDP to be identified. For this reason, a dynamic stochastic general equilibrium (DSGE) model is also employed to calculate the contributions of the second-round effects. These contributions are constructed by rescaling the domestic real shocks of the scenario. The additional decline of real GDP under the assumption of a dynamic response of banks to the scenario coincides with the additional impact of real GDP as estimated by the DSGE model.
- The 10% average requirement refers to the average total capital “supervisory demand” without systemic buffers (i.e. Pillar 1, Pillar 2 and capital conservation buffer); see the SSM SREP Methodology Booklet, 2017 edition.
- For simplicity, the analysis of the main drivers of changes in the CET1 capital ratio is based only on the assumption of a dynamic balance sheet so that the adverse and baseline scenarios both account for the contribution of changes in risk-weighted assets.
- While the category “credit risk” takes into account the deterioration of credit quality and the effects of the scenario on credit losses, the assumption of a dynamic balance sheet also implies a reduction in the credit to the private sector with respect to the baseline. This effect contributes positively to the CET1 ratio and is accounted for in the “Other effects” category.
- See Opinion of the European Central Bank of 8 November 2017 on amendments to the Union framework for capital requirements of credit institutions and investment firms (CON/2017/46).
- The CMU mid-term review was aimed at identifying new priorities and revised the 2015 CMU Action Plan accordingly. See Communication from the Commission on the Mid-Term Review of the Capital Markets Union Action Plan (COM(2017) 292 final).
- See “ECB contribution to the European Commission’s consultation on the review of the EU macroprudential policy framework”, ECB, December 2016.
- See Opinion of the European Central Bank of 2 March 2018 on a proposal for a regulation of the European Parliament and of the Council amending Regulation (EU) No 1092/2010 on European Union macro-prudential oversight of the financial system and establishing a European Systemic Risk Board (CON/2018/12) and Opinion of the European Central Bank of 11 April 2018 on a proposal for a regulation of the European Parliament and of the Council amending Regulation (EU) No 1093/2010 establishing a European Supervisory Authority (European Banking Authority) and related legal acts (CON/2018/19).
- See Opinion of the European Central Bank of 8 November 2017 on revisions to the Union crisis management framework (CON/2017/47).
- See “Funding Strategy Elements of an Implementable Resolution Plan”, FSB, 30 November 2017.
- See “Principles on Bail-in Execution”, Consultative Document, FSB, 30 November 2017.
- See “Commission measures to address the risks related to NPLs”, European Commission, March 2018.
- See “Council conclusions on Action plan to tackle non-performing loans in Europe”, Council of the European Union, July 2017.
- See “Policy Recommendations to Address Structural Vulnerabilities from Asset Management Activities”, FSB, January 2017.
- See “Recommendations for Liquidity Risk Management for Collective Investment Schemes”, IOSCO, February 2018.
- See Recommendation of the European Systemic Risk Board of 7 December 2017 on liquidity and leverage risks in investment funds (ESRB/2017/6).
- See “Systemic risk and macroprudential policy in insurance”, EIOPA, February 2018.
- See Directive (EU) 2015/2366 of the European Parliament and of the Council of 25 November 2015 on payment services in the internal market, amending Directives 2002/65/EC, 2009/110/EC and 2013/36/EU and Regulation (EU) No 1093/2010, and repealing Directive 2007/64/EC (OJ L 337, 23.12.2015).
- See Opinion of the European Banking Authority on the transition from PSD1 to PSD2 (EBA/Op/2017/16) and Commission Delegated Regulation (EU) No …/… of XXX supplementing Directive 2015/2366 of the European Parliament and of the Council with regard to regulatory technical standards for strong customer authentication and common and secure open standards of communication (C(2017) 7782 final).
- See Regulation (EU) No 909/2014 of the European Parliament and of the Council of 23 July 2014 on improving securities settlement in the European Union and on central securities depositories and amending Directives 98/26/EC and 2014/65/EU and Regulation (EU) No 236/2012. The Regulation entered into force on 17 September 2014.
- See “FinTech action plan: For a more competitive and innovative European financial sector”, European Commission, March 2018.
- See “EBA publishes its Roadmap on FinTech”, EBA, March 2018.
- See “Guide to assessments of fintech credit institution licence applications”, ECB, March 2018.
- Although sometimes referred to as “virtual currencies”, crypto-assets lack the key attributes of sovereign currencies and should not be seen as a means of payment. See, for example, Opinion of the European Central Bank of 12 October 2016 on a proposal for a directive of the European Parliament and of the Council amending Directive (EU) 2015/849 on the prevention of the use of the financial system for the purposes of money laundering or terrorist financing and amending Directive 2009/101/EC (CON/2016/49).
- See the box entitled “Financial stability vulnerabilities stemming from cyber risks within financial market infrastructures”, Financial Stability Review, ECB, May 2016.
- See “ECB launches public consultation on cyber resilience oversight expectations”, ECB, April 2018.
- See “TIBER-EU framework How to implement the European framework for Threat Intelligence-based Ethical Red Teaming”, ECB, April 2018.
- See “CPMI-IOSCO – Guidance on cyber resilience for financial market infrastructures”, BIS, June 2016; and “G7 fundamental elements of cyber security for the financial sector”, October 2016.
- See Communication from the Commission – Action Plan: Financing Sustainable Growth (COM(2018) 97 final).
- The analysis and results of this special feature are partly based on Lang, J.H., Izzo, C., Fahr, S. and Ruzicka, J., “Anticipating the bust: A new cyclical systemic risk indicator to assess the likelihood and severity of financial crises”, mimeo, 2018.


