Corporate vulnerabilities and the risks of lower growth and higher rates
Published as part of the Financial Stability Review, May 2023.
Following a strong post-pandemic recovery in profits, euro area non-financial corporations are now facing the risk of stagnating economic activity combined with tightening financial conditions. As monetary policy normalises, interest rates on corporate bonds and loans are increasing at their fastest pace in decades, leading to declining corporate lending and investment. Against this backdrop, this box uses firm-level balance sheet data to identify vulnerable non-financial corporations (NFCs) based on the Altman Z-score, a measure of insolvency risk.[1]
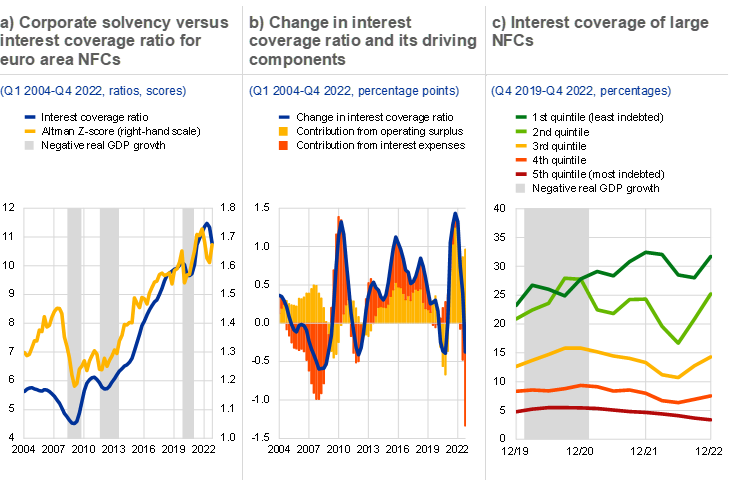
Corporate vulnerabilities might increase as higher interest rates start to weigh on the ability of firms to cover their interest expenses, with highly indebted firms being particularly affected. In aggregate, the corporate sector in the euro area is more resilient than it was during the interest rate hiking cycle that started in 2011 (Chart A, panel a). Evidence for this is provided by the higher levels of Altman Z-scores and interest coverage ratios for euro area firms. Helped by the low-interest rate environment, these indicators improved after the global financial crisis until monetary policy tightening started. Moreover, large nominal operating surpluses also helped NFCs to repay their debts. However, corporates typically borrow at a relatively short maturity and against a floating rate, which means that changes in interest rates translate into higher interest expenses more quickly as maturing debt is rolled over.[2] The resulting steep increase in funding costs dents net incomes, leading to less favourable debt dynamics (Chart A, panel b). Based on quarterly reporting by larger firms, highly leveraged firms had already experienced a marked decline in their interest coverage in the second half of 2022, which was not the case for firms with lower debt levels (Chart A, panel c). In addition, these highly leveraged firms have far lower profit margins, further contributing to debt service vulnerability.[3]
Chart A
Corporate vulnerabilities might increase as interest rates rise

Sources: S&P Global Market Intelligence, ECB, Eurostat and ECB calculations.
Notes: Panel a: corporate solvency is indicated by the Altman Z-score and is calculated as 0.717 x working capital/total assets + 0.847 x retained earnings/total assets + 3.107 x EBIT/total assets + 0.420 x equity/debt + 0.998 sales/total assets, where EBIT stands for earnings before interest and taxes. A higher Altman Z-score corresponds to a healthier balance sheet structure. Panels a and b: the interest coverage ratio is defined as the ratio of gross operating surplus to gross interest payments before the calculation of financial intermediation services indirectly measured (FISIM). Panel c: consists of 1,099 large euro area NFCs that report on a quarterly basis. Interest coverage is defined as the median of EBITDA/interest expenses for each quintile, where EBITDA stands for earnings before interest, taxes, depreciation and amortisation.
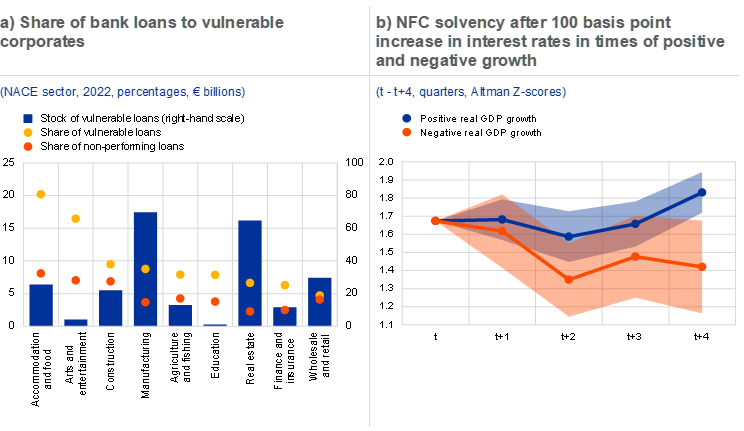
While the increase in funding costs has weighed significantly on all sectors, vulnerabilities in the manufacturing and real estate sectors pose the largest threat to banks, even though with heterogeneity across euro area countries. The share of vulnerable NFC loans – defined as loans with a probability of default of above 5% and an interest coverage ratio of below 1 – increased from 5.7% to 6.4% in 2022, owing to the rise in borrowing costs since March 2022 and existing high levels of debt. Firms in the real estate, agriculture, entertainment and construction sectors were particularly affected, with an average increase of 1.7 percentage points, whereas leisure activities[4] had a high share of vulnerable loans, totalling more than 15% (Chart B, panel a). Among the vulnerable sectors, banks are most exposed to manufacturing and real estate. In aggregate, the high volume of vulnerable NFC loans might lead to a significant increase in non-performing loans. In particular, the non-performing loan ratios in the manufacturing and real estate sectors were less than half of the share of vulnerable loans in 2022. Ultimately, vulnerable NFC loans could weigh on bank capitalisation levels if borrowing costs continue to rise.[5]
Higher interest rates could increase corporate vulnerabilities, with the impact being greater during periods of low or negative economic growth. To assess the combined impact of higher interest expenses and lower economic growth on corporate default risk, local projections[6] are used to relate corporate solvency to an increase in interest expenses during periods of economic contraction and periods of economic growth.[7] The state-dependent analysis suggests that an increase of 100 basis points in interest expenses during a period of weak or negative economic growth significantly reduces corporate solvency, as Altman Z-scores are estimated to decline by 0.3 points in the two quarters after the rise in interest rates – reflecting higher loan default risk. At the same time, there is no statistically significant impact on firms’ health during periods of economic expansion (Chart B, panel b). This implies that currently rising interest rates might exacerbate corporate vulnerabilities if economic growth weakens.
Chart B
Rising interest rates exacerbate corporate vulnerabilities to a varying extent across sectors and significantly more during periods of negative economic growth

Sources: Bureau van Dijk – Orbis, ECB, Eurostat and ECB calculations.
Notes: Panel a: data grouped by NACE sector and sorted by the most vulnerable sectors, excluding sector S: Other service activities. A: Agriculture, forestry and fishing, C: Manufacturing, F: Construction, G: Wholesale and retail trade, repair of motor vehicles and motorcycles, I: Accommodation and food service activities, K: Financial and insurance activities, L: Real estate activities, P: Education and R: Arts, entertainment and recreation. Vulnerable loans are defined as loans with interest coverage ratio <1 and probability of default >5%. Interest payments from floating-rate, mixed and rolled-over fixed-rate loans are adjusted by the difference between the prevailing interest rates at end-2021 and end-2022, and on the basis of their residual maturity. Data covering euro area exposures to 86 euro area significant institutions are consolidated at the euro area level. Panel b: non-linear impulse response function* of the Altman Z-score after a 100 basis point increase in interest rates. Scores were estimated using a non-linear local projection panel model that controls for real GDP, Altman Z-scores and interest rates and the feedback interaction across all variables over time. The non-linearity accounts for periods of positive and negative real GDP growth. Using nominal GDP to identify positive and negative growth periods yields a similar result. The shaded areas represent 90% confidence intervals using Newey-West standard errors robust to heteroscedasticity and autocorrelation.
*) Auerbach, A.J. and Gorodnichenko, Y., “Measuring the Output Responses to Fiscal Policy”, American Economic Journal: Economic Policy, Vol 4, No 2, May 2012, pp. 1-27.
All in all, higher interest expenses and production costs in conjunction with lower economic growth prospects are likely to dent corporate profitability and solvency. This box shows that the share of vulnerable loans has been increasing since the second half of 2022 as financial conditions tighten, with those sectors of the economy that were impacted the most by the pandemic being significantly more affected than others. Further increases in borrowing costs and existing high corporate debt levels in a number of sectors can significantly increase corporate vulnerability – and hence bank asset quality – when growth surprises to the downside, cost inflation persists and firms face limits when it comes to passing on higher production costs to sales prices.
The Altman Z-score captures insolvency risk based on five balance sheet and income statement ratios, together with their joint importance. See Altman, E.I. (1968), “Financial ratios, discriminant analysis and the prediction of corporate bankruptcy”, The Journal of Finance, Vol. 23, No 4, pp. 589-609.
According to the loan-level data used in this box, for instance, by December 2021 the share of fixed-rate loans was 45%.
In Q4 2022 firms in the highest debt quintile had a median net income margin of 5.5%, while those in the lowest quintile reported a median net income margin of 8%.
The leisure sector comprises both the accommodation and food sector and the arts and entertainment sector.
As at end-2022, aggregate CET1 capital of the significant institutions covered by European banking supervision stood at around €1.3 trillion.
See Jordà, Ò., “Estimation and Inference of Impulse Responses by Local Projections”, American Economic Review, Vol. 95, No 1, March 2005, pp. 161-182.
We define economic contraction as year-on-year real GDP growth below zero.


