
- CONSUMER EXPECTATIONS SURVEY – LATEST RESULTS
Housing and credit access
Frankfurt am Main, 12 January 2023
Overview
This report contains the main aggregate indicators from the Consumer Expectations Survey (CES) related to the housing market and credit access. Results are reported monthly at the euro area level, by country, by age group and by income quintile. The topics covered include:
- Home price expectations over the next 12 months
- Mortgage interest rate expectations 12 months ahead
- Perceived and expected credit access
- Credit application rate over the previous three months
Table 1 provides an overview of the latest results for the main indicators included in this report. For more detailed information on how the aggregate indicators are computed, please refer to the Guide to the computation of aggregate statistics and the CES Methodological information on the survey, available on the data and methodological information section of the CES webpage. The data behind the aggregate series included in this report can also be found under the same section.
Table 1
Overview of latest results – Housing and credit access
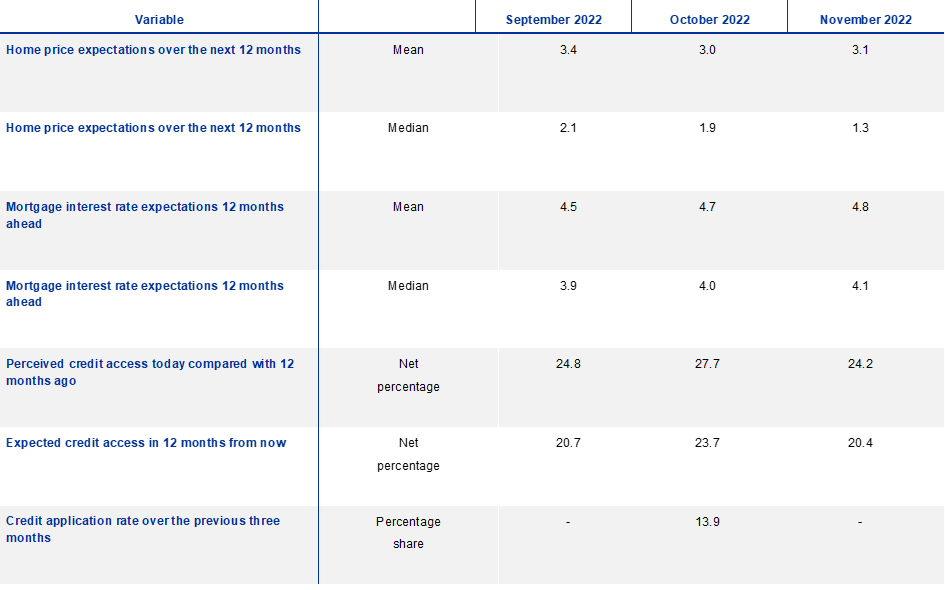
Source: CES.
Notes: Weighted estimates. Net percentages are obtained by subtracting the percentage of respondents indicating that credit access has (will) become easier from the percentage of respondents indicating that credit access has (will) become more difficult. The median is computed on the basis of a symmetric linear interpolation that accounts for rounding of responses. Mean values are winsorised at the 2nd and 98th percentiles of each survey round and country. Numbers on home prices are reported in expected annual percentage changes.
Home price expectations over the next 12 months
In the qualitative question, respondents are asked: “In 12 months from now, what do you expect will happen to the price of your current home? By this, we mean the price that would be paid if your home were to be sold 12 months from now.” The possible responses are “Increase a lot”, “Decrease a lot”, “Increase a little”, “Decrease a little” and “Stay exactly the same”.
The open-ended (quantitative) question reads: “In 12 months from now, by about what percentage do you expect the price of your current home to be higher/lower?”
Chart 1
Home price expectations 12 months ahead – qualitative
Qualitative measure of home price expectations (forward-looking)
(percentages of respondents)

Source: CES.
Notes: Weighted estimates. Net percentages are obtained by subtracting the percentage of respondents indicating that prices will decrease from the percentage of respondents indicating that prices will increase.
Chart 2
Home price expectations 12 months ahead – pooled
Quantitative measure of home price expectations (forward-looking)

Source: CES.
Notes: Weighted estimates. The median is computed on the basis of a symmetric linear interpolation that accounts for rounding of responses. Mean values are winsorised at the 2nd and 98th percentiles of each survey round and country.
Chart 3
Mean home price expectations 12 months ahead – by country
Quantitative measure of home price expectations (forward-looking)
(percentage changes)
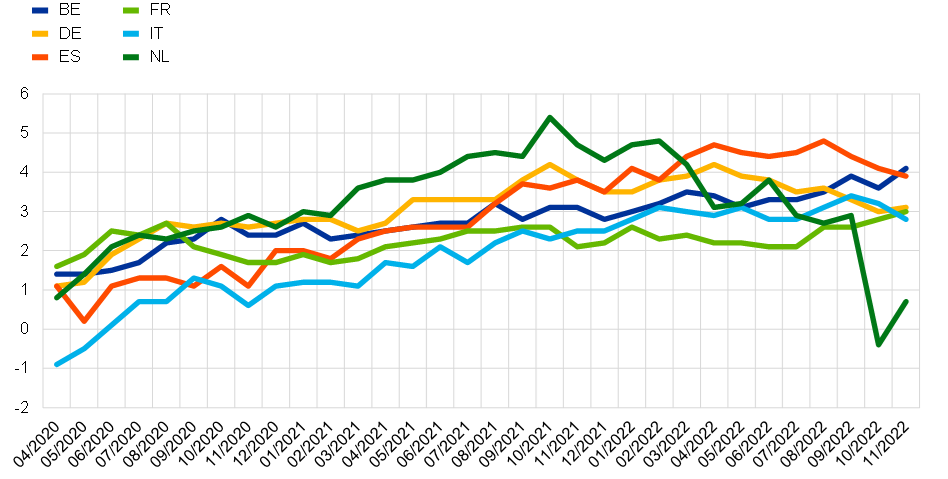
Source: CES.
Notes: Weighted estimates. Mean values are winsorised at the 2nd and 98th percentiles of each survey round and country.
Chart 4
Mean home price expectations 12 months ahead – by age group
Quantitative measure of home price expectations (forward-looking)
(percentage changes)

Source: CES.
Notes: Weighted estimates. Mean values are winsorised at the 2nd and 98th percentiles of each survey round and country.
Chart 5
Mean home price expectations 12 months ahead – by income quintile
Quantitative measure of home price expectations (forward-looking)
(percentage changes)

Source: CES.
Notes: Weighted estimates. Mean values are winsorised at the 2nd and 98th percentiles of each survey round and country.
Mortgage interest rate expectations 12 months ahead
In the question about mortgage interest rates, consumers are asked: “In 12 months from now, what do you think will be the interest rate on mortgages in the country you currently live in?”
Respondents are given the possibility to provide a numerical answer with up to one decimal point.
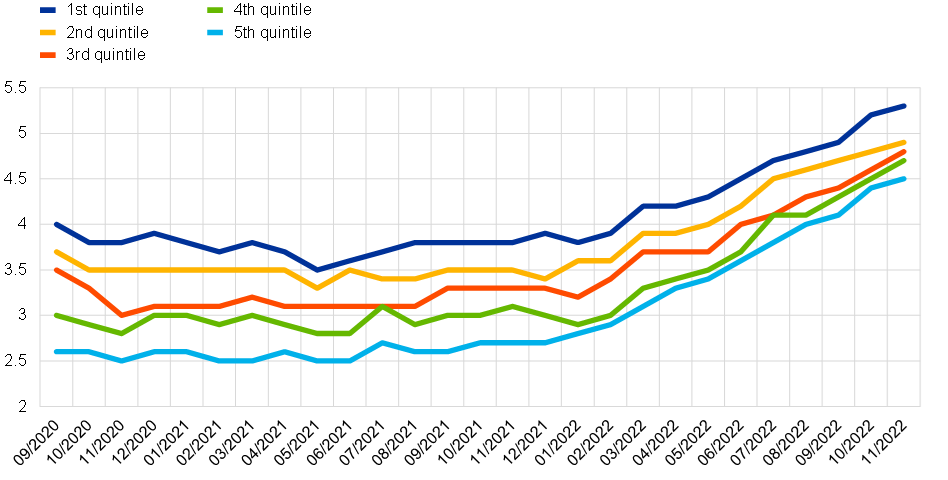
Chart 6
Mortgage interest rate expectations 12 months ahead – pooled
Quantitative measure of interest rate expectations (forward-looking)
(percentages)

Source: CES.
Notes: Weighted estimates. The median is computed on the basis of a symmetric linear interpolation that accounts for rounding of responses. Mean values are winsorised at the 2nd and 98th percentiles of each survey round and country.
Chart 7
Mean mortgage interest rate expectations 12 months ahead – by country
Quantitative measure of interest rate expectations (forward-looking)
(percentages)

Source: CES.
Notes: Weighted estimates. Mean values are winsorised at the 2nd and 98th percentiles of each survey round and country.
Chart 8
Mean mortgage interest rate expectations 12 months ahead – by age group
Quantitative measure of interest rate expectations (forward-looking)
(percentages)

Source: CES.
Notes: Weighted estimates. Mean values are winsorised at the 2nd and 98th percentiles of each survey round and country.
Chart 9
Mean mortgage interest rate expectations 12 months ahead – by income quintile
Quantitative measure of interest rate expectations (forward-looking)
(percentages)
Source: CES.
Notes: Weighted estimates. Mean values are winsorised at the 2nd and 98th percentiles of each survey round and country.
Perceived and expected credit access
In the backward-looking question, respondents are asked: “Compared with your household’s situation 12 months ago, do you think it is generally harder or easier these days for your household to obtain credit or loans (including credit and retail cards, car loans, student loans and mortgages)?”
In the forward-looking question, respondents are asked: “Looking ahead, do you think that 12 months from now it will generally be harder or easier for your household to obtain credit or loans (including credit and retail cards, car loans, student loans and mortgages) than it is these days?”
The possible responses are “Much harder”, “Somewhat harder”, “Equally easy/hard”, “Somewhat easier” and “Much easier”. Up to CES Wave 8 (August 2020), the possible responses also included a “Not applicable” option.
Chart 10
Perceived credit access over the previous 12 months – qualitative
Qualitative measure of credit access (backward-looking)
(percentages of respondents)

Source: CES.
Notes: Weighted estimates. Net percentages are obtained by subtracting the percentage of respondents indicating that access to credit is easier from the percentage of respondents indicating that access to credit is harder.
Chart 11
Expected credit access over the next 12 months – qualitative
Qualitative measure of credit access (forward-looking)
(percentages of respondents)

Source: CES.
Notes: Weighted estimates. Net percentages are obtained by subtracting the percentage of respondents indicating that access to credit will become easier from the percentage of respondents indicating that access to credit will become harder.
Credit application rate over the previous three months
In this quarterly question, respondents are asked: “During the last 3 months, has your household applied for any of the following types of credit?” The possible responses are “A mortgage”, “A loan to purchase a car or other vehicle”, “Another type of consumer loan”, “A leasing contract”, “A credit card”, “A loan for education purposes”, “An increase in the limit of an existing loan” and “Refinancing of your current mortgage”.
Charts 12 to 15 show the share of respondents indicating that they applied for at least one of these credit categories.
Chart 12
Credit applications over the previous three months – pooled
Qualitative measure of credit applications (backward-looking)
(percentages of respondents)

Source: CES.
Notes: Weighted estimates. The bars show the percentage of respondents indicating that they applied for at least one category of credit in the previous three months.
Chart 13
Credit applications over the previous three months – by country
Qualitative measure of credit applications (backward-looking)
(percentages of respondents)

Source: CES.
Notes: Weighted estimates. The bars show the percentage of respondents indicating that they applied for at least one category of credit in the previous three months.
Chart 14
Credit applications over the previous three months – by age group
Qualitative measure of credit applications (backward-looking)
(percentages of respondents)
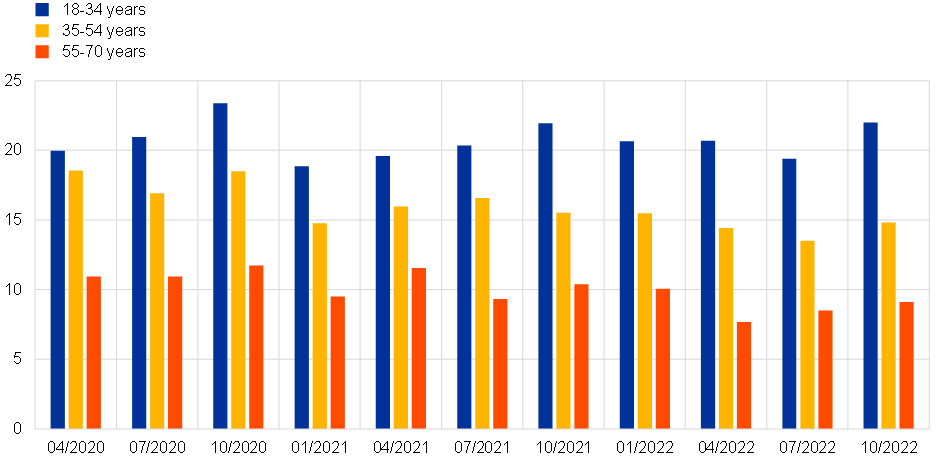
Source: CES.
Notes: Weighted estimates. The bars show the percentage of respondents indicating that they applied for at least one category of credit in the previous three months.
Chart 15
Credit applications over the previous three months – by income quintile
Qualitative measure of credit applications (backward-looking)
(percentages of respondents)
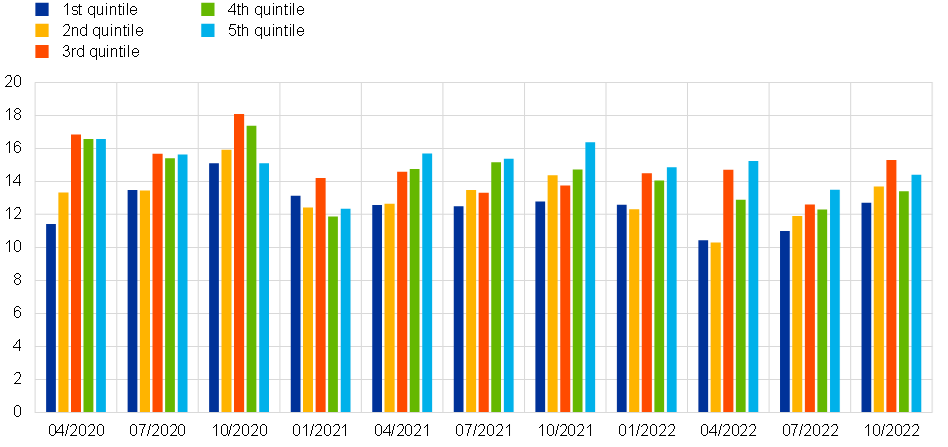
Source: CES.
Notes: Weighted estimates. The bars show the percentage of respondents indicating that they applied for at least one category of credit in the previous three months.