
Foreword

This 17th annual review of the international role of the euro published by the ECB is an interim version that presents a concise overview of developments in the use of the euro by non-euro area residents.
This report covers developments in 2017 and early 2018. This period was characterised by a strong and broad-based growth momentum in the euro area economy as well as by the continued impact of the ECB’s asset purchase programme. These developments affected the international role of the euro, which showed signs of broad stabilisation, although developments differed across dimensions of the international use of the euro. On the one hand, the shares of the euro in global payments and in global foreign exchange settlements increased. Portfolio inflows into euro area equities were strong. On the other hand, a number of indicators tracked in this report show the share of the euro as having declined. This was particularly the case for outstanding amounts of international debt securities and international deposits and for shipments of euro banknotes to destinations outside the euro area. Overall, the euro remained unchallenged as the second most important currency in the international monetary system.
The international role of the euro is primarily determined by market forces. The Eurosystem neither hinders nor promotes the international use of the euro. At the same time, the ECB will continue to monitor developments and publish information on the international role of the euro on a regular basis.
Mario Draghi
President
1 Main findings
In 2017 and early 2018, the strong and broad-based growth momentum in the euro area economy as well as the continued impact of the ECB’s asset purchase programme were among the main developments affecting the international role of the euro.
In this environment, the international use of the euro showed signs of broad stabilisation (see Table 1). For instance, the shares of the euro in global payments and in global foreign exchange settlements increased noticeably in the second quarter of 2017. Portfolio inflows into euro area equities were as high as they ever have been since the advent of the euro in 1999, on the back of the growth momentum in the euro area economy, which supported the interest of foreign investors in euro area equity markets.
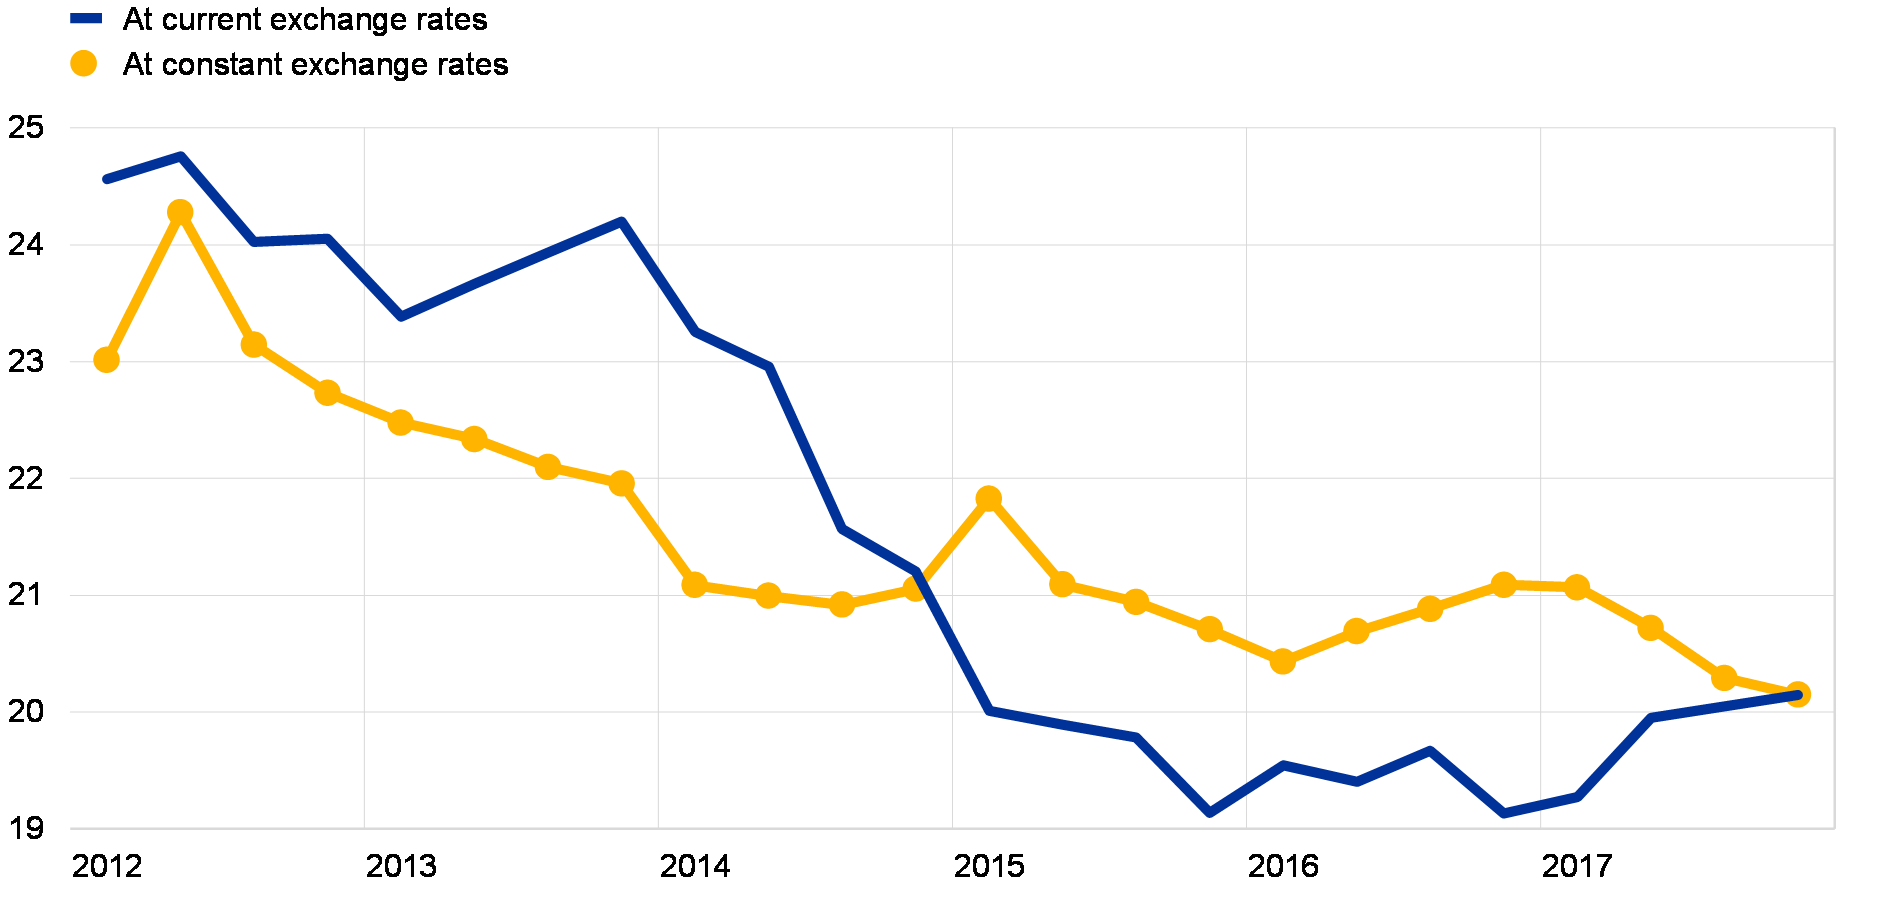
However, developments also reflected the strengthening of the euro exchange rate over the review period. For example, the share of the euro in official holdings of foreign exchange reserves increased slightly, when measured at current exchange rates. By contrast, adjusting for exchange rate valuation effects, the share of the euro in global foreign exchange reserves decreased.
Moreover, other indicators tracked in this report showed the share of the euro as having declined over the review period. This was particularly the case for outstanding amounts of international debt securities and international deposits and for shipments of euro banknotes to destinations outside the euro area. The decline in foreign demand for euro banknotes might reflect a range of factors, including financial innovation, declining geopolitical uncertainty in euro area neighbouring regions and global efforts to combat tax and financial crime. Moreover, this suggests that improving sentiment vis-à-vis the euro and stronger euro area growth, which drove a large share of the strengthening of the euro exchange rate in 2017, have not so far been reflected across all indicators of the international use of the euro.
Moreover, some other persistent factors continued to weigh on the international role of the euro. One such factor is the increasing importance of emerging market economies as issuers of foreign currency debt since the global financial crisis. This shift contributes to explaining the decline in the share of the euro in international debt securities markets despite the historically low levels of interest rates prevailing in the euro area since many emerging markets have a traditional preference for the US dollar. Another factor is the ongoing deleveraging by euro area banks, which have cut lending abroad to restore their capital ratios, as exemplified by the fact that the stock of cross-border loans in euro remains well below its peak prior to the global financial crisis of 2007-09.
Overall, a new index of the euro’s international role – computed as a simple arithmetic average of the share of the euro across a broad range of indicators – remained close to historical lows in the review period, notwithstanding the aforementioned signs of broad stabilisation (see Chart 1). As noted in last year’s edition of the report, while the euro remains unchallenged as the second most important currency in the international monetary system (see Chart 2), deeper and better connected European capital markets, for instance as a result of moving towards an EU capital markets union, as well as a completed banking union, may contribute to the depth and liquidity of euro area financial markets. As an indirect result, this could also foster the international standing of the euro.[1]
Chart 1
The euro’s international role remains close to historical lows
Broad measure of the international role of the euro
(percentages; at current and Q4 2017 exchange rates; four-quarter moving averages)
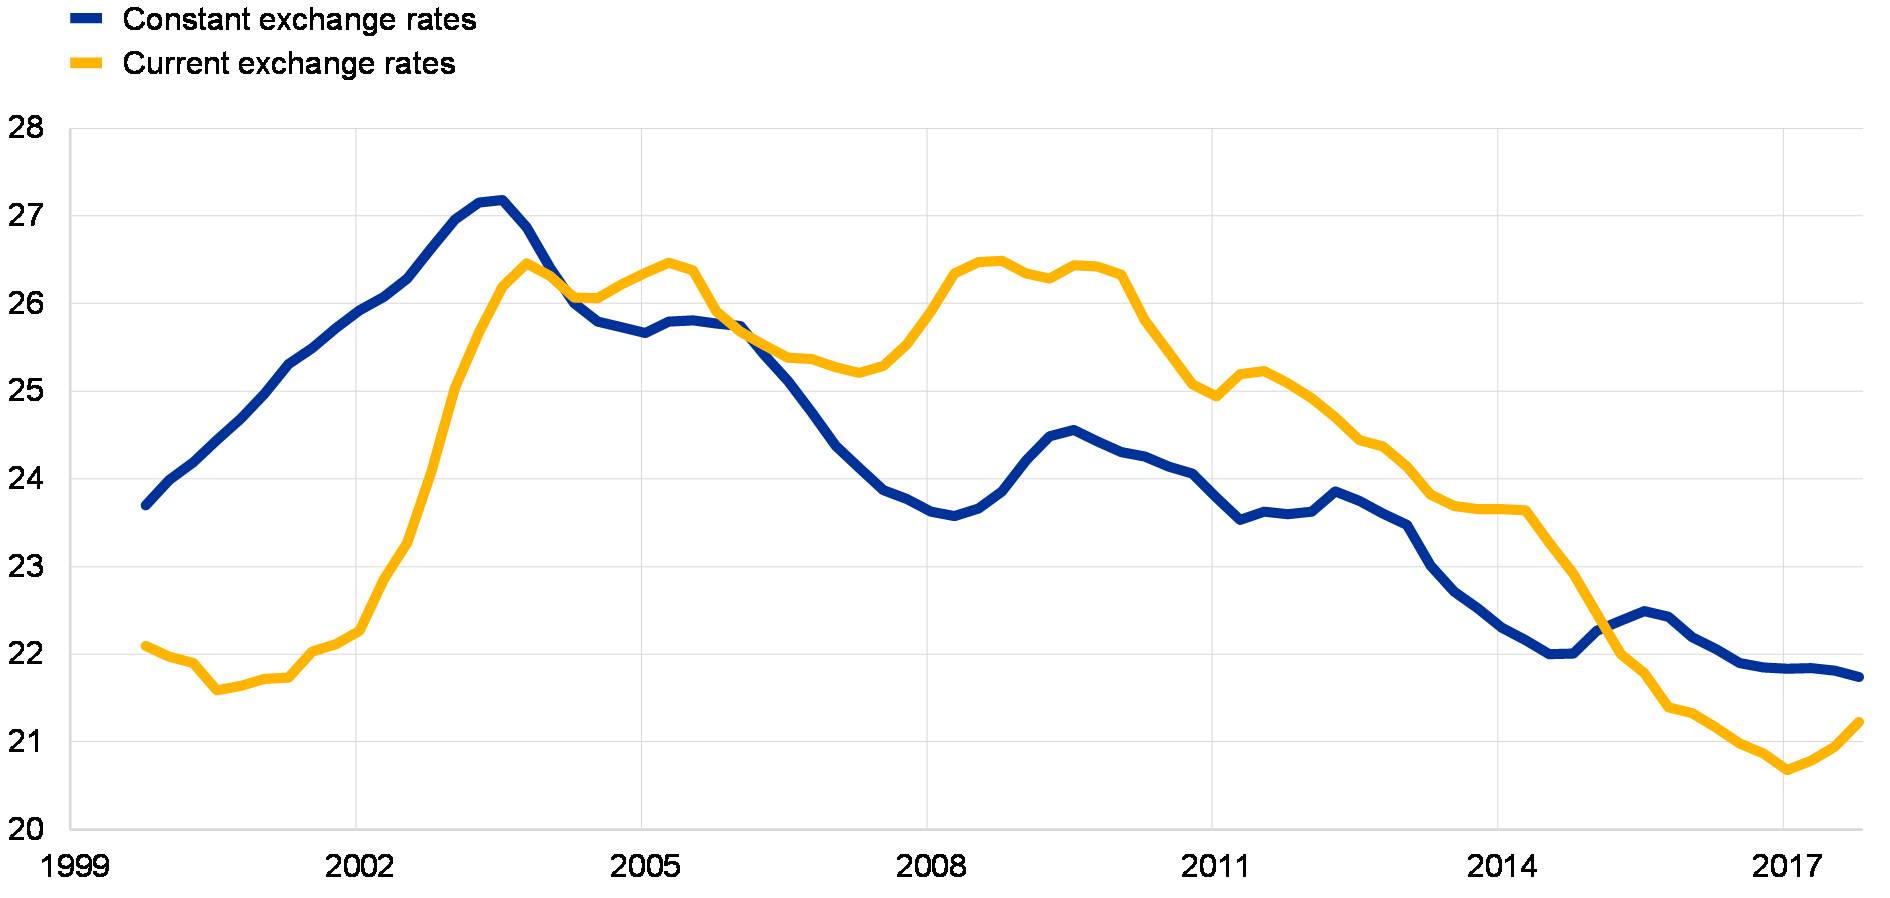
Sources: BIS, IMF, CLS, Ilzetzki, Reinhart and Rogoff (2017) and ECB calculations.
Notes: Simple arithmetic average of the shares of the euro at constant (current) exchange rates in stocks of international bonds, cross-border loans, cross-border deposits, foreign exchange settlements, global foreign exchange reserves and exchange rate regimes. Data at constant exchange rates were not available for foreign exchange settlements. Ilzetzki, E., Reinhart, C.M. and Rogoff, K.S., “Exchange Rate Arrangements Entering the 21st Century: Which Anchor Will Hold?”, NBER Working Paper No 23134, February 2017.
Chart 2
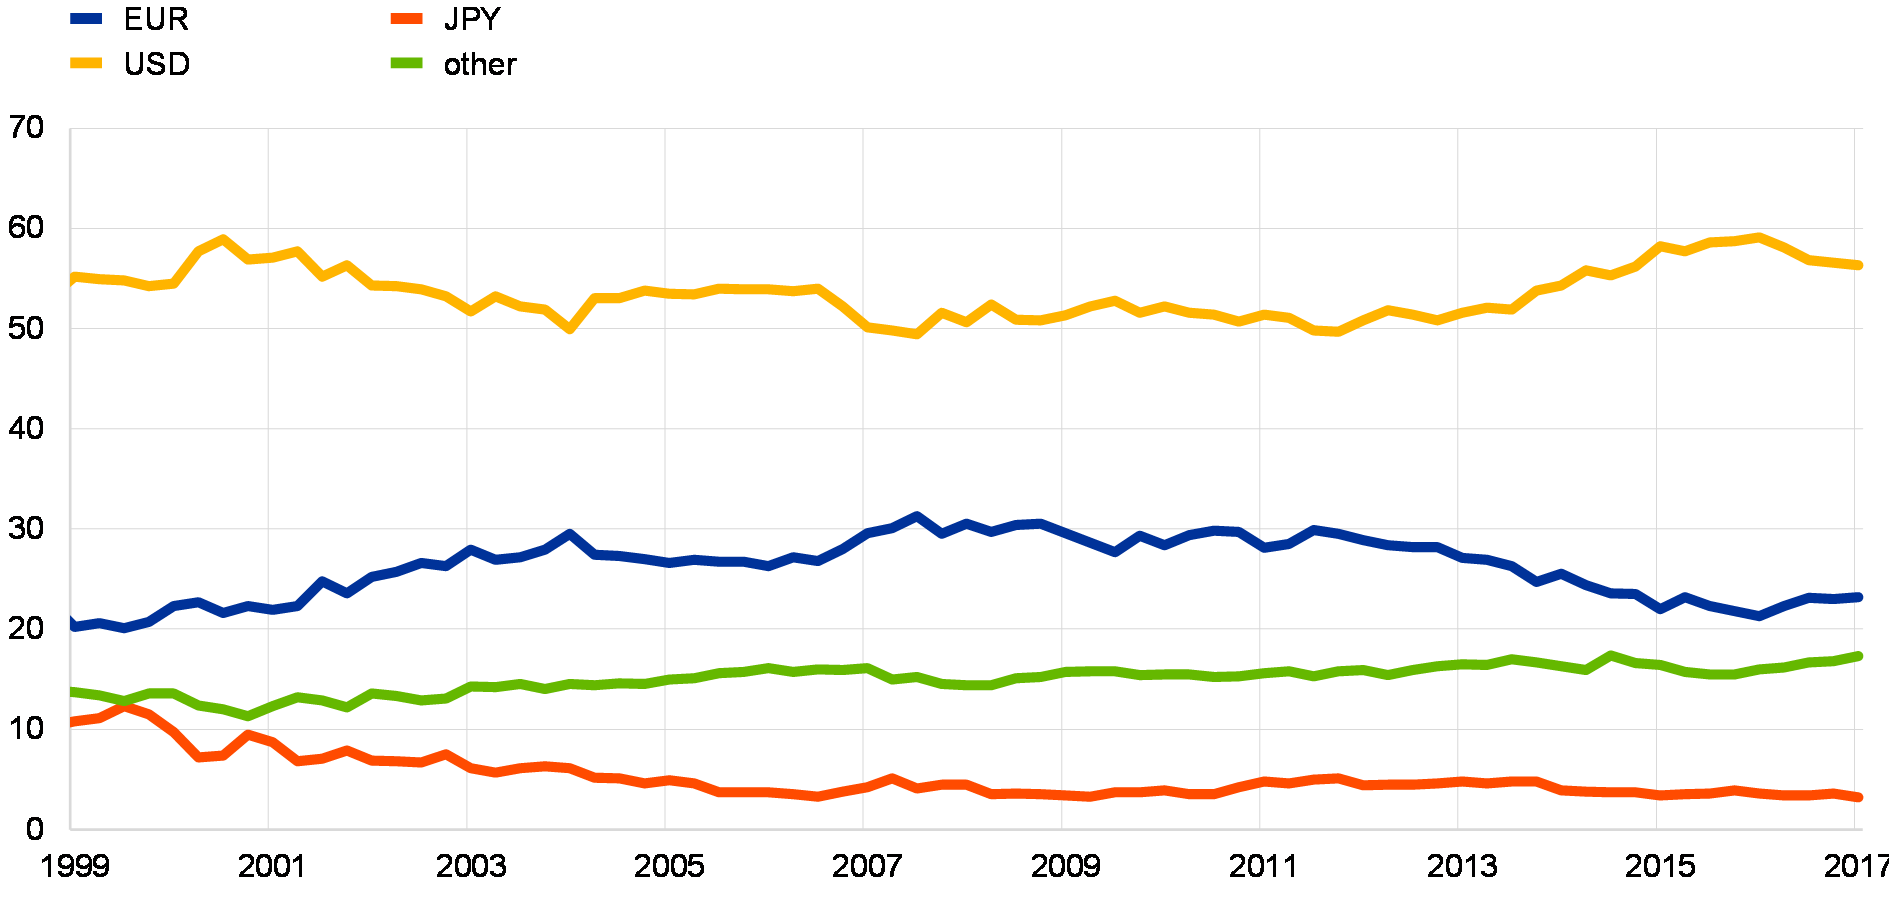
The euro remains the second most important currency in the international monetary system
Snapshot of the international monetary system
(percentages)
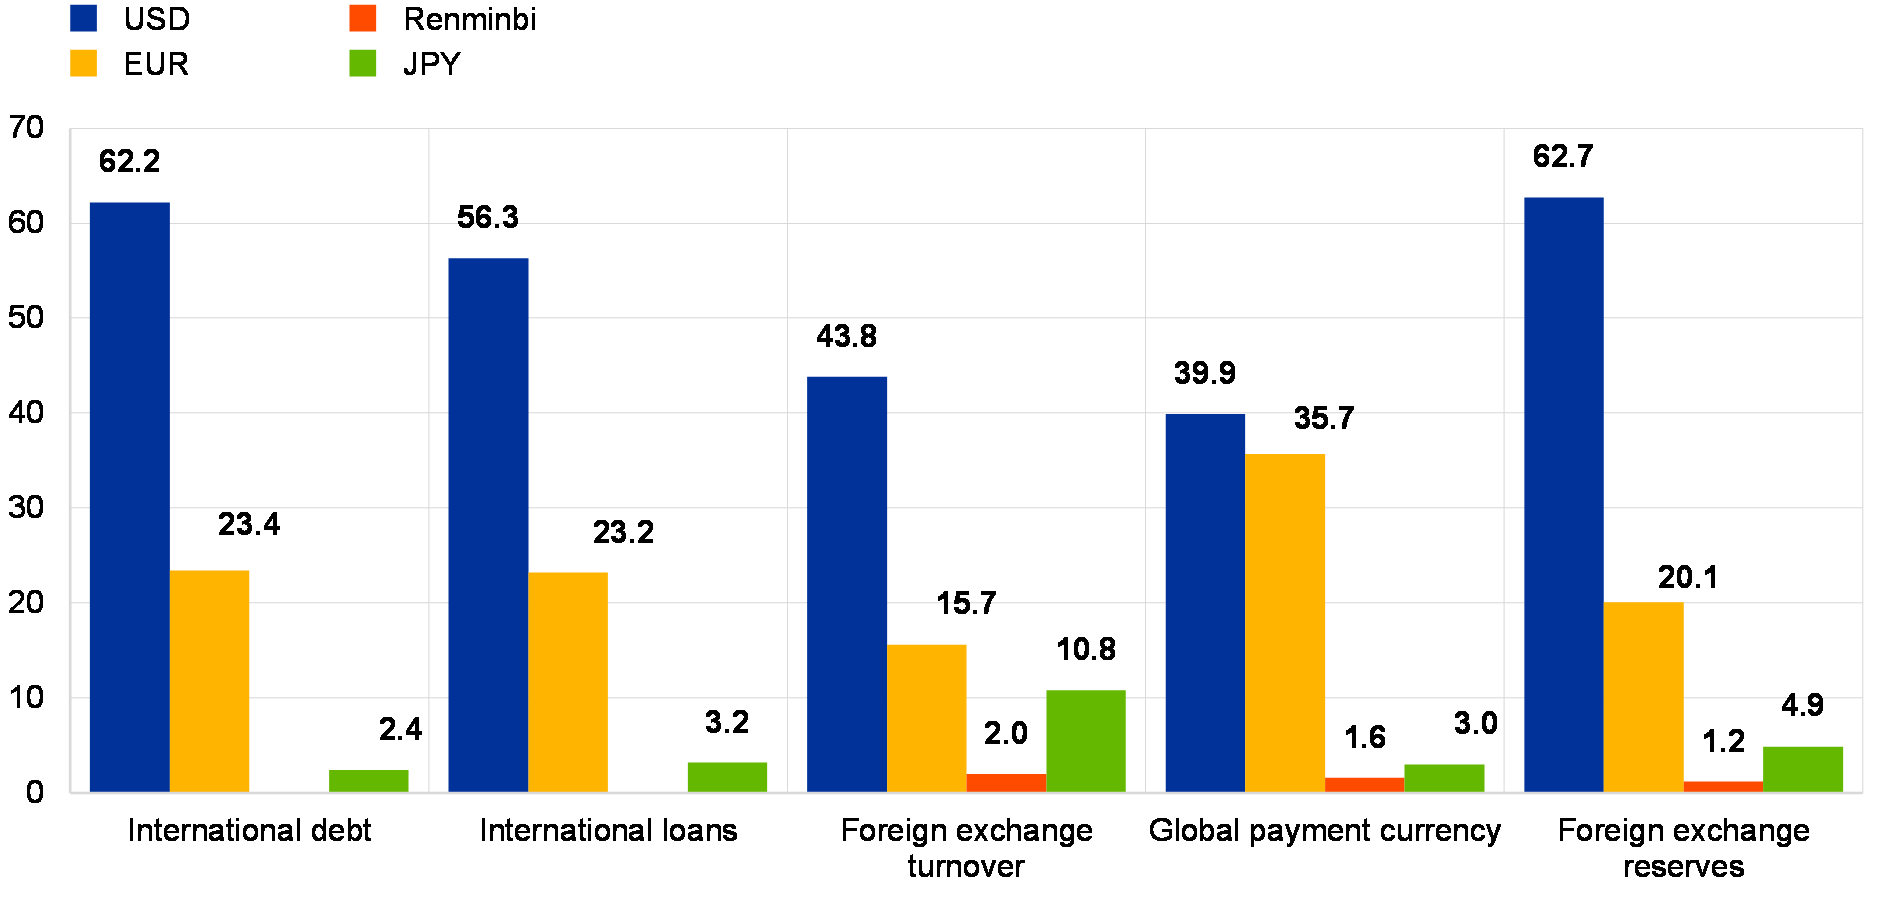
Sources: BIS, IMF, SWIFT and ECB calculations.
Note: Data as at the fourth quarter of 2017 or latest available.
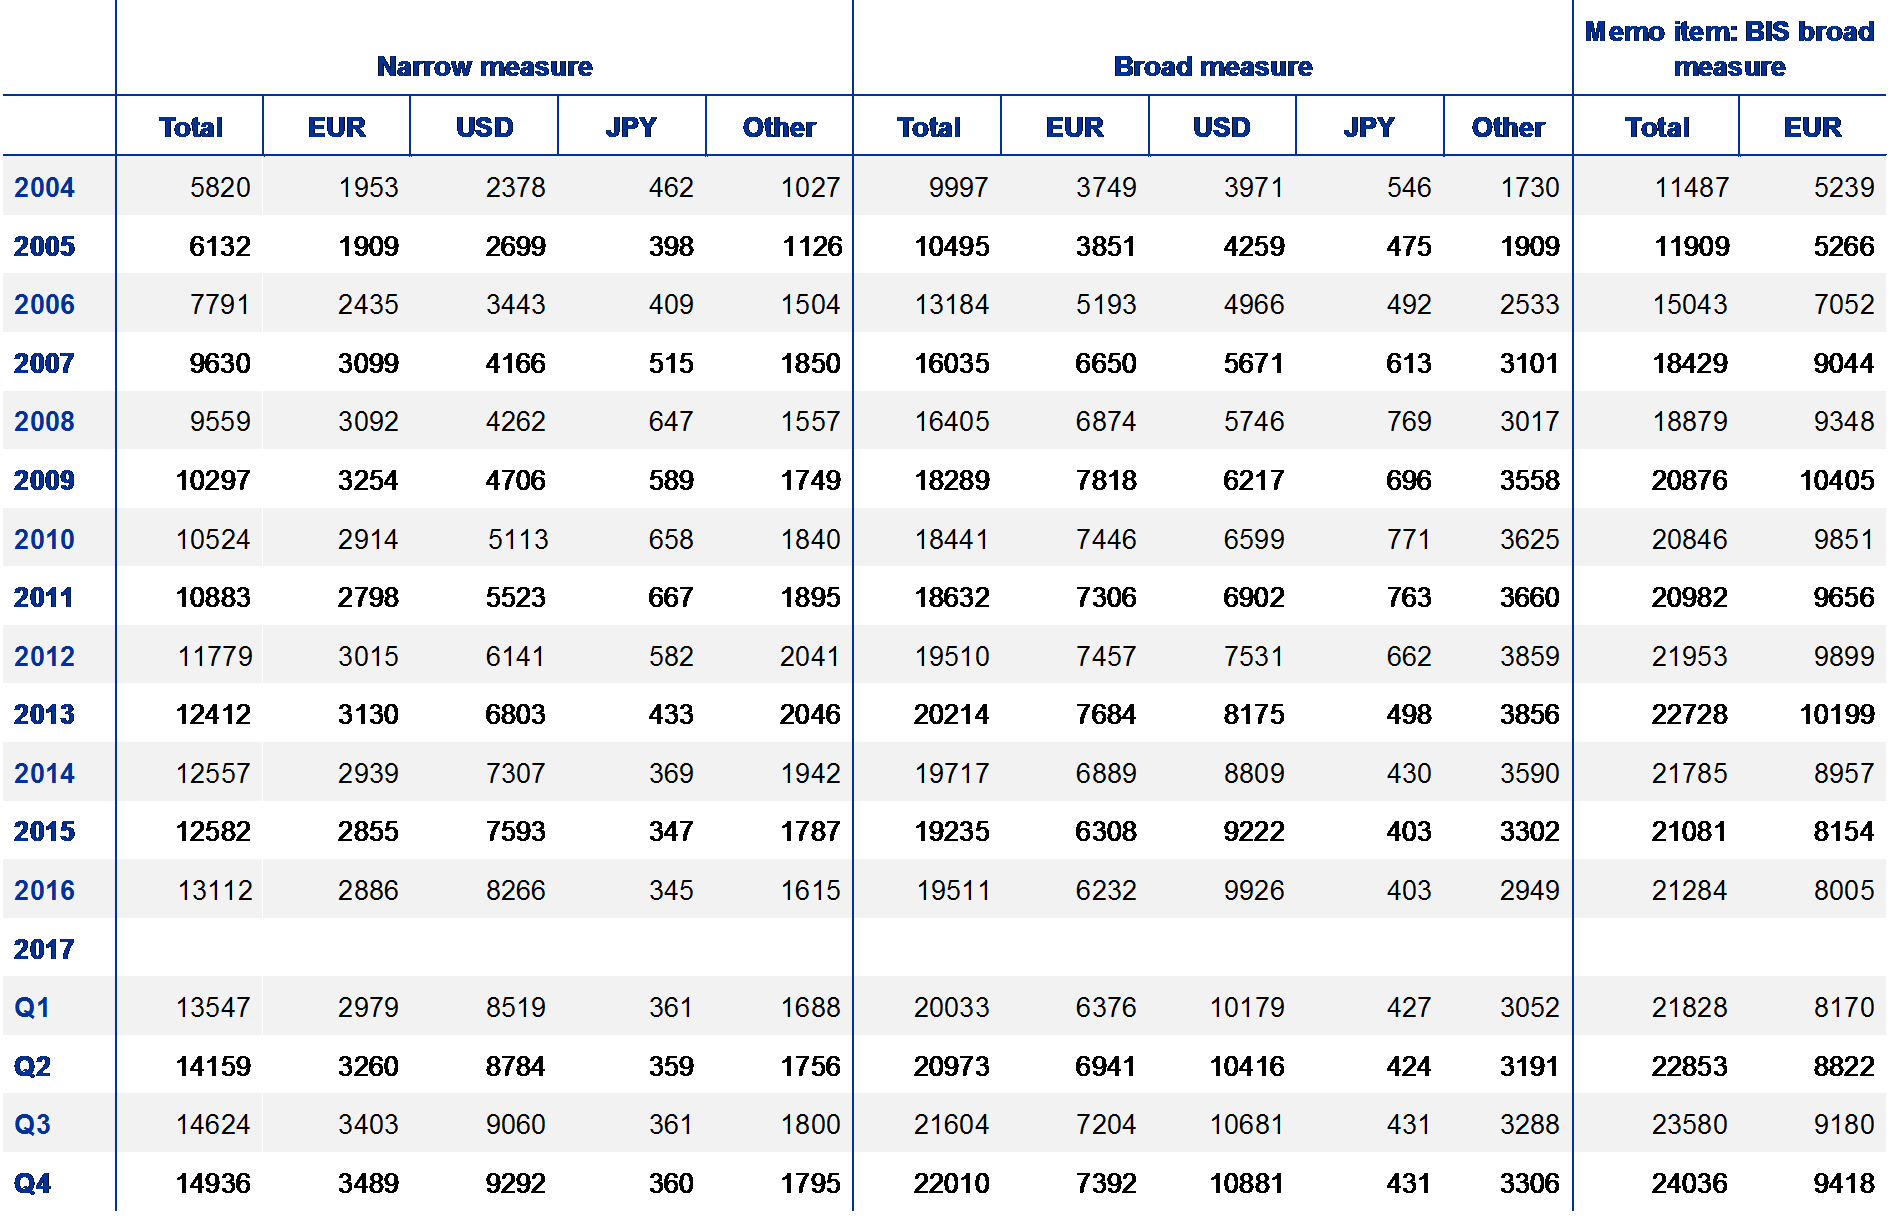
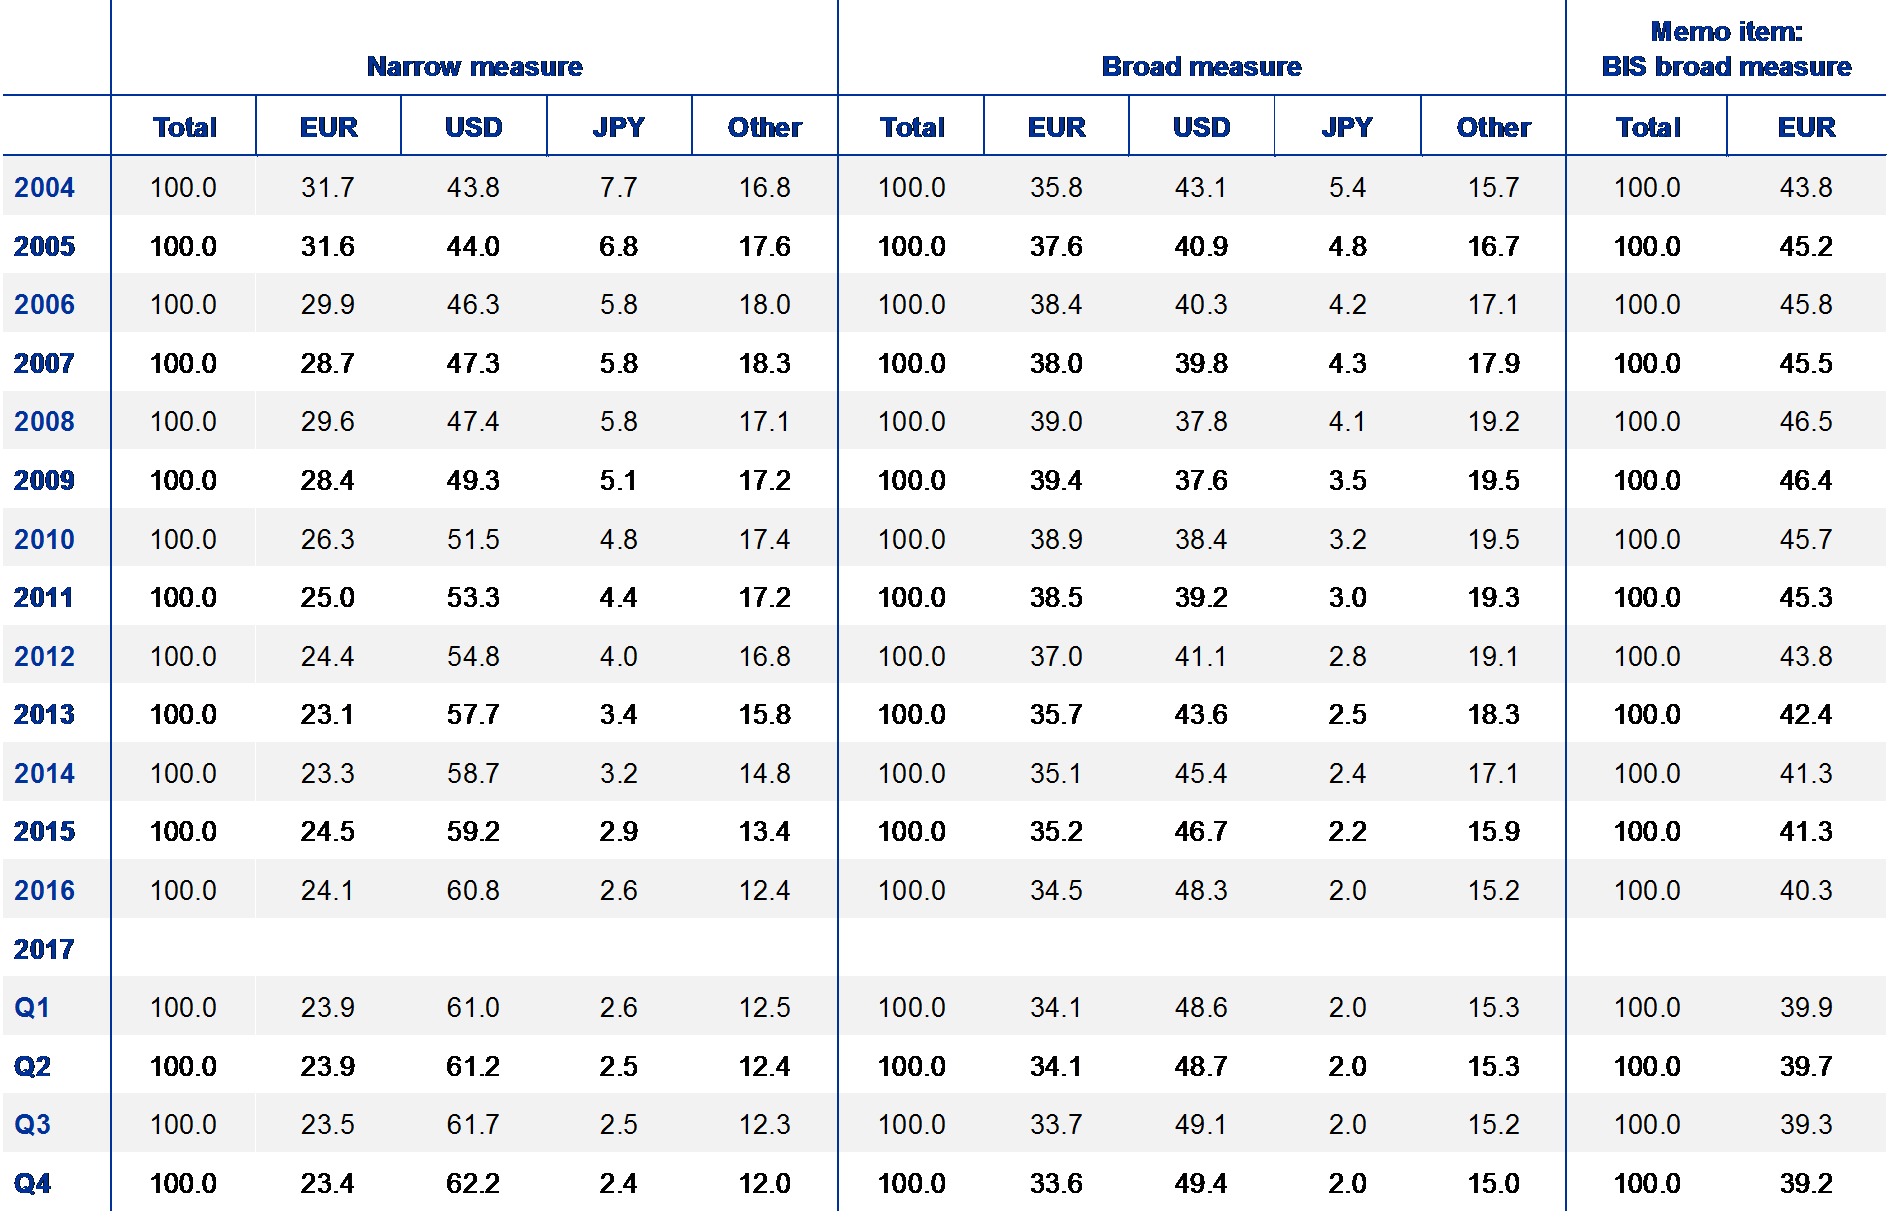
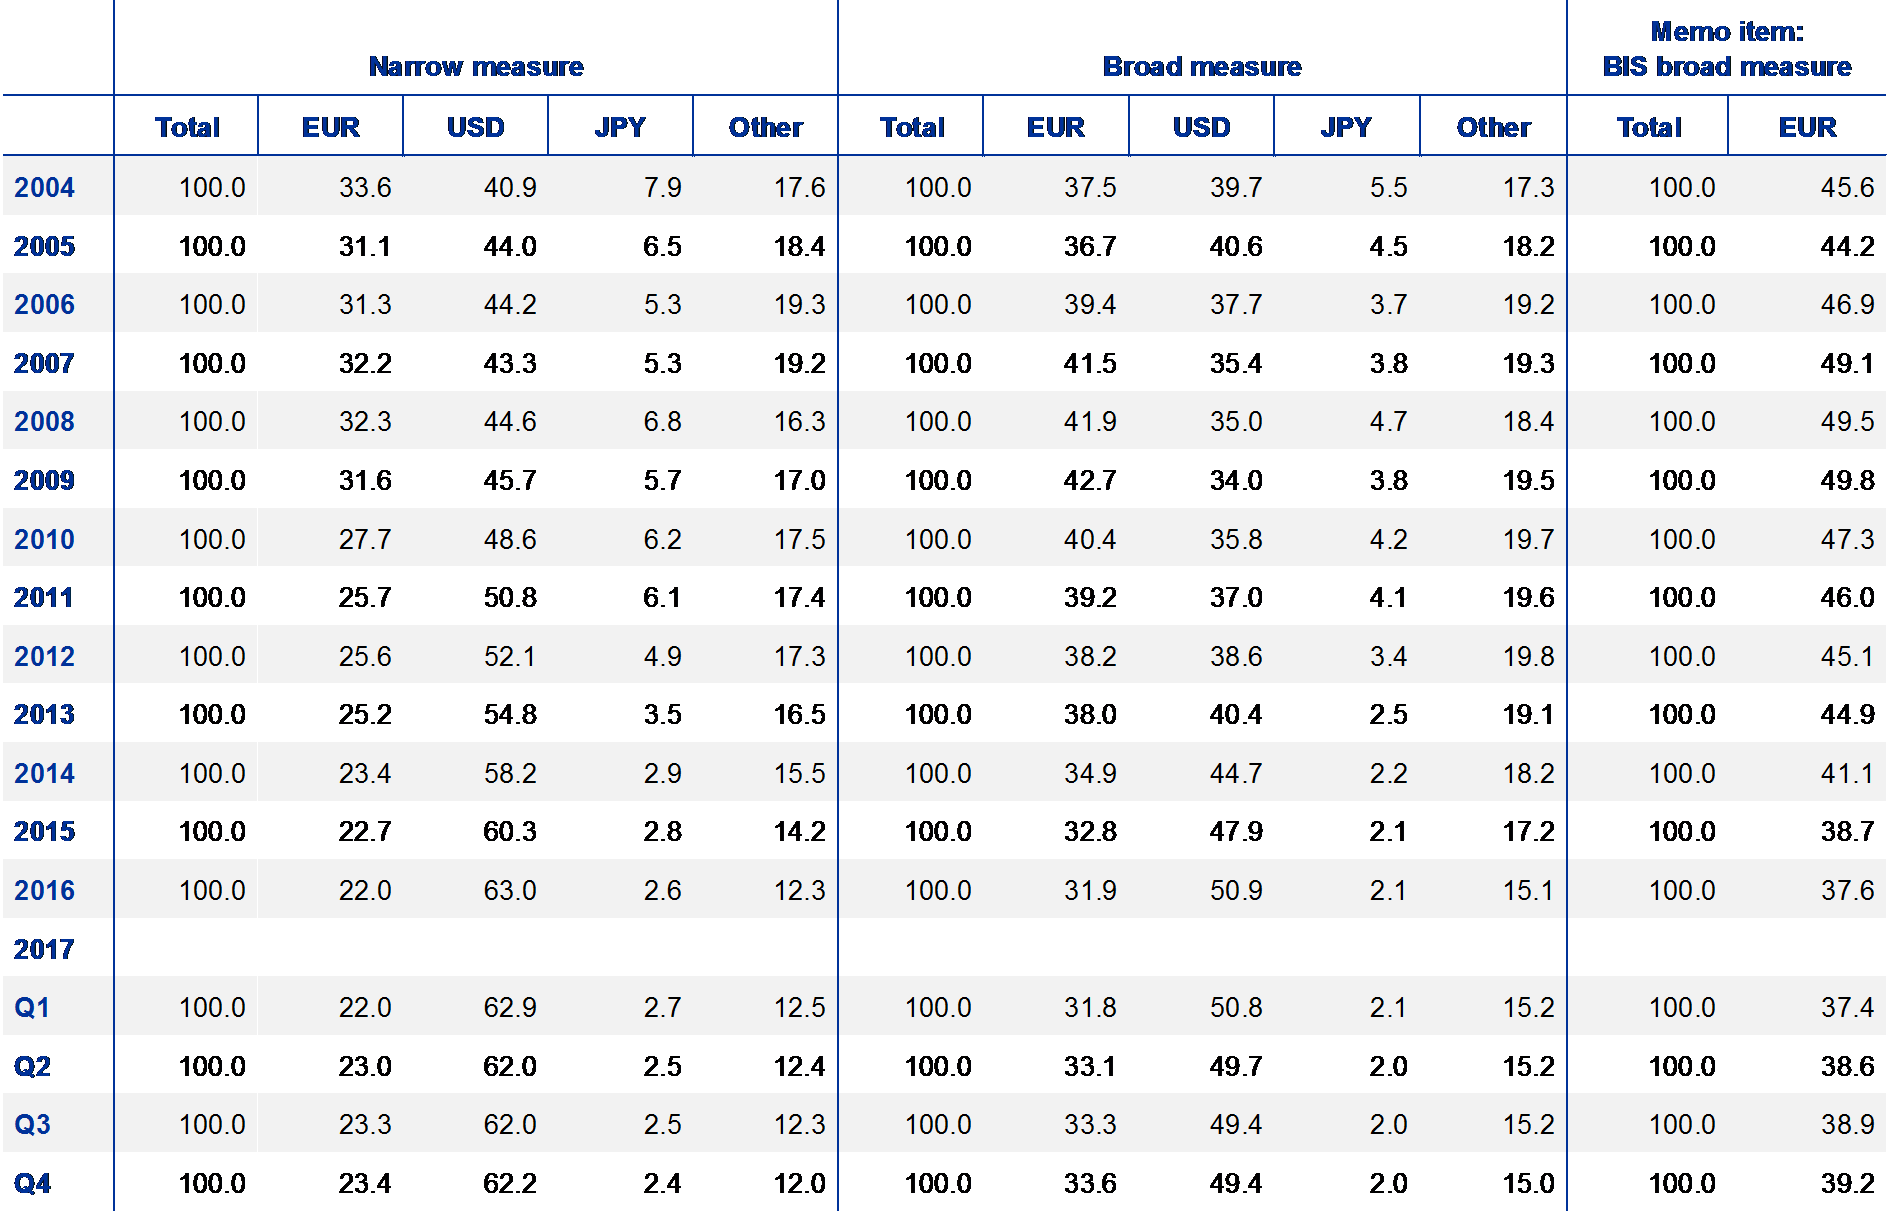
Table 1
The international role of the euro showed signs of broad stabilisation in 2017
Summary of data in this report
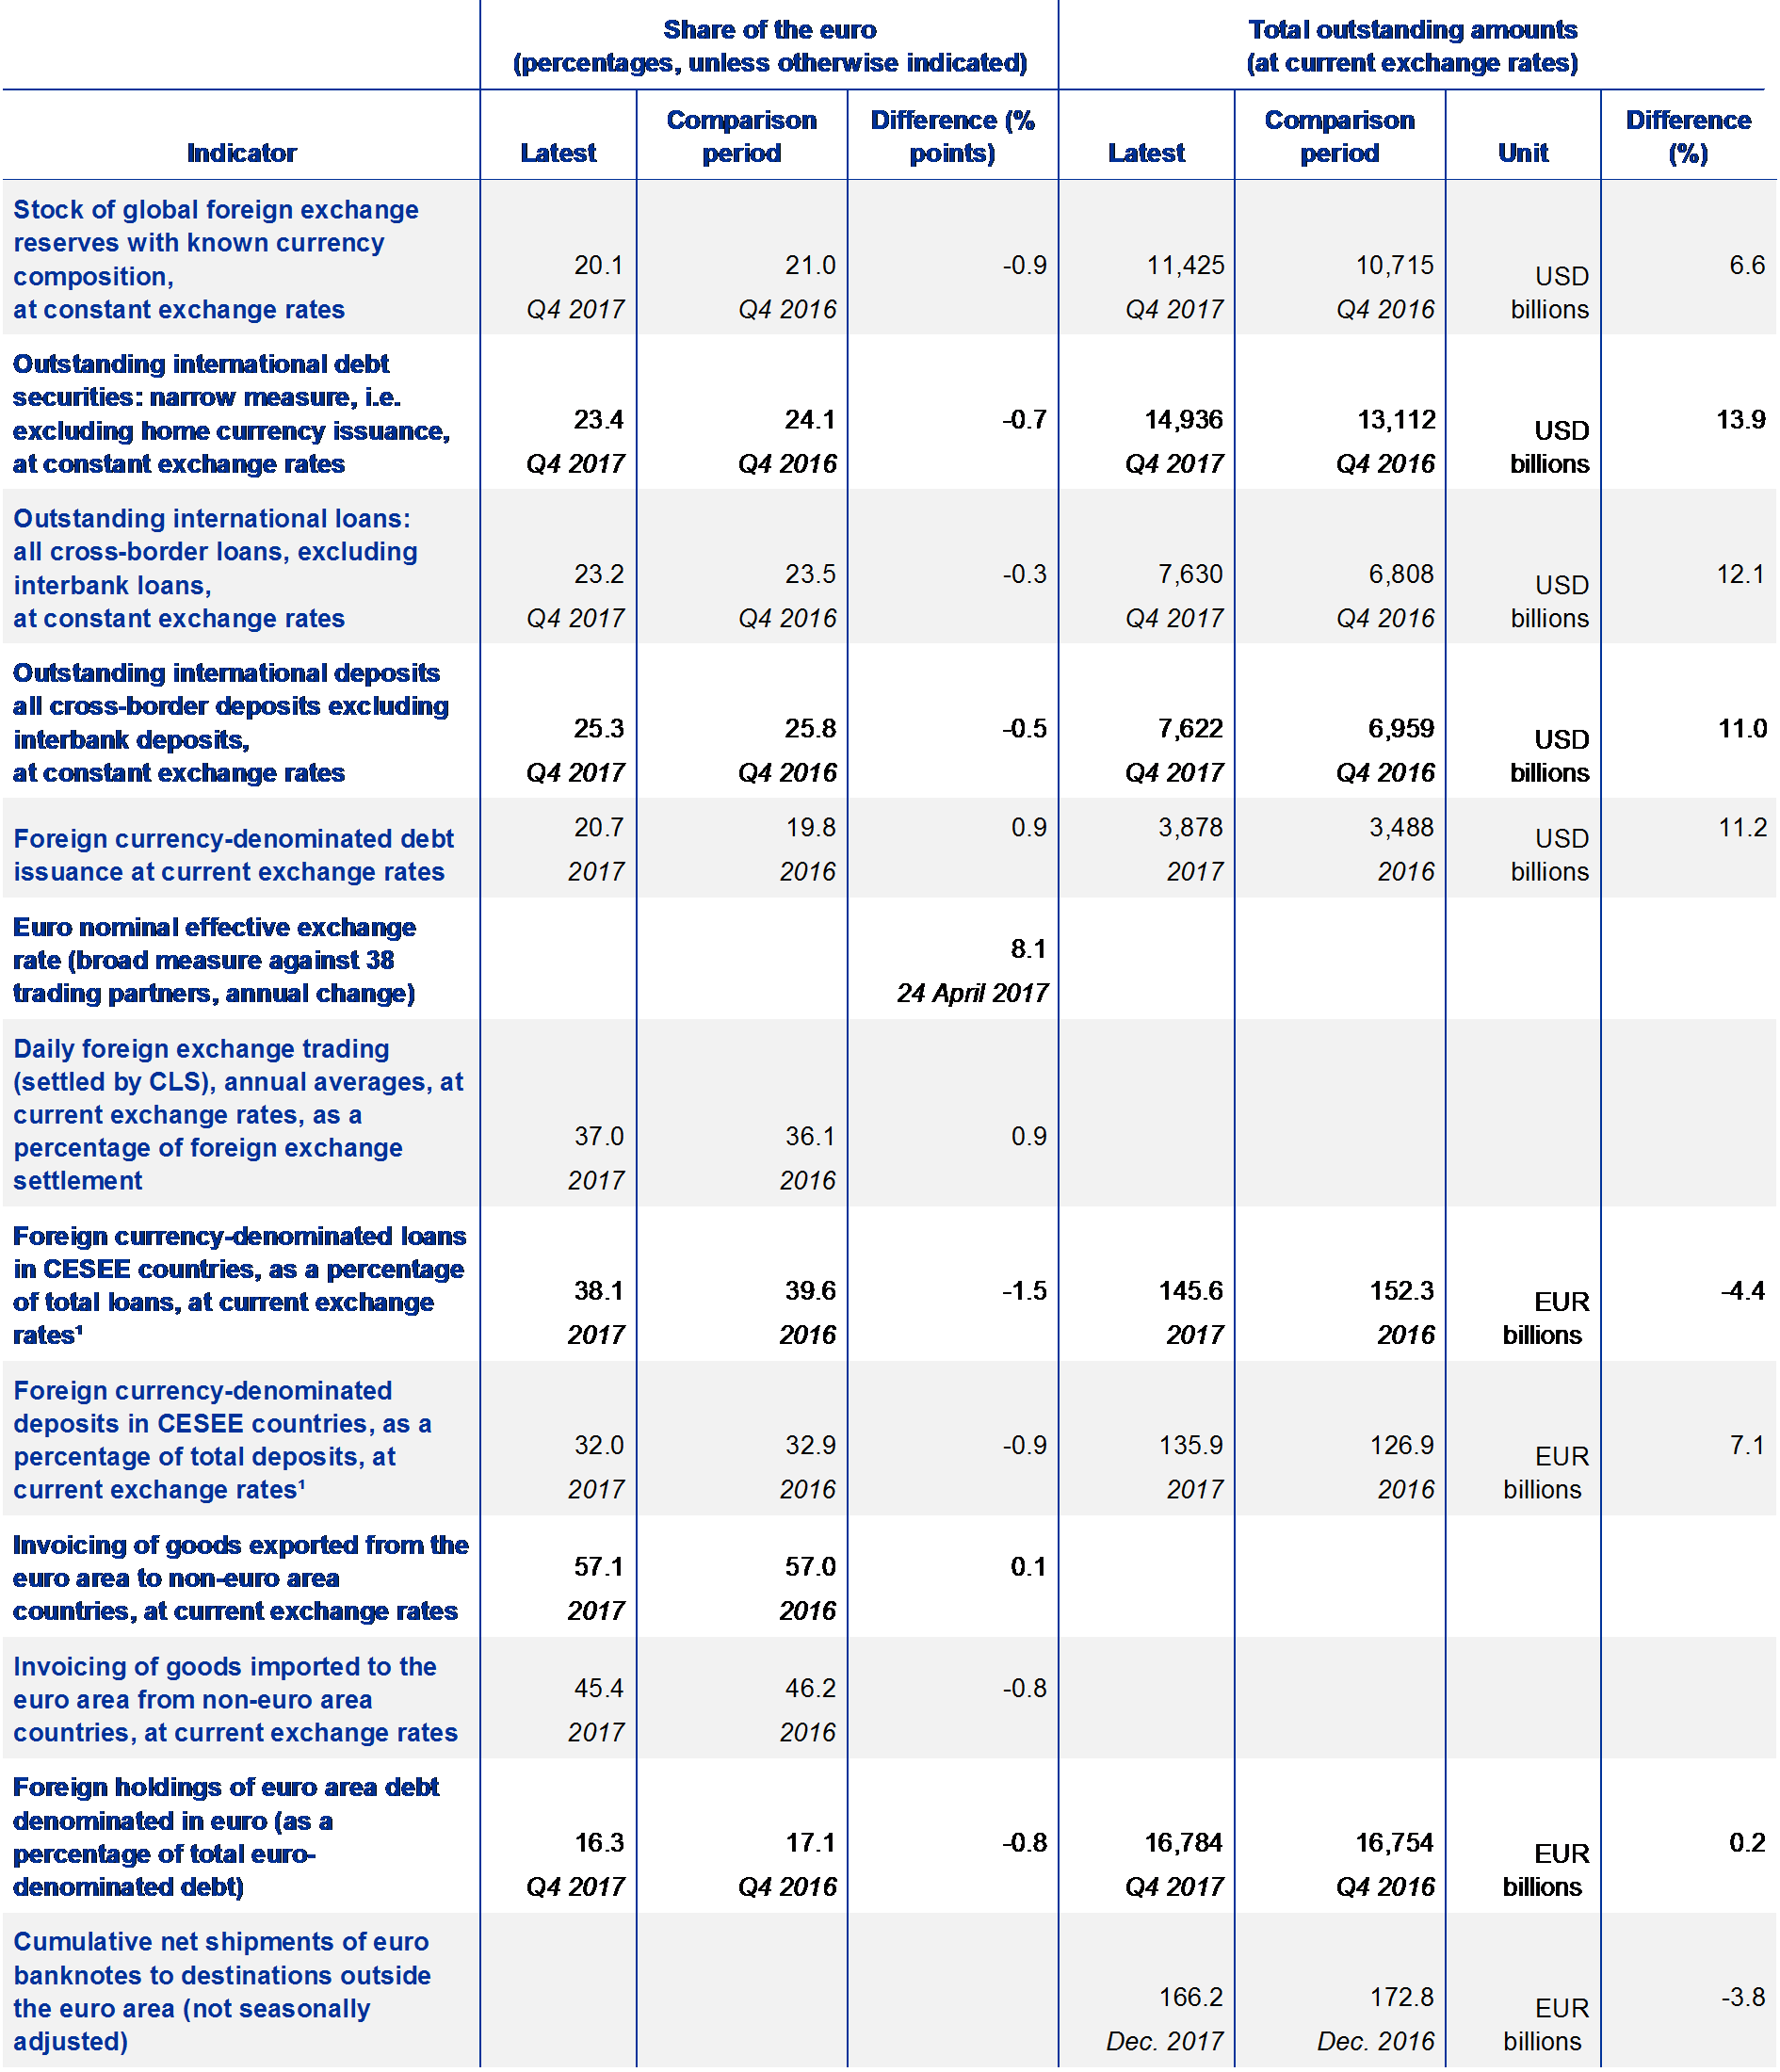
Sources: BIS, CLS, Dealogic, IMF, national sources and ECB calculations.
Note: Outstanding amounts refer to outstanding amounts of foreign currency total amounts.
2 Key developments
2.1 Use of the euro as an international reserve, payment and investment currency
2.1.1 The euro as an international reserve currency
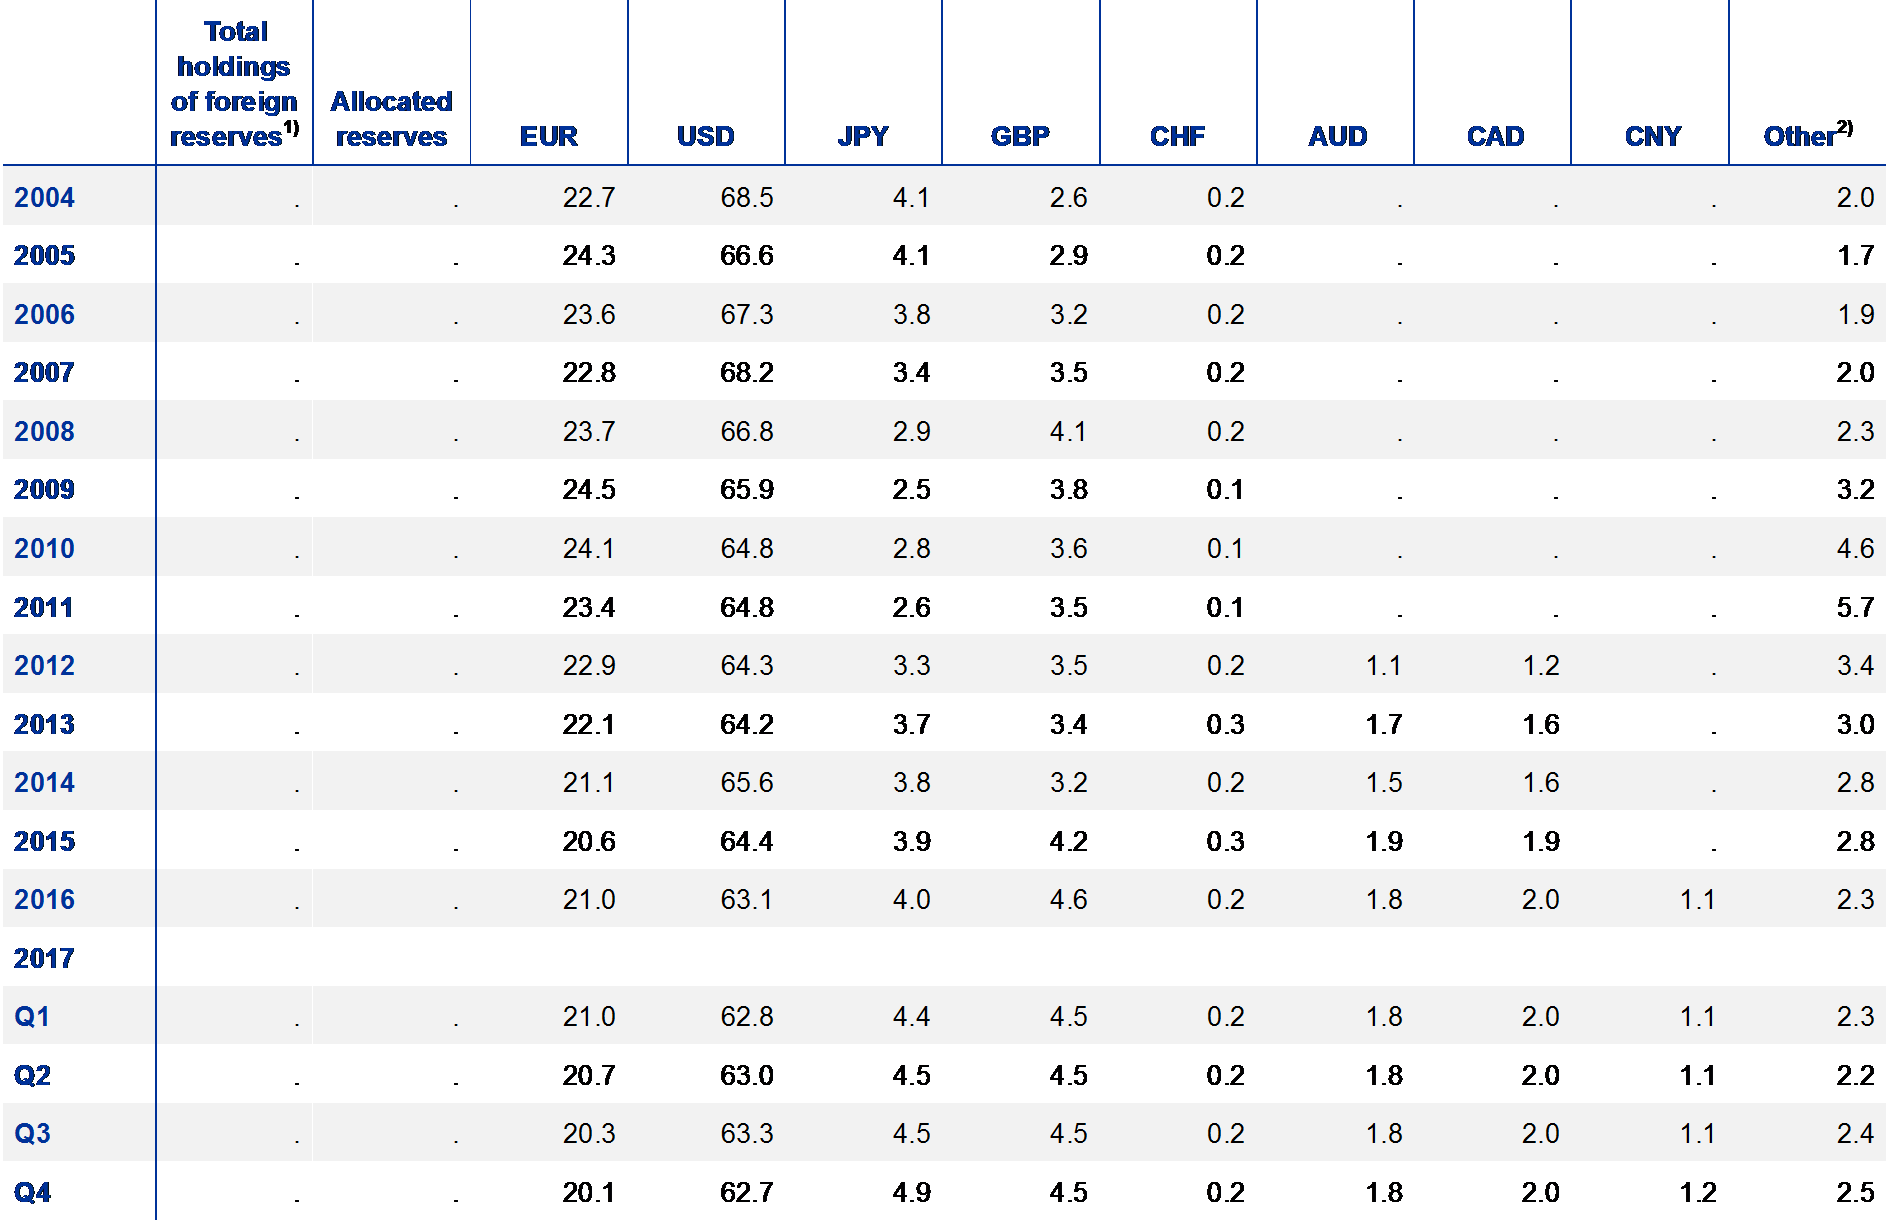
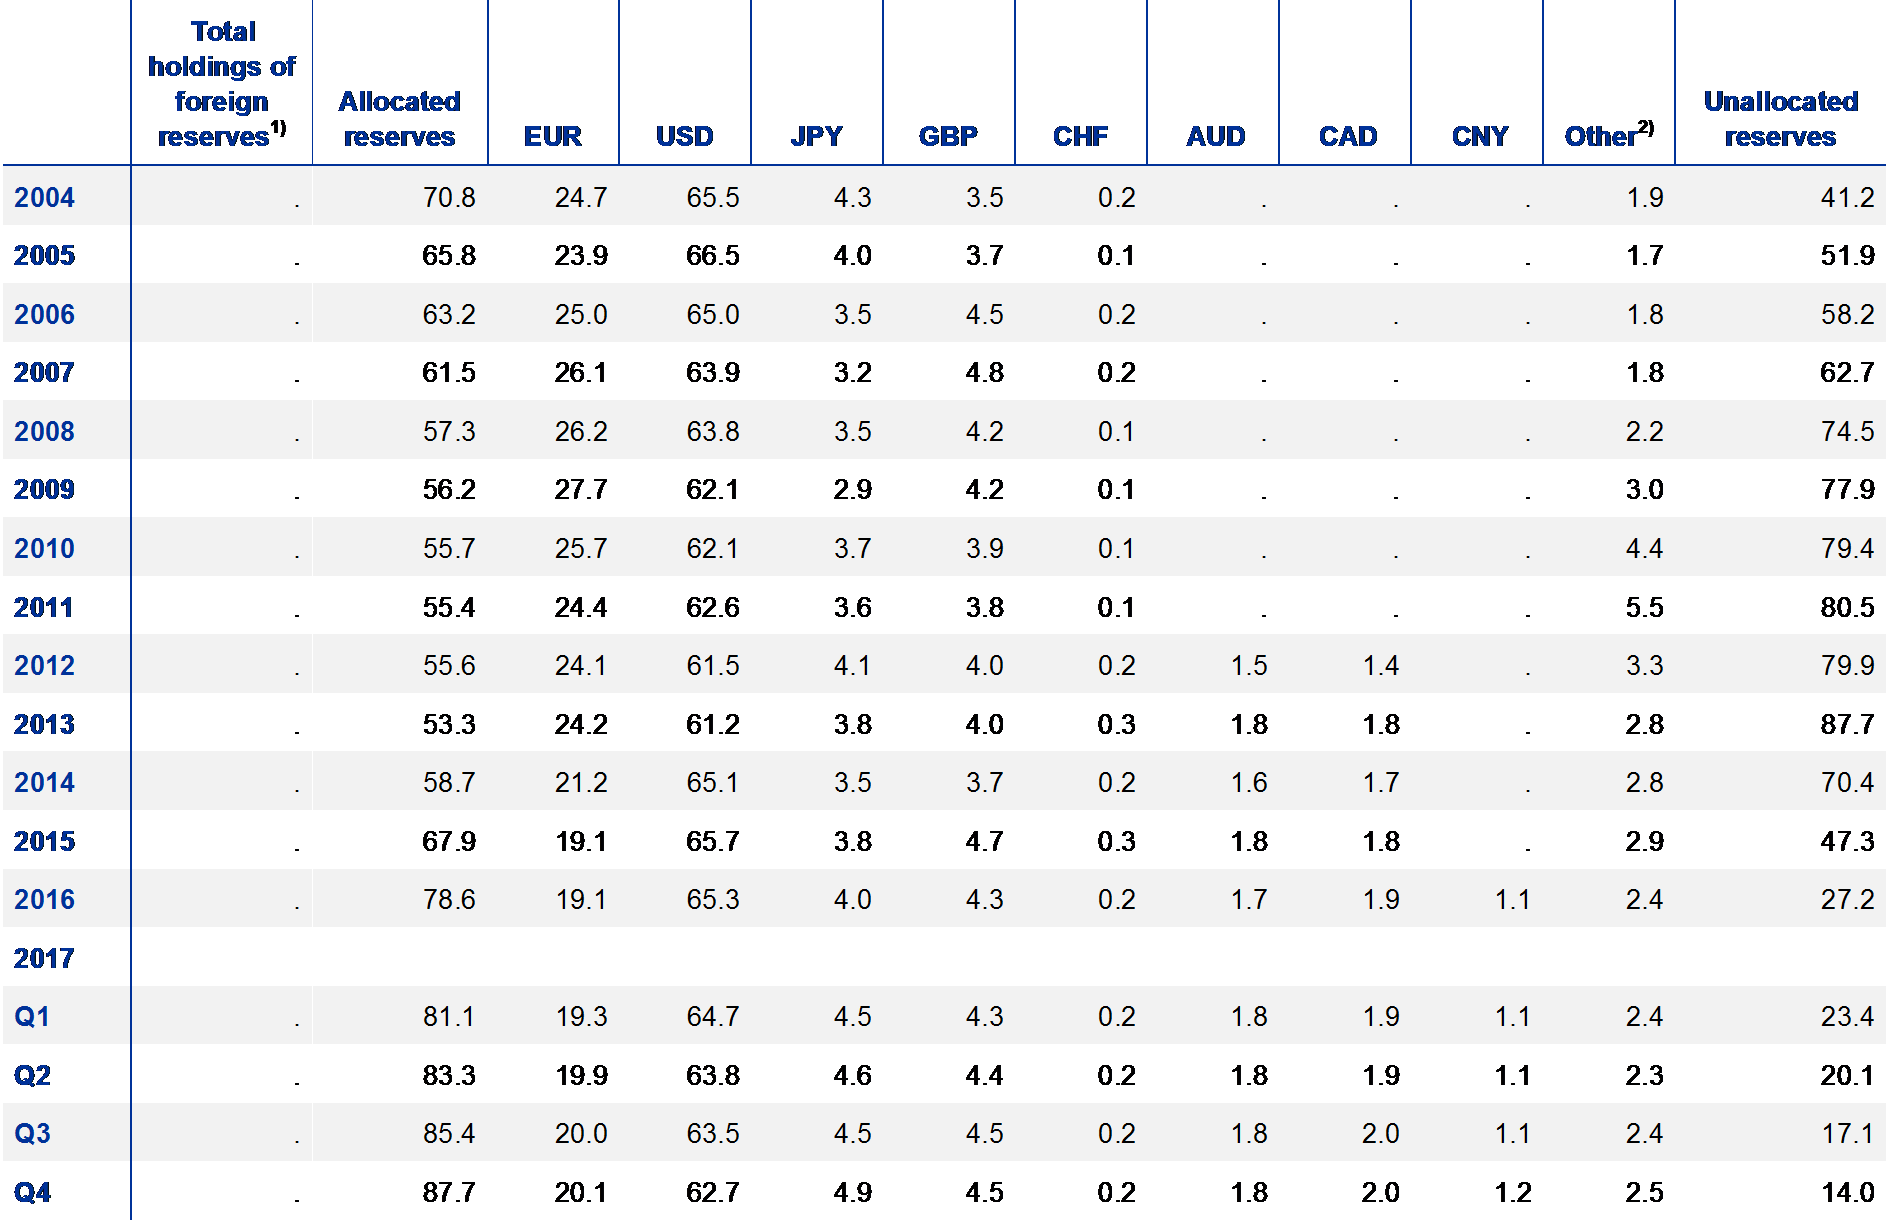
The share of the euro in global official holdings of foreign exchange reserves rebounded in 2017, albeit from low levels. At current exchange rates, the share of the euro in globally disclosed holdings of foreign exchange reserves increased by a full percentage point to 20.1% in the fourth quarter of 2017 from 19.1% at the end of 2016 (see Chart 3 and Table A1). The share of the euro started to increase noticeably in the second quarter of 2017. The share of the US dollar fell in tandem, by almost three percentage points, from 65.3% at the end of 2016 to 62.7% in the fourth quarter of 2017, standing at a four-year low.
Chart 3
The share of the euro at market exchange rates in global foreign exchange reserves increased in 2017
Currency composition of global foreign exchange reserves
(percentages; at current exchange rates)
Sources: IMF and ECB calculations.
Note: The latest observation is for the fourth quarter of 2017.
These developments do not necessarily point to active rebalancing of official reserve portfolios away from the US dollar into the euro. It has been suggested that the weakness in the US dollar in the foreign exchange market in 2017 might reflect decisions by official reserve managers to shift a share of their holdings away from US dollar-denominated assets into other currencies, such as the euro.[2] This interpretation is not borne out by the data, however, insofar as the rise in the share of the euro in global foreign exchange reserves last year reflected the strengthening of the euro exchange rate against the US dollar. Adjusting for exchange rate movements, the share of the euro in globally disclosed holdings of foreign exchange reserves fell by almost a full percentage point relative to the end of 2016, while the share of the US dollar lost around half a percentage point (see Chart 4). This therefore suggests that the nominal increase in the share of the euro in global foreign reserve portfolios should be interpreted as a sign of passive diversification (i.e. through valuation changes) on the part of official reserve holders, not necessarily as active diversification through outright euro purchases.
Chart 4
The increase in the share of the euro reflects exchange rate valuation effects
Share of the euro in global foreign exchange reserves
(percentages; at current and Q4 2017 exchange rates)
Sources: IMF and ECB calculations.
Note: The latest observation is for the fourth quarter of 2017.
Turning to other major currencies, the share of the yen in global foreign exchange reserves increased by almost a full percentage point over the review period (at both current and constant exchange rates). It is unclear whether this increase is due to the yen’s traditional status as a safe haven. Global risk aversion, as measured by the VIX index – a standard market metric of implied volatility in US equity prices – remained low in 2017 and surged briefly in February 2018. Moreover, despite uncertainties raised by negotiations about the United Kingdom’s withdrawal from the European Union, the share of the pound sterling in global foreign exchange reserves remained broadly stable in 2017. As noted in last year’s report, according to evidence gathered in a survey of 80 official reserve managers, collectively managing around half of the world’s USD 12 trillion in reserves, more than 70% of the respondents indicated that Brexit had not led them to reassess their views of the pound sterling in the long run.[3]
The share of non-traditional reserve currencies[4] in global foreign exchange reserves rose further in 2017, standing about half a percentage point higher than at the end of 2016 at current exchange rates (as against 0.3 percentage point at constant exchange rates; see Chart 5). Official reserve managers increased their exposures to the Australian dollar and the Canadian dollar, whose shares in global foreign exchange reserves rose, in an environment of rising oil prices, which traditionally benefits “commodity” currencies.[5] Since the fourth quarter of 2016, the IMF separately identifies official reserve holdings denominated in renminbi given its inclusion in the Special Drawing Right (SDR) basket. These holdings stood at a low level, i.e. slightly above 1% of global foreign exchange reserves, which reflects, to some extent, the fact that the Chinese currency is still not fully convertible, not least after the temporary reintroduction of capital controls in China in 2016 which, since then, have been gradually lifted.
Chart 5
The share of non-traditional reserve currencies rose further
Currency composition of global foreign exchange reserves
(percentages; at Q4 2017 exchange rates)

Sources: IMF and ECB calculations.
Notes: The latest observation is for the fourth quarter of 2017. Non-traditional currencies include all currencies other than traditional reserve currencies such as the US dollar, the euro, the yen, the pound sterling and the Swiss franc, such as the Australian dollar, the Canadian dollar and the Chinese renminbi. The share of the Chinese renminbi is also shown separately in the chart.
Central bank reserve managers point to higher interest rates as the main risk to their portfolios in 2018.[6] About 60% of the respondents of a survey of 79 central bank reserve managers responsible for about half of global foreign exchange reserves identified rising interest rates as the main pressing risk going forward, insofar as a large share of their portfolios is made up of debt securities whose valuations are particularly sensitive to interest rate movements (see Chart 6). A large share of the reserve managers indicating that this risk was the most pressing was from emerging market economies. Almost 20% of the reserve managers (in particular those in advanced economies) identified overvalued asset prices as a major challenge. Finally, reserve managers were increasingly confident about the role of the renminbi as a reserve currency. As many as 29 reserve managers contributing to the survey expected the Chinese currency to account for 10-20% of their portfolios by 2020.
Chart 6
Survey evidence pointed to several concerns for reserve managers in April 2018
Main challenge for global reserve allocations according to a central bank survey
(percentages)

Sources: HSBC and Central Banking Publications.
Note: QE stands for quantitative easing.
2.1.2 The euro as an international payment currency
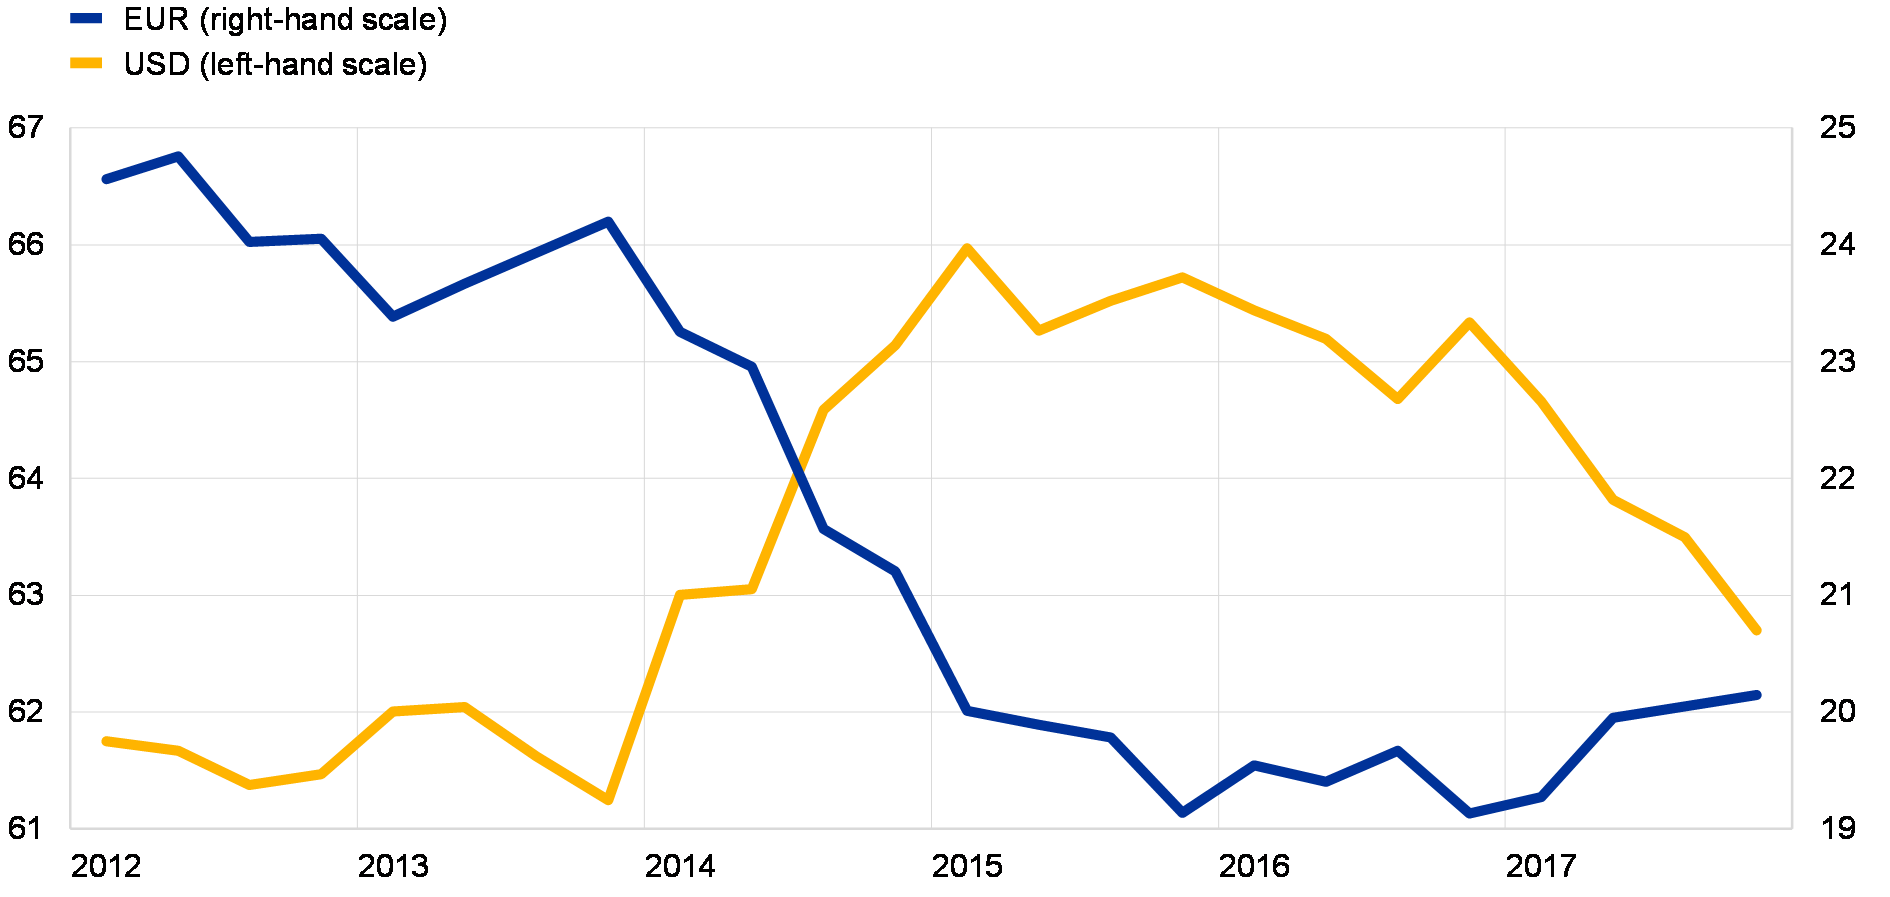
The share of the euro in global payments increased last year. Data collected by the Society for Worldwide Interbank Financial Telecommunication (SWIFT) – the world’s leading provider of secure financial messaging services – show that the share of the euro in value terms in global payments increased from about 31% in 2016 to almost 36% in 2017 (see Chart 7). These data may overestimate the share of the euro, however, to the extent that they include intra-euro area payments. But estimates available from SWIFT for two years (2015 and 2017) which exclude intra-euro area payments confirm that the share of the euro is in the order of 39% and has been rising (see Chart 8).[7] The US dollar remained the most commonly used currency in global payments in 2017 (accounting for about 40% of the payments in question), but its share fell by about two percentage points. Exchange rate valuation effects may again contribute to explaining these developments. Payments in pounds sterling and yen remained broadly stable. The share of the renminbi continued to fall, which might reflect the capital controls that China introduced in 2016 and started to remove only recently, suggesting that the renminbi’s ascent as a currency for global international payments has paused.[8]
Chart 7
The share of the euro in global payments continued to increase
Currency composition of global payments
(percentages)

Source: SWIFT.
Notes: Customer-initiated and institutional payments. Estimates based on the value of MT 103 and MT 202 domestic and cross-border messages exchanged over SWIFT.
Chart 8
The share of the euro in cross-border payments is also higher
Currency composition of cross-border payments
(percentages)

Source: SWIFT.
Notes: Customer-initiated and institutional payments excluding intra-euro area payments. Estimates based on the value of MT 103 and MT 202 cross-border messages exchanged over SWIFT.
2.1.3 The euro as an international investment currency
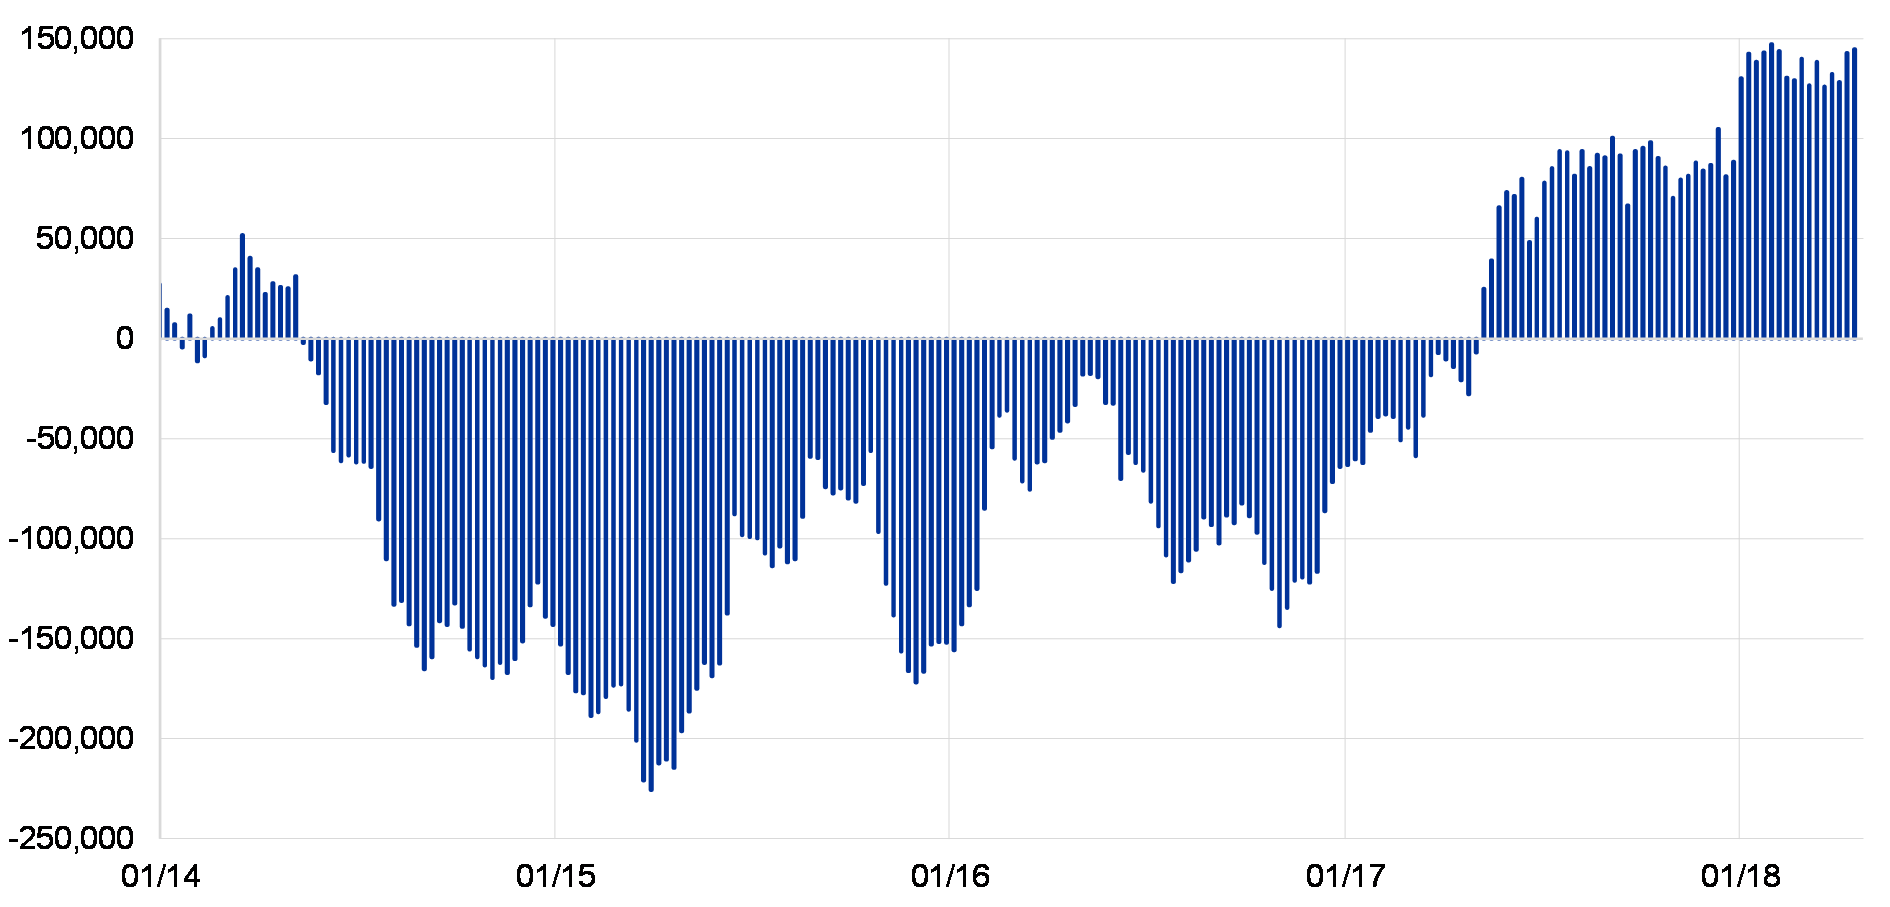
Portfolio inflows into euro area equities reached record highs in 2017. Balance-of-payments data suggest that net purchases of euro area equities by foreign investors quadrupled in 2017 relative to 2016, to reach almost €450 billion in February 2018 (see Chart 9). Never before in the history of the euro area have portfolio equity inflows been so high. Strong and broad-based growth momentum in the euro area economy supported equity market valuations and interest from foreign investors. In contrast, foreign investors continued to retreat from euro area bonds. Against the background of the ECB’s asset purchase programme (APP), foreign investors were net sellers of approximately €210 billion worth of debt securities in 2016, of which €200 billion were bonds. As in 2016, the decline in demand for euro area bonds partly reflected the low yields prevailing in the euro area in the wake of the APP, which might have encouraged some investors to rebalance their portfolios towards high-yielding bonds denominated in other currencies seen as close substitutes.[9]
Chart 9
Record purchases of euro area equities by foreign investors
Net purchases of foreign investors
(volumes in € billions; twelve-month moving sums)

Source: ECB.
Note: The latest observation is for February 2018.
2.2 The euro in global foreign exchange markets
The euro exchange rate strengthened markedly over the review period. Between May 2017 and April 2018, the euro gained about 11% against the US dollar and about 8% in nominal effective terms against the euro area’s 38 major trading partners (see Chart 10). Stronger global investor sentiment towards the euro was an important determinant of the appreciation of the euro against the US dollar. In line with this interpretation, the appreciation started in late April 2017, i.e. following national elections in one large euro area country, while non-commercial (also known as “speculative”) positions in euro futures contracts moved from net short to net long (see Chart 11).
Chart 10
Stronger euro exchange rate in 2017 against the US dollar and in effective terms
Exchange rate of the euro against the US dollar and in nominal effective terms vis-à-vis the currencies of 38 major trading partners

Source: ECB.
Note: The latest observation is for 23 April 2018.
Chart 11
Shift in speculative futures positions to net long in the euro reflected positive investor sentiment
Net non-commercial futures positions in the euro traded on the Chicago Mercantile Exchange
(number of futures contracts)
Sources: Bloomberg and ECB calculations.
Note: The latest observation is for 17 April 2018.
Model-based estimates suggest that the appreciation of the euro against the US dollar, in particular, reflected a combination of stronger investor sentiment towards the euro, stronger euro area growth and shifts in market expectations about prospective monetary policy stances on both sides of the Atlantic. Model-based estimates obtained from a Bayesian vector autoregression (BVAR) model where structural shocks driving the USD/EUR exchange rate are identified via sign restrictions suggest that the euro’s appreciation against the US dollar over the review period can be largely ascribed to stronger investor sentiment towards the euro, to the robust expansion of the euro area economy and to changes in market expectations about the monetary policy stance in the United States relative to that in the euro area (see Chart 12). In particular, the appreciation of the euro against the US dollar in the third quarter of 2017 was driven by a combination of these three factors, each contributing about a third to the overall appreciation of the euro. Over the whole review period, all three factors played a role too, although stronger sentiment was consistently the most important factor. That stronger sentiment vis-à-vis the euro and stronger euro area growth were important drivers of the strengthening of the euro over the review period is also in line with the strong interest of foreign investors in euro area equities in 2017 (as noted in Section 2.1.3).
Chart 12
Stronger sentiment was an important determinant of the strengthening of the euro exchange rate in 2017
Model-based decomposition of the change in the USD/EUR exchange rate over the past year
(percentage points)

Source: ECB calculations.
Notes: Estimates based on a quarterly BVAR model of the USD/EUR exchange rate, relative GDP (euro area versus US), relative CPI (euro area versus US) and shadow interest rate differentials (euro area versus US) where shocks are identified via sign restrictions. The latest observation is for Q4 2017.
Evidence on the role of the euro in the foreign exchange market based on quantities points to similar conclusions. In the absence of updated data from the triennial survey conducted by the Bank for International Settlements – which was last released in December 2016 and was commented upon in last year’s report – quantity-based evidence on the role of the euro in the foreign exchange market can be gleaned from data on foreign exchange transactions settled in the Continuous Linked Settlement (CLS) system, operated by a specialised financial institution providing settlement services to its members in the foreign exchange market (see Chart 13).[10] Although the data are volatile, they indicate that the share of the euro in global foreign exchange settlements increased noticeably in 2017, by about 4 percentage points to about 38% over the past year. The pick-up in settlements was particularly visible around April and May 2017. That being said, the US dollar remained the leading currency in the foreign exchange market by a wide margin, being involved in about 91% of all settlements in January 2018, while the euro remained the second most actively settled currency.
Chart 13
The share of the euro in global foreign exchange turnover increased in 2017
Share of foreign exchange transactions settled in CLS
(percentages)

Sources: CLS and ECB calculations.
Note: The latest observation is for January 2018.
2.3 Use of the euro in international debt and loan markets
2.3.1 The euro in international debt markets
The share of the euro in the stock of international debt securities declined slightly in 2017 (see Chart 14 and Table A4). At constant exchange rates, the share of the euro declined by more than half a percentage point, to 23.4%. It remains well below the levels prevailing before the onset of the global financial crisis.[11] The US dollar further expanded its dominant role in international debt markets, with its share increasing by over a percentage point, to 62.2%. Since the peak of 2004, the share of the euro has declined by about eight percentage points, while that of the US dollar has increased by close to 19 percentage points.
Chart 14
The euro’s share in the stock of international debt securities declined slightly in 2017
Currency composition of outstanding international debt securities
(percentages; at Q4 2017 exchange rates)

Sources: BIS and ECB calculations.
Notes: Narrow measure. The latest data are for the fourth quarter of 2017.
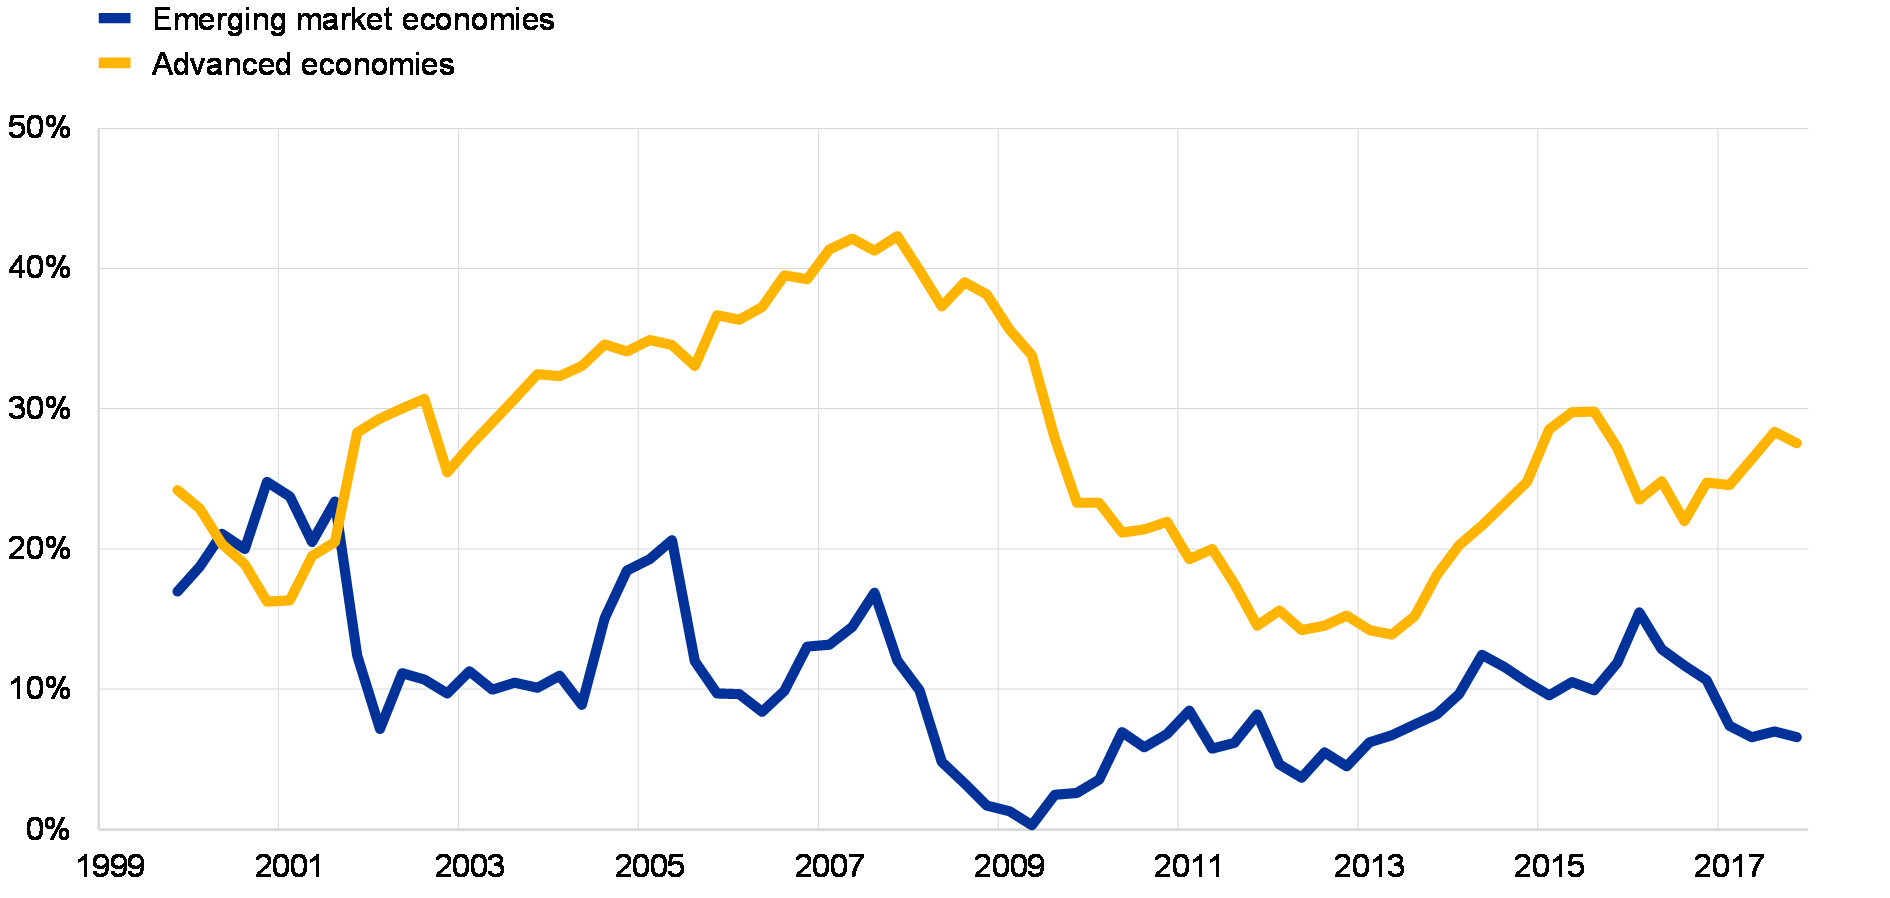
Developments in the issuance of international debt point to a slight increase in the role of the euro, however. Developments in issuance reflect more clearly recent trends in international debt markets than developments in stocks. By this metric, the share of the euro stood at 21% in the fourth quarter of 2017, up from 20% in the fourth quarter of 2016 (see Chart 15). Debt issuance in euro by emerging market borrowers continued to decline, while issuance by borrowers in advanced economies increased (see Chart 16).
Chart 15
Share of the euro in foreign currency-denominated debt issuance stable
Currency composition of foreign currency-denominated debt issuance
(percentages)

Sources: Dealogic and ECB calculations.
Note: The latest data are for the fourth quarter of 2017.
The volume of euro-denominated foreign currency debt issuance remains well below pre-global financial crisis peaks. In 2017 non-euro area residents issued USD 800 billion worth of euro-denominated debt, which is slightly more than half of the volume issued in 2007 (USD 1.5 trillion). US dollar-denominated debt issuance by non-US residents also sharply declined after the global financial crisis. However, it recovered quickly, reaching almost USD 2.7 trillion in 2017, an increase of 40% relative to the pre-crisis peaks. Dynamic borrowing by emerging market issuers, which have sought to take advantage of historically low levels of interest rates, is seen as one reason explaining the significant increase in US dollar-denominated issuance in the past few years. [12]
Chart 16
Stronger issuance of euro-denominated debt by borrowers in advanced economies
Share of euro-denominated foreign currency debt issuance in advanced and emerging market economies
(percentages)
Sources: Dealogic and ECB calculations.
Note: The latest data are for the fourth quarter of 2017.
The preference of emerging market borrowers for the US dollar as a funding currency is one persistent factor behind the decline in the share of the euro in international debt markets. As noted in earlier issues of the report, borrowers in advanced economies, notably the United States and the United Kingdom, have historically accounted for the bulk of international debt issuance (see Chart 17). The increase in the euro’s share in international debt markets prior to the global financial crisis largely reflected the rise in international debt issuance in these two economies. Since the global financial crisis, however, international debt issuance by emerging market economies in Asia, Latin America and the Middle East – which trade significantly with the United States or anchor their currencies to the US dollar and therefore have a traditional dollar orientation – has been particularly strong. The share of emerging market economies in euro-denominated international debt issuance remained below 10% in 2017, as against one-third in US dollar-denominated international debt issuance.
Chart 17
US and UK residents still the main issuers of euro-denominated international debt
Country breakdown of euro-denominated international debt issuance
(percentages)

Sources: Dealogic and ECB calculations.
Note: The latest data are for the fourth quarter of 2017.
Private borrowers remained the main issuers of euro-denominated international bonds. As in previous years, financial institutions were active borrowers in euro-denominated international bond markets, accounting for half of total issuance (see Chart 18). Borrowers from the construction and manufacturing sector accounted for a quarter of total issuance, followed by borrowers in the transportation and trade sector, with about 17%. Sovereigns and borrowers in the mining sector took up the residual, i.e. less than 10% of total issuance.
Chart 18
Financial institutions were the main issuers of euro-denominated international debt in 2017
Sector breakdown of euro-denominated international debt issuance
(percentages)

Sources: Dealogic and ECB calculations.
A development supportive of the use of the euro as a funding currency in international debt markets might be the gradual decline in the cost of synthetic US dollar borrowing. An important indicator of the appeal of the euro as an international funding currency is the cross-currency swap (CCS) basis. As noted in last year’s report, the CCS basis is important because it determines the euro’s attractiveness as an international funding currency for the synthetic issuance of US dollars. A negative CCS basis is equivalent to paying a premium for borrowing US dollars “synthetically” via another funding currency, such as the euro. The operation consists of borrowing euro and swapping the proceeds by means of a CCS contract to hedge against foreign exchange risk, with the basis being the premium over the price of direct US dollar borrowing in the wholesale money market.[13] The price in question may be e.g. the LIBOR for US dollars. Since the outbreak of the global financial crisis a decade ago, the CCS basis has remained large and negative, albeit volatile. This has discouraged synthetic US dollar issuance via currencies such as the euro and encouraged direct issuance of US dollar-denominated bonds. However, the CCS basis across different maturities declined in the course of 2017. For instance, at the five-year maturity, the basis declined from about 50 to about 30 basis points (see Chart 19), while at the three-month maturity, it narrowed from about 60 to about 10 basis points amid considerable volatility.[14] A smaller CCS basis lowers the premium paid for synthetic dollar borrowing and enhances the attractiveness of the euro as a funding currency. At the same time, the spread between LIBOR and the overnight indexed swap rate, known as LIBOR-OIS spread, has increased strongly, making the price of US dollar short-term funding more expensive. Market commentators have ascribed the decline in the CCS basis at short-term maturities to recent adjustments in US tax regulation.[15]
Chart 19
Cross-currency swap basis of the euro decreased, lowering the cost of using the euro as a funding currency
Cross-currency swap basis against the US dollar at the five-year maturity
(basis points)
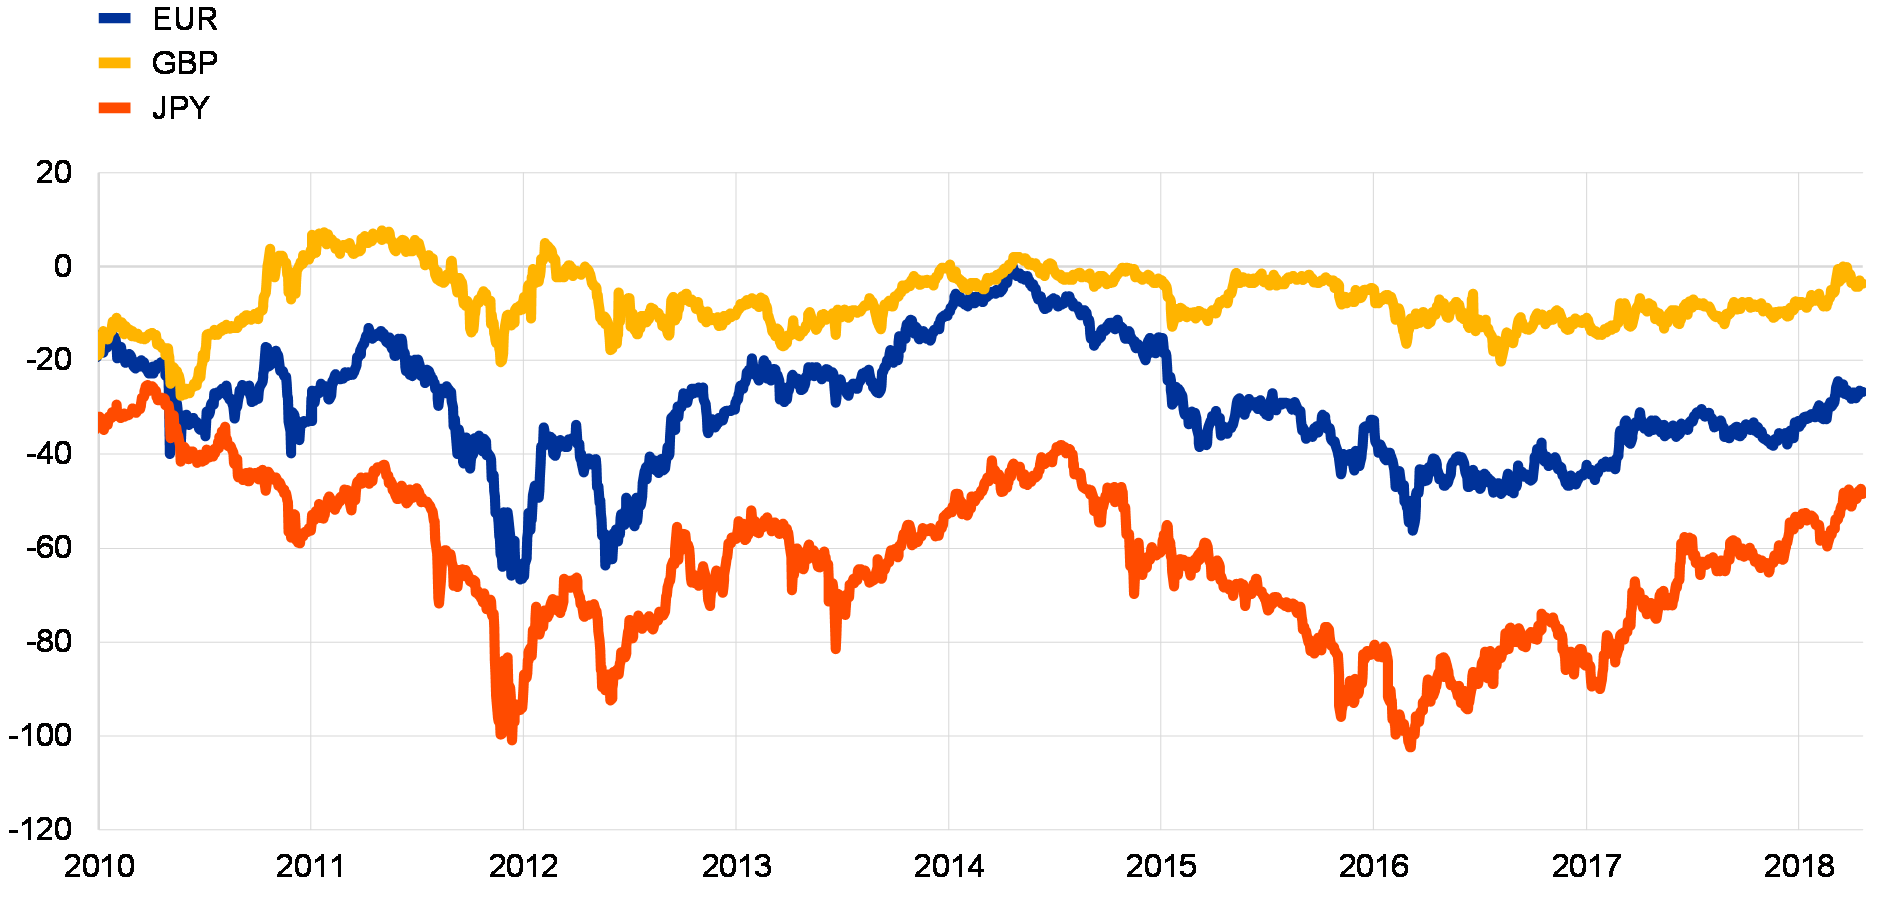
Sources: Bloomberg and ECB calculations.
Note: The latest data are for 23 April 2018.
2.3.2 The euro in international loan markets
The share of the euro in international loan markets remained stable in 2017. The share of the euro in the stock of cross-border loans stood at 23.2% at the end of the review period, a slight decline relative to end-2016 (see Chart 20 and Table A8). The decline in the share of the euro since early 2013 has reflected inter alia the ongoing deleveraging process of euro area banks, including efforts to reduce exposures to foreign loans denominated in the euro.[16]
Chart 20
Share of the euro in outstanding cross-border loans slightly declined in 2017
Currency composition of outstanding amounts of cross-border loans
(percentages; at Q4 2017 exchange rates)
Sources: BIS and ECB calculations.
Note: The latest data are for the fourth quarter of 2017.
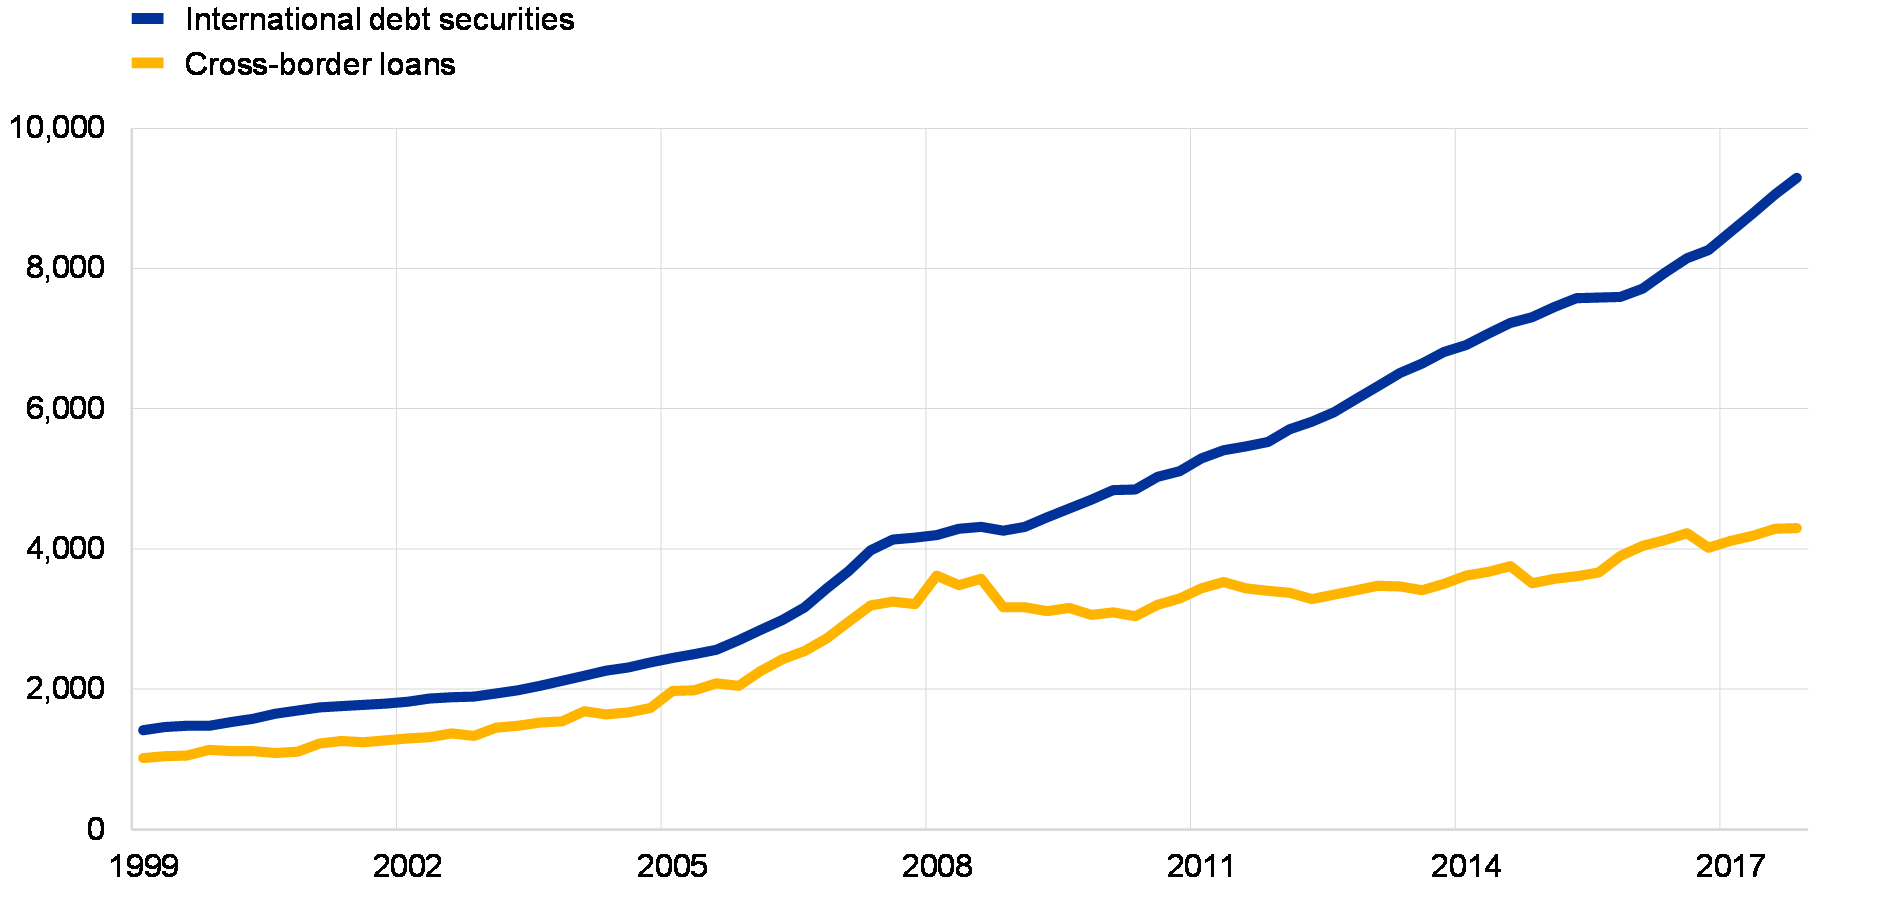
In line with this, recent evidence suggests that the global decline in cross-border banking since 2007 did not reflect a broad-based retrenchment in international lending, which some observers referred to as “financial deglobalisation”. Instead, the decline appears to have been restricted to European banks, which shed assets abroad after 2007 to restore capital ratios and cut lending overseas.[17] The scale of the deleveraging is epitomised by the fact that the stock of cross-border loans denominated in euro still remains short of its pre-global financial crisis peaks (see Chart 21). This stands in contrast to the stock of cross-border loans in US dollars, which recovered quickly after 2007-09 and now stands about 20% higher than pre-crisis peaks (see Chart 22)
Chart 21
Stock of cross-border loans in euro still below pre-global financial crisis peaks
Outstanding amounts
(USD billions)

Sources: BIS and ECB calculations.
Note: The latest data are for the fourth quarter of 2017.
Chart 22
Stock of cross-border loans in US dollars well above pre-global financial crisis peaks
Outstanding amounts
(USD billions)
Sources: BIS and ECB calculations.
Note: The latest data are for the fourth quarter of 2017.
2.4 Other indicators of the euro’s international use
Net monthly shipments of euro banknotes to destinations outside the euro area point to a further decline in foreign demand for euro banknotes in 2017 (see Chart 23).[18] The decline may reflect several factors. First, weaker foreign demand for euro banknotes might be in line with the effects that financial innovation, new transaction technologies, changes in payment infrastructures and consumer preferences have on the demand for cash and its use, as compared with other methods of payment. Second, perceptions of declining geopolitical uncertainty and increasing macroeconomic stability in EU neighbouring regions might also have redirected demand away from euro banknotes, which are traditionally used for hoarding or as a safe haven in these regions. The announcement by the ECB on 4 May 2016 that it would discontinue production and issuance of €500 banknotes might have reduced demand for this denomination, although it remains legal tender. Global efforts under the auspices of the G7 and the G20 to combat tax and financial crime might have been an additional factor.
Chart 23
Foreign demand for euro banknotes continued to decline in 2017
Net monthly shipments of euro banknotes to destinations outside the euro area
(€ billions; adjusted for seasonal effects)
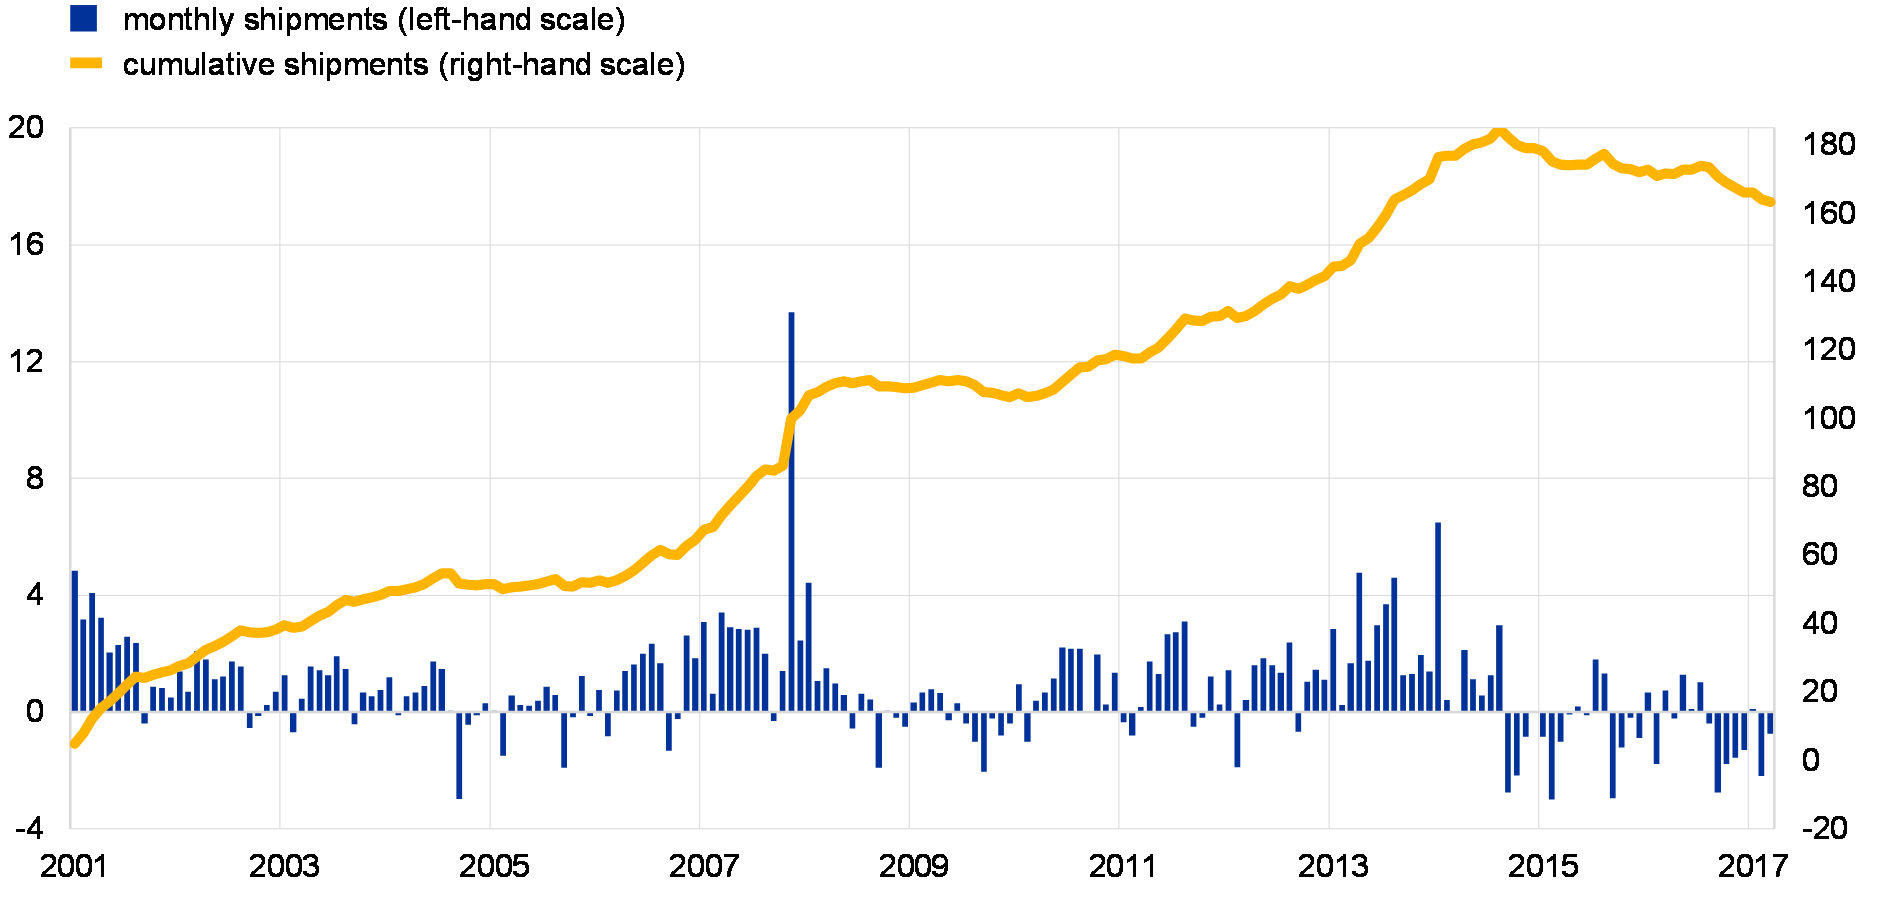
Source: Eurosystem.
Notes: Net shipments are euro banknotes sent to destinations outside the euro area minus euro banknotes received from outside the euro area. The latest observation refers to February 2018.
In terms of destinations, entities in euro area neighbouring countries were the main purchasers of euro banknotes, including the United Kingdom in the EU, Switzerland in the region Western Europe (non-EU) and Russia in the region Eastern Europe (non-EU) (see Chart 24). Euro banknotes were mainly imported from euro area neighbouring countries too, first and foremost from eastern EU countries and Turkey.
Chart 24
Euro area neighbouring regions were the main purchasers of euro banknotes in 2017
Sales of euro banknotes – Breakdown by destination
(percentages)
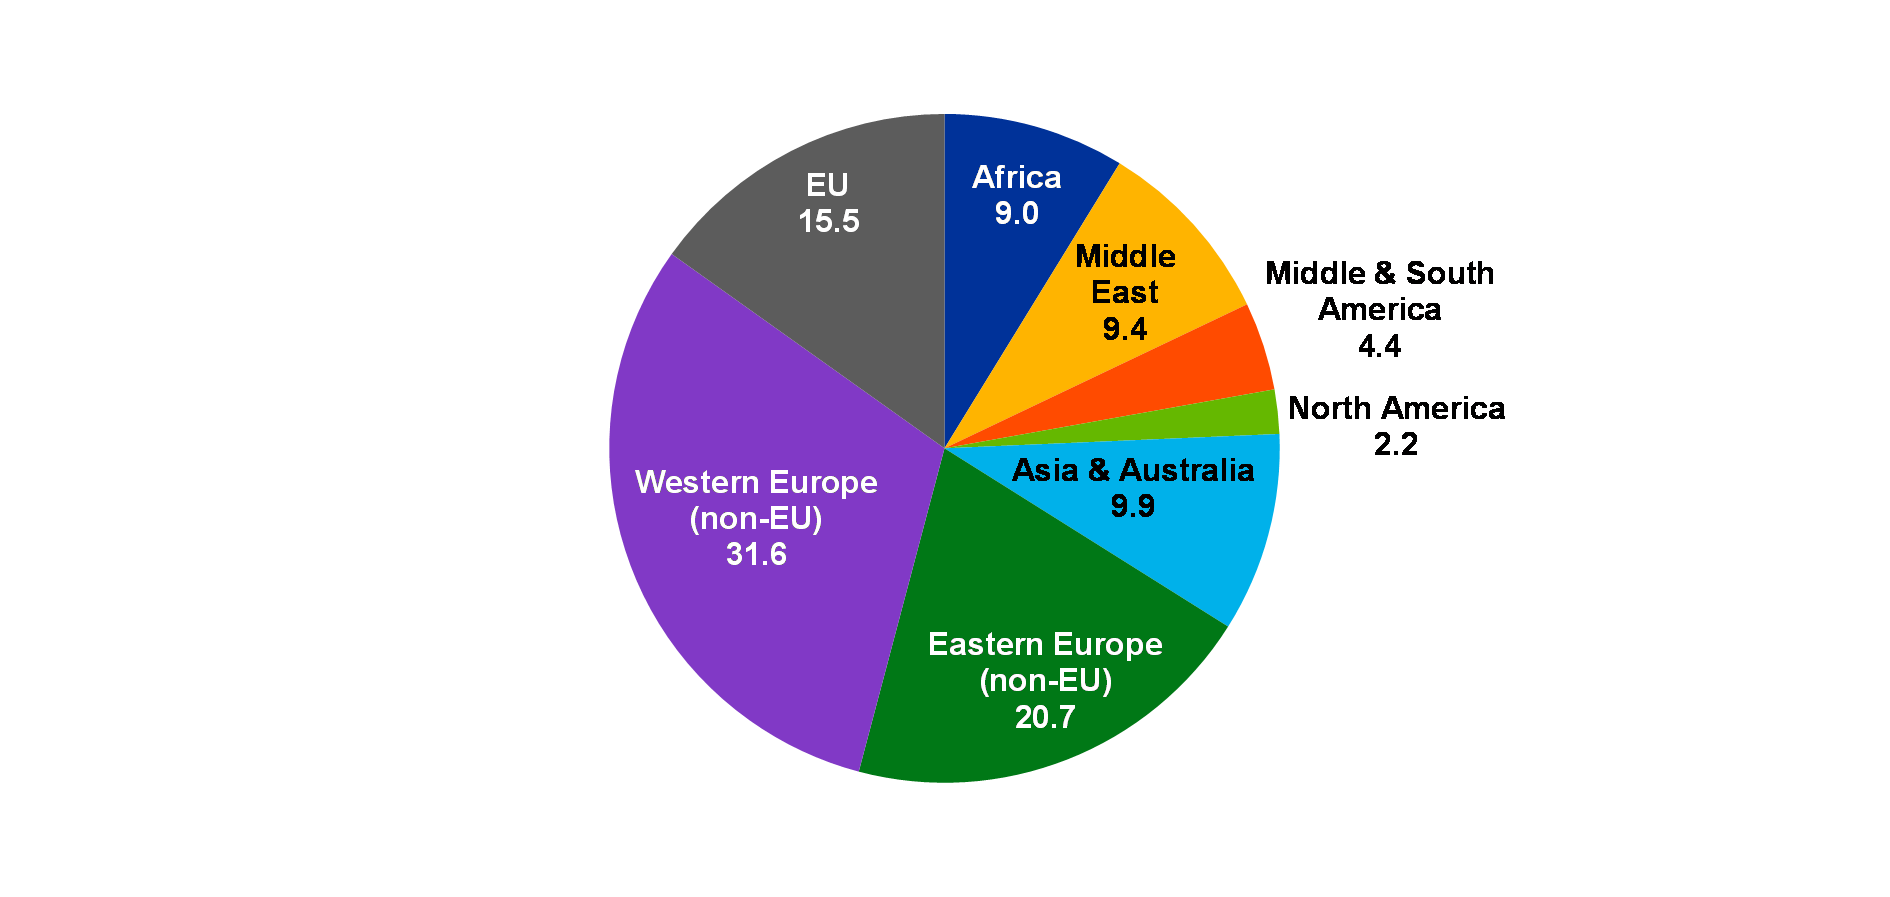
Sources: ECB calculations based on data from international banknote wholesalers.
Note: The data are for the year 2017.
The share of the euro in outstanding loans declined further in central, eastern and south-eastern Europe (see Table A12). As noted in last year’s edition of the report, this may reflect local authorities’ efforts to promote the use of domestic currencies to mitigate financial stability risks raised by unofficial euroisation. The share of the euro in foreign deposits also decreased moderately in some of these countries (see Table A13).
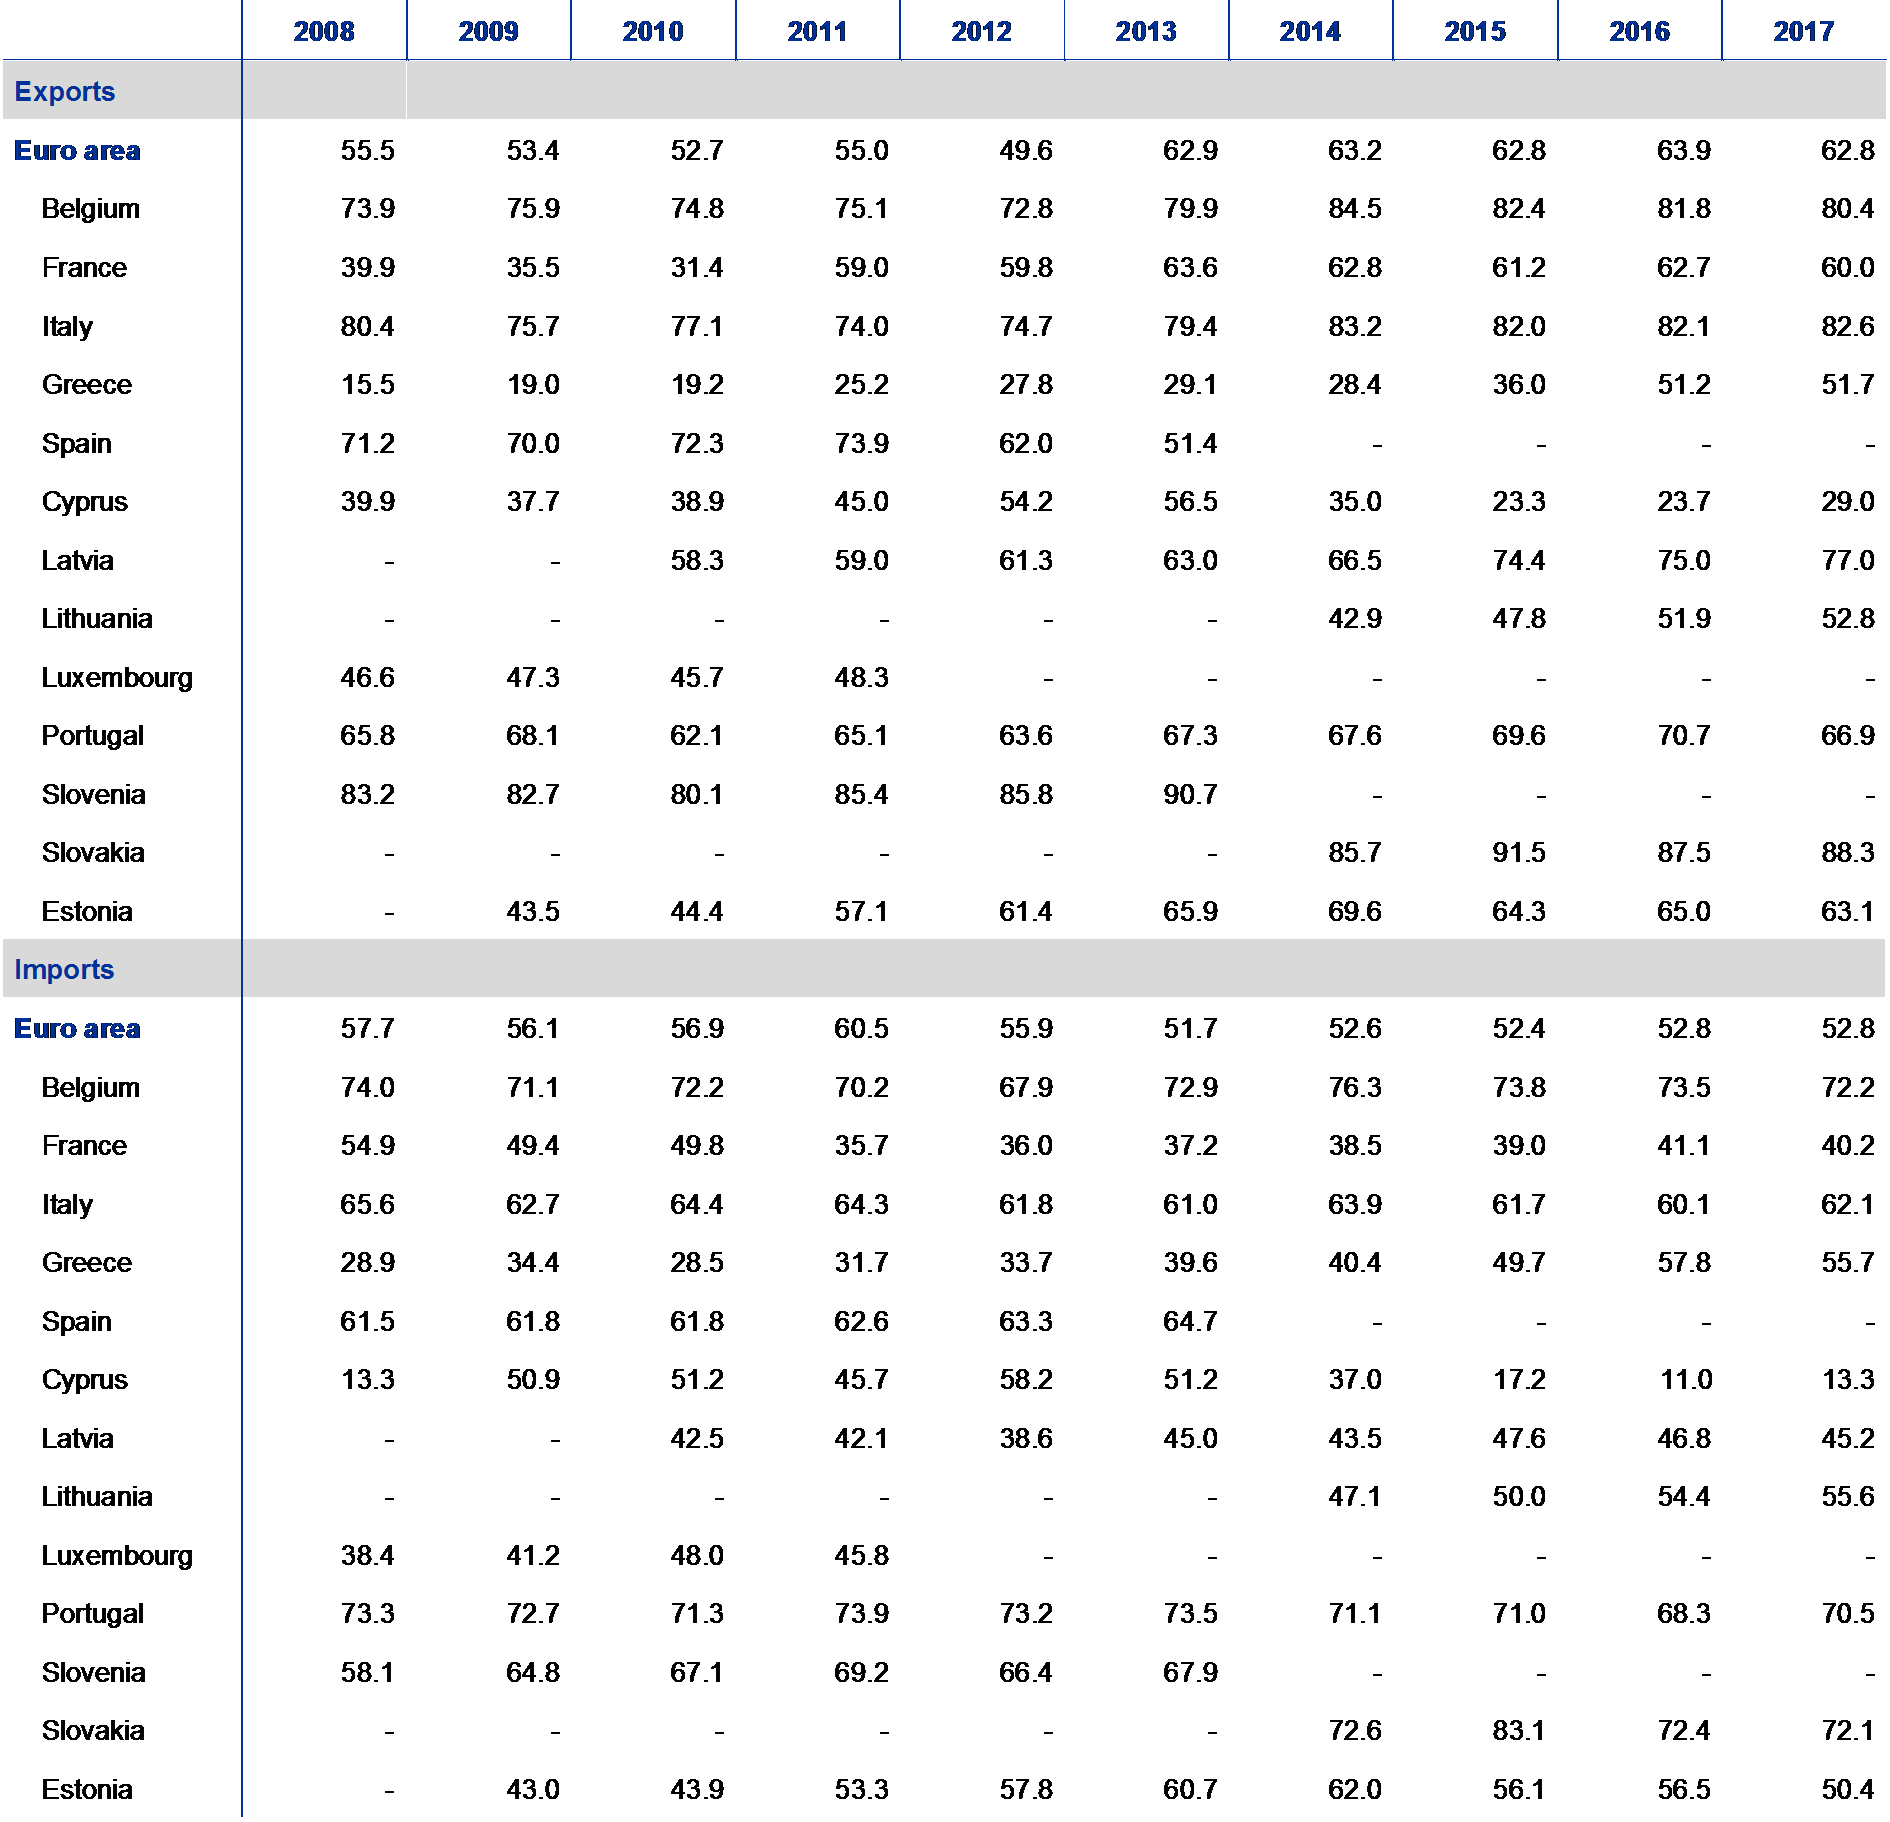
Lastly, the share of the euro as an invoicing or settlement currency for extra-euro area trade in goods remained broadly stable for exports, while declining slightly for imports. In 2017, about 57% of extra-euro area exports and 45% of extra-euro area imports of goods were invoiced in euro (see Table A10). These shares were slightly higher for extra-euro area trade in services, with about 63% of exports and 53% of imports being invoiced in euro in 2017.
3 Statistical annex
3.1 The euro in global foreign exchange reserves and exchange rate anchoring
Table A1
Global holdings of foreign exchange reserves
Outstanding amounts
(in USD billions, at current exchange rates, end of period)

Currency shares in foreign exchange reserves with disclosed currency composition
(at constant exchange rates, end of period)
Currency shares in foreign exchange reserves with disclosed currency composition
(at current exchange rates, end of period)
Sources: IMF and ECB calculations.
Notes: 1) The total includes unallocated reserves, i.e. reserves with undisclosed currency composition, as well as allocated reserves with disclosed currency composition. 2) The category “other” includes all allocated reserves with disclosed currency composition not explicitly mentioned in the table.
Table A2
Currency composition of foreign exchange reserves for selected countries
(percentage share of the euro in foreign exchange reserve holdings at current exchange rates)
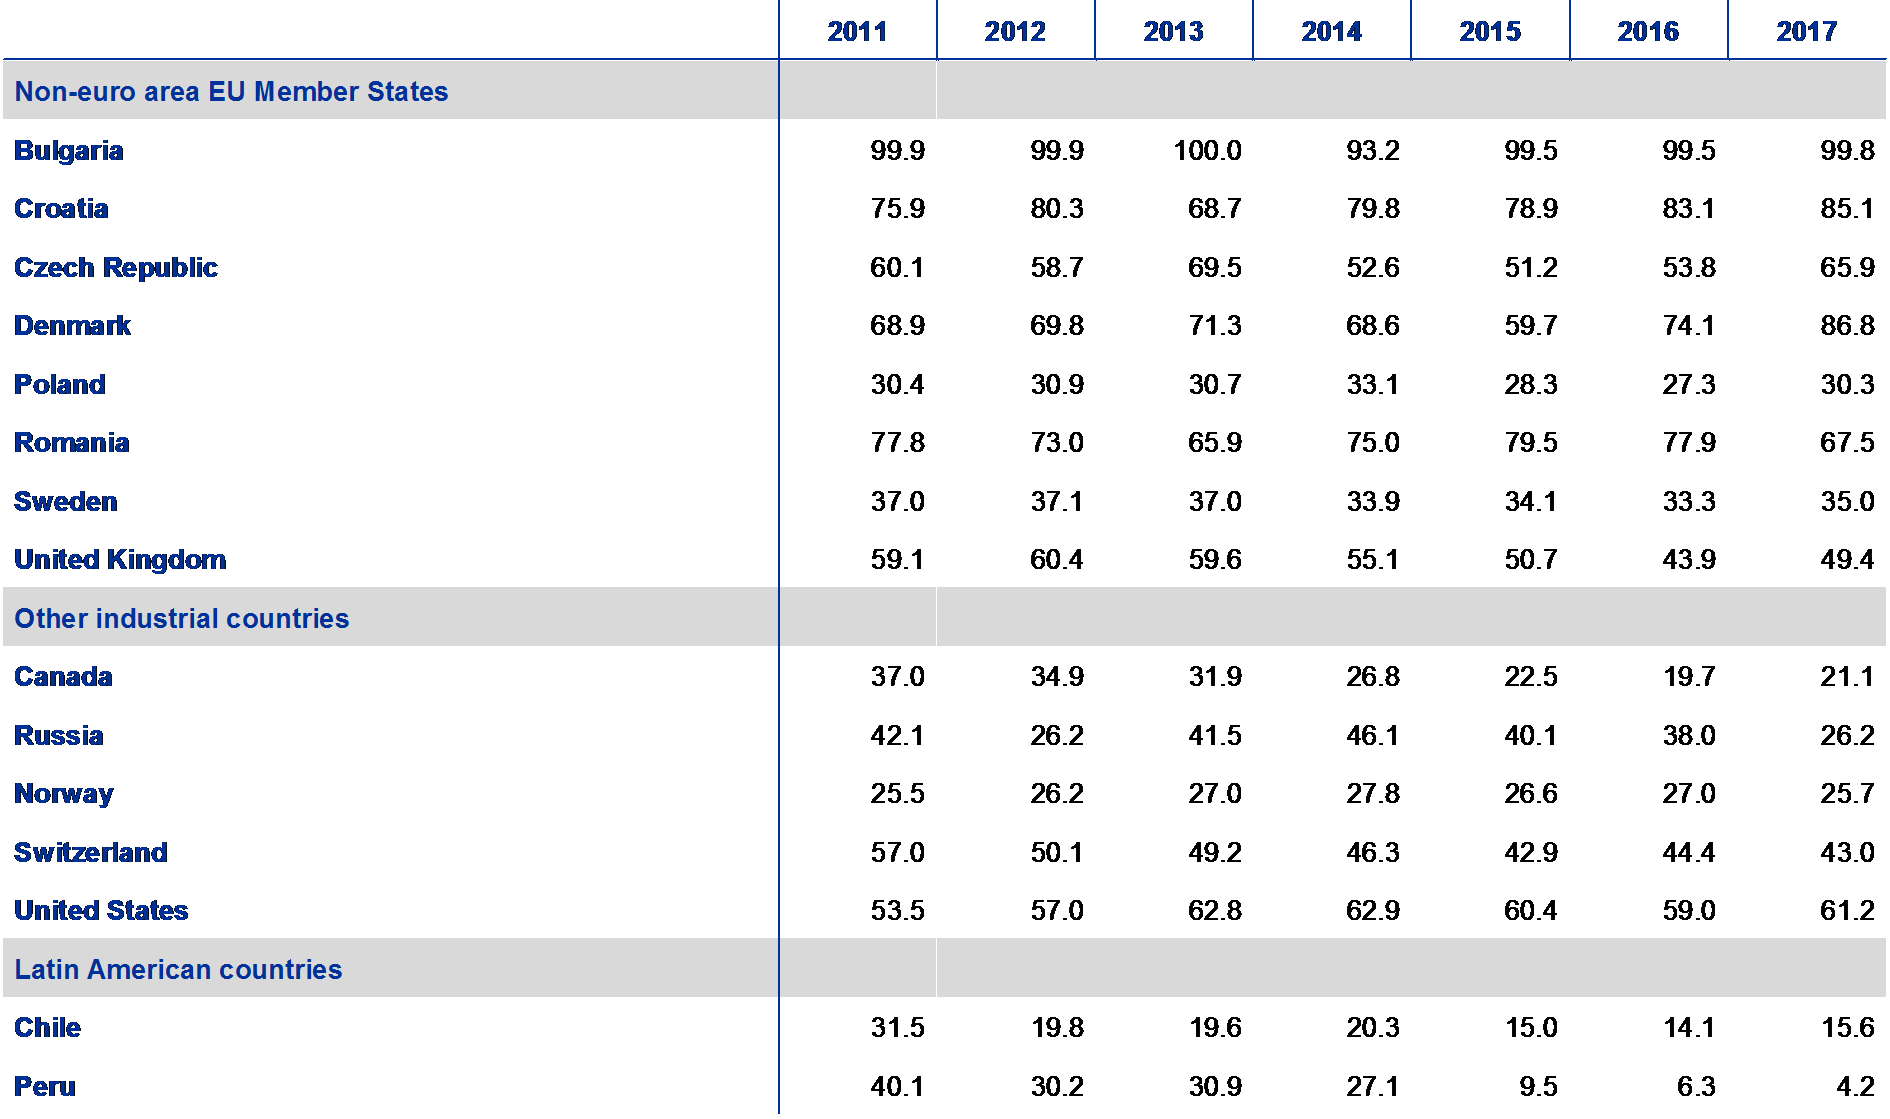
Sources: National central banks and ECB calculations.
Notes: Calculations are, in general, based on international reserve and foreign currency liquidity statistics. Please note the following with regard to country-specific data sources or calculation methods:
Bulgaria: currency compositions published in the annual reports of the central bank.
United Kingdom: combined currency share of the Bank of England and the UK Government (including other foreign currency assets such as claims vis-à-vis residents).
Norway: currency shares are calculated using the total foreign exchange reserves of Norges Bank, comprising equity, fixed income securities and the petroleum buffer portfolio.
Switzerland: combined currency share as published by the Swiss National Bank, including government bonds, other bonds and equities.
United States: combined currency shares for the System Open Market Account (SOMA) at the Federal Reserve System and the US Treasury Exchange Stabilization Fund (ESF); reciprocal currency arrangements are not included.
Chile: combined currency shares in the liquidity and investment portfolios of the central bank.
Peru: reserve assets denominated in currencies other than the US dollar. According to the Central Reserve Bank of Peru, these are mostly euro-denominated assets. It is assumed that the composition of the gross international reserves is the same as that of the net international position, with adjustments made to account for the exclusion of gold.
Table A3
Countries and territories with exchange rate regimes linked to the euro
(as at mid-April 2018)
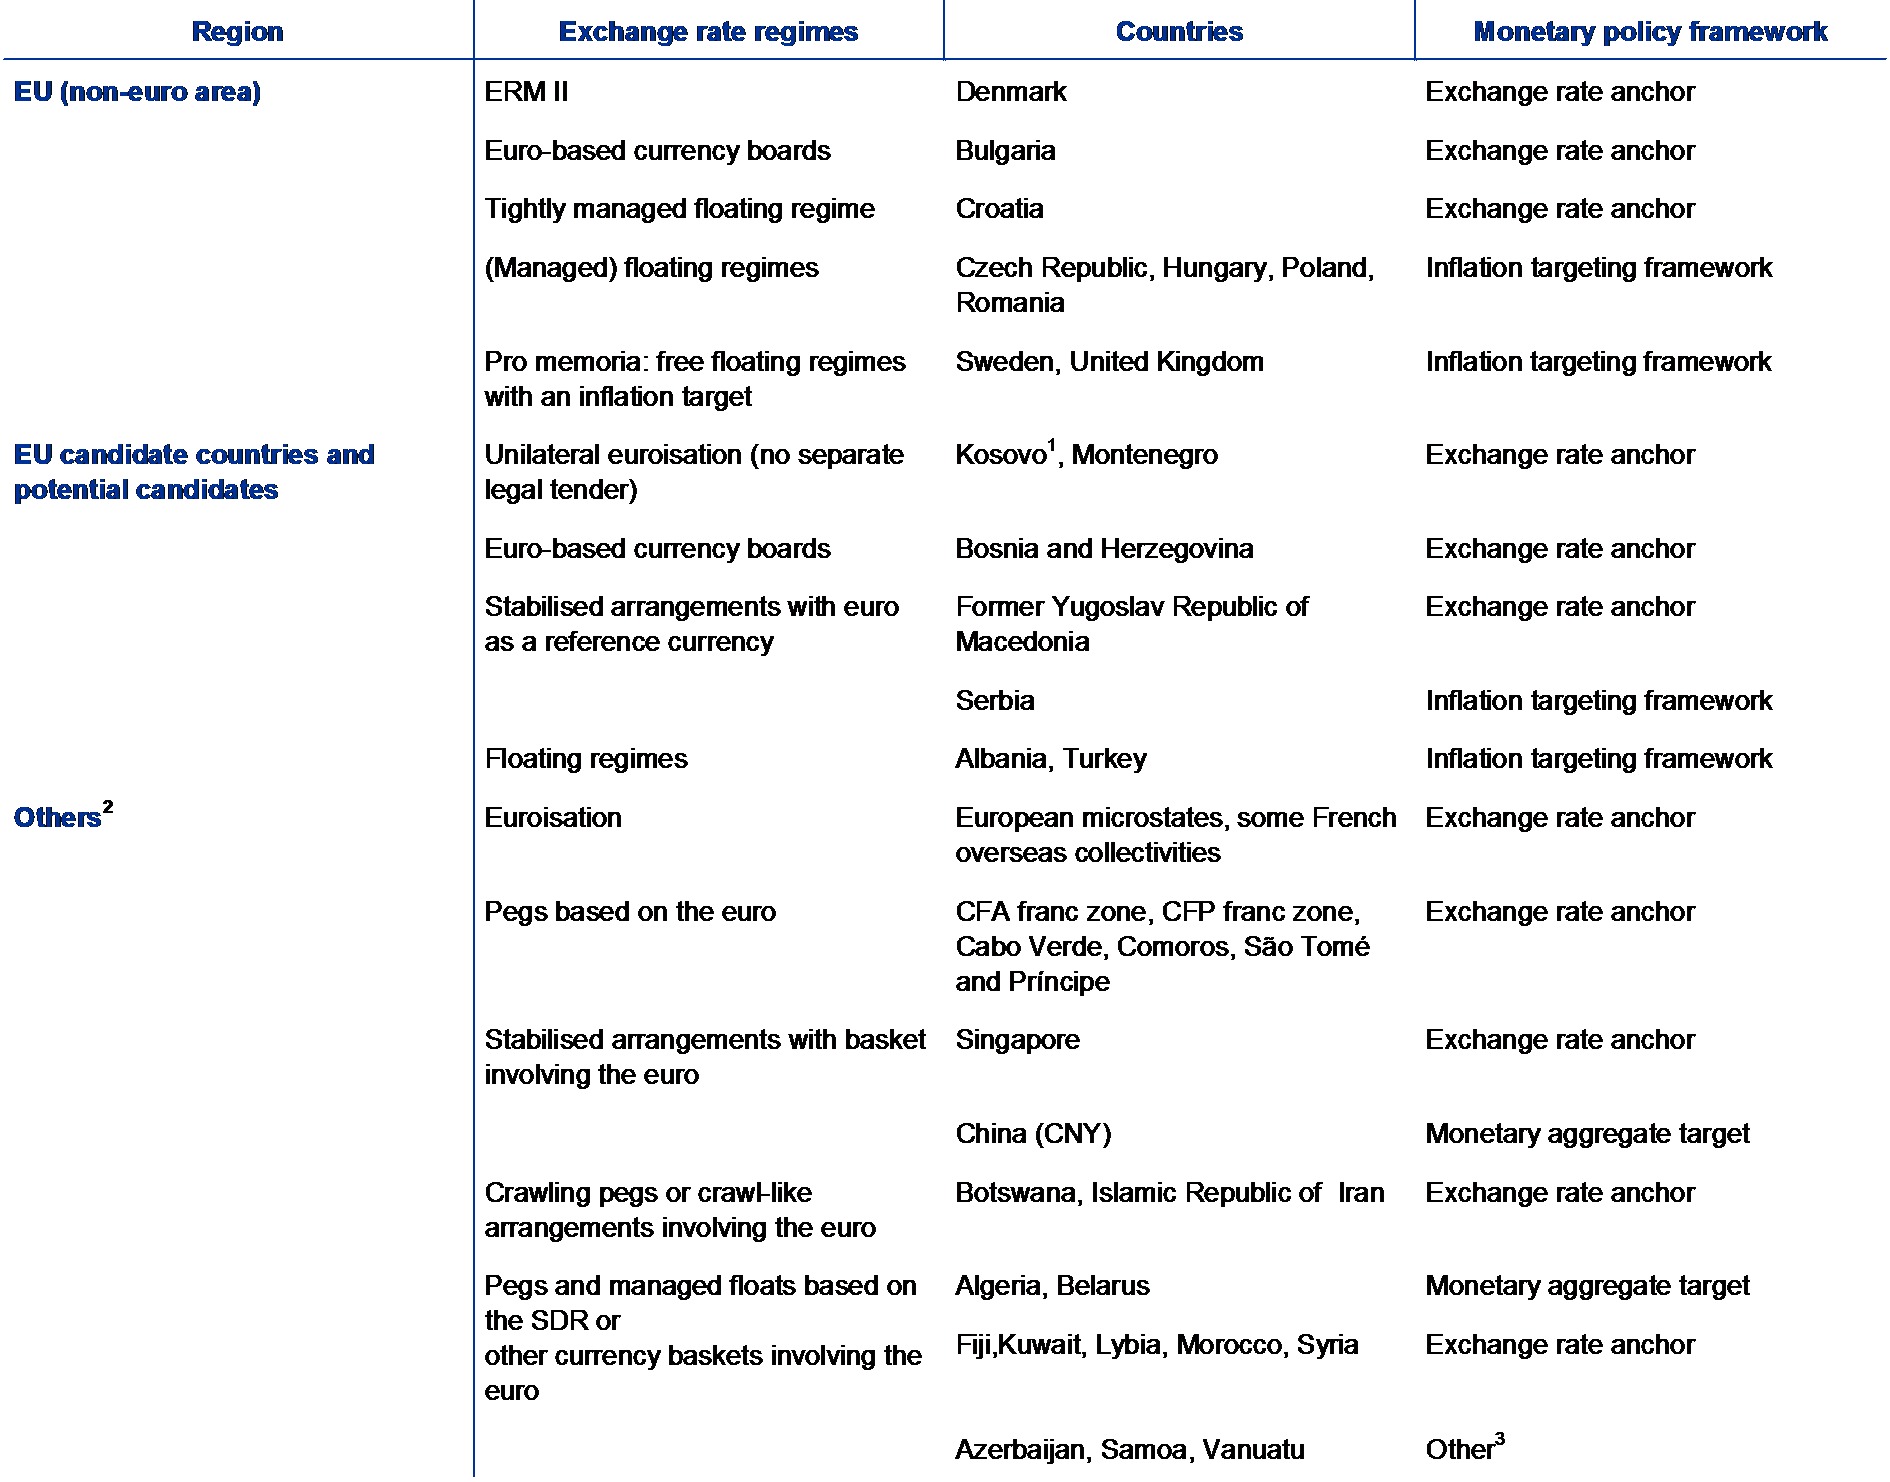
Sources: National central banks, IMF and ECB.
Notes:
1) This designation is without prejudice to positions on status, and is in line with UN Security Council Resolution 1244/1999 and the International Court of Justice Opinion on the Kosovo declaration of independence.
2) Classification is based on the IMF’s 2017 Annual Report on Exchange Arrangements and Exchange Restrictions.
3) No nominal anchor; different indicators are taken into account to implement the monetary policy.
Denmark: participates in ERM II with a +/-2.25% fluctuation band.
Bulgaria: maintains a fixed exchange rate to the euro within the framework of a currency board arrangement. In the currency board regime, the euro serves as the reserve currency.
Czech Republic: the de jure exchange rate arrangement is floating. The exchange rate commitment had been introduced in November 2013, but was discontinued in April 2017 when Česká národní banka announced that it would stop foreign exchange interventions, but would be prepared to intervene to reduce excessive foreign exchange volatility.
Croatia: the de jure exchange rate arrangement is a managed floating regime with no pre-announced path for the exchange rate. Hrvatska narodna banka conducts foreign exchange auctions on a discretionary basis to ensure the stability of the kuna and provide liquidity for payments domestically and abroad. The kuna has stabilised within a 2% band against the euro since April 2016.
Serbia: as the National Bank of Serbia’s intervention policy contributed to the stabilisation of the dinar within a 2% band against the euro during 2016, the de facto exchange rate arrangement has been reclassified to stabilised from floating. In the IMF’s 2017 Article IV report, it is stated that “taking into account recent exchange rate movements, the classification is expected to revert to floating in the future”.
European microstates: Republic of San Marino, Vatican City, Principality of Monaco and Andorra are entitled to use the euro as their official currency. Liechtenstein uses the Swiss franc as its official currency.
French overseas collectivities: Saint Barthelémy, Saint Martin and Saint-Pierre and Miquelon use the euro as their official currency.
CFA franc zone: WAEMU (Benin, Burkina Faso, Côte d’Ivoire, Guinea-Bissau, Mali, Niger, Senegal and Togo) and CEMAC (Cameroon, Central African Republic, Chad, Republic of Congo, Equatorial Guinea and Gabon).
CFP franc zone: New Caledonia and the French overseas collectivities of French Polynesia and Wallis and Futuna. The CFP franc has had a fixed exchange rate against the euro since its introduction in 1999.
Singapore: the Singapore dollar is allowed to fluctuate within a targeted policy band and is managed against a basket of the currencies of the country’s major trading partners and competitors.
Botswana: weighted basket of currencies comprising the SDR basket and the South African rand (crawling peg since 2005).
Iran: has maintained de jure a managed floating arrangement against a basket of currencies including the euro, US dollar and Japanese yen since 2002. The exact composition has not been disclosed.
Belarus: the central bank intervenes to reduce the daily volatility of the exchange rate against a basket of currencies (US dollar, euro and Russian rouble). Consequently, the de facto exchange rate arrangement is classified as an “other managed” arrangement.China: because the renminbi followed an appreciating trend within a 2% band against the basket of 13 currencies (24 currencies since January 2017) included in the CFETS index since November 2015, and has stabilised since August 2016, the de facto exchange rate arrangement has been reclassified twice: (1) retroactively to crawl-like from other managed, effective from 11 November 2015; and (2) to stabilised from crawl-like, effective from 24 August 2016.
Fiji: the currency was pegged to a basket of international currencies in May 2007. The external value of the Fiji dollar is officially determined on the basis of a weighted basket of currencies comprising the Australian dollar, Japanese yen, New Zealand dollar, euro and US dollar.
Kuwait: the de jure exchange rate arrangement is a conventional peg vis-à-vis a currency composite. The composition has been undisclosed since May 2015.
Libya: the de jure and de facto exchange rate arrangements are a conventional peg vis-à-vis the SDR.
Morocco: bi-currency basket comprising the euro (60%) and the US dollar (40%).
Samoa: the central bank maintains an exchange rate peg based on a basket of currencies that includes the euro.
Syria: the de jure exchange rate arrangement is a pegged exchange rate (to the SDR basket) managed within horizontal bands. Given the developments in the official rate, the emergence of the parallel market, and the intervention rate, the de facto exchange rate arrangement is classified as an “other managed” arrangement.
Azerbaijan: the central bank implemented an exchange rate policy based on a currency basket comprising the US dollar and the euro in 2015.
Vanuatu: the exchange rate of the vatu is currently linked to a transaction-weighted basket of currencies.
3.2 The euro in international debt markets
Table A4
Outstanding international debt securities by currency
Outstanding amounts
(in USD billions, at current exchange rates, end of period)
Percentages of outstanding amounts
(at constant exchange rates, end of period)
Percentages of outstanding amounts
(at current exchange rates, end of period)
Sources: BIS and ECB calculations.
Table A5
Outstanding international bonds and notes, by currency and by sector
Outstanding amounts
(end-of-period outstanding amounts in USD billions)

Percentages of outstanding amounts
(end-of-period percentages of outstanding amounts)
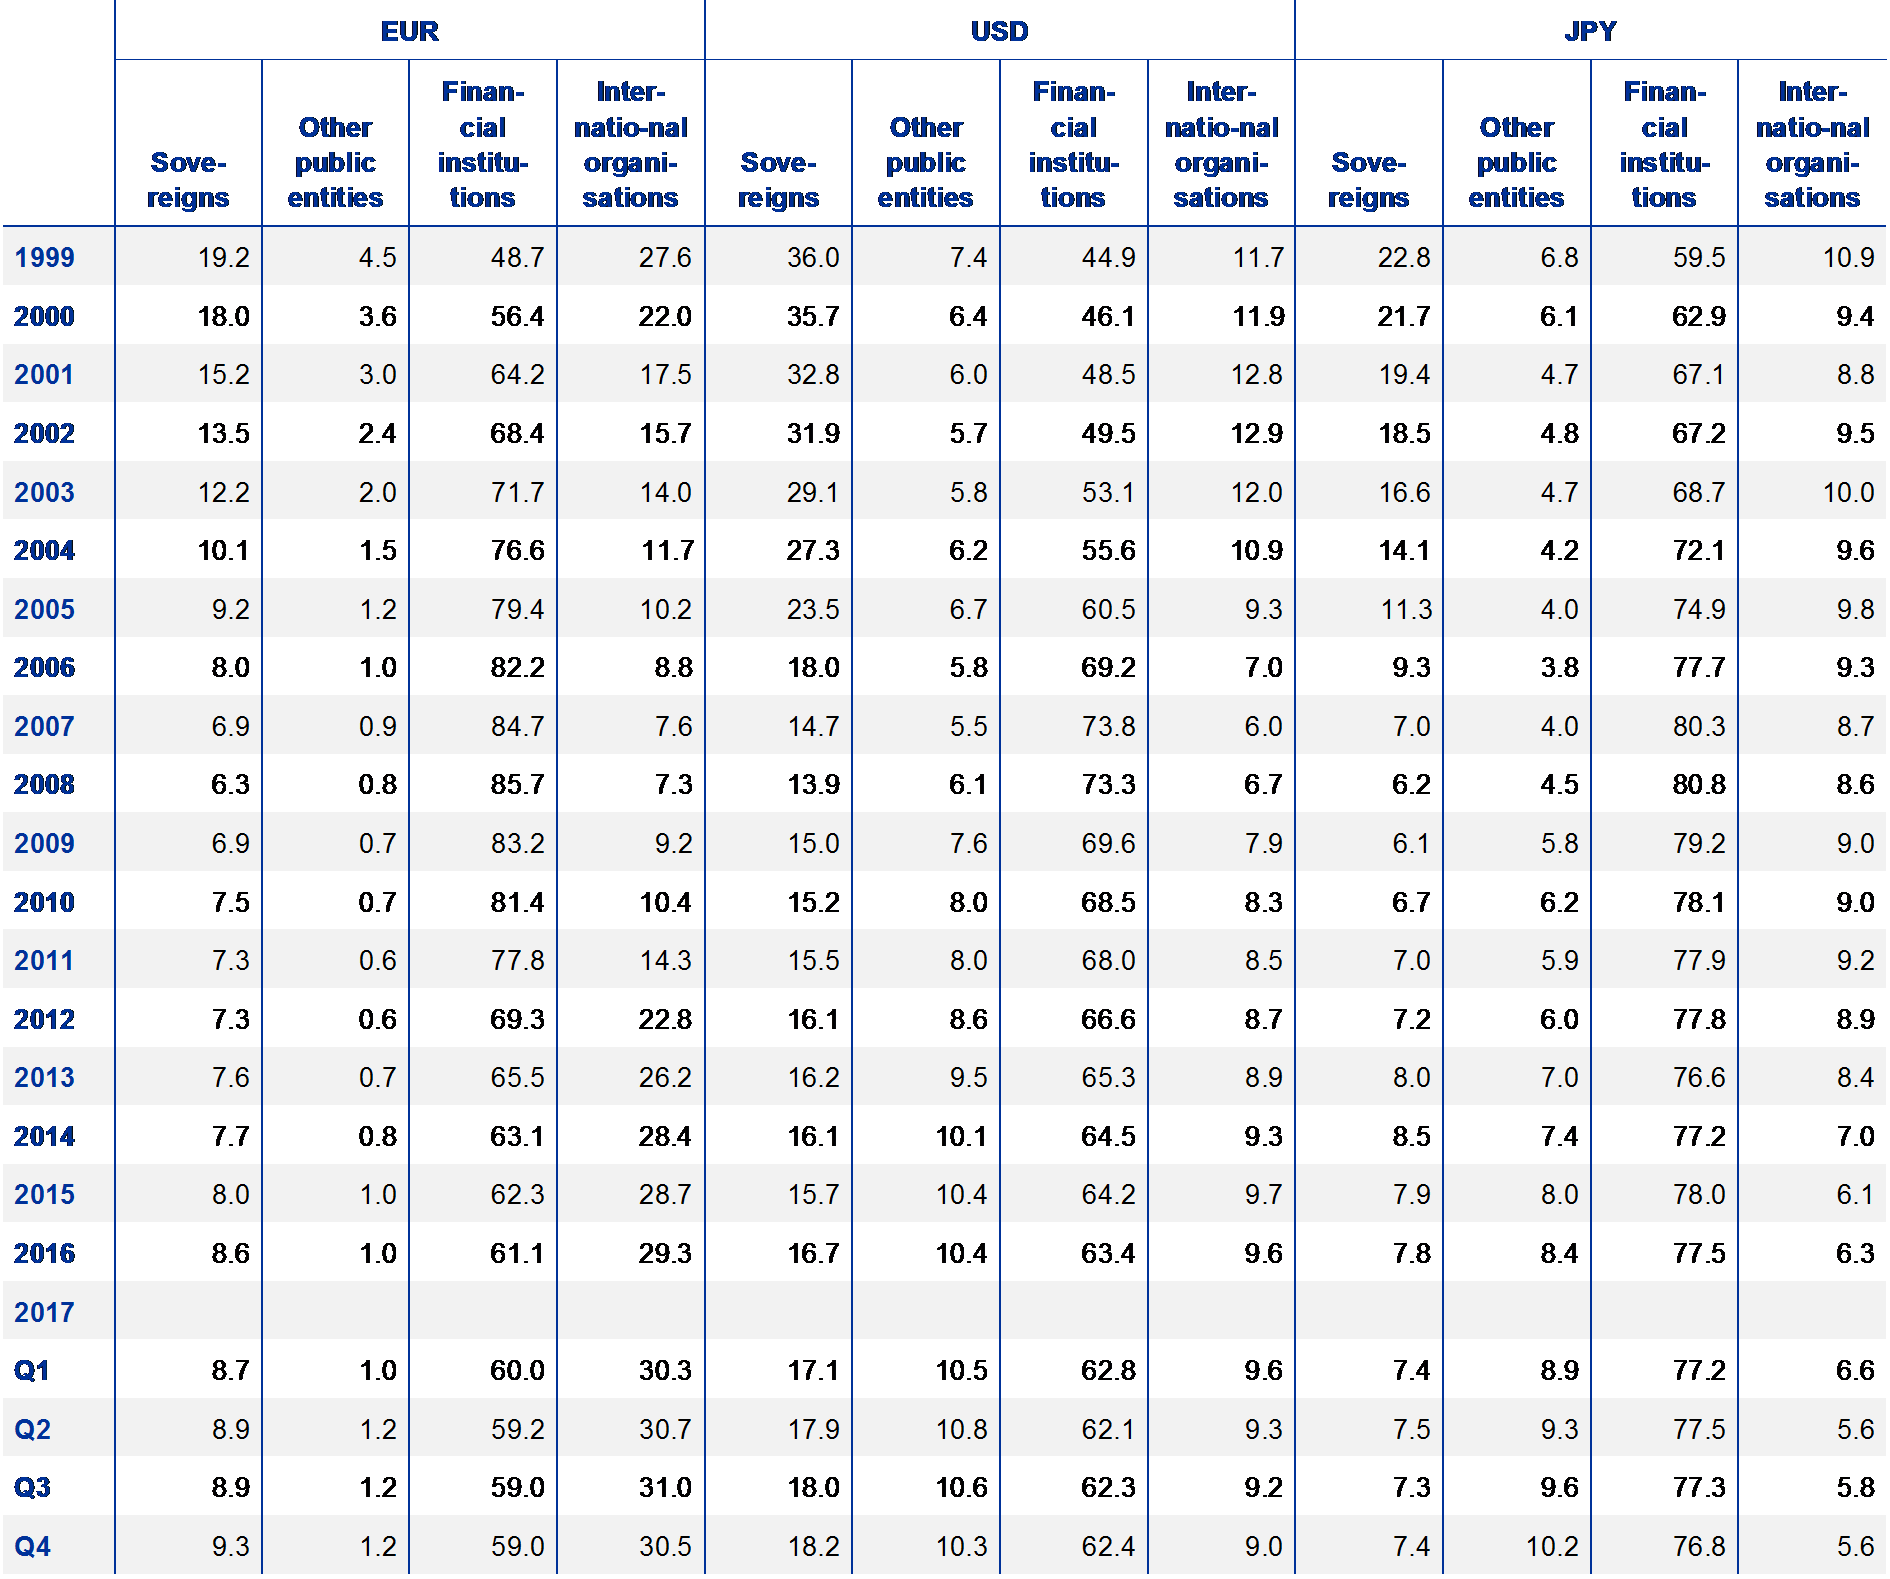
Sources: BIS and ECB calculations.
Table A6
Outstanding international bonds and notes in selected regions at the end of the review period, by currency
(narrow measure, in USD billions and as a percentage of the total amount outstanding, end of period)
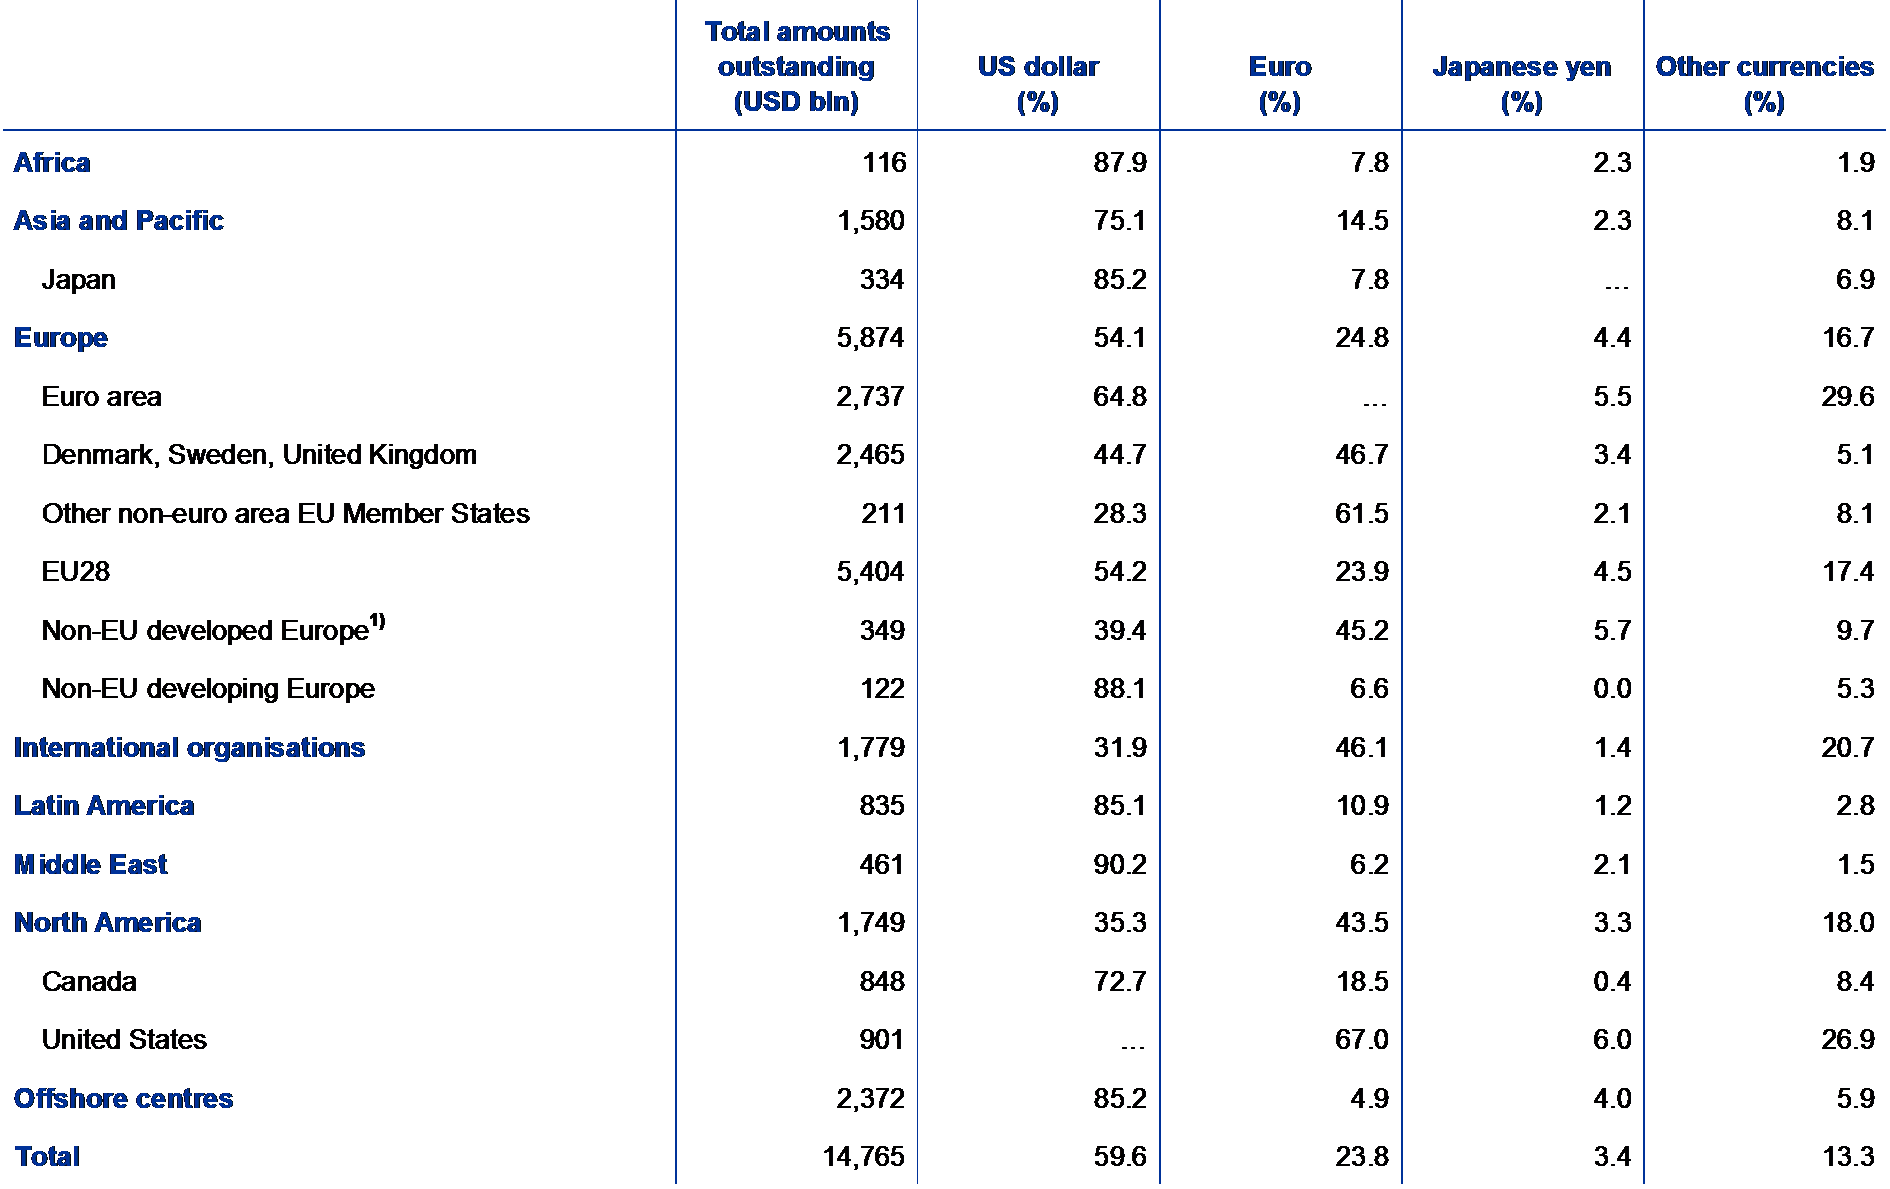
Sources: BIS and ECB calculations.
1) Iceland, Norway, Switzerland and European microstates.
Table A7
International dimensions of euro-denominated debt securities
(in € billions and as a percentage of total)
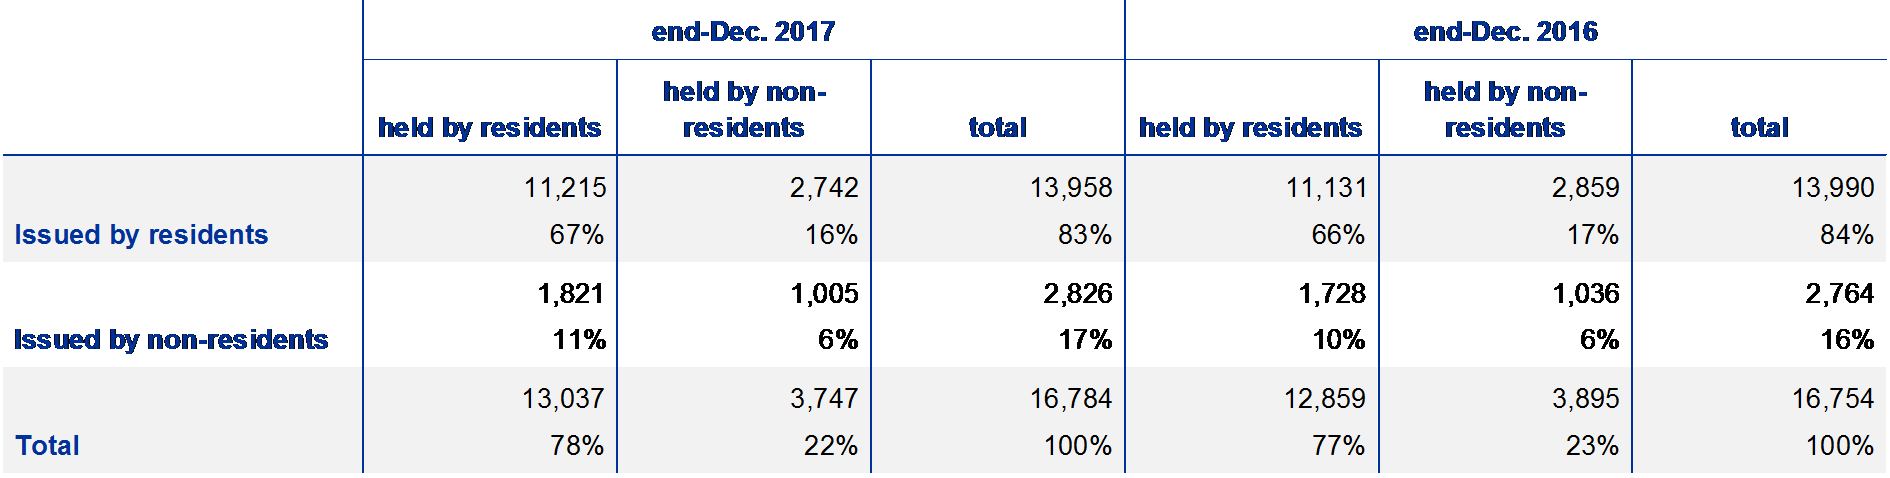
Source: ECB.
Chart A1
Debt securities issued by euro area countries, by holder
(percentages of total outstanding amounts, as at end-2016)

Sources: ECB calculations, IMF (CPIS, SEFER and SSIO surveys) and national sources (national accounts and i.i.p. data).
Notes: i.i.p. figures for Cyprus and the Netherlands include “special financial institutions”. Reserve assets and holdings of international organisations cannot be allocated to reporting countries, as the results of the IMF’s surveys on securities held as foreign exchange reserves (SEFER) and securities held by international organisations (SSIO) only report figures in aggregate form.
Chart A2
Debt securities issued by euro area residents held in the portfolios of selected countries outside the euro area
(as a percentage of total debt securities held as portfolio investment assets, as at end-2016)

Sources: ECB and IMF.
3.3 The euro in international loan and deposit markets
Table A8
Outstanding international loans, by currency
Outstanding amounts
(in USD billions, at current exchange rates, end of period)

Percentages of outstanding amounts
(at constant exchange rates, end of period)

Percentages of outstanding amounts
(at current exchange rates, end of period)
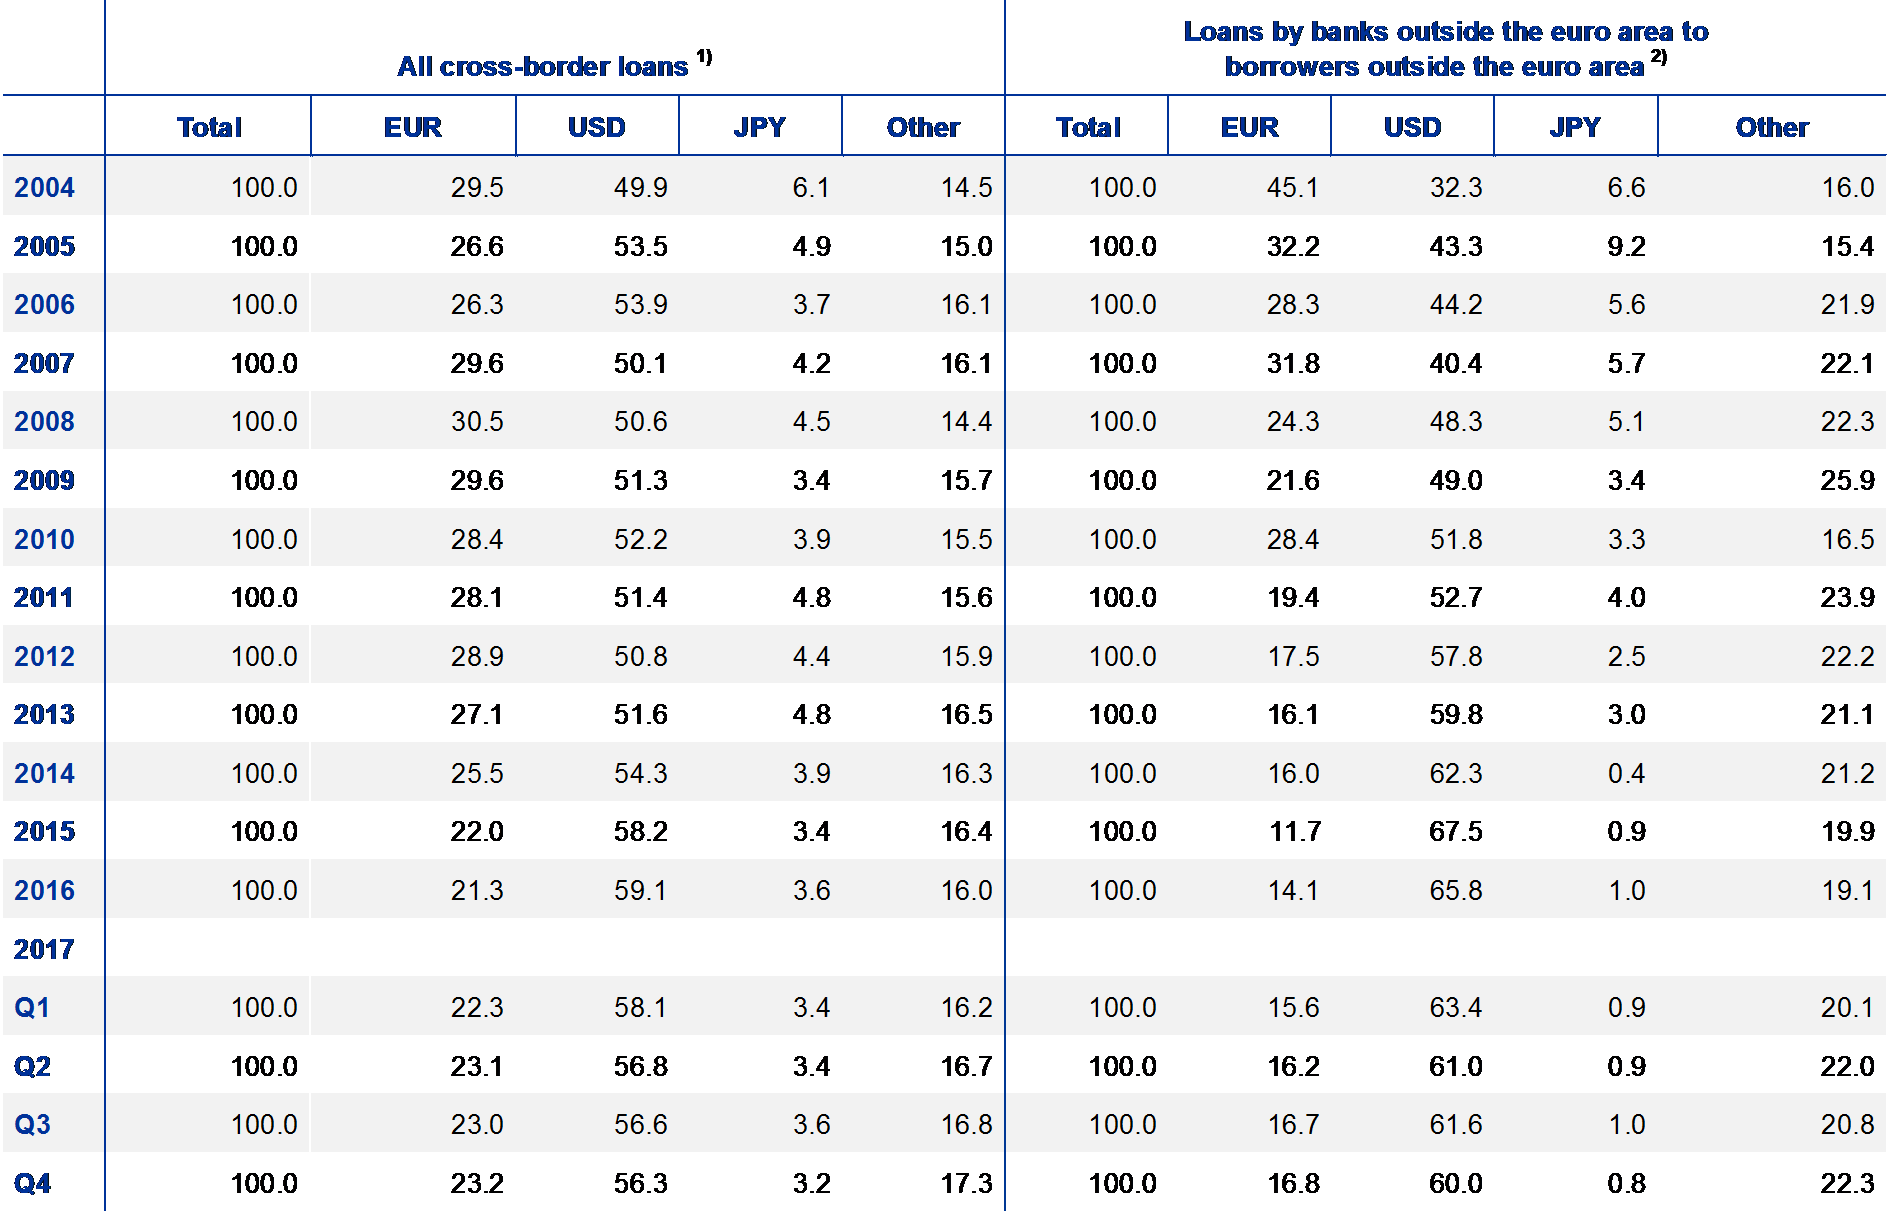
Sources: BIS and ECB calculations.
Notes: Excluding interbank loans.
1) Including loans to/from Japan, Switzerland, the United Kingdom and the United States in their domestic currency.
2) Excluding loans to/from Japan, Switzerland, the United Kingdom and the United States in their domestic currency.
Table A9
Outstanding international deposits, by currency
Outstanding amounts
(in USD billions, at current exchange rates, end of period)

Percentages of outstanding amounts
(at constant exchange rates, end of period)
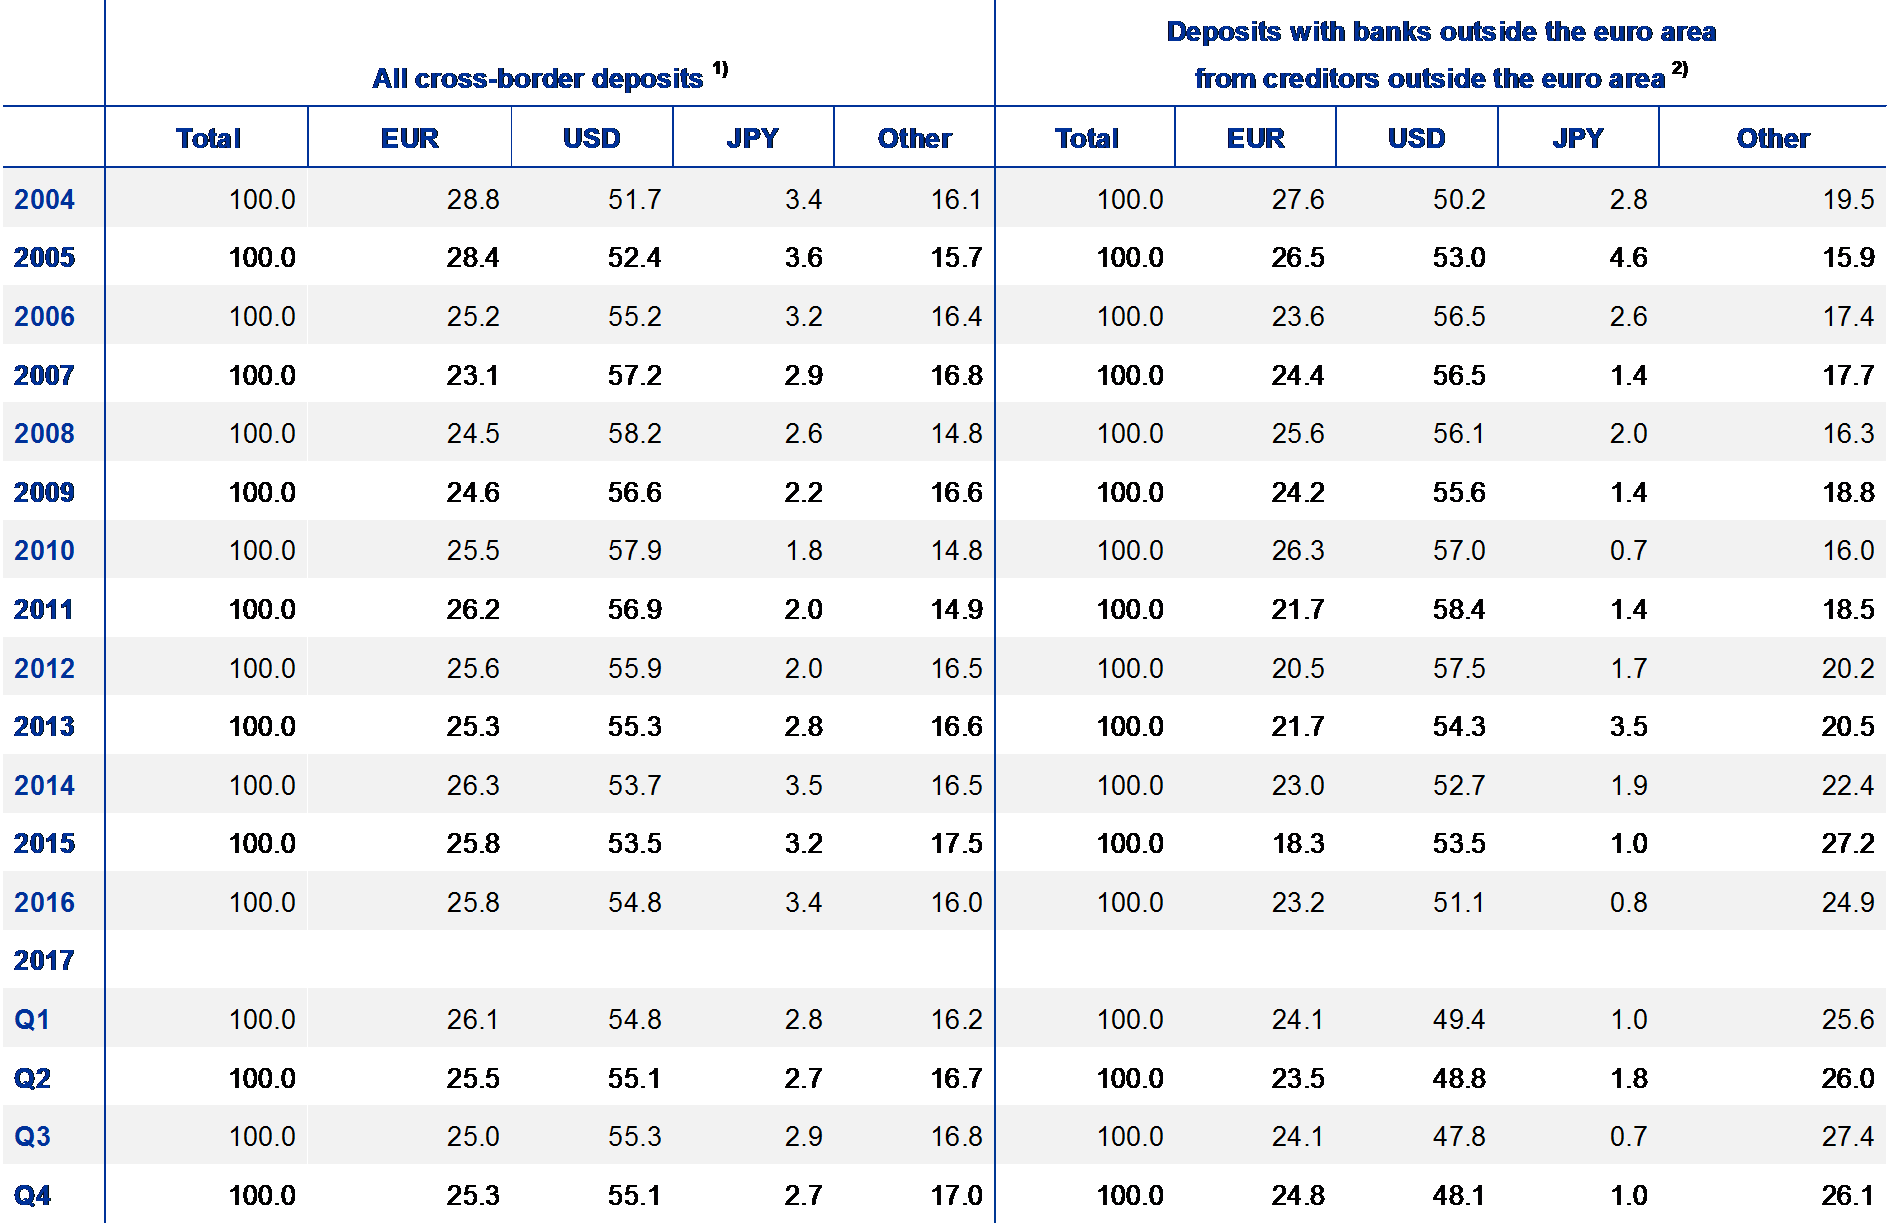
Percentages of outstanding amounts
(at current exchange rates, end of period)
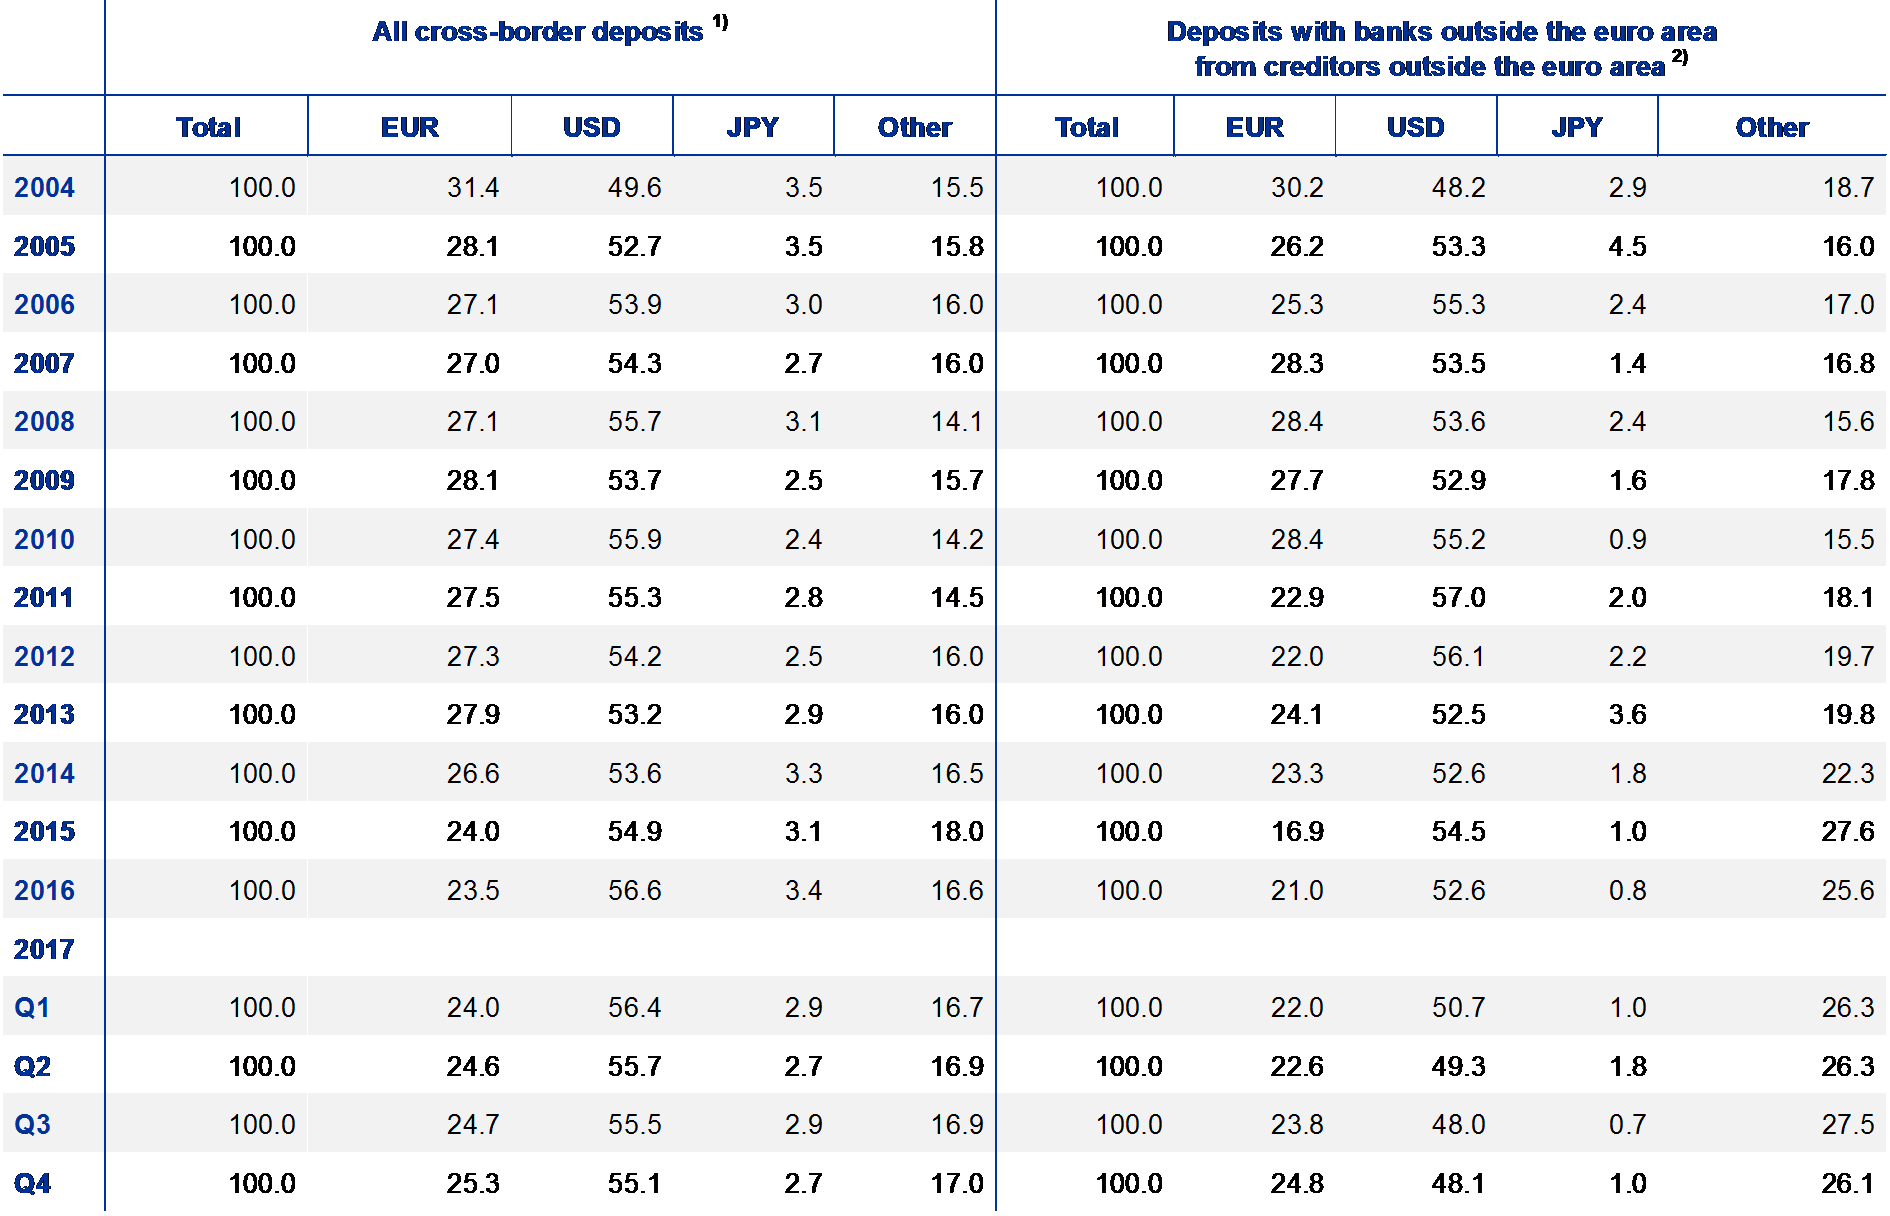
Sources: BIS and ECB calculations.
Notes: Excluding interbank deposits.
1) Including deposits to/from Japan, Switzerland, the United Kingdom and the United States in their domestic currency.
2) Excluding deposits to/from Japan, Switzerland, the United Kingdom and the United States in their domestic currency.
3.4 The euro in international trade in goods and services
Table A10
Use of the euro as a settlement/invoicing currency in extra-euro area exports and imports of goods and services by selected euro area countries
Exports and imports of goods
(as a percentage of the total)

Sources: National central banks, Eurostat and ECB calculations.
Notes:
1) Data for Greece, Cyprus, Slovenia, Spain, Italy (goods until 2010), Portugal and Luxembourg refer to the currency of settlement
2) Data from 2013 onwards may show a break due to the implementation of the updated international balance-of-payments standards (BPM6).
Exports and imports of services
(as a percentage of the total)
Sources: National central banks, Eurostat and ECB calculations.
Notes:
1) Data for Estonia (services), Greece, Cyprus, Slovenia, Spain, Italy (goods until 2010), Portugal and Luxembourg refer to the currency of settlement.
2) Services data for Greece, Cyprus, Spain and Italy (after 2008) exclude travel items.
3) Data from 2013 onwards may show a break due to the implementation of the updated international balance-of-payments standards (BPM6).
Table A11
The euro’s share in the exports and imports of selected non-euro area countries
Exports and imports of goods
(as a percentage of the total)

Exports and imports of services
(as a percentage of the total)

Sources: National central banks.
Note: 1) Data for Bulgaria and Romania refer to the currency of settlement.
3.5 The euro as a parallel currency: the use of euro-denominated bank loans and deposits in countries outside the euro area
Table A12
Outstanding euro-denominated bank loans in selected countries

Sources: ECB, Haver Analytics, national central banks and ECB staff calculations.
Notes: Loans to households and non-financial corporations (total economy in the case of Bosnia and Herzegovina due to a lack of data). Definitions of loans may vary across countries. Outstanding amounts in December each year. Data may have been subject to revisions compared with previous issues of this report owing to methodological changes or updates. Where applicable, foreign exchange-indexed loans are included. Figures for loans indexed to foreign currency (and the euro) are estimates in the case of FYR Macedonia. Montenegro and Kosovo (this designation is without prejudice to positions on status, and is in line with UN Security Council Resolution 1244/99 and the International Court of Justice Opinion on the Kosovo declaration of independence) are excluded since they are unilaterally euroised economies.
Table A13
Outstanding euro-denominated bank deposits in selected countries

Sources: ECB, Haver Analytics, national central banks and ECB staff calculations.
Notes: Deposits from households and non-financial corporations (total economy in the case of Bosnia and Herzegovina due to a lack of data). Change in methodology in the case of Albania, hence figures from last year are not comparable. Definitions of deposits may vary across countries. Outstanding amounts in December each year. Data may have been subject to revisions compared with previous issues of this report owing to methodological changes or updates. Where applicable, foreign exchange-indexed deposits are included. For FYR Macedonia, euro-denominated and euro-indexed deposits are estimates. Montenegro and Kosovo (this designation is without prejudice to positions on status, and is in line with UN Security Council Resolution 1244/99 and the International Court of Justice Opinion on the Kosovo declaration of independence) are excluded since they are unilaterally euroised economies.
3.6 Summary
Chart A3
Overview of the evolution in the international role of the euro over the review period
(percentage change)
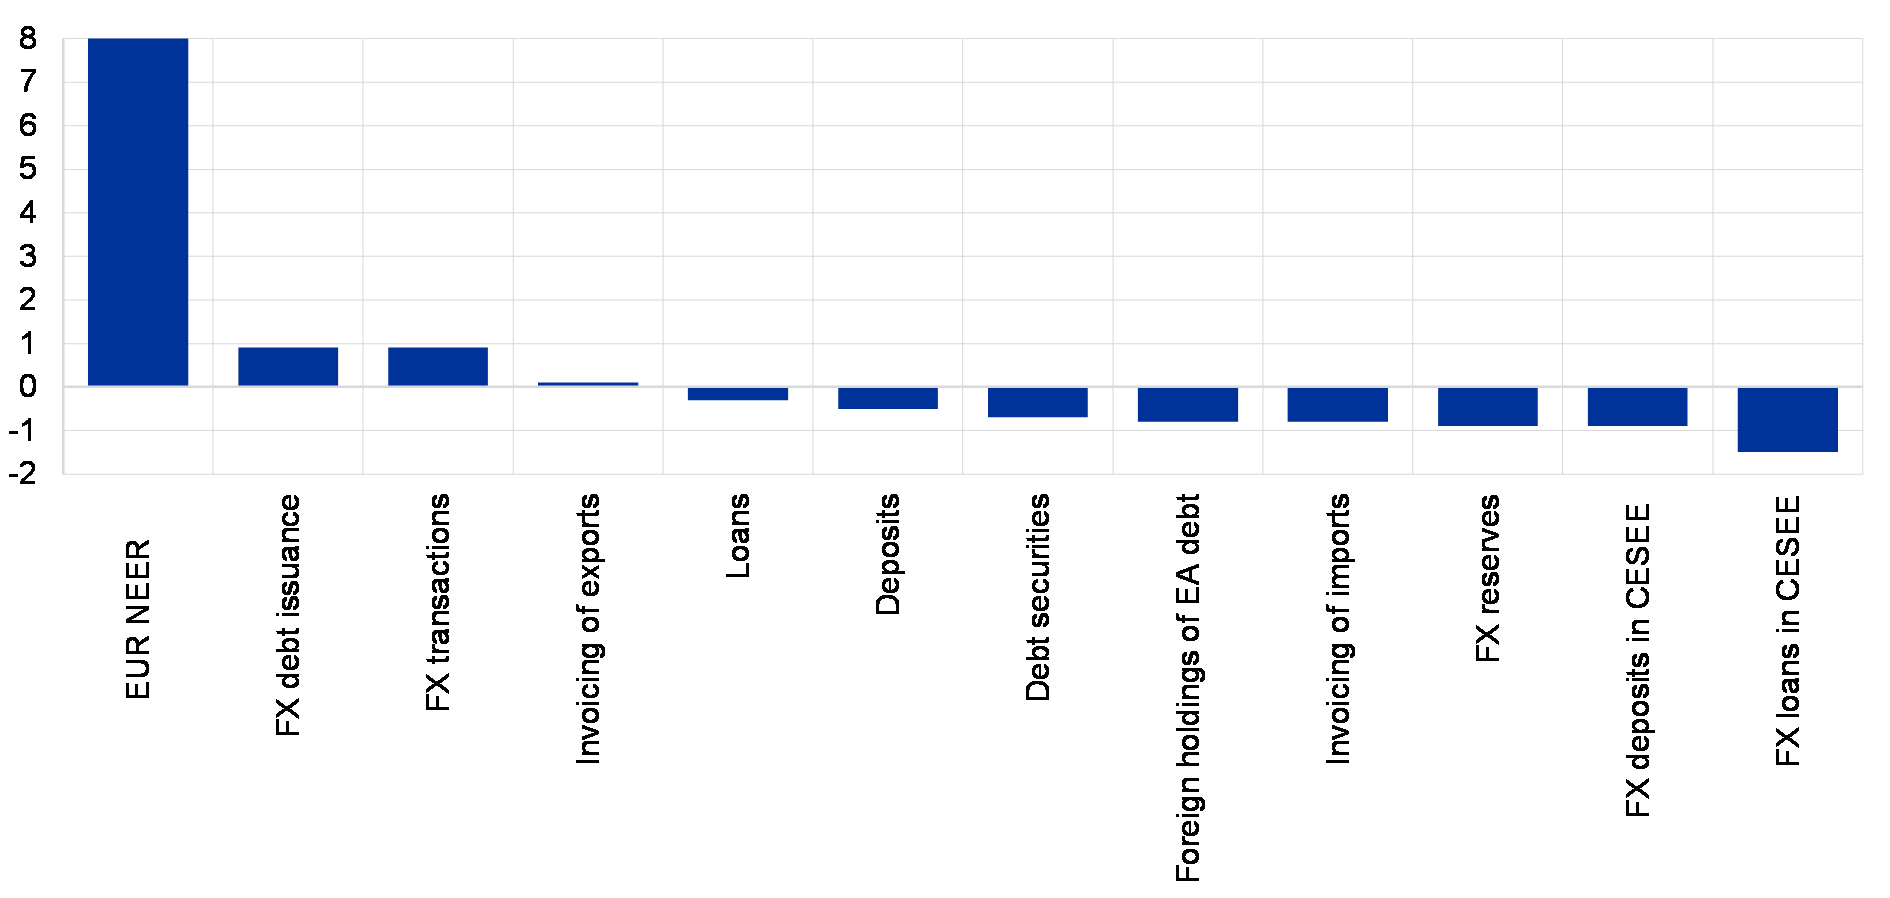
Sources: BIS, CLS, Dealogic, IMF, national sources and ECB staff calculations.
Note: For definitions of the measures, see Table 1.
© European Central Bank, 2018
Postal address 60640 Frankfurt am Main, Germany
Telephone +49 69 1344 0
Website www.ecb.europa.eu
All rights reserved. Reproduction for educational and non-commercial purposes is permitted provided that the source is acknowledged.
This report was produced under the responsibility of the Executive Board of the ECB.
The cut-off date for the statistics included in this report was 26 April 2018.
For specific terminology please refer to the ECB glossary.
PDF ISSN 1725-6593, ISBN 978-92-899-3200-4, doi:10.2866/418720, QB-XN-18-001-EN-N
- See Box 2 of last year’s edition of the report for a detailed discussion of the link between euro area financial depth and the international role of the euro.
- For a review of the argument, see e.g. Pandl, Z., “QA on Dollar Weakness”, Economics Research, Goldman Sachs, 20 February 2018.
- See HSBC Reserve Management Trends 2017, published by HSBC and Central Banking Publications, and the accompanying press release.
- In other words, all currencies other than traditional reserve units such as the US dollar, the euro, the yen, the pound sterling and the Swiss franc, such as the Australian dollar, the Canadian dollar and the Chinese renminbi.
- “Commodity” currencies are – in the parlance of market observers – currencies whose value hinges significantly on oil and commodity prices insofar as the latter account for a large share of the exports of their respective issuing country.
- See HSBC Reserve Management Trends 2018, published by HSBC and Central Banking Publications, and the accompanying press release.
- That the share of the euro excluding intra-euro area payments is slightly higher than the share including those payments might reflect differences in the definition of payments outside the euro area in the computation of the two shares.
- See Box 3 in last year’s report for a more detailed assessment of developments in the international role of the renminbi.
- For further details on the international aspect of the rebalancing channel of the ECB’s asset purchase programme, see the speech by Benoît Cœuré entitled “The international dimension of the ECB’s asset purchase programme” at the Foreign Exchange Contact Group meeting on 11 July 2017.
- Although not all foreign exchange transactions are settled in CLS, which partly reflects the fact that the foreign exchange market is largely decentralised, it has been estimated that over 50% of eligible global foreign exchange transactions are settled in CLS. This suggests that data on activity in CLS might be indicative of broader market trends.
- The discussion here is based on the “narrow” definition of international debt issuance, which focuses on the foreign currency principle. This definition therefore excludes all domestic currency issuance from the standard (also known as “broad”) definition of international debt issuance, which is based on the residence principle. For instance, the narrow definition excludes a euro-denominated bond issued by a German company whether outside the euro area (e.g. in the United States) or in the euro area (e.g. in France).
- See last year’s report for further evidence and discussion.
- Examples are “reverse yankee” bonds, which have been popular in recent years, in particular among non-financial corporations. These are euro-denominated bonds issued by US companies where the euro proceeds are exchanged immediately into US dollars by means of CCS in order to hedge the US companies’ foreign currency exposure.
- Developments at the shorter maturities (e.g. three months) are however less relevant for international bond issuance, which typically has longer durations.
- For more details on the argument, see e.g. Pozsar, Z., “Global Money Notes #12: BEAT, FRA-OIS and the Cross-Currency Basis”, Investment Solutions & Products, Credit Suisse, 22 March 2018.
- As noted in last year’s report, the European Systemic Risk Board’s Recommendation on lending in foreign currencies might have also contributed to a reduction in cross-border euro-denominated loans.
- See McCauley, R.N., Bénétrix, A.S., McGuire, P.M. and von Peter, G., “Financial deglobalisation in banking?”, BIS Working Paper No 650, 2017.
- Data on official shipments, which put the stock of euro banknotes in circulation outside the euro area at about €160 billion, only capture observed cross-border flows of banknotes. An indirect estimation method, which attempted to quantify the unobserved cross-border flows of banknotes by combining information on domestic banknote circulation and coin circulation and by making assumptions on potential factors underlying those flows, suggested that the actual circulation of banknotes outside the euro area might be higher still (see the ECB press release entitled “Estimation of euro currency in circulation outside the euro area” published on 6 April 2017).