
Financial Stability Review, November 2022
Foreword

Households and firms across the euro area are already feeling the effects of higher inflation and weaker economic activity, amid the ongoing energy crisis prompted by the war in Ukraine.
The November 2022 Financial Stability Review (FSR) sets out how the deterioration in economic and financial conditions has increased the risks to euro area financial stability. This year has seen notable declines in financial asset prices across many regions and asset classes, an increase in market volatility and, at times, strained market liquidity. Sharp asset price movements have also triggered unexpectedly large margin calls for some market participants, notably non-financial corporations and non-bank financial institutions, testing their liquidity preparedness. These asset price shifts have reflected increasing uncertainty about what will be required of monetary policy to moderate inflation in advanced economies. Not for the first time, we have been reminded that, when positions are leveraged or when exposures are created through derivatives, the impacts of market shocks are often felt well beyond those investors that are directly affected.
As financial conditions tighten, the vulnerabilities of more-indebted sovereigns, households and corporates are at greater risk of coming to the fore. Despite the pandemic-induced disruption of economic activity, corporate defaults and unemployment have, thanks to a variety of policy support measures, remained low. Banks have thus been shielded from loan losses. While they are now benefiting from near-term gains derived from higher interest rates and margins, deteriorating growth prospects point to rising risks in the medium term. With the present macroeconomic environment, where monetary policy is focused on lowering inflation, it is crucial for governments to be targeted in the support they provide to vulnerable sectors, while avoiding policies that could interfere with the monetary policy normalisation process.
This issue of the FSR also includes three special features on topics that are becoming more prominent for our risk assessment. The first examines the impact of the energy crisis on energy-related financial derivatives markets, which are used by energy producers across the euro area to hedge their positions and intermediated by the banking system and clearing houses. The second special feature explores how increasing energy and other prices, together with rising interest rates, are affecting euro area households at different income levels, and the challenges posed for less well-off households in particular. The third special feature looks at how threats to financial stability from cyberattacks are evolving, how their costs are rising, and how this can be mitigated.
This issue of the FSR has been prepared with the involvement of the ESCB Financial Stability Committee, which assists the decision-making bodies of the ECB in the fulfilment of their tasks. The FSR promotes awareness of systemic risks among policymakers, the financial industry and the public at large, with the ultimate goal of promoting financial stability.
Luis de Guindos
Vice-President of the European Central Bank
Overview

Financial stability risks increase as macro-financial conditions continue to weaken
Euro area financial stability conditions have deteriorated further, reflecting rising inflation, higher interest rates, weaker growth prospects and financial market repricing. Inflationary pressures have risen both globally and in the euro area since the publication of the previous FSR (Chart 1, panel a), driven by elevated food and energy prices and their pass-through to other prices. This has prompted an adjustment of monetary policy stances by major central banks, contributing to tighter global financial conditions and increased financial market volatility. The mix of high inflation outturns and rising interest rates has continued to weigh on economic growth in many advanced economies. Against this background, one-year ahead recession probabilities have increased markedly, in both the euro area and other major advanced economies (Chart 1, panel b).
Chart 1
Ongoing inflationary pressures and tighter financial conditions fuel recession risks

Sources: Bloomberg Finance L.P., Eurostat, U.S. Bureau of Labor Statistics, Haver Analytics and ECB calculations.
Notes: Panel a: Bloomberg’s financial conditions indices measure stress in money, bond and equity markets relative to the period before the global financial crisis. Positive values indicate accommodative financing conditions, while negative values indicate tighter financing conditions. EA stands for euro area; HICP stands for Harmonised Index of Consumer Prices; CPI stands for consumer price index. Panel b: recession probabilities are displayed as the Bloomberg Recession Probability Forecast Index. Recession probabilities for emerging market economies are the median Bloomberg Recession Probability Forecast Index for a set of countries defined as emerging market economies in alignment with the IMF, excluding Ukraine and Russia.
Pre-existing vulnerabilities could be exposed by euro area economic developments, monetary and fiscal policy challenges and geopolitical tensions. The ongoing war in Ukraine still poses a significant risk to inflation and growth, especially if it leads to euro area households and firms facing rationed energy supplies. Other risks to inflation, growth and global financial conditions could also be triggered by a faster than expected rise in interest rates, fiscal policy missteps, a broader resurgence of the pandemic, and emerging market stress, including the possibility of a sharper economic slowdown or real estate correction in China. Should any of these risks materialise, they could trigger or amplify the unravelling of financial stability vulnerabilities identified in previous issues of the FSR, possibly simultaneously, including pockets of debt sustainability concerns for corporates, households and sovereigns, or abrupt adjustments in both financial and tangible asset valuations.
Risk of disorderly market adjustments rises amid higher volatility and potential for further asset repricing
Despite large corrections in 2022, risky-asset valuations remain sensitive to the uncertain path of inflation, monetary policy normalisation and economic activity. After a brief summer rally, global bond and equity markets resumed their simultaneous decline that has been under way since the start of 2022 (Chart 2, panel a). While recent corrections have generally been orderly, there has been unusually strong price co-movement across a wide range of asset classes – a development that complicates diversification strategies and could amplify losses (Box 2). Activity in primary markets – including initial public offerings of equity and issuance of high-yield corporate bonds – has also fallen significantly year on year.
Some risky-asset prices, such as US equities, still appear stretched given fundamentals. So far, asset prices declines have mainly reflected the direct impact of higher interest rates, and, therefore, prices may not yet fully reflect the more negative outlook. Further corrections in market valuations could be triggered if the outlook for growth, inflation and financial conditions deteriorates further. In particular, more persistent inflation might require further monetary policy responses by major central banks than currently expected by market participants.
The risk of disorderly adjustments has risen with increased market volatility, knock-on effects for margin demands and lower liquidity in some market segments. Significant financial market repricing has translated into higher market volatility, in particular – but not exclusively – in bond markets (Chart 2, panel b). In addition, some signs of lower market liquidity have emerged in euro area corporate bond markets, especially for high-yield bonds (Chart 2, panel c). This could make it harder for participants to adjust portfolios, reprice assets or raise financing in periods of stress. Furthermore, the cash and collateral stress that can arise from large price moves and volatility that trigger unexpectedly large margin calls poses a risk for some derivatives market participants, as recently seen in euro area commodity derivatives markets (Special Feature A) and UK sovereign debt markets. This combination of developments makes markets more vulnerable to disorderly adjustments.
Chart 2
Markets remain vulnerable to disorderly adjustments amid high volatility and signs of lower market liquidity in some market segments

Sources: Bloomberg Finance L.P., S&P Dow Jones Indices LLC and/or its affiliates, and ECB calculations.
Notes: Panel a: global equity markets are reflected by the MSCI All Country World Index and global bond markets by the Bloomberg Barclays Multiverse Index. Panel b: volatilities indicated are the VIX Index for equities, the MOVE Index for bonds, the 30-day volatility of the Bloomberg Commodities Index for commodities and the J.P. Morgan Global FX Volatility Index for foreign exchange rates. Original data were transformed into z-scores by subtracting their average and dividing by their standard deviation. Panel c: bid-ask spreads are weighted by market value for euro-denominated bonds included in the iBoxx investment-grade, high-yield and sovereign bond indices with original maturity of one year.
Despite some active portfolio de-risking, the credit risk exposure of the non-bank financial intermediary sector remains high. Non-bank financial institutions (NBFIs) have responded to rising yields and a worsening macroeconomic outlook by starting to offload their holdings of lower-rated corporate and sovereign bonds (Chart 3, panel a). This points to a reversal of the search for yield observed in the prolonged low interest rate environment (Section 4.1). That said, overall exposures to credit risk remain high, exposing NBFIs to the risk of substantial credit losses should corporate sector fundamentals deteriorate. In this regard, the credit risk outlook remains particularly uncertain for energy-sensitive industries. While aggregate exposures to these sectors are not large, concentrated exposures may increase risks, especially for leveraged and liquidity-constrained NBFIs. In addition to liquidity needs from investor redemptions, insurance policy lapses and margin calls, the broad-based correction of financial asset prices has been the main driver of a significant decline in the total value of assets in the non-bank financial sector.
NBFIs are exposed to a further rise in bond yields and possible forced asset sales amid low liquid asset holdings. In a context of rising bond yields, NBFIs’ duration risk remains elevated, exposing the sector to further bond portfolio revaluation losses. That said, in the medium term, the transition to a higher interest rate environment could, in addition to reducing the incentives for NBFIs to search for yield, benefit the life insurance and pension fund sector because of their structural negative duration gaps (with the duration of liabilities typically exceeding that of their assets) (Section 4.3 and Box 4). While the cash holdings of investment funds have risen since early 2022 (Chart 3, panel b), their holdings of liquid assets remain relatively low amid rising volatility and the lack of a sufficiently developed macroprudential approach for addressing liquidity mismatches in open-ended funds. As such, the risk remains high that investment funds could, in an adverse scenario, amplify a market correction via procyclical selling behaviour. In addition, NBFIs which use interest rate derivatives, including insurance companies and pension funds (Section 4.1 and Box 3), are exposed to funding liquidity risk from unexpectedly large margin calls. Subsequent forced asset sales could worsen a market sell-off and increase wider risks to financial stability.
Chart 3
Non-bank financial institutions in the euro area have been de-risking, but credit, liquidity and duration risks continue to linger amid rising rates and weaker growth
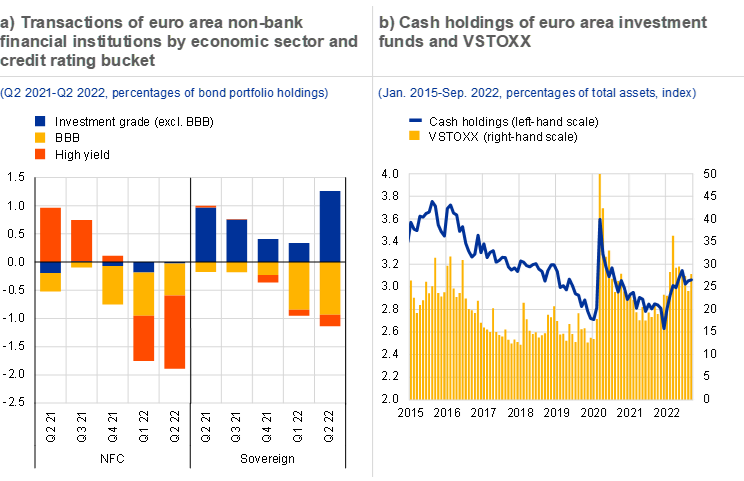
Sources: CSDB, Bloomberg Finance L.P., Refinitiv, ECB (Securities Holdings Statistics, Balance Sheet Items, Investment Funds Balance Sheet Statistics) and ECB calculations.
Notes: Panel a: non-banks include investment funds, insurance corporations and pension funds. Unrated holdings are excluded. NFC stands for non-financial corporations. Panel b: the latest data point is an estimate assuming total assets remained constant from August 2022. Cash holdings are defined as deposits vis-à-vis euro area investment funds other than money market funds reported by monetary financial institutions excluding the ESCB in the euro area divided by total assets of euro area investment funds.
Higher funding costs and less fiscal space for sovereigns
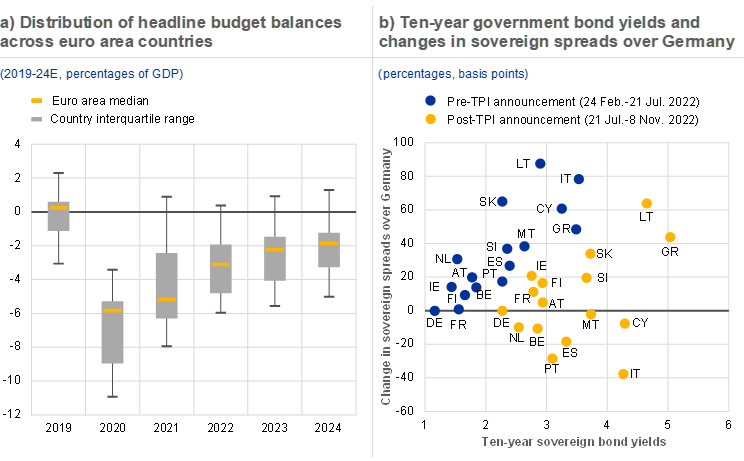
Sovereign vulnerabilities have increased amid ongoing fiscal support to cushion the impact of higher energy prices and a weaker economic outlook. Euro area governments have spent around 1.4% of GDP on discretionary measures since the invasion of Ukraine (Section 1.2). Most of this reflects support to cushion the rise in energy prices and inflation, and several governments have announced extensions to energy support into 2023. This sizeable stimulus comes at a time when governments had only just ended pandemic-related support measures and when the normalisation of the monetary policy stance has started. Prolonged high deficits in a number of countries (Chart 4, panel a), coupled with rising funding costs, may not only limit the fiscal space available to shelter the economy from future shocks, but may also put debt dynamics on a less favourable trajectory, especially in countries with higher levels of debt. To preserve debt sustainability and limit the risk of fuelling inflationary pressures, support measures should be temporary and targeted towards the most vulnerable households and firms.
Chart 4
Downside risks to public finances have risen further as fragmentation concerns resurface amid energy price support and a slowing economy
Sources: IMF (Fiscal Monitor), Refinitiv and ECB calculations.
Notes: Panel a: figures for 2022-24 are projections. Panel b: ten-year sovereign bond yields are shown as at the last day in the reference period.
Resurgent concerns that some countries could face excessive increases in sovereign financing costs have been partly mitigated by policy action. On the funding side, government bond yields have increased sharply across the euro area over the past six months. In recent years, though, many sovereigns have locked in a greater fraction of their financing at low interest rates and longer maturities, reducing their vulnerability to abrupt shifts in market sentiment. However, higher funding costs may still represent a greater near-term risk for those countries with high short-term debt servicing needs. Short-term market pressures increased in a number of countries in early summer, as tighter financing conditions spurred fragmentation concerns in euro area sovereign debt markets (Box 1). Since then, the widening of sovereign yield spreads has stabilised (Chart 4, panel b), as reinvestment flexibility under the ECB’s pandemic emergency purchase programme was exploited and the Transmission Protection Instrument (TPI) was approved by the ECB’s Governing Council on 21 July 2022. This new tool is designed to counter any unwarranted and disorderly market dynamics that pose a serious threat to the transmission of monetary policy across the euro area.
Low growth, high inflation and rising rates are exposing corporate and household vulnerabilities
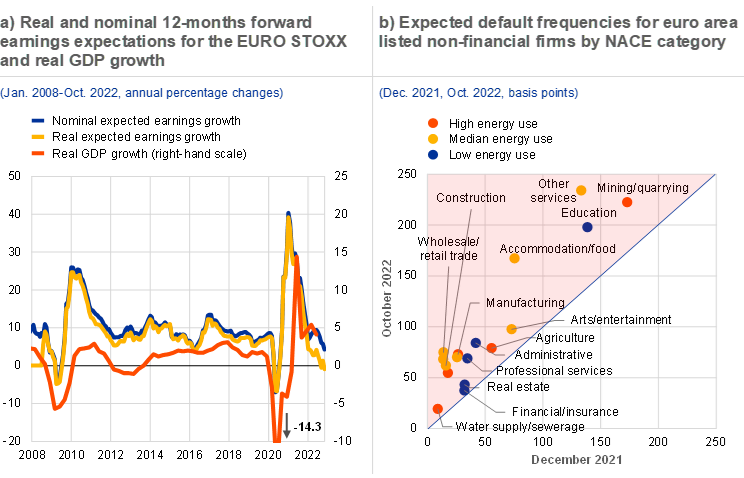
Euro area firms are challenged by high inflation and energy prices, recession risks and tighter financial conditions. On aggregate, in the first half of 2022 euro area corporates saw profitability return above pre-pandemic levels (Chapter 1.3), as firms were still able to pass on higher input prices to customers. However, a weaker economic outlook and, for some firms, growing margin pressures have seen corporate earnings growth expectations turn negative in real terms recently – a development previously observed during the global financial crisis and the pandemic (Chart 5, panel a). At the same time, euro area firms face challenges from higher market-based and bank funding costs. There are also signs of corporates switching from bonds to bank loans, given a faster pass-through of policy rate increases to bond yields. That said, the ongoing tightening of credit supply, coupled with the deterioration of economic prospects, indicates that bank lending volumes may soon moderate too.
Chart 5
Euro area corporates face growing headwinds from declining earnings, weaker growth expectations and rising default risks
Sources: Bloomberg Finance L.P., Haver Analytics, Refinitiv, Moody’s Analytics, Eurostat, OECD (Trade in Value Added (TiVA) database (2018)) and ECB calculations.
Notes: Panel b: expected default frequencies shown are monthly averages of sectoral medians for publicly listed firms in euro area countries. Direct and indirect energy use is measured by the share of input from mining and quarrying, energy-producing products, coke and refined petroleum products and the electricity, gas, steam and air-conditioning industries for each sector, classified according to the United Nations International Standard Industrial Classification for All Economic Activities (ISIC), Rev. 4. “High energy use” refers to the sectors with energy use in the 75th percentile, “Low energy use” refers to The energy use for the sector mining/quarrying is measured as the energy use in mining and quarrying, non-energy producing products and mining support service activities.the sectors with energy use in the 25th percentile and “Median energy use” refers to the sectors with energy use in between the 25th and 75th percentile.
Corporate vulnerabilities are greater for energy-intensive firms which may face growing debt servicing problems. A sharper economic slowdown, together with a further tightening of financing conditions, may in particular challenge those firms that exited the pandemic with higher debt levels, more subdued earnings and lower liquidity buffers – many of which also have lower credit ratings. At the same time, higher energy and commodity prices could hurt activity in those energy-intensive sectors that are less able to pass on higher costs to customers, such as some utility and construction firms. Small and medium-sized enterprises benefited less from the post-pandemic rebound in economic activity and may be particularly vulnerable to a slowdown in economic activity and higher borrowing costs. While corporate insolvencies have remained well below their pre-pandemic levels, some sectors have already seen an increase in expected default rates (Chart 5, panel b) and might be at greater risk of insolvencies in the event of adverse economic surprises or of a further tightening of financial conditions, or both.
Chart 6
Deteriorating financial position of euro area households may be made worse by a turn of the real estate cycle

Sources: Bloomberg Finance L.P., European Commission, ECB (Consumer Expectations Survey, Bank Lending Survey) and ECB calculations.
Notes: Panel a: data cover surveys from Belgium, Germany, Spain, France, Italy and the Netherlands. The expected drop in real income is calculated as the mean of households’ income expectations 12 months ahead (percentage change) minus mean inflation expectations over the next 12 months (percentage change). Income quintiles are computed at survey wave-country level. Panel c: REIT stands for real estate investment trusts. The FTSE EPRA Nareit Eurozone Residential Index is used here to calculate the relative performance against the EURO STOXX 50 index.
High inflation is weighing on the disposable income and debt servicing capacity of lower-income euro area households in particular. Against the backdrop of higher inflation and energy prices, the outlook for euro area households has become gloomier, as reflected by a plunge in consumer confidence and expectations regarding their financial situation (Section 1.4). The squeeze on real incomes is expected to affect lower-income households disproportionately (Chart 6, panel a), as they often spend a larger proportion of their incomes on food and energy. Erosion of real disposable income and savings, together with higher interest rates, weakens households’ debt servicing capacity, particularly in countries where household debt levels are more elevated. Simulations of the impact of consumer price rises and interest rate changes on the near-term financial health of households reveal a more pronounced risk of default in lower income quintiles (Special Feature B), particularly for consumer credit. That said, there are a number of mitigants, including the small share of these households in overall household sector (especially mortgage) debt. Moreover, despite a weaker growth outlook, resilient labour markets have so far supported incomes, and the shift towards more fixed-rate mortgage lending in recent years shields many households from the immediate impact of higher interest rates. The use of macroprudential policies, notably borrower-based measures, in most euro area countries in recent years has also helped to limit excessive household borrowing.
Signs of a turn in the real estate cycle may compound the vulnerabilities of euro area household incomes and balance sheets. While moderating somewhat, euro area property markets still saw almost double-digit nominal price increases and sustained strong lending growth in the second quarter of 2022 (Section 1.5). However, households’ reported intentions to buy or build a home point to a turn in the real estate cycle, mirroring the sharp increase in interest rates on new mortgage loans since the start of 2022 (Chart 6, panel b). Also, providers of finance have become more cautious, as residential real estate investment trusts (REITs) have significantly underperformed the broader stock market and euro area banks have tightened their credit standards for mortgage loans (Chart 6, panel c). Overall, there are signs that the real estate expansion of recent years could come to an end, with overvaluation estimates and mortgage rates now standing at their highest levels in more than five years. Similarly, financing conditions in commercial real estate (CRE) markets have tightened, potentially reversing the post-pandemic recovery. According to survey data, a growing share of investors now see the market in the downturn phase of the cycle. A more pronounced correction in CRE markets could prompt investor losses, higher credit risk for lenders and a decline in collateral values.
Higher interest rates support bank profits, but worsening asset quality and higher funding costs pose headwinds
Rising interest rates have bolstered the short-term profitability outlook of euro area banks, which are becoming more active in hedging interest rate risk. Euro area bank profitability improved slightly in the first half of 2022, underpinned by lower operating expenses, still low loan loss provisions and higher operating income thanks to wider margins and stronger lending volumes (Chapter 3.2). Accordingly, bank analysts have also revised up their 2023 return on equity (ROE) forecasts for listed euro area banks to around 8%, as a higher interest rate environment bolsters their net interest income and, in turn, bank profitability (Chart 7, panel a). However, these expectations assume that future credit losses remain limited and are subject to downside risks. In terms of managing interest rate risk, euro area banks have become more active in the interest rate swaps market since early 2021. In particular, they have generally been net buyers of floating rate payments, hedging the risk from fixed-rate euro-denominated assets (Box 3).
A weaker economy and increased credit risk may weigh on bank profitability prospects in the medium term. Despite a significant worsening of the economic outlook, the asset quality of euro area banks showed no signs of broad-based deterioration in the first half of 2022, although recent trends in “underperforming” Stage 2 loans suggest some increase in credit risk. Since Russia’s invasion of Ukraine, loans to energy-intensive firms have seen higher probabilities of default compared with less energy-intensive firms (Chapter 3.1). As interest rates rise, banks could also face higher credit risks stemming from their exposures to vulnerable sectors which have grown in recent years, notably including residential real estate markets. Banks’ cost of risk, defined as the ratio of loan impairments to loans, has fallen to pre-pandemic lows (Chart 7, panel b), but could rise going forward driven by both the need for higher loan loss provisions and the adverse denominator effect from likely lower loan volume growth as macroeconomic prospects deteriorate (Chapter 3.2).
Chart 7
Benefiting from higher rates, banks’ profitability outlook has remained favourable, but prospects of worsening asset quality and higher funding costs create headwinds

Sources: Bloomberg Finance L.P., Refinitiv, S&P Global Market Intelligence, ECB and ECB calculations.
Notes: Panel b: cost-of-risk data are available until Q2 2022 only. Cost of risk is defined as impairments on loans divided by loans. PMI stands for Purchasing Managers’ Index.
Higher market funding costs for banks make it more challenging to fund low-yielding assets. Bond funding costs have risen markedly for banks during 2022 – even surpassing pandemic highs across most instruments – driven by expectations of monetary policy normalisation, growing recession fears and deepening geopolitical tensions (Chart 7, panel c). While bank debt markets have remained open with no signs of fragmentation across euro area countries, banks with lower ratings and/or MREL shortfalls may need to issue new debt at much higher funding costs amid limited investor appetite. In addition, rising rates on new deposits, in particular in countries with a higher incidence of negative deposit rates, and maturing TLTRO III funds have started to translate into higher average funding costs for banks. Given the large shift over the last decade from floating to fixed-rate lending, higher funding costs may dampen some of the benefits for banks from higher interest rates.
Pre-existing structural weaknesses, together with a greater need to manage cyber risk, remain a challenge for banks looking ahead. Growing cyclical headwinds are compounded by longer-term challenges associated with low cost-efficiency, limited revenue diversification and remaining overcapacity in parts of the euro area banking sector. Accelerated digitalisation would help remedy some of these long-standing issues, although it comes at a cost of greater exposure to the threat of cyber risks (Special Feature C). However, heightened macro-financial uncertainty may delay the digital transformation plans of euro area banks, dampening their sustainable long-term profitability. In addition, euro area banks also need to manage the implications of the transition to a greener economy, including underlying concentration risks associated with climate-related exposures (Box 5).
Macroprudential policy enhances banks’ resilience, but the policy framework for non-banks must be strengthened
Prudential regulation and policy since the global financial crisis have helped put euro area banks in a good position to withstand the unfolding economic challenges. Despite several mitigating factors, accumulated macro-financial vulnerabilities have been compounded by the war in Ukraine, and the deteriorating economic outlook, inflationary pressures and tighter financing conditions are weighing on the debt servicing capacity of households and firms alike. At the same time, risks are more likely to materialise, given the possibility of further geopolitical and economic shocks. In this challenging environment, the substantial strengthening of bank balance sheets and capital positions over recent years has ensured that the sector is well-prepared to adapt to the potential materialisation of risks.
While considering headwinds to economic growth, macroprudential policy action can still help preserve and strengthen resilience across the financial system. Macroprudential policies, and in particular capital buffers consistent with the prevailing level of risk, help to ensure banks’ resilience and their ability to support the economy when systemic risk materialises. While activating buffers at an early stage has important benefits, increasing buffer rates can still be beneficial at the current, late stage of the financial cycle, provided that procyclical effects are avoided. Some countries with macro-financial imbalances may still increase macroprudential buffers, also considering that the existing capital headroom and remaining ability of many banks in the euro area to generate profits mitigate the risk of procyclical consequences (i.e. tighter lending conditions). Nevertheless, possible macroprudential policy responses need to take account of the highly volatile and uncertain course of the energy crisis in Europe and should be properly tailored to the specific conditions in each country. Irrespective of any macroprudential measures, banks themselves should ensure that their provisioning practices and capital planning properly account for the deteriorating risk environment and are aligned with supervisory expectations. Moreover, to enhance resilience over the medium term, the focus should remain on improving the effectiveness of the macroprudential toolkit and faithfully implementing Basel III.
Persistent vulnerabilities in the non-bank financial sector and recurring liquidity challenges make it important to expedite the policy response. While the Financial Stability Board (FSB) is currently assessing the effectiveness of its 2017 recommendations on liquidity mismatch in open-ended investment funds,[1] concrete policy proposals have already been developed for reforming money market funds (MMFs) globally.[2] In the light of the vulnerabilities that surfaced in March 2020 and the latent risk of renewed stress in the MMF sector, it is important that legislative reforms for MMFs be implemented in the EU without delay. The policy response on open-ended funds should aim to significantly reduce vulnerabilities arising from liquidity mismatch by better aligning redemption terms with asset liquidity (Chapter 5 and Box 6). Enhancing the availability and use of anti-dilution liquidity management tools should be part of the policy response, but this should not be seen as a substitute for more structural measures, such as minimum notice periods or requirements targeting asset liquidity. Another key priority for the international work should be to develop a globally consistent approach for addressing risk from leverage – including synthetic leverage – in the non-bank financial sector. In addition, recent volatility in financial markets and associated liquidity challenges have again emphasised the need to improve margining practices and NBFI preparedness to meet margin calls in derivatives transactions. Since agreeing and implementing such regulatory reforms internationally will take some time, NBFI supervisors should pay particularly close attention at this time to credit risk, liquidity risk and leverage in NBFIs, and take an active role in strengthening resilience within their mandate and existing regulatory frameworks.
Overall, financial stability conditions have deteriorated further in the euro area since the May 2022 FSR. Upside risks to inflation, especially from energy prices, and downside risks to growth have increased and are coupled with uncertainty around the precise path for monetary policy normalisation, less fiscal space, more volatile financial markets and multiple geopolitical risks. Together, these developments amplify the risk of disorderly adjustments in financial markets and pressures in NBFIs, as well as increasing debt sustainability concerns for more-indebted households, firms and governments. These vulnerabilities could materialise simultaneously and possibly reinforce each other, increasing the risks to euro area financial stability. In this challenging environment, targeted macroprudential policy can still support banks’ resilience, while risks in the non-bank financial sector should also be addressed from a systemic perspective.
1 Macro-financial and credit environment

1.1 Recession risks rise on energy prices and tighter financial conditions
Recession risks for the euro area have increased as energy prices have soared. Mounting pressure from gas supply disruptions, supply chain disruptions, elevated energy prices and weaker global trade are weighing heavily on economic activity. Private sector forecasters have downgraded their growth expectations for 2023 (-0.1% vs 2% in May 2022) while inflation expectations have increased further (5.8% vs 2.4% in May 2022, Chart 1.1, panel a). Moreover, inflation outturns have continued to overshoot consensus expectations, resulting in a global tightening of financial conditions (Overview). There are pronounced downside risks to central growth expectations, as reflected in an elevated probability of recession for all major western economies in the year ahead. Moreover, the pandemic continues to be a source of uncertainty, as the winter season might be accompanied by new containment measures. As a result, euro area economic growth-at-risk estimates for the year ahead are at highly elevated levels (-2.5%, Chart 1.1, panel b).
Chart 1.1
Forecasters increase inflation projections and pair back growth prospects as recession looms

Sources: Consensus Economics Inc., Bloomberg Finance L.P., Eurostat and ECB calculations.
Notes: Panel b: growth-at-risk is the 5th percentile prediction of a quantile regression model estimated on a panel of euro area countries*. Explanatory variables include current GDP growth and indicators of cyclical systemic risk, financial stress (Country-Level Index of Financial Stress), the debt service ratio and economic sentiment.
*) See Lang, J.H., Rusnák, M. and Greiwe, M., “Medium-term growth-at-risk in the euro area”, Working Paper Series, ECB, 2022, mimeo.
The severity of the energy crisis in the euro area has impacted the area’s terms of trade, weakening economic growth prospects. Although commodity prices have come down from their recent peaks, they remain elevated, particularly for natural gas and other energy commodities (Chart 1.2, panel a). As the euro area economy is a large net importer of energy, the euro area’s terms of trade have worsened in 2022. Maintaining import volumes at higher prices results in a transfer of purchasing power from the euro area to the rest of the world. This transfer has been more pronounced for euro area countries with more negative energy trade balances, because the composition of their exports does not allow such countries to benefit from positive terms of trade effects by exporting specific services, for instance (Chart 1.2, panel b). The negative income effect seems significantly larger in the euro area than in the United States and the United Kingdom, as these economies are less dependent on (net) energy imports.[3] This weaker trade position has also contributed to the sizeable depreciation of the euro’s exchange rate against its major global peers.
Chart 1.2
As a large net energy importer, the euro area economy faces deteriorating terms of trade, weighing further on growth prospects

Sources: Bloomberg Finance L.P., Eurostat and ECB calculation.
Notes: Panel a: the 25th-75th percentile range is calculated based on the Bloomberg commodity subindices. Panel b: the income effect of terms of trade is calculated by weighing export and import price changes by their respective previous-year values and considered as a percentage share of GDP.
Globally, the fallout from the energy shock and the accompanying monetary policy normalisation has tightened financial conditions and increased risks for emerging market economies. The ongoing normalisation of accommodative domestic monetary policies amid a common inflation shock has led to a tightening of financial conditions and capital outflows for many emerging market economies (Chart 1.3, panel a). Sovereign spreads in emerging market economies have risen sharply, leaving the countries with a large share of foreign-owned or foreign currency-denominated debt vulnerable to a further tightening of financial conditions (Chart 1.3, panel b). Moreover, commodity-importing countries are under particular pressure from sustained high food and energy prices. As such, tail risks could materialise if there is a further deterioration in financial conditions or a prolonged period of high commodity prices.
Chart 1.3
Emerging market economies look increasingly vulnerable as global financial conditions tighten

Sources: IMF, Goldman Sachs, Bloomberg Finance L.P., Bank for International Settlements and ECB calculations.
Notes: Panel a: capital flows show the sum of equity and debt capital to Turkey, South Africa, Brazil, Chile, Mexico, Lebanon, Sri Lanka, India, Malaysia, Pakistan, the Philippines, Thailand, Bulgaria, China, Ukraine, Czech Republic, Slovakia, Estonia, Latvia, Hungary, Lithuania, Mongolia, Slovenia, North Macedonia, Poland and Romania*. The financial conditions index is shown as the six-month moving average. Panel b: debt service ratio as a percentage of GDP for the private non-financial sector, see the Bank for International Settlements database for the debt service ratios of the private non-financial sector. Orange bubbles reflect changes in financial conditions or debt service ratio above the median, red bubbles reflect both changes in financial conditions and debt service ratio above the median. Change in financial conditions reflect yearly change.
*) see Koepke, R. and Paetzold, S., “Capital Flow Data – A Guide for Empirical Analysis and Real-time Tracking”, IMF, 2020.
Stress in the Chinese residential real estate sector has risen in recent months, increasing the downside risks to the global economy. This is reflected in a continued contraction in residential real estate sales. In addition, strict pandemic containment policies continue to depress economic activity, which is forecast to grow at around 4% per annum in the period 2022-23, significantly below the long-term average of 8%. Although the government’s interventions have largely contained the fallout from the real estate sector so far, the combination of strict zero-COVID policies and limited fiscal space could undermine its ability to manage future shocks. All in all, these developments add further downside risks to global economic prospects, with potentially significant spillovers to the euro area.[4]
In sum, both the global and the euro area economy are facing a turbulent period, with risk stemming from tighter financial conditions, high indebtedness and soaring prices. Global economies are facing a historic inflation shock, while growth prospects have materially weakened and there are further pronounced downside risks to growth. High energy prices and tighter financial conditions are translating increasingly into financial market volatility, a weakening outlook for corporate earnings and a deteriorating fiscal outlook (Sections 1.2 and 1.3). Against this background, the risks stemming from exposing vulnerabilities to financial stability have increased since the previous issue of this review.
1.2 More constrained fiscal space available to cushion the economy
Fiscal positions have been weakened by the economic outlook, the impact of the war in Ukraine and a further tightening of financial conditions. The euro area budget balance is expected to improve steadily in the period to 2024, but by less than foreseen in May (Chart 1.4, panel a). The budget balance for this year is expected to be -3.8% of GDP (versus -3.1% forecast in May) and by 2024 is expected to be -2.7% of GDP (versus -2.3% forecast in May). Fiscal assumptions and projections are currently surrounded by a high degree of uncertainty, given the elevated macroeconomic risks and the wider fallout from the Russian invasion of Ukraine. Moreover, it is estimated that the total fiscal stimulus related to reducing the impact of the war and the energy crisis on households and corporations will increase to at least 1.4% of GDP in 2022.[5] This sizeable stimulus follows pandemic-related support measures which were only just being wound up. Most of these measures are untargeted (Chart 1.4, panel b). Ideally, support measures should become more targeted and should aim to cushion the parts of the economy most affected by the current energy crisis.
Sovereign financing conditions have tightened significantly as credit risk premia have increased. Government bond yields have increased sharply since the previous issue of the Financial Stability Review, but so far government bond spreads have moved steadily in line with risk-free rates. Moreover, measures of sovereign stress – such as the ECB Sovereign Systemic Stress Composite Indicator – have shown a significant increase, but higher-debt countries have not been any more affected than other euro area countries. At the same time, debt servicing needs remain elevated, with some euro area countries facing refinancing and interest expenditure of around 40% of GDP over the next two years (Chapter 2).[6] Moreover, the increase in interest rates is weighing more heavily on fiscal positions than previously anticipated. As such, a further deterioration in financial conditions could change market sentiment towards some of the more vulnerable euro area sovereign issuers (Box 1).
Rollover risks are elevated but are currently being kept in check by several other structural factors. Although rollover risks have increased, sovereigns might be more resilient to deteriorating financial conditions than they were during the previous hiking cycle for a number of reasons. First, the lengthening of the maturity of the outstanding debt stock means that principal repayment needs are about 15% lower than they would have been for running the same amount of debt against the maturity profile in 2010.[7] Second, although yields have been increasing, the average interest paid on outstanding government debt for most euro area sovereigns is still hovering around record lows (1.6% in September 2022). Finally, the Transmission Protection Instrument partly reduces the risk of there being an unwarranted increase in risk premia.
Chart 1.4
Public finances are challenged by a slowing economy, tighter financial conditions and the need for additional support measures

Sources: September 2022 ECB staff macroeconomic projections and European Commission.
Notes: Panel a: the grey line depicts the 3% of GDP budget deficit threshold set in the Maastricht Treaty. The data refer to the aggregate general government sector of euro area countries. The fiscal stance is adjusted for the impact of Next Generation EU grants on the revenue side. The cyclical component refers to the impact of the economic cycle as well as that of temporary measures implemented by governments and includes one-off revenues and one-off capital transfers. For the snowball effect, i-g stands for interest rate-growth differential. Panel b: figures represent the shares of different types of measures in 2022 as at 31 October 2022, “price measures” are those that have a direct impact on the marginal cost of energy consumption, “income measures” are those providing temporary income support to households or (non-price) compensations to firms, “targeted” refers to measures specific to vulnerable households or firms.*
*) See Bethuyne, G., Balcerowicz, W. and Erdei. M., “Budgetary policy measures to mitigate the impact of high energy prices on households and firms: methodology and budgetary impact”, European Commission, November 2022.
Despite the sizeable deficits, higher nominal GDP and a favourable snowball effect have helped to place government debt-to-GDP ratios on a declining trajectory. Euro area debt-to-GDP is projected to decline from 95.6% of GDP in 2021 to 89.9% in 2024, thereby remaining significantly above pre-pandemic levels (84%). The expected decline is driven mainly by expectations of a favourable interest rate-growth differential because of high nominal GDP growth, which should more than offset the persisting, albeit decreasing, primary deficits. Moreover, sovereign debt ratios have benefited from a declining real debt burden owing to first round effects (a favourable denominator effect, Chart 1.5, panel a)[8]. However, higher than expected inflation could contribute to deteriorating debt servicing capacity, even as inflation may reduce the real value of outstanding debt.[9] As such, risks to sovereign indebtedness are to the upside as a stagnating economy and higher-than-anticipated deficits might turn debt dynamics less favourable.
Chart 1.5
Inflation is currently reducing debt ratios, but could prove more detrimental to debt dynamics in the medium term if driven by an external supply shock

Sources: ECB and ECB calculations.
Notes: Panel a: the debt-deficit adjustment captures the effects of the accumulation or sale of financial assets*. Inflation reflects the difference between real and nominal GDP, i.e. the GDP deflator. Panel b: the shock is calibrated to lead, in the absence of any monetary policy reaction, to a 1 percentage point increase in HICP inflation over three years. It is designed as a series of unexpected cost-push shocks originating in the rest of the world on their export of goods. This shock is analysed using the Euro Area and Global Economy (EAGLE) model, a multi-country dynamic stochastic general equilibrium model calibrated for the euro area’s four biggest countries, the rest of the euro area and the rest of the world. To limit the substitutability between goods imported from the rest of the world and euro area tradable goods, the elasticity has been lowered to take into account the high dependency of euro area countries on commodities imports. This calibrated parameter in EAGLE was lowered from 1.5 to 0.9 to reflect this dependency of euro area economies on some commodities imports.
*) Kezbere, L. and Maurer, H., “Deficit-debt adjustment (DDA) analysis: an analytical tool to assess the consistency of government finance statistics”, Statistics Paper Series, No 29, ECB, November 2018.
In a downside scenario, an inflationary supply shock originating from outside the euro area could prove particularly detrimental for public debt developments. An external supply shock could prove to be particularly unfavourable for public finances in the medium term. Simulations considering a stylised 1% inflationary supply shock show that the negative impact on economic activity might outweigh the positive impact of higher inflation on debt ratios (Chart 1.5, panel b). Despite the positive impact of inflation (indicated by a debt-reducing contribution of deflator growth), the decline in real growth, higher interest payments and a deteriorating cyclical budgetary component would contribute to a debt-to-GDP level that would be almost six percentage points higher over a ten-year horizon compared with the benchmark scenario. Although the currently observed shock is much more complex and involves additional demand components, its strong supply component may slow and, in some countries, even reverse the decline in sovereign debt ratios anticipated by the current benchmark scenario.
The fiscal space available to cushion the economy from an economic downturn is becoming more limited. Looking ahead, fiscal policy will be affected by both exposure to the war and the slowdown in economic activity. Moreover, a further inflationary shock driven by factors outside the euro area economy might be particularly bad for sovereign indebtedness, causing sovereigns to have less resilience to increasing debt service costs. For these reasons, the fiscal space available to cushion the economy from an economic downturn is becoming more constrained. Moreover, although the current support measures have helped to prevent tail risks from materialising during the COVID-19 pandemic, they would ideally be replaced by more targeted measures supporting those firms and households most impacted by the energy crisis. All in all, these adverse developments could trigger a reassessment of sovereign risk by market participants and reignite pressures on more vulnerable sovereigns (Box 1).
Box 1
Euro area spread divergence, risk premia and financial stability[10]
When financial fragmentation becomes a self-reinforcing dynamic, it can present a risk to financial stability.[12] As long as market functioning is orderly, credit spreads reflect macroeconomic fundamentals and risks. However, history has shown that spread-widening dynamics can become self-reinforcing. In the euro area, such adverse market dynamics have often been termed “fragmentation”. This is often associated with impaired market liquidity conditions, ultimately resulting in impaired market functioning. In such conditions spread differences may start to diverge from fundamentals. However, differences in spreads alone do not necessarily point to fragmentation (Figure A).
More1.3 Corporate resilience tested by energy price and borrowing costs
Following the sharp recovery and high profits seen over the past year, euro area corporates now face stagnating activity and tightening financial conditions. Backward-looking measures of aggregate corporate vulnerabilities have remained below their long-run average, with surprisingly strong gross profits (8% above pre-pandemic levels in the second quarter of 2022). Additionally, public support measures implemented by governments have helped to mitigate the adverse effects of the COVID-19 pandemic. Moreover, despite the overall tightening of financial conditions, lower indebtedness and a high interest coverage ratio are keeping corporate vulnerabilities below their long-term average (Chart 1.6, panel a). However, corporates are facing new challenges and corporate vulnerabilities are expected to increase above their long-run average over the coming quarters because of a worsening interest coverage ratio, higher financing costs, fading activity and higher leverage. Moreover, small and medium-sized firms (SMEs) have benefited less from the rebound in economic activity, as survey indicators suggest that their profitability is still lagging that of large corporations (Chart 1.6, panel b). These firms might be at a higher risk of insolvency if economic activity surprises to the downside and financial conditions tighten further.
Chart 1.6
Corporate vulnerabilities are expected to increase, especially for SMEs

Sources: Eurostat, Quarterly Sector Accounts, the ECB’s survey on the access to finance of enterprises (SAFE), H1 2022.
Notes: Panel a: positive values indicate higher vulnerability while negative values indicate lower vulnerability* Panel b: the chart refers to rounds 3-26 of the SAFE survey (from March 2016-September 2016 to October 2021-March 2022). Net percentages are the difference between the percentage of enterprises reporting an increase for a given factor and the percentage reporting a decrease. The data included in the chart refer to Question 2 of the survey.
*) For the construction of the index in more detail, see the box entitled “Assessing corporate vulnerabilities in the euro area”, Financial Stability Review, ECB, November 2020.
The sharp increase in energy prices may challenge certain business models and may negatively impact the competitiveness of euro area firms. Business confidence has started to decline in those sectors that are most energy intensive (Chart 1.7, panel a). At the same time, the ECB’s bank lending survey and hard data on bank loans show that loan demand has increased strongly for short maturities, reflecting the increased need for firms to cover higher production costs (Chart 1.7, panel b).[13] This is also reflected by the larger increase in leverage for sectors with a high exposure to commodities (Chart 1.7, panel c). Going forward, it might become difficult to sustain high output prices as economic activity stagnates while supply pressures remain. Moreover, as the euro area is a large net importer of energy, the current energy price shock – and in particular higher gas prices in the euro area – is negatively impacting the competitiveness of euro area firms. Producers therefore might have less pricing power than their international competitors to pass on higher costs and input prices to end users (Section 1.1). This has put some corporates in a vulnerable position, particularly those with elevated debt service needs, high energy use and fixed contractual obligations.
Chart 1.7
Business prospects look bleaker for sectors with high energy intensity as corporates take on more debt to cover the cost of doing business

Sources: European Commission, OECD (Trade in Value Added database (2018)), Bloomberg Finance L.P. and ECB calculations.
Notes: Panel a: direct and indirect energy use is measured by the share of input from mining and quarrying, energy-producing products, coke and refined petroleum products and the electricity, gas, steam and air-conditioning industries for each sector, classified according to the United Nations International Standard Industrial Classification for All Economic Activities, Rev. 4. Panel b: “actual” values are changes that have occurred while “expected” values are changes that are expected by banks. Net percentages for the questions on demand for loans are defined as the difference between the sum of the percentages of banks that responded “increased considerably” and “increased somewhat” and the sum of the percentages of banks that responded “decreased considerably” and “decreased somewhat”. Panel c: commodity exposure is calculated as the market beta of the sector EURO STOXX subindex of the Bloomberg Commodity Index over the period Jan. 2015-Sep. 2022.
Tighter financing conditions have impacted firms’ debt servicing costs and might increase credit risk for more vulnerable firms. Corporate financing conditions have deteriorated as monetary policy has normalised and both markets and banks have reassessed the risks surrounding corporate activity (Chapter 2). Moreover, the shift from bank loans towards market-based funding seen since the financial crisis is currently helping to ensure that tightening financing conditions are having a more direct impact on corporate debt service ratios than was the case a decade ago.[14] As a result, the cost of debt has increased sharply in recent months.[15] Banks are also anticipating a further net tightening of credit standards in the future, reflecting the uncertain economic outlook (Chapter 3). This may be particularly concerning for the cohort of firms that exited the pandemic with higher debt levels, subdued earnings and lower liquidity buffers. At the same time, corporate balance sheets in most euro area countries are currently healthier than they were during previous rate hiking cycles. Gross debt and interest coverage ratios have improved, in particular for countries which started with higher debt levels in the non-financial corporate sector (Chart 1.8, panel a). Non-financial corporate debt levels declined to 150% of gross value added (GVA) in the second quarter of 2022 but remain above the 148% of GVA recorded before the pandemic.
Chart 1.8
High interest coverage ratios and lower debt levels give corporates some resilience as insolvencies remain low

Sources: ECB, Eurostat and ECB calculations.
Notes: Panel a: consolidated gross debt is defined as the sum of total loans granted to non-financial corporations net of intra-sectoral lending, debt securities issued and pension liabilities. The interest coverage ratio is defined as the ratio of gross operating surplus to gross interest payments before the calculation of financial intermediation services indirectly measured (FISIM). Panel b: minimum-maximum range calculated over the period Q1 2015-Q2 2022.
Insolvencies have remained well below their pre-pandemic levels, although they have increased in some economic sectors. Insolvencies remained below their long-term average in the second quarter of 2022 (Chart 1.8, panel b). At the same time, insolvencies in those sectors most heavily impacted by the pandemic remain above their long-run average. Moreover, forward-looking measures for insolvencies signal elevated insolvency risk for those sectors impacted by the current energy crisis, such as transport and industry. As such, insolvencies could rise in those sectors most affected by the current energy crisis and have not yet fully recovered from the impact of the pandemic.
All in all, corporate vulnerabilities have increased given that financial conditions are tightening, the cost of doing business remains high and economic activity is stagnating. Structural factors might mean the average corporate is in better health than it was during previous hiking cycles, providing corporates with some resilience to weather the current tightening of financial conditions. However, the uneven impact along the cross-section of firms during both the pandemic and the current energy crisis might imply that an economic recession could have more severe consequences for financial stability than this aggregate picture suggests. As such, defaults could increase going forward, with potential knock-on effects on bank balance sheets and household employment prospects.
1.4 Household vulnerabilities, previously contained, are rising
High inflation and fears of recession are clouding euro area households’ economic outlook. As households are increasingly worried about their future amid rising living costs and concerns over an economic downturn, consumer confidence and households’ expectations of their future financial situation have reached new historical lows (Chart 1.9, panel a). While buoyant labour markets, with a historically low unemployment rate of 6.6% in September 2022, have so far supported household incomes, inflation is continuing to squeeze their real disposable incomes. Higher spending on non-durables such as food and gas have shaped the rebound in consumer expenditures, but this mostly reflects higher prices (Chart 1.9, panel b). As the high savings rate seen during the pandemic normalises, households’ ability to cushion further price increases is gradually decreasing. Due to downturns in financial markets, households’ net worth has started to decline, standing at 750% of disposable income in the second quarter of 2022, down over 25 percentage points in the first half of the year.
Chart 1.9
Consumer sentiment is falling further amid continued high inflation, despite labour market strength supporting households

Sources: European Commission, Eurostat, ECB and ECB calculations.
Notes: Panel a: the latest data for the unemployment rate refer to September 2022.
Household borrowing has remained robust, although there are increasing signs it has reached a turning point. Household indebtedness has remained broadly stable, decreasing slightly to just under 97% of disposable income in the second quarter of 2022, although the figures vary greatly across countries. So far, credit provision to households has held up. Growth in lending for house purchase as well as consumption has remained stable in recent months, with September showing growth of 5.1% and 3.7% respectively, but the upward trend appears to have come to a halt (Chart 1.10, panel a). However, with interest rates on household credit having increased sharply in the wake of monetary policy normalisation and banks reporting a tightening of credit standards as well as a reduction in loan demand from households, a further moderation of lending volumes is likely.
Chart 1.10
Households’ indebtedness remains stable while interest rates have increased sharply
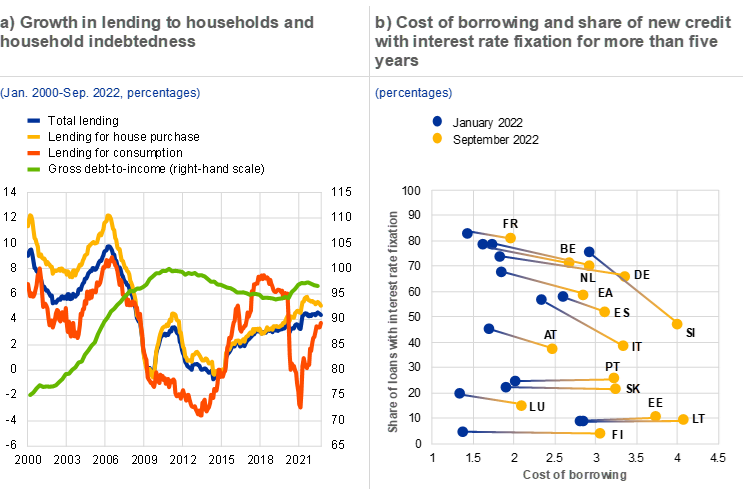
Sources: ECB (MFI Interest Rate Statistics, MFI Balance Sheet Items), Eurostat (Quarterly Sector Accounts) and ECB calculations.
Notes: Panel a: the latest data for the gross debt-to-income ratio refer to the second quarter of 2022. Panel b shows the share of new credit flows with initial interest rate fixation for more than five years of new lending to households for house purchase, consumption and other purposes, including renegotiations. The cost of borrowing is the average of interest rates on new lending to households for house purchase, consumption and other purposes, weighted by new lending volumes.
As interest rates rise, some households’ debt servicing capacity may suffer. In the low interest rate environment of the last decade, the share of new loans with interest rate fixation periods of more than five years has increased steadily in many countries, reaching almost 70% across the euro area in the first half of 2022. This has shielded many households from having their existing debt repriced at higher interest rates in the short term. However, following the sharp increase in interest rates the share of new loans with longer interest rate fixation periods has started to decline in a number of countries (Chart 1.10, panel b). Households may therefore become more exposed to interest rate risks in the medium term. As a further tightening of credit standards is expected, a cohort of households at the lower end of the income distribution – who may have high individual indebtedness, but overall account for a low share of aggregate debt – and a cohort of those that used low interest rates to exhaust their borrowing capacity may be at risk of falling into distress (Special Feature B).
Overall, vulnerabilities among households have increased further, although there are some resilience factors. While excess savings have been re-absorbed by inflation and net wealth has started to decline, the aggregate household balance sheet remains resilient and households are benefiting from the current strength of labour markets. At the same time, rising inflation is weighing on households’ real incomes and consumption, which could slow the economy’s growth path. Some households may have to limit consumption or become dependent on government support. Such vulnerabilities could worsen should labour market conditions deteriorate. The immediate effect of the rapid increase in interest rates on households’ debt servicing capacity is being mitigated by the longer interest rate fixation periods which have benefited many households in recent years. In the medium term, vulnerabilities could be exposed and debt servicing capacity could deteriorate, especially in countries where residential properties are overvalued, debt levels are elevated and household debt is prevalently at variable interest rates.
1.5 Vulnerable real estate markets may be at a turning point
Euro area residential real estate (RRE) markets have shown strong price and lending growth, but forward-looking indicators suggest a slowdown. Nominal house prices grew 9.3% at the euro area aggregate level in the second quarter of 2022 – a slightly lower rate than in the previous quarter (Chart 1.11, panel a). This strong growth led to increasingly stretched valuations in some euro area countries as house price dynamics exceeded the fundamentals. The stock of housing loans has continued to show stable growth, but the record steep increase in borrowing costs since the beginning of 2022 and the expected further tightening of financial conditions are likely to reduce demand for new loans going forward (Chart 1.11, panel b). Euro area households have also declared they are less likely to buy or build a home whilst a lower share of construction companies expect construction prices to increase and the residential construction PMI reflects a weakening of activity in this sector. As demand slows, the construction sector could come under pressure, potentially resulting in rising defaults and declining investment. Monthly data indicate that in some national RRE markets prices have been falling month-on-month since late summer.
Chart 1.11
RRE prices and lending have continued to show strong growth but forward-looking indicators point to a moderation in RRE prices
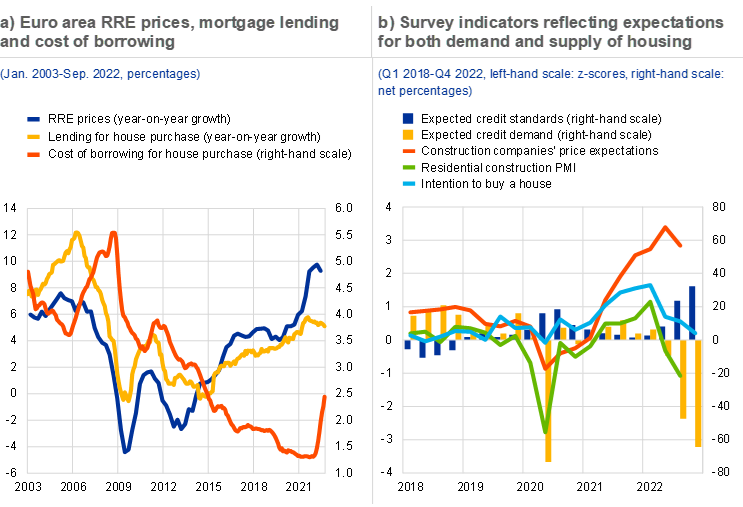
Sources: ECB, European Commission, S&P Global Market Intelligence and ECB calculations.
Notes: Panel a: the latest observation for RRE price growth is for the second quarter of 2022. Panel b: expected credit standards and demand refer to loans for house purchase. Intention to buy a house and construction companies’ price expectations are shown in standard deviations from long-term averages. Residential construction PMI is shown in standard deviations from 50, the level which demarcates expansionary (above 50) and contractionary (below 50) territory.
Higher interest rates will increase households’ debt servicing costs, with the speed of impact differing according to mortgage type. Between the beginning of the year and September 2022, interest rates on mortgage loans increased by over 110 basis points at the euro area level. Simulations using loan-level data from securitised mortgage loans from the end of 2021 show that an increase in interest rates of 200 basis points would lead to an increase in the loan servicing-to-income ratio of below eight percentage points for most loans (Chart 1.12, panel a). For floating-rate loans there would be a near-term increase in debt service burdens from recent very low levels. However, many households have benefited from falling debt service in recent years, when interest rates were decreasing. For fixed-rate loans the impact of higher interest rates would be seen mainly after 2027, as interest rate fixation periods would shield the existing debt of many households from higher interest rates for several more years.
The downside risks to euro area RRE prices have increased. Short-term downside risks to RRE prices have increased significantly, as reflected in the pronounced fall in RRE prices-at-risk in the first two quarters of 2022 (Chart 1.12, panel b). This potential decline in RRE prices in an adverse scenario is heterogenous across the euro area, with countries where valuations are more stretched generally facing a higher risk of a severe correction in RRE prices.[16] Such a pronounced downturn remains a tail risk as households have generally benefited from favourable labour market conditions and borrower-based macroprudential policy measures and the increasing share of fixed-rate mortgages has increased the resilience of borrowers in many countries in recent years.
Chart 1.12
The steep increase in borrowing costs might challenge some households’ debt servicing capacity while downside risks to RRE prices have increased significantly
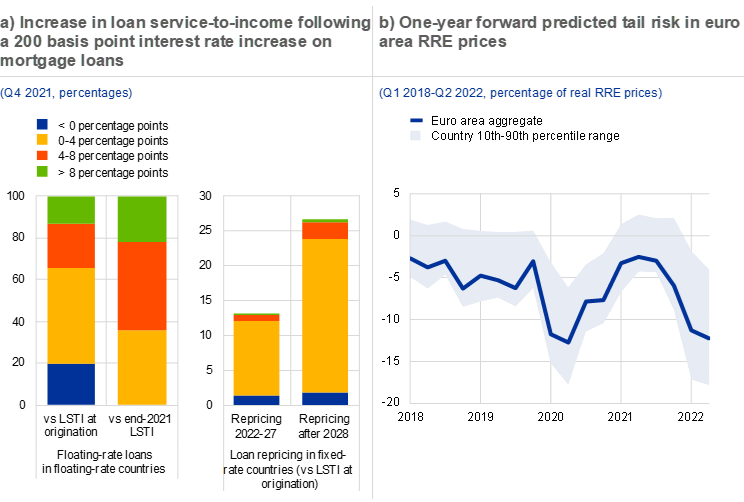
Sources: ECB, European DataWarehouse GmbH and ECB calculations.
Notes: Panel a: loans originated in the period 2012-20. The shock to interest rates is calculated over December 2021 levels. Based on data available for Belgium, Germany, Ireland, Spain, France, Italy, the Netherlands and Portugal. The chart uses information on securitised mortgage loans alone (potentially resulting in selection bias) and may therefore not be an accurate reflection of national mortgage markets. Belgium, Germany, France and the Netherlands are classified as fixed-rate countries while Ireland, Spain, Italy and Portugal are classified as variable-rate countries. The total is weighted by GDP. Further details on the methodology underlying this analysis can be found in the article entitled “Gauging the sensitivity of loan-service-to-income (LSTI) ratios to increases in interest rates”, Macroprudential Bulletin, Issue 19, ECB, October 2022. LSTI stands for loan service-to-income. Panel b shows the results from an RRE price-at-risk model based on a panel quantile regression on a sample of 19 euro area countries. The chart shows the 5th percentile of the predicted RRE price growth for the euro area aggregate and the 10th-90th percentile range of this estimate across individual euro area countries. Further details on the methodology can be found in the article entitled “The analytical toolkit for the assessment of residential real estate vulnerabilities”, Macroprudential Bulletin, Issue 19, ECB, October 2022.
Following some stabilisation from late 2021 to early 2022, forward-looking indicators are also pointing to a deterioration in commercial real estate (CRE) markets. While price index dynamics for the second quarter of 2022 remain broadly stable, there has been a sharp rise in both the share of investors who view the market as being in the downturn stage of the cycle and the share of investors who view CRE assets as overvalued. In addition, the vast majority of euro area CRE investors are now reporting a deterioration in financing conditions (Chart 1.13, panel a). This has coincided with a sharp rise in interest rates on new loans to non-financial corporations (Section 1.3) and a deterioration in financing conditions for real estate firms in both bond and equity markets. Survey data have also reported a sharp drop in investor demand across all CRE sectors. Market intelligence attributes this to the wait-and-see approach adopted by investors facing uncertainty on the future path of financing conditions, inflation and the macro-financial environment (Chart 1.13, panel b).
Chart 1.13
Forward-looking indicators also point to the possibility of another deterioration in CRE market conditions
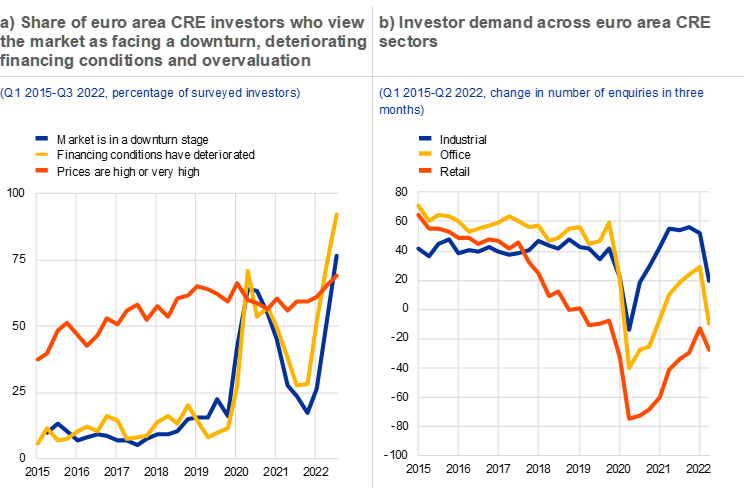
Sources: RICS and ECB calculations.
After a long period of rapid expansion, euro area real estate markets may have reached a turning point. Rising interest rates and forward-looking indicators are generally pointing to a moderation in RRE markets, but short-term downside risks have also increased, especially in those countries where debt levels are elevated and properties might be overvalued. CRE markets face similar headwinds, suggesting that the divergence between the two markets seen since the start of the coronavirus (COVID-19) pandemic may be coming to an end. A pronounced correction in CRE markets could have an adverse effect on the wider financial system and the real economy. This is because financial institutions may suffer from direct losses, increased credit risk and declines in collateral values, which could limit their ability to provide financing to non-financial corporations and which may be exacerbated through negative feedback loops.
2 Financial markets

2.1 Markets are fragile amid heightened macroeconomic uncertainty
The risk of financial market conditions turning disorderly has increased, against a backdrop of elevated inflation, growing recession fears and tighter global financial conditions. While inflationary pressures have risen, the growth outlook has weakened (Chapter 1). Markets for interest rates have shown elevated volatility, as market participants are continually adjusting their expectations with regard to the path of monetary policy.[17] Central bank communications and key economic and inflation data releases have, at times, been followed by relatively large adverse price moves across asset classes.[18] Expectations with regard to the path of policy rates, as seen through the lens of markets, have adjusted towards more frontloaded rate hikes in 2022 but fewer additional hikes in 2023 (Chart 2.1, panel a). Such central bank tightening while growth is slowing – in contrast to the monetary policy easing seen during previous episodes of weak growth – may add to downside pressures on risky-asset valuations. Also, while recent corrections in asset prices have been orderly, there is now an elevated risk of market dynamics turning disorderly.
Chart 2.1
Central banks react to inflation despite signs of looming recession risk
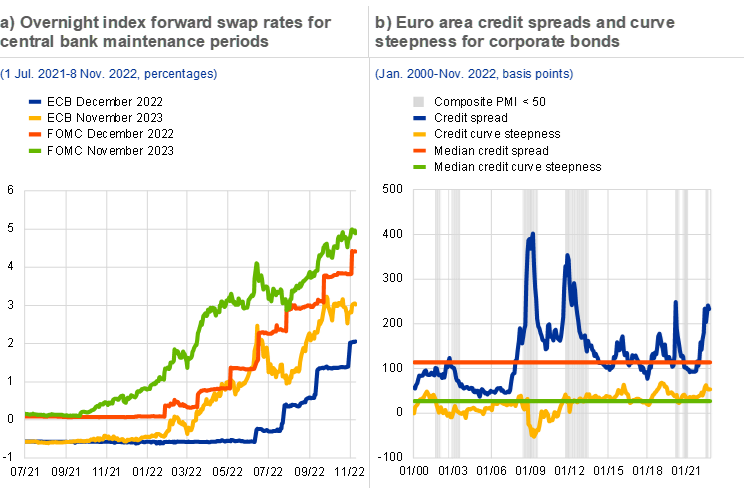
Sources: Bloomberg Finance L.P., Refinitiv, S&P Global Market Intelligence and ECB calculations.
Notes: Panel a: FOMC stands for Federal Open Market Committee. Panel b: credit spreads are based on the index-level option-adjusted spreads for ICE Bank of America indices for investment-grade euro-denominated corporate bonds. Credit curve steepness is computed as the spread-difference between the index covering the longer five-to-seven-year maturities and the index covering the shorter one-to-three-year maturities.
Market developments also reflect heightened recession fears, although there is still much uncertainty. The US Treasury yield curve shows a relatively strong inversion while the German government bond yield curve has flattened considerably: for the United States, inversion is frequently considered to indicate a higher risk of recession.[19],[20] The euro area may be especially vulnerable to recession risk due to its energy import dependence (see below and Chapter 1).[21] Euro area corporate bond spreads have become more elevated (Chart 2.1, panel b). At the same time, corporate bond credit curves remain upward sloping. During economic downturns, credit curves have, historically, tended to invert or flatten considerably.
The recent corrections in risky-asset valuations may have largely been driven by interest rates increases, and asset prices might still be stretched given the current outlook. Asset pricing theory implies that an asset’s fair value reflects the present discounted value of its expected future cash flows. When risk-free rates and risk premia increase, the present value of future cash flows falls. Risk premia tend to increase when risk-free rates increase, further eroding the value of risky assets (Chart 2.4, panel a).[22] Euro area equity prices declined as rates increased (Chart 2.2, panel a) and further (unexpected) rate increases could trigger additional corrections in risky-asset valuations. Given the importance of risk-free rates for the valuation of most assets, asset prices have also shown relatively strong co-movements across different asset classes. This stronger co-movement complicates hedging strategies and could lead to larger than expected and more frequent losses (Box 2).
Volatility in interest rate markets has been high, after both realised and expected inflation rates exceeded central bank targets. Risk-free rates depend strongly on the expected path of central bank policy rates. In a context of inflation running substantially above central bank targets, market participants have become more sensitive to news that could affect the policy rate path and realised interest rate volatility has increased markedly (Chart 2.2, panel b). More broadly, the combination of high government debt levels and elevated fiscal pressures (Chapter 1) and a less accommodative monetary policy stance puts further stress on interest rate markets. Rapid changes in interest rates can cause strains in markets and challenge financial institutions through, for example, margin calls on interest rate derivatives. An example of such strains is given by the recent turmoil in the UK’s sovereign bond market, which erupted in September after a new budget was proposed. Non-bank financial institutions, notably pension funds, came under liquidity pressures from margin calls on interest rate derivatives and leveraged positions on government bonds. This also underpins the importance of liquidity preparedness for non-bank financial institutions, especially when leverage is used (Chapter 4 and Chapter 5).
Chart 2.2
Risky-asset valuations fell as rates increased and interest rate volatility increased markedly as inflation exceeded central bank targets

Sources: Bloomberg Finance L.P. and ECB calculations.
Notes: Panel a: equity index performance is based on the EURO STOXX index price change relative to 1 January 2022. The real risk-free rate is the difference between the ten-year German government bond yield and the ten-year German government bond inflation breakeven rate. Data points between 24 February and 1 April 2022 are marked in yellow to indicate the market reaction to the invasion of Ukraine. On 4 April 2022 the VSTOXX fell below 30 points for five consecutive days for the first time since the start of the invasion, indicating a (partial) recovery of risk sentiment. During the preceding period, markets could be characterised by “risk-off” sentiment, whereby equities temporarily underperform and rates outperform. Such a period thus results in a temporary deviation in the scatter plot in the bottom-left direction, during which the relationship between rates and equity prices is positive. Panel b: OIS stands for overnight index swap.
Market liquidity in bond markets has been relatively poor recently, increasing the likelihood of disorderly market dynamics taking hold. Market liquidity affects the ease with which market participants can buy or sell assets without making large price concessions. Elevated bid-ask spreads suggest that euro area bond markets have become more illiquid (Chart 2.3, panel a). US Treasury markets are also showing signs of increased frictions (Chart 2.3, panel b). Market liquidity can deteriorate quickly in times of stress, amplifying the risk of fire sale dynamics taking hold (Chapter 4).
In summary, while recent market corrections have been relatively orderly, market dynamics may turn disorderly in the event of further adverse shocks. In the context of increased recession risk, tightening financial conditions, high volatility and signs of lower liquidity in rates and credit markets, further adverse shocks are more likely to trigger a disorderly correction in risky-asset valuations. Adverse shocks may also be more likely owing to high levels of economic and macro-financial uncertainty. Triggers could emanate from the continued stresses in the Chinese economy, emerging market vulnerabilities and geopolitical developments.[23]
Chart 2.3
Market liquidity deteriorated in US Treasury and euro area bond markets

Sources: S&P Global, Refinitiv and ECB calculations.
Notes: Panel b: the spline spread deviation is the average distance in basis points of individual bonds’ yield deviations from a smooth yield curve fit – a spline fit. In an efficient and liquid market, larger deviations from such a smooth curve would likely disappear through arbitrage. A failure-to-receive can occur in the post-trade process if the seller of a security does not manage to deliver that security to the buyer. The failure-to-receive metric covering the number of settlement failures for US Treasury primary dealers is not technically a liquidity metric, but instead indicates market frictions in a broader sense.
2.2 Debt issued by more-indebted sovereigns and firms poses vulnerabilities
The challenging environment of higher inflation, lower growth and tightening financial conditions could lead to stress in debt markets, especially for more-indebted issuers. Higher interest rates have a larger negative impact on the profits of more indebted firms, and they also have a larger negative impact on the fiscal positions of more indebted governments. Moreover, market rates and spreads have increased more for more-indebted issuers (Chart 2.4, panel a).[24] These pressures on the funding side may be exacerbated by the more negative macro-financial outlook, which could lead to downgrades and higher default rates in the corporate sector. The market impact of downgrades from investment grade to high yield can be amplified by restrictions in the investment mandates of institutional investors (Chapter 4), and can also lead to impaired market access.[25] Even so, by historical standards downgrade and default rates have remained low in 2022.
Risk premia have risen as rates have increased. Increases in interest rates have a larger adverse impact on more-indebted firms and sovereigns, as their interest expenses grow relatively more for a given rate increase. For this reason, risk premia tend to increase more, almost mechanically, for more-indebted issuers when risk-free rates increase (Chart 2.4, panel a). Higher rates may also prompt investors to rebalance their portfolios away from riskier assets as their risk-bearing capacity is reduced. Such divergent spread widening can become self-reinforcing. That said, spreads in the euro area have so far moved steadily with risk-free rates (Box 1) and their sensitivity to interest rate increases seems to have decreased after the approval of the Transmission Protection Instrument (TPI) by the ECB’s Governing Council (Overview).
An increase in short positions may have reflected market participants’ anticipation of heterogeneous spread widening. Short positions in euro area sovereign bonds increased over the course of 2021 and in the first half of 2022 (Chart 2.4, panel b), as market participants may have anticipated rate increases as inflationary pressures mounted. The notional amount of short positions in bonds issued by more-indebted sovereigns increased by more than those for less-indebted sovereigns. This might reflect expectations of moderate spread widening related to rate increases (see above), although it could also point to more speculative positioning.
Chart 2.4
Euro area sovereign spreads widened as interest rates increased – in anticipation, short positions on sovereign bonds increased, notably for more indebted sovereigns

Sources: ECB (Statistical Data Warehouse, Securities Holdings Statistics), Eurostat, Bloomberg Finance L.P. and ECB calculations.
Note: Panel a: spreads between the ten-year sovereign bond yield and the ten-year German government bond yield.
The funding costs of more-indebted sovereigns may rise faster than for less-indebted sovereigns, exacerbated by vulnerabilities in their funding structure. In addition to greater spread widening for more-indebted sovereigns as discussed above, the funding structure of some indebted sovereigns could lead to a more substantial adverse short-term impact of a given increase in marginal (market) funding costs on a country’s average funding cost. Some countries also have a larger share of debt securities maturing in the short term (Chart 2.5, panel a). As debt is rolled over, average funding costs will increase relatively more rapidly for these countries, everything else equal. To the extent that inflation-linked and floating rate notes are not fully hedged, some more-indebted countries may also be more directly exposed to higher rates and higher inflation (Chart 2.5, panel b).[26] At the same time, the risk of disorderly spread widening not warranted by country-specific fundamentals is likely reduced by the ECB’s Transmission Protection Instrument. Overall, euro area sovereigns have also extended the average maturity of their debt over the past decade, and to the extent that debt is not inflation-linked, the real value of outstanding debt has fallen.
Chart 2.5
Some more indebted countries show vulnerabilities in their debt structure, exposing them more directly to higher rates, higher spreads and higher inflation

Sources: ECB (Statistical Data Warehouse), Bloomberg Finance L.P. and ECB calculations.
Notes: Panel a: Yield changes between July 2021 and October 2022. Bubble size reflects the ratio of the amount of outstanding debt securities to GDP. The amount of outstanding debt securities is not equal to the total amount of outstanding debt, as the latter may also include other types of debt such as non-marketable loans.
High-yield corporates also show vulnerabilities in their funding structures, potentially exposing them to challenging market conditions. High-yield issuers have a larger aggregate share of market-based floating rate debt than investment-grade issuers (Chart 2.6, panel a), exposing them more directly to rising interest rates, whereas fixed-rate instruments provide some leeway until the debt matures and has to be rolled over. At the same time, high-yield issuers also have slightly lower short-term refinancing needs than investment-grade issuers.[27] Leveraged loans, which are typically issued by issuers with a high-yield credit rating and elevated levels of leverage, are usually floating rate instruments. Spreads in euro area leveraged loan markets have increased in line with the high-yield corporate bond market.
Primary market activity has decreased sharply for high-yield corporate issuers. Issuance by high-yield firms has been subdued since Russia invaded Ukraine, while issuance by investment grade-rated issuers has declined by much less (Chart 2.6, panels b and c). This may reflect the fact that issuance conditions for low-rated corporates tend to be unfavourable during times of low growth, higher uncertainty and elevated volatility (Chart 2.6, panel c).
Chart 2.6
Issuers of high-yield euro area corporate bonds show vulnerabilities in their market-based debt structure and are struggling to tap the primary market
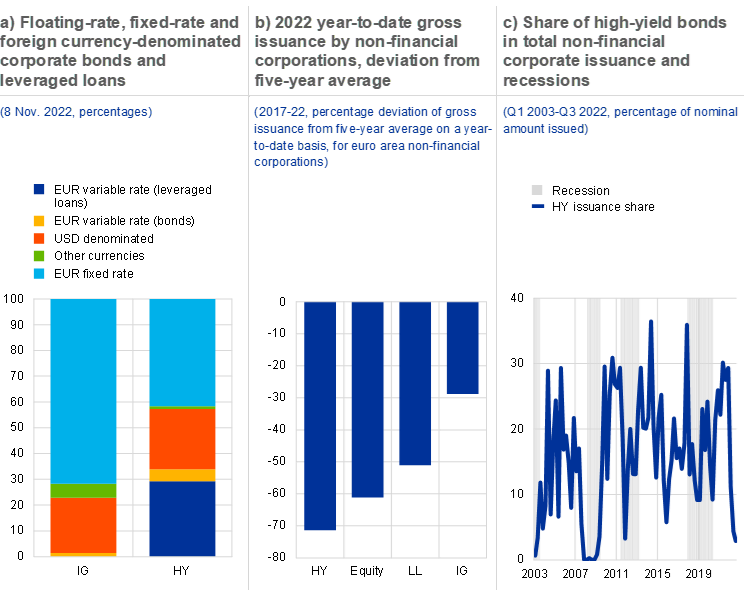
Sources: S&P Global Market Intelligence, Bloomberg Finance L.P., ECB (Statistical Data Warehouse), Dealogic and ECB calculations.
Notes: Panel b: HY stands for high yield; LL stands for leveraged loans; IG stands for investment grade. The five-year average is computed for 2017-21. Panel c: recession indicator from OECD.
2.3 The euro area is especially vulnerable to the natural gas and energy crisis
Euro area credit spreads suggest that higher natural gas prices could be associated with higher credit risk. Higher natural gas prices have weighed on the euro area more heavily than on other developed economies because of its import dependence and the limited (short-term) substitutability of natural gas in electricity generation and industrial production processes. While certain sectors are more vulnerable than others, broad credit indices show spreads widening compared with US equivalents when euro area natural gas prices are relatively higher (Chart 2.7, panel a). Diverging sectoral vulnerabilities are likely to reflect differences in the energy intensity of production but may also emanate from upstream and downstream dependencies and the macroeconomic impact of higher energy prices on overall demand (Chart 2.7, panel b).
Chart 2.7
Higher natural gas prices might be associated with higher credit risk while equities show heterogeneous, sector-dependent correlations with natural gas prices
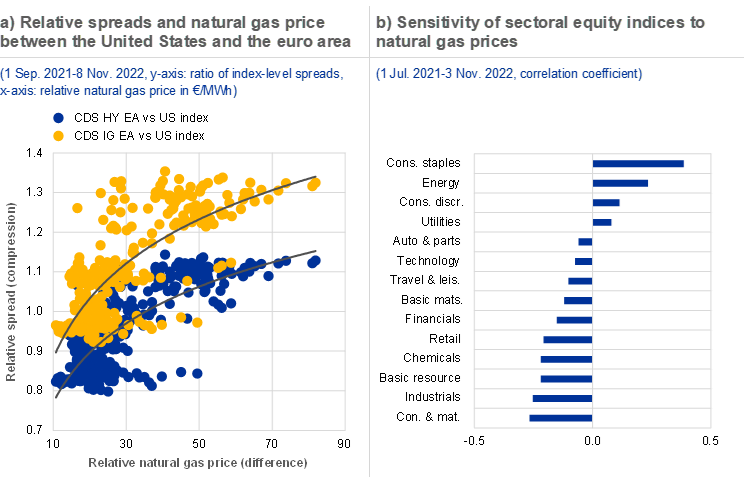
Sources: Bloomberg Finance L.P., Refinitiv and ECB calculations.
Notes: Panel a: the relative spread between the euro area (EA) and US corporate credit default swap (CDS) indices is given by the ratio of these spreads (also called the compression). The relative natural gas price is the difference between the active futures contract price in €/MWh. The fitted line is logarithmic. Panel b: sector subindices of the EURO STOXX index, based on weekly data between September 2021 and October 2022.
As natural gas and power prices have surged simultaneously, margin requirements have spiked for utility and energy firms that hedge in derivatives markets. Firms can hedge energy exposures in derivatives markets, which require counterparties to post variation margin (reflecting price changes) and initial margin (reflecting price volatility). Large, rapid increases in margin requirements (i.e. margin calls) can lead to significant liquidity needs. Consequently, when both electricity and natural gas prices spiked in August 2022, some firms in the energy and utility sectors faced substantial liquidity pressures to meet margin calls (Chart 2.8, panel b and Special Feature A).
Chart 2.8
Power and natural gas prices have been volatile and are priced to be higher for longer, leading to larger margin requirements for utility and energy firms

Sources: Bloomberg Finance L.P., EMIR, European Commodity Clearing and ECB calculations.
The euro has depreciated against many other currencies in recent months, with elevated euro area energy prices possibly playing a part (Chart 2.9, panel a). As the euro area is a net importer of energy, high energy prices have contributed to a deterioration in the terms of trade (Chapter 1). In addition, global portfolio flows have shifted away from the euro area, most likely in response to energy price developments and a deterioration of the macroeconomic outlook.[28] Having said that, other factors, such as differences in the pace of policy tightening, have also contributed to the weakening of the euro, which fell below parity against the US dollar for the first time since 2003. A weaker outlook for the euro, in combination with elevated volatility in foreign exchange markets, could deter foreign investors (Chart 2.9, panel b). A reduced appetite among foreign investors for euro area assets could have a destabilising effect on some market segments. More broadly, global portfolio and bank flows may be sensitive to changes in the monetary policy stance in individual countries outside the euro area, such as the United Stated and Japan.[29] Furthermore, some issuers have substantial foreign currency (in particular US dollar-denominated) market-based debt outstanding (Chart 2.6, panel a).[30],[31] It might be challenging to roll over such debt on favourable terms.
Chart 2.9
The euro weakened as euro area natural gas prices increased, and market pricing suggests that the US dollar may remain strong against the euro, with elevated volatility

Sources: Bloomberg Finance L.P. and ECB calculations.
Note: Panel a: natural gas prices refer to euro area natural gas prices, specifically the active natural gas (monthly) futures contract for the Title Transfer Facility in the Netherlands.
Box 2
Cross-asset correlations in a more inflationary environment and challenges for diversification strategies
Investors can reduce portfolio risk by combining assets that are not perfectly correlated. Diversification is a key ingredient in the asset allocation process under portfolio theory, as idiosyncratic risk can be lowered by combining assets or asset classes that are not perfectly correlated. Historically, stocks and bonds have tended to show a low positive (< 0.5) or even negative correlation of returns (Chart A). The classic “60/40 split” of stocks and bonds, often seen as a benchmark for passive investors, is an example of a portfolio that attempts to provide a better risk-adjusted return by adding bonds to a pure equity portfolio.[32] Although returns on bonds are typically lower than those on equities over longer spans of time, their diversification benefits justify the inclusion of bonds in a portfolio.
More3 Euro area banking sector

3.1 Asset quality concerns rise amid growing recession risks
Banks’ non-performing loan (NPL) ratios continued their downward trend in the first half of 2022, driven by securitisations and asset disposals. A further decrease in the NPL stock and continued credit growth both contributed to the decline of the total NPL ratio (Chart 3.1, panel a, left graph). As a result, both aggregate NPL stocks and the NPL ratio reached their lowest levels since supervisory data on significant institutions were first published in 2015. The reduction of NPLs was mainly driven by disposals and securitisations of loan portfolios in a few countries, although the pace of disposals was slower than in 2021 (Chart 3.1, panel a, right graph).
Chart 3.1
Banks’ aggregate NPL ratios declined further in the first half of 2022, but default rates on credit risk exposures to Russia and Ukraine rose sharply

Sources: ECB supervisory data and ECB calculations.
Notes: Based on a balanced sample of 93 significant institutions. Panel a, left graph: NFC stands for non-financial corporations; HH stands for households. Panel a, right graph: disposals include both sales of NPL portfolios and securitisations of NPLs. “Other inflows/outflows” include residual inflows and outflows not explained by any of the other specified categories. The quarterly data series starts in the third quarter of 2020. Panel b: the default rate is calculated as the trailing four-quarter sum of observed new defaults over the four-quarter average of non-defaulted exposures. Based on data for IRB-reporting banks.
Except for exposures to Russia and Ukraine, default rates have not yet shown signs of stress. Four-quarter trailing default rates remained broadly stable on euro area banks’ credit risk exposures to the largest euro area countries. By contrast, they rose sharply on exposures to Russia and Ukraine, reaching 6.5% and 9.3% respectively in the second quarter of 2022 (Chart 3.1, panel b). This did not have a material impact on the overall default rate, given the relatively small exposures to these countries.[33]
More forward-looking metrics of asset quality show a renewed rise in the share of Stage 2 loans to a level just above the peak reached during the pandemic.[34] Banks’ aggregate Stage 2 loan ratio for NFC and household loans rose slightly for the third quarter in a row (Chart 3.1, panel a, left graph), in line with a deteriorating macroeconomic outlook. In the first two quarters of 2022, this was mainly driven by increased net inflows of Stage 2 corporate loans, but signs of increased credit risk can be also detected in the pick-up of net inflows of Stage 2 household loans in the second quarter of 2022 (Chart 3.2, panel a).
Despite a sharp deterioration in the growth outlook, there was no notable increase in provisioning coverage ratios in the first half of 2022. Following an increase in the previous quarter, provisioning coverage ratios on both NPLs and Stage 2 loans declined in the second quarter of 2022 (Chart 3.2, panel b). For both NPL and Stage 2 provisioning coverage ratios, the recent decline was mainly driven by falling provisioning coverage for NFC loans. For NPL coverage, this may partly reflect a composition effect as banks tend to sell the most aged, well-provisioned loans. Looking ahead, banks with less conservative macroeconomic assumptions underlying their expected credit loss models may face a risk of larger increases in their provisioning needs if macroeconomic conditions deteriorate more than expected.
Chart 3.2
The share of “underperforming” loans continued to rise, while coverage ratios on both NPLs and Stage 2 loans declined in the second quarter
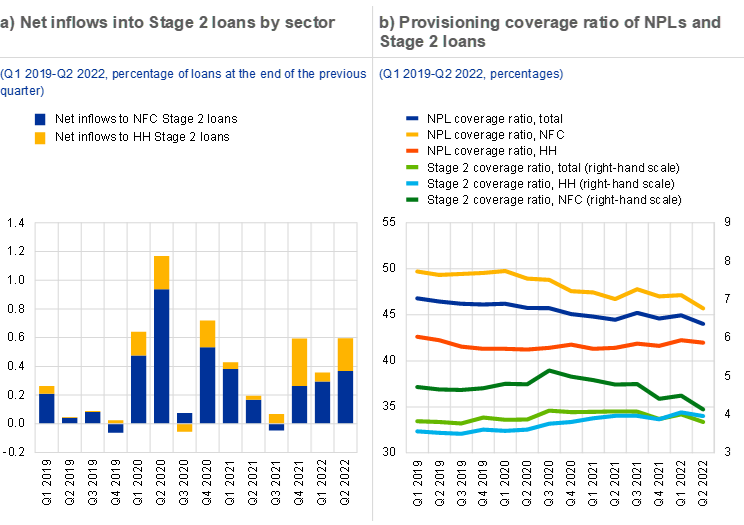
Sources: ECB supervisory data and ECB calculations.
The loan quality of energy-intensive[35] firms deteriorated following Russia’s invasion of Ukraine. Average probabilities of default (PDs) for firms highly dependent on energy inputs shifted up by about 50 basis points since March 2022, while less energy-intensive firms saw their PDs decrease slightly (Chart 3.3, panel a, left graph). The ratio of provisions to non-defaulted loans of energy-intensive firms almost doubled, compared with a mild increase for less energy-intensive firms (Chart 3.3, panel a, right graph).
In the household segment, the quality of consumer credit showed first signs of weakness and is vulnerable to increases in the cost of living. Consumer credit grew at a faster pace than the sum of loans to households and firms in several countries between 2020 and 2022, and the share of consumer credit increased by up to 25 basis points in a number of countries’ banking sectors (Chart 3.3, panel b, left graph). In some cases, fast consumer credit growth coincided with a significant increase in the NPL ratio on consumer credit, rising by up to 120 basis points between 2020 and mid-2022, and exposures in this segment can account for up to 140% of Tier 1 capital. Consumer credit exposures are particularly vulnerable to the negative impact of a higher cost of living, rising inflation and interest rates on households’ repayment capacity (in lower income quintiles), in particular for those banks which loosened their credit standards to generate higher growth rates (Special Feature B). Rising mortgage rates have a heterogenous impact across countries on banks’ mortgage portfolios due to the large differences in the share of fixed-rate mortgages (Chart 3.3, panel b, right graph).
Chart 3.3
Default risk and provisioning on loans to energy-intensive firms picked up during 2022, while the growth of consumer credit coincided with increased default rates
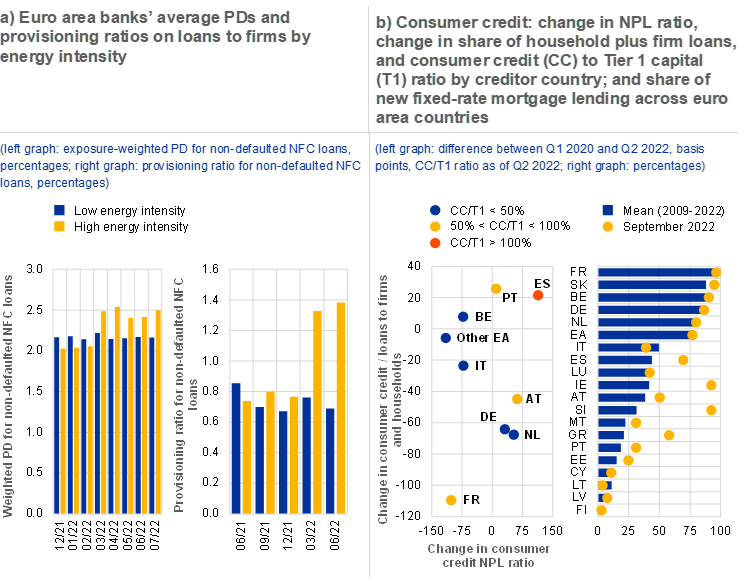
Sources: ECB (AnaCredit, MIR, ECB supervisory data), OECD (Trade in Value Added (TiVA) database (2018)) and ECB calculations.
Notes: Panel a: IRB banks only. High (low) energy intensity loans are defined by the underlying firms being active in sectors with an energy intensity ratio (OECD Trade in Value Added (TiVA) database (2018)) above (below) the 75th percentile of the distribution across sectors. Panel b, right graph: new mortgages with fixed rates and maturities above one year/all new mortgages at a monthly frequency. The average from 2009 to 2022 serves as a proxy for the share of fixed-rate mortgages of the outstanding stock.
A substantial share of banks’ NFC loans are at risk from higher interest rates and energy prices, but this share varies greatly across countries. Overall, the share of NFC loans vulnerable to increases in either interest rates or energy prices, or to both, varies significantly across countries, and can reach up to 24% (Chart 3.4, panel a). Banks in most countries have significant exposures that are particularly vulnerable to changes in energy prices.[36] By contrast, vulnerabilities to higher lending rates are more concentrated: the share of exposures to firms which are vulnerable to increases in interest rates of total NFC loans reaches as high as 12% in some countries, while it is close to 6% on aggregate.[37] These firms cannot cover their interest payments with their earnings before interest and taxes and already have an elevated PD. Any further increase in interest rates or energy prices will bring these firms closer to default and will require further provisioning.
Chart 3.4
Corporate loan portfolios are vulnerable to increases in energy prices and/or interest rates, but loans currently not vulnerable have substantially higher ICRs

Sources: ECB (AnaCredit, RIAD), Bureau van Dijk – Orbis, OECD (Trade in Value Added (TiVA) database (2018)) and ECB calculations.
Notes: Based on a sample of 92 significant institutions at group consolidated level. Corporate loans vulnerable to rising interest rates are defined as exposures with a PD above 5% and an interest coverage ratio (ICR) below 1, where ICR is defined as earnings before interest and taxes (EBIT) divided by interest paid. Interest paid and EBIT are taken from Orbis as of December 2020. We approximate the level of interest paid as of June 2022 by adjusting floating, mixed and rolled over fixed loans by the difference of the prevailing interest rates at the two respective times. Panel a: loans vulnerable to changes in energy prices are defined by the underlying firms being active in sectors with an energy intensity ratio (OECD Trade in Value Added (TiVA) database (2018)) above the 75th percentile of the distribution across sectors. Panel b: the rate increase is assumed to be a parallel upward shift in interest rates and affects variable and mixed-rate loans directly, as well as fixed-rate loans being rolled over within one month.
Loans currently not vulnerable to rising interest rates have significantly higher ICRs and there is substantial heterogeneity in rate fixation periods. Other things being equal, most euro area banking sectors would record a minor increase in the share of vulnerable loans following a 100 basis point or even a 200 basis point rate increase (Chart 3.4, panel b). This is mainly the result of firms having sufficiently high EBIT that a moderate interest rate increase would not push their interest coverage ratio below 1. In addition, it is also due to the prominent role played by fixed-rate lending in some countries.[38] While it is reassuring that higher interest rates would not lead to a significant increase in exposures considered at risk, this sensitivity analysis does not take into account risks to corporate earnings, which might also have an adverse impact on asset quality.
There are signs of credit risks increasing despite declining NPL ratios, and the asset quality outlook has deteriorated significantly over the last six months. The asset quality outlook for banks is surrounded by heightened uncertainty deriving from a combination of existing vulnerabilities to rising energy prices and interest rates. Furthermore, there are also pockets of expanding credit risk in banks’ household loan portfolios, and the quality of consumer credit is subject to downside risks due to possible increases in the cost of living. If macroeconomic outcomes turn out to be worse than currently expected, banks may face further increases in their provisioning needs, also given the recent decline in provisioning coverage ratios (Section 3.2).
3.2 Profits benefit from rising interest rates, but credit risk clouds outlook
Bank profitability improved slightly in the first half of 2022, driven by higher operating income, albeit at a slower pace than in 2021. Significant institutions’ four-quarter trailing ROE rose to 7% in the second quarter of 2022.[39] This represents its highest level since 2015 when supervisory data for significant institutions were first published (Chart 3.5, panel a). Compared with the end of 2021, the improvement was mainly driven by higher operating income, which more than offset moderate increases in operating costs and small rises in loan loss provisions (Chart 3.5, panel b). Operating income growth accelerated in the second quarter of 2022, partly driven by higher net interest income (Chart 3.5, panel c). The third-quarter earnings releases of listed banks suggest that the profitability of euro area banks may have improved compared to one year earlier. This was mainly due to the continued strong growth of net interest income, while banks’ cost of risk remained contained despite a modest increase.
Chart 3.5
Bank profitability improved on the back of higher operating income
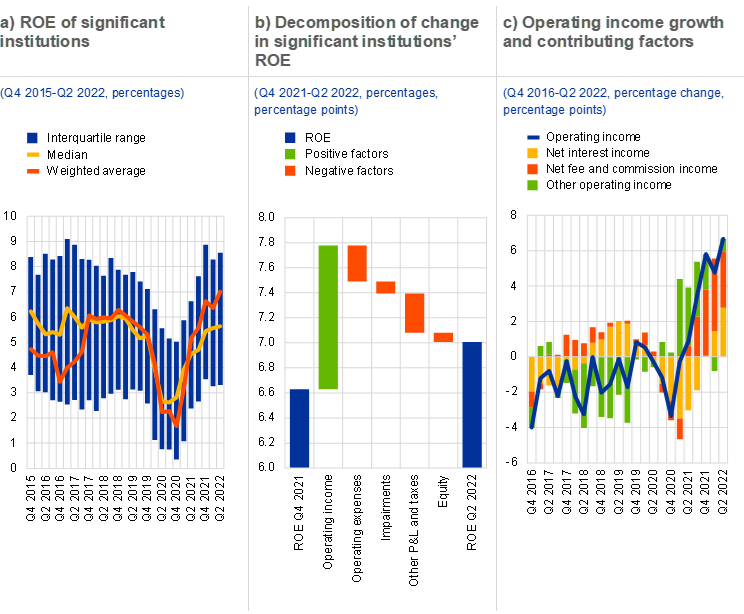
Sources: ECB supervisory data and ECB calculations.
Notes: Based on four-quarter trailing figures for a balanced sample of 86 significant institutions. Panel b: impairments refer to financial assets not measured at fair value through profit or loss. Panel c: other operating income includes trading income, gains on assets and liabilities measured at fair value through profit and loss, dividend income and exchange differences, among other items.
Net interest income growth accelerated amid rising rates and steepening yield curves, while fee income growth slowed slightly due to higher risk aversion in financial markets. The year-on-year growth of quarterly net interest income accelerated to nearly 9% in the second quarter of 2022, supported by the widening of net interest margins and continuing robust loan growth (Chart 3.6, panel a). A decomposition of net interest income changes by instrument shows that the increase in interest income on loans outpaced the rise in interest expense on deposits, while net interest income on debt securities turned positive in the second quarter of 2022 (Chart 3.6, panel b). Net fee and commission income still made a positive contribution to operating income growth, albeit at a slower pace. This slowdown reflects the negative impact of investor de-risking on investment fund flows (Chapter 4) together with a decline in equity and debt underwriting activities (Chart 2.6, panel b). As a result, fee income from asset management, the distribution of third-party investment products and securities-related activities grew at a significantly slower pace – or in some cases even declined – in the first half of 2022. At the same time, the growth of payments-related fees remained robust. Following a strong increase in 2021, trading income and unrealised gains from mark-to-market assets had a combined neutral impact on the growth of four-quarter trailing income in the first half of 2022, amid heightened financial market volatility (Chapter 2).
Chart 3.6
Widening margins contributed to faster net interest income (NII) growth, reflecting a limited pass-through of higher short-term rates to deposit rates

Sources: ECB supervisory data and ECB calculations.
Note: Based on a balanced sample of 86 significant institutions.
Operating expenses have increased at a slower rate than revenues, resulting in improved cost-to-income ratios. Both payroll costs and other administrative costs contributed to the growth of operating expenses, although the pace of cost growth lagged behind inflation (Chart 3.7, panel a).[40] Similarly, payroll costs grew more slowly in the second quarter of 2022 (+2.1%) than the aggregate compensation per employee in the euro area (+4.6%), which may partly reflect the impact of staff reductions at some banks. As the moderate increase in operating costs was more than offset by strong income growth, banks’ cost-to-income ratios improved further, reaching their lowest average value since 2015 (Chart 3.7, panel b).
Chart 3.7
Banks’ operating expenses increased but at a slower rate than inflation and revenues

Sources: ECB supervisory data and ECB calculations.
Notes: Based on four-quarter trailing figures for a balanced sample of 86 significant institutions. Panel a: HICP stands for the Harmonised Index of Consumer Prices.
Following a strong decline during 2021, the cost of risk has stabilised at pre-pandemic lows despite the deteriorating growth outlook (Chart 3.8, panel a).[41] From a stock perspective, loan loss reserves continued to decline, mainly driven by outflows due to disposals, securitisations and write-offs amid continued NPL reductions (Chart 3.8, panel b). From a profit and loss perspective, banks in the top NPL ratio quartile experienced a strong decline in the cost of risk, compared with a more stable pattern for other banks. Changes in banks’ loan loss provisions were rather heterogeneous, with a slight majority of banks in the sample recording increases in their trailing cost of risk between the end of 2021 and mid-2022. In particular, banks most exposed to energy-intensive sectors tended to increase provisions, in contrast to the more stable pattern shown by less exposed banks (Chart 3.8, panel c). In a similar vein, some banks significantly increased their provisioning on exposures to Russia and Ukraine in the first half of 2022.
Chart 3.8
Changes in banks’ cost of risk were heterogeneous, but around half the banks recorded increases, partly due to high exposures to energy-intensive sectors

Sources: ECB supervisory data and ECB calculations.
Notes: Based on a balanced sample of 86 significant institutions. Panel a: based on four-quarter trailing figures. Panel b: the chart shows a decomposition of the change in the stock of provisions which does not correspond to net flows of provisions in the profit and loss account. LLR stands for loan loss reserves. Panel c: highly exposed banks are those in the top quartile of exposures to energy-intensive sectors. Based on four-quarter trailing figures.
Looking ahead, banks face the risk of higher provisioning costs in 2023 due to a significant weakening of the macroeconomic outlook. First, the scope for further provisioning releases due to NPL reductions may have become more limited in the light of the weaker macroeconomic outlook. Second, the macroeconomic assumptions underlying banks’ modelling of expected losses may still need to be updated to account for the deterioration in the macroeconomic outlook since the projections underlying second-quarter provisioning were made. In fact, both analyst and model projections suggest that a worsening macroeconomic outlook is expected to drive provisioning costs higher in 2023, with internal ECB model projections appearing more conservative than those of market analysts (Chart 3.9, panel a). As of November, the model’s projection for 2023 cost of risk rose significantly compared with August, mainly due to a further sharp deterioration in the economic outlook and, to a lesser extent, higher expected short-term interest rates. This should be also seen in the context of declining coverage ratios for Stage 2 loans in the second quarter of 2022, which might pose further risks for banks' cost of risk and profitability ahead.
Chart 3.9
Banks’ provisioning costs are expected to increase, but analysts’ ROE forecasts for 2023 have improved slightly since May, driven by optimistic income expectations

Sources: Bloomberg Finance L.P., Refinitiv and ECB model calculations.
Notes: Panel a: the projections for 2023 are ECB staff time series VAR estimations as at 8 November. The sample in the time series VAR models comprises 41 listed banks for which analysts’ expectations are available.
Despite the positive impact of further expected rate increases, overall profitability prospects have deteriorated and market expectations may be too optimistic. Consensus analyst forecasts for listed banks’ 2023 ROE have been revised slightly upwards since May as the positive effect of higher rates is projected to more than offset the negative impact of weak economic activity on loan loss provisions (Chart 3.9, panel b), However, banks’ profitability outlook is subject to four sources of downside risk. First, net interest income growth could be negatively affected by lower loan volume growth in an economic downturn. Second, revenues from investment banking and asset management have already declined and stalled in the first half of 2022 and remain vulnerable to larger asset price corrections (Chapter 2). Third, operating costs are expected to remain under pressure in a high inflation environment, while consensus analyst forecasts predict no increase in listed banks’ aggregate operating costs from (expected) 2022 levels. Finally, worse than currently expected macroeconomic outcomes could lead to a higher increase in provisioning than anticipated at this juncture.
In fact, a comparison of projected and realised bank-level provisions suggests that the risks to provisioning costs are skewed to the upside. The comparison of actual and projected provisions uses the adverse (“baseline”) and severely adverse (“adverse”) scenarios from the 2022 vulnerability analysis. The former continues to be very close to the downside scenario described in the September ECB staff macroeconomic projections in terms of projected GDP and inflation paths. The gap between actual and projected provisions under these scenarios is particularly pronounced for NFC and mortgage loan portfolios (Chart 3.10). Looking ahead, impairment losses are almost certain to worsen amid growing recession risks (Chapter 1), suggesting that banks should accelerate their provisioning.
Chart 3.10
The comparison of projected and realised bank-level provisions also suggests that risks to provisioning costs are skewed to the upside
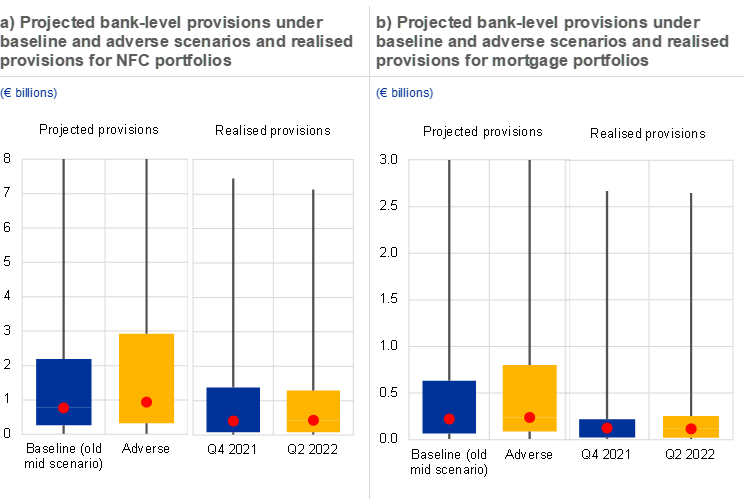
Sources: ECB supervisory data and ECB calculations.
Notes: The x-axis shows the following: (left graph) baseline and adverse scenarios refer to the old mid (or adverse) and severely adverse scenarios used in the 2022 vulnerability analysis (Russian war) and (right graph) realised provisions from the supervisory data for both Q4 2021 and Q2 2022. Red dots are medians, the boxes represent the 25th-75th interquartile range, whiskers depict the minimum and maximum observations. The charts compare projected bank-level provisions from the 2022 vulnerability analysis with realised provisions (from the supervisory reporting, Implementing Technical Standards).
3.3 Market funding costs rise further, while capital ratios remain solid despite recent decline
The market funding costs of euro area banks have continued to rise, with little dispersion in the bank bond market across euro area countries. While bond yields were volatile over the summer months, they resumed their upward trend in August and, by November, had risen to levels above pandemic highs for most instruments (Chart 3.11, panel a). Despite the upward trend in market funding costs, there is little dispersion across euro area countries. In contrast to previous episodes of sovereign funding stress, there has so far been no material differentiation in bank funding costs between countries that are less affected and those that are more affected by past crises (Chart 3.11, panel b).
Chart 3.11
Bank bond funding costs have risen significantly, but there is little dispersion across countries in bank bond markets

Sources: S&P Dow Jones Indices LLC and/or its affiliates and ECB.
Notes: Panel a: AT1 stands for additional Tier 1. Panel b: Country groups refer to countries more affected or less affected by past crises. More affected countries include Greece, Spain, Italy, Cyprus and Portugal. Less affected countries are the remaining euro area countries. Simple averages of county-level yields.
Bank bond issuance in some market segments has been negatively affected by higher costs. Primary market issuance activity has varied across debt market segments (Chart 3.12, panel a, left graph). On the one hand, the year-to-date issuance of covered bonds surpassed long-term averages, especially in the first months of the year as many banks frontloaded issuance to lock in lower funding costs, also benefiting from the support of the still-ongoing net purchases under the ECB’s asset purchase and pandemic emergency purchase programmes. On the other hand, soaring costs seem to have negatively affected the issuance of riskier debt instruments such as additional Tier 1 and senior bail-inable instruments. However, there was heterogeneity across banks as some institutions issued senior non-preferred bonds for the first time following the updated regulation from the Single Resolution Board which makes the minimum requirement for own funds and eligible liabilities (MREL) binding for more entities.[42] Looking ahead, funding costs are bound to increase on debt to be replaced in the next few years (Chart 3.12, panel a, right graph) which may make the issuance of MREL-eligible instruments more expensive, especially for lower-rated issuers.
With the progressive maturity of targeted longer-term refinancing operations (TLTROs), banks are expected to reduce their central bank funding next year, with little impact on their systemic liquidity risk. Since the introduction of special TLTRO conditions in June 2020, euro area banks have increased their reliance on central bank funding at the expense of longer-term, market-based funding. Latest market expectations, from October 2022, suggest that banks are likely to repay a large part of their TLTRO funds in mid-2023 (Chart 3.12, panel b). Banks’ TLTRO repayments and the shortened maturity of the remaining funds will likely lower their liquidity coverage ratios and net stable funding ratios going forward, but the possible shortfalls are likely to be limited at systemic level.
Chart 3.12
Debt issuance in riskier segments was negatively affected by rising costs, while banks are expected to repay most of their TLTRO funds by mid-2023

Sources: Dealogic and the ECB Survey of Monetary Analysts.
Note: Panel a: the left graph shows year-to-date issuance data up to 20 October.
Banks’ solvency and leverage ratios declined in the first half of 2022, but they remained at robust levels. The average Common Equity Tier 1 (CET1) ratio of euro area banks dropped by nearly 60 basis points to 15% in the first quarter and stabilised at this level in the second quarter (Chart 3.13, panel a). On aggregate, risk-weighted asset (RWA) growth was the largest contributing factor to the decline in the first half of 2022, mainly due to the robust growth of credit risk RWAs (Chart 3.13, panel b). This was, in turn, driven by the continued strong lending to the private sector, while the migration of Russia-related exposures to lower credit ratings and regulatory effects (e.g. higher risk-weight floors on mortgages) also contributed to the increase in risk weights (and thus RWAs) for some banks. At the same time, the change in CET1 capital had a close to neutral effect on the aggregate CET1 ratio. This is because the positive impact of higher retained earnings was broadly offset by higher dividend payouts and share buybacks as well as the negative effect of widening sovereign spreads on accumulated other comprehensive income. Similar to the RWA ratio, banks’ leverage ratios also fell across the board in the first half (Chart 3.13, panel c), dropping below their pre-pandemic levels at the end of 2019. The decline was mainly due to the expiry of the exemption of central bank reserves from the calculation of the denominator.
Chart 3.13
While remaining at robust levels, banks’ CET1 ratios fell in the first half of 2022, driven by higher RWAs, leverage ratios dropped due to the expiry of regulatory exemptions
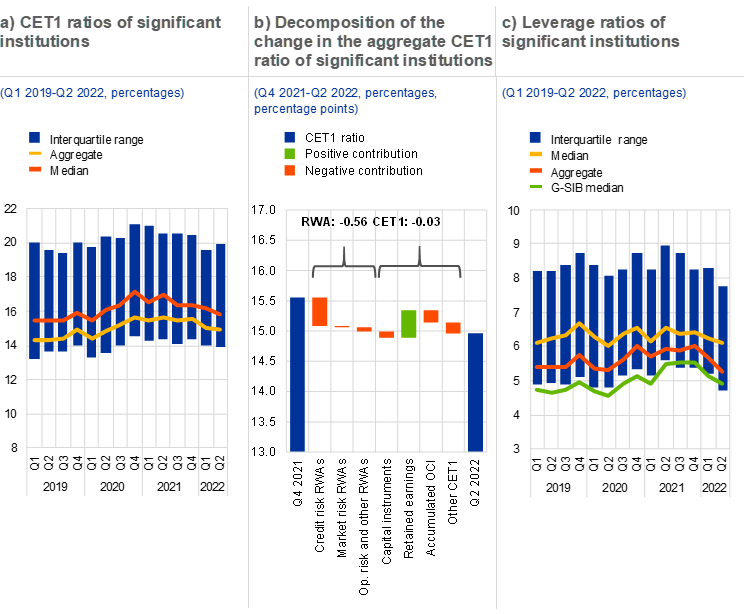
Sources: ECB supervisory data and ECB calculations.
Notes: Based on a balanced sample of 86 significant institutions. Panel b: accumulated OCI stands for accumulated other comprehensive income. Other CET1 includes, among other things, other reserves, minority interest and adjustments to CET1 due to prudential filters. Panel c: G-SIB stands for global systemically important banks.
Banks’ market valuations are being negatively affected by the high uncertainty around banks’ profitability and asset quality outlook. The share prices of euro area banks have been quite volatile since they reached a low following the Russian invasion (Chart 3.14, panel a). Emerging fears of an economic downturn have contributed to heightened uncertainty about the profitability outlook for banks, although bank profitability prospects have benefited from expectations of further rate increases. At the same time, variance around the positive relationship between bank valuations and the profitability outlook has increased since the Russian invasion, with price-to-book ratios declining, while analysts’ ROE expectations for 2023 have held up or even improved (Chart 3.14, panel b). This increased variance may reflect increased idiosyncratic concerns, which may have resulted in higher equity risk premia for some banks due to raised uncertainty around their profitability and asset quality outlooks amid rising expectations of an economic downturn.
Chart 3.14
Bank share prices have been volatile since their post-invasion fall, while the variance around the positive relationship between bank valuations and profitability outlook has increased since February

Sources: Bloomberg Finance L.P. and Refinitiv.
Note: Panel b: based on a sample of 30 listed banks.
Box 3
Euro area interest rate swaps market and risk-sharing across sectors
Euro area interest rate swap activity has risen sharply since 2021, reflecting the critical role of derivatives in managing interest rate risk as monetary policy expectations have shifted. Interest rate swaps (“swaps”) account for the largest share of the euro area derivatives market. Between March 2021 and September 2022, gross notional on EURIBOR swaps – the most traded and liquid derivatives used to hedge interest rate risk for euro-denominated exposures – increased by around 50% (Chart A, panel a). While earlier work has identified how euro area banks are using swaps in part to manage their interest rate risk (IRR),[43] this box uses trade repository data on individual EURIBOR swap trades between 2019 and 2022 to identify how the risk is being shared across sectors in the swaps market or, in other words, who would pay margins to whom should rates change.[44]
More4 Non-bank financial sector

4.1 Non-banks adjust risky portfolios as yields rise
Non-bank financial intermediaries (NBFIs) have started to sell riskier assets in response to rising yields and a worsening outlook for credit risk. Amid increasing macroeconomic uncertainty and tighter financial market conditions, the non-bank financial sector has actively reduced corporate and sovereign bond holdings since the start of 2022 (Chart 4.1, panel a). Asset sales have reflected investor redemptions in riskier investment funds, but also liquidity needs in insurance corporations and pension funds (ICPFs) arising from policy lapses and margin calls on interest rate derivatives (Sections 4.2 and 4.3). Bond sales have tended to concentrate on lower-rated issuers, pointing to a reversal in the credit risk-taking and search for yield seen in the low interest rate environment over recent years (Overview Chart 3, panel a, and Box 4). Medium-term financial stability risks in the NBFI sector may therefore decline amid rising interest rates. At the same time, reductions in non-financial corporation (NFC) debt holdings have contributed to the tightening in financial conditions for riskier corporates (Chart 2.6 in Chapter 2). They may also highlight concerns over the NBFI sector’s procyclicality and its ability to provide a stable source of real economy financing at all points in the cycle.[45]
Chart 4.1
NBFIs sold NFC securities and sovereign debt, amid a reduction in the size of the sector
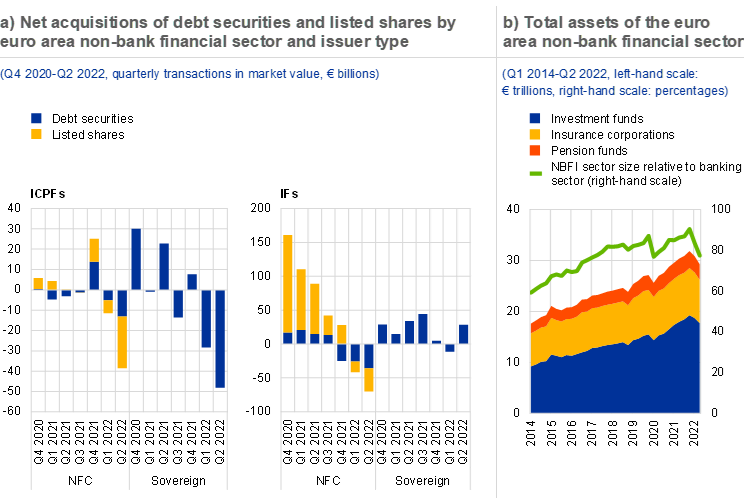
Sources: ECB (Securities Holdings Statistics, Balance Sheet Items, Investment Funds Balance Sheet Statistics, Insurance Corporations Statistics, Pension Funds Regulation, Centralised Securities Database) and ECB calculations.
Notes: Panel a: ICPFs stands for insurance corporations and pension funds; IFs stands for investment funds. Panel b: NBFI sector size relative to banking sector measured as NBFI total assets as a percentage of banking sector total assets excluding other financial institutions.
In addition to asset sales, market repricing has contributed to a significant decline in the total value of assets in the non-bank financial sector. Highly correlated returns across equities and debt securities (Chapter 2 and Box 2) have materially affected diversified portfolios of ICPFs as well as a wide range of investment fund categories. In conjunction with asset sales and outflows from investment funds, this resulted in a contraction of around €2.3 trillion in total NBFI assets and a strong reduction in size relative to the banking sector in the first half of 2022 (Chart 4.1, panel b). Valuation losses in non-banks’ bond portfolios were primarily driven by high interest rate sensitivity. As the estimated duration risk in bond portfolios remains high, NBFIs with a positive duration gap remain highly vulnerable to further interest rate increases, although the capital positions of ICPFs are typically protected against interest rate risk by their negative duration gap[46] (Chart 4.2, panel a, and Section 4.3).
Chart 4.2
NBFI portfolios are vulnerable to further valuation losses and increases in corporate credit risk

Sources: ECB (Securities Holdings Statistics, Investment Funds Balance Sheet Statistics, Insurance Corporations Statistics, Pension Funds Regulation, Centralised Securities Database), Eurostat and ECB calculations.
Notes: Panel a: revaluations are asset-weighted averages of all valuation changes across euro area IC, PF and IF sectors. Estimated duration risk shown in shaded bars measures valuation losses for a 1 percentage point increase in all yields to maturity in the absence of hedging strategies. Panel b: downgrades of issuers watchlisted by S&P. Share of NFC bond portfolio excludes unrated securities.
Panel c: gas usage is defined as terajoule usage per country-sector gross value added. Percentiles are based on the euro area-wide country-sector distribution for gas usage as of 2020.
A deteriorating macroeconomic outlook with potential gas or energy supply disruptions makes NBFIs’ NFC portfolios vulnerable to increases in credit risk. Macroeconomic uncertainty and high inflation have worsened the outlook for NFC credit risk (Chapter 1). Despite recent selloffs of comparatively riskier NFC and sovereign bond investments, overall credit risk in NBFI portfolios remains high. Rating downgrades among their NFC debt holdings increased again in the second quarter of 2022 (Chart 4.2, panel b). In the context of gas supply disruptions, the credit risk outlook remains particularly uncertain for NBFI investments in gas-intensive industries. Although aggregate portfolios are not disproportionately invested in these industries, exposures are large and may be concentrated in individual NBFIs (Chart 4.2, panel c).
Liquidity risk in NBFIs and associated amplification dynamics due to forced asset sales remain a significant concern. For investment funds, risks arise from a mismatch between the liquidity of their assets and their redemption terms, especially given their generally low holdings of cash and liquid assets (Section 4.2, Chapter 5 and Box 6). In addition, NBFIs that use derivatives, especially if leveraged, are exposed to liquidity risk from margin calls. ICPFs, and to a lesser extent investment funds, are significant users of interest rate derivatives and may thus need additional liquidity to meet margin calls in the changing yield environment (Box 3).[47] In the face of large shocks, this could prompt forced asset sales, which could amplify adverse market developments and pose a substantial financial stability concern. During the March 2020 market turmoil, and more recently following sharp moves in the UK sovereign debt market, such adverse dynamics were only averted by extraordinary central bank interventions.[48] This illustrates the need to tackle risks related to leverage and enhance liquidity positions and preparedness across the NBFI sector (Chapter 5).
4.2 Despite some de-risking, still elevated credit, duration and liquidity risk in investment funds
A wide range of riskier investment funds have faced sizeable investor outflows, amid recession fears and tightened financial conditions. Since the start of the year, equity funds have been subject to sizeable redemptions, with the typically more volatile small and mid-cap funds experiencing much greater outflows than their large-cap peers (Chart 4.3, panel a). High-yield corporate bond funds have experienced outflows above 15% of total net assets since the start of the year, linked to the global normalisation of monetary policy (Chart 4.3, panel b). This exceeds the 12% outflows seen during the March 2020 market turmoil, although this year’s outflows took place over a longer period. A flight to safety has seen sovereign bond funds – especially those focusing on the United States and higher-rated euro area countries – attract some inflows, even though they have not outperformed their corporate peers on average. In the second half of 2022, money market funds (MMFs) received inflows likely driven by heightened volatility and their yields being positive for the first time in years as a result of interest rate hikes. ESG funds have still attracted positive net flows on aggregate over recent months (Chart 4.3, panel a), although they have lost some momentum relative to the extraordinarily high inflows seen in recent years.
Chart 4.3
Fund flows reflect investor de-risking partly driven by global monetary normalisation

Sources: EPFR Global, ECB, Refinitiv, Bloomberg Finance L.P. and ECB calculations.
Notes: Panel a: Corp. HY stands for corporate high-yield; Corp. IG stands for corporate investment-grade. Panel b: decomposition based on a sign-restriction identified weekly BVAR (2007𝑤1 – 2022𝑤37) model containing linearly detrended cumulative net flows of euro area-domiciled high-yield bond funds, euro area and US stock indices, the ten-year Bund, the US-DE ten-year spread and USD/EUR exchange rate. Sign restrictions on the variables other than the fund flows are set as in Brandt et al.* Restrictions on fund flows are set in such a way that a monetary loosening and positive macro news in the euro area and the United States, as well as higher global risk appetite, all lead to inflows into high-yield bond funds. The model-implied fund flows (purple line) are the sum of all five contributing factors plus the unexplained component, but without constant and initial conditions terms.
*) Brandt, L., Saint-Guilhem, A., Schröder, M. and Van Robays, I., “What drives euro area financial market developments? The role of US spillovers and global risk”, Working Paper Series, No 2560, ECB, May 2021.
In parallel, euro area investment funds have shown some de-risking themselves, with a sell-off of lower-rated bonds and a small increase in cash holdings. Outflows and changing risk sentiment have led investment funds to sell off lower-rated corporate and sovereign bonds, mostly issued outside of the euro area, since the end of last year (Chart 4.4, panel a).[49] Should funds increasingly sell off euro area-issued bonds going forward, this may put pressure on yields, especially if issuers lose investment-grade status and this prompts forced sales by bond funds that have rating restrictions in their investment mandate. Investment funds’ cash holdings relative to total assets have also increased slightly, making the sector more resilient to future outflows, although they remain at low levels in historical terms (Overview Chart 3, panel b). The level of cash holdings varies among different fund types and has also increased for euro area corporate bond funds, especially for the high-yield segment (Chart 4.4, panel b). This procyclical cash hoarding, similarly observed in previous periods of high market volatility, may also have contributed to deteriorating market conditions as funds are selling more assets than is necessary to meet redemptions.[50]
Chart 4.4
Investment funds show tentative signs of de-risking

Sources: ECB (Securities Holdings Statistics, Centralised Securities Database), Refinitiv and ECB calculations.
Notes: Panel b: only mutual funds are included. Distribution of cash holdings over total assets across funds by fund type. The boxes correspond to the interquartile range and the whiskers to the 10th-90th percentiles. High-yield corporate bond funds primarily invest in high-yield bonds. This sample is distinct from the corporate bond fund sample, which can have a broader investment focus irrespective of rating quality.
Despite this portfolio rebalancing, euro area bond funds have performed poorly on average over recent months, which could lead to an acceleration of outflows in the event of risk premia shocks. Recent losses are reflected in a strong increase in the value at risk of bond funds (Chart 4.5, panel a), which measures the worst weekly performance to be expected at a 95% confidence level based on historical data from the previous year. It reached median values of close to 2%, above those seen in previous crises. According to the flow-performance relationship, investors react to losses by redeeming their fund shares. This is particularly pronounced for less liquid corporate bond funds (Chart 4.5, panel b)[51] and for leveraged bond funds.[52] Further outflows are therefore likely, and these could accelerate if there are additional price declines in bond markets which could be triggered by faster than expected monetary policy normalisation and/or additional negative macroeconomic news.
Chart 4.5
Poor performance by euro area bond funds can lead to an acceleration of outflows
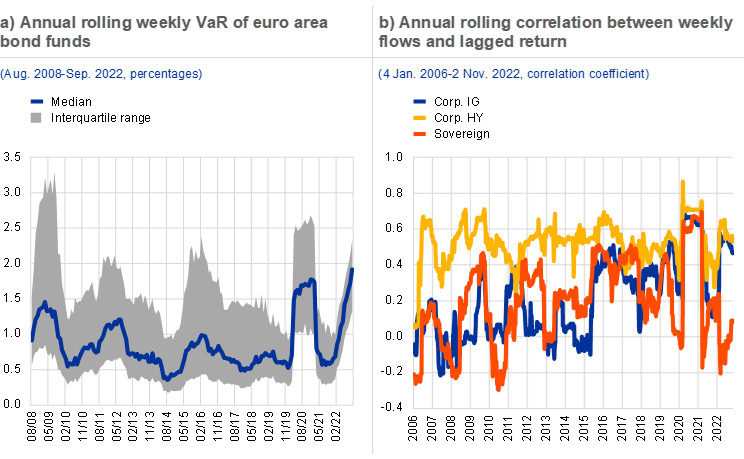
Sources: Refinitiv, EPFR Global and ECB calculations.
Notes: Panel a: annual rolling weekly 95% value at risk (VaR), median and interquartile range of sample of 13,641 bond funds domiciled in the euro area. Panel b: returns are defined as the weekly change in net asset value.
The potential liquidity needs of relatively illiquid funds can amplify negative market dynamics. Outflows from certain investment funds, such as corporate bond funds, can pose financial stability concerns. This is because such funds are characterised by a high liquidity mismatch, given that they invest in markets with relatively shallow liquidity, hold little liquid assets and often offer daily redemptions to their investors (Box 6). Such outflows, especially if abrupt and large, can force these funds to sell less liquid assets. Forced sales can further amplify losses and adverse price dynamics, especially if market liquidity in the euro area corporate bond markets continues to deteriorate (Chart 2.3 in Chapter 2). This can potentially lead to a vicious cycle of negative performance and redemptions accelerating market stress. And for investment funds using derivatives, such adverse dynamics may be amplified by assets being sold to meet margin calls (Section 4.1).
In an environment of increased market volatility, the vulnerability of funds to such outflows, cash needs and forced selling has increased, despite their recent slight de-risking. While funds have somewhat reduced their credit risk and increased their cash positions, the overall share of portfolio holdings of BBB and high-yield bonds still stands above 50% and portfolio liquidity remains at low levels. Furthermore, aggregate duration in the bond portfolio of investment funds remains almost unchanged, although it is partly hedged (Box 3). Amid recession fears, high inflation and the normalisation of monetary policy, these vulnerabilities are more likely to materialise than in the past.[53] And negative performance could trigger further outflows, precipitating adverse liquidity dynamics. In addition, risks might be concentrated in individual funds – potentially including some that have taken on high levels of traditional or synthetic leverage[54], and whose failure could lead to a wider loss of confidence. There is still a strong need to strengthen investment funds’ resilience from a macroprudential perspective in the light of high liquidity mismatch and pockets of leverage. It is important to ensure that the sector does not pose a risk to the stability of the financial system and that it remains a reliable source of funding to the real economy (Chapter 5).
4.3 Life insurers benefit from higher interest rates, but sector could still amplify adverse market dynamics
Overall, euro area insurers maintained robust profitability and solvency positions in the first half of 2022. Insurers have so far weathered the energy crisis and deteriorating macroeconomic outlook well. Aggregate profitability, as measured by return on equity, has trended upwards to above pre-pandemic levels (Chart 4.6, panel a, left graph), supported by strong underwriting results. However, investment income decreased slightly on aggregate due to more volatile markets (Chapter 2), with some insurers facing substantial declines (Chart 4.6, panel a, right graph). Solvency Capital Requirement ratios have increased (Chart 4.6, panel b, left graph), thanks mainly to the net positive effects of rising interest rates on life insurers’ balance sheets. In the same vein, combined ratios (claim-related losses and expenses divided by earned premiums) remained below the 100% threshold on average in the first half of 2022 (Chart 4.6, panel b, right graph).
Chart 4.6
Insurers’ solid profitability and solvency positions conceal some heterogeneity

Sources: Bloomberg Finance L.P. and ECB calculations.
Notes: Based on a sample of up to 25 large euro area insurers offering life and non-life products. Panel a: ROCE stands for return on common equity; ROI stands for return on investment.
Insurers’ business models are exposed to different risks related to high inflation and low economic growth. With regard to life insurers, a gradual increase in interest rates is generally associated with a positive impact on capital positions. This effect tends to be more material for insurers with larger negative duration gaps and which have an elevated share of traditional life policies in back-books. This share has declined steadily in recent years, as the sale of unit-linked products – where investment gains and losses are borne by policyholders – has continued to increase. At the same time, particularly sharp increases in interest rates might force life insurers exposed to interest rate derivatives to sell assets in order to meet margin calls, potentially precipitating wider adverse market dynamics (Section 4.1). In particular, insurers and pension funds use interest rate swaps to hedge interest rate risk in defined-benefit liabilities with long maturities (Chart 4.7, panel a and Box 3). In addition, high inflation, low growth and a decrease in real household incomes could have an impact on growth prospects for the life sector, as the demand for insurance policies is likely to decline and lapses could be more widespread.
Non-life insurers are particularly exposed to claims inflation.[55] Non-life (re)insurers with positive duration gaps and low levels of reserves might suffer from the adverse impact of claims inflation on margins and capital. Furthermore, the deteriorating macroeconomic outlook could also reduce growth prospects in the most cyclical non-life business lines such as trade credit and construction. Ultimately, prolonged high inflation and low economic growth could undermine profitability going forward. Concerns about the profitability outlook are consistent with recent increases in insurers’ credit default swap (CDS) spreads (Chart 4.7, panel b).
Chart 4.7
Concerns about liquidity and rising credit risk weigh on the outlook for insurers

Sources: ECB, EMIR and ECB calculations.
Notes: Panel a: exposures are netted for each institution and maturity bucket; CCPs are excluded. Net notional amounts are positive if the subsector is a net buyer of pay-float interest rate swaps and negative if the subsector is a net seller. ICPFs stands for insurance corporations and pension funds.
Since insurers are large institutional investors, their investment behaviour plays an important role in bond market dynamics. Euro area insurers are large investors in euro area sovereign and corporate debt markets (Box 4, Chart A, panel a). And euro area insurers’ exposure to lower-rated sovereign debt remains high in some countries due to a significant home bias (Chart 4.8, panel a). Given both a desire to avoid valuation losses and the fact that some insurers’ portfolios are restricted to investment-grade ratings, especially in unit-linked products, increasing sovereign spreads or rating downgrades to below investment grade – or the imminent risks thereof – could prompt insurers to liquidate some of these sovereign holdings. The widespread liquidation of such bonds by insurers, especially if accompanied by sales from bond funds with investment-grade mandates, could amplify the pressure on sovereign yields and spreads. And if yields rise sharply, adverse market dynamics may be intensified by ICPFs needing to sell assets to meet margin calls (Section 4.1). By contrast, a gradual increase in yields could increase insurers’ overall demand for lower-rated euro area sovereign bonds (Box 4), which would alleviate fragmentation concerns in sovereign bond markets. At the same time, the risk of unwarranted, disorderly market dynamics has been partly mitigated by the ECB’s Transmission Protection Instrument.
Chart 4.8
Insurers are vulnerable to further increases in sovereign bond spreads and rising physical climate change risks

Sources: Panel a: ECB (Sector Holdings Statistics, Quarterly Sector Accounts and Centralised Securities Database) and ECB calculations; panel b: Artemis and Steve Evans Ltd and SwissRe.
Notes: Panel a: lower-rated euro area sovereigns are countries with credit ratings below AA-. Panel b: for the estimate of H1 2022 global insured losses see “Floods and storms drive global insured catastrophe losses of USD 38 billion in first half of 2022, Swiss Re Institute estimates”, Swiss Re, 2 August 2022.
Increasing natural catastrophes related to climate change and the associated costs to the economy pose challenges to (re)insurers and may drive a widening insurance protection gap. There were several severe weather-related events in the first half of 2022, with global natural catastrophe insured losses currently estimated at USD 35 billion (Chart 4.8, panel b) – 22% above the average for the past ten years. Such events have emphasised once again that climate-related natural catastrophes are increasing in frequency and severity across all geographical areas.[56] Climate-related insured losses are already affecting (re)insurers’ prices and the ability to insure against some of these risks in vulnerable regions.[57] This widening insurance protection gap may have adverse macroeconomic consequences over the medium term.[58] Policy action is therefore needed to close this gap (Chapter 5). Capital market instruments can also complement insurance schemes to provide prompt liquidity for reconstruction after disasters, using tools like catastrophe bonds, for instance. Over recent years, catastrophe bonds have become a stable source of complementary capacity to reinsurance, with issuance reaching a record USD 13.5 billion in 2021 and strong issuance to date in 2022 (Chart 4.8, panel b).
Box 4
Insurers’ balance sheets amid rising interest rates: transmission and risk-taking
The euro area insurance sector and its relevance for real economy financing have grown significantly over the last two decades. As of the second quarter of 2022, the sector’s total assets amounted to around €8.5 trillion, equivalent to more than a quarter of the euro area banking sector’s assets. Insurers’ investments of policyholder premiums make the sector one of the largest investors in euro area debt markets (Chart A, panel a). As such, insurers provide an important source of funding for euro area sovereigns and corporates.[59] This means that, in an environment of changing interest rates, shifts in the sector’s investment behaviour can significantly affect market financing conditions; they may also have implications for financial stability as insurers rebalance risks in their investment portfolios.
More5 Macroprudential policy issues

5.1 Fostering financial system resilience and advancing the regulatory agenda in a time of high uncertainty
Regulatory advances and active use of prudential policies since the global financial crisis have put the banking sector in a good position to withstand the economic adversity that may result from current developments. The outbreak of war in Ukraine has compounded existing macro-financial vulnerabilities. Specifically, the deteriorating macroeconomic outlook, inflation pressures and tighter financing conditions are weighing on the debt servicing capacity of households and firms, although there are mitigating factors such as corporate cash buffers, household savings and thus far resilient labour market conditions. At the same time, the likelihood of downside risks materialising has increased, given the possibility of further geopolitical or economic shocks. In this challenging macro-financial environment, both the financial and non-financial sectors in the euro area have so far remained resilient, and households and firms have retained ready access to bank credit. Regarding banks, the substantial strengthening of their balance sheets and capital positions in recent years has ensured that the sector is well-prepared to adapt to risks as and when they materialise, as already demonstrated during the coronavirus (COVID-19) pandemic.[60] Moreover, starting in late 2021 and continuing through 2022, a number of authorities have tightened either capital buffers or borrower-based measures.[61]
That said, targeted increases in capital buffers can still be considered in countries where accumulated macro-financial imbalances are material and conditions allow.[62] Macroprudential capital buffers that are consistent with the prevailing level of risk support banks’ resilience and their ability to continue to assist the economy when systemic risk materialises. A resilient banking sector that absorbs rather than amplifies systemic shocks helps to limit their impact on the financial system and the real economy. While the early activation of capital buffers has benefits, it can also be useful to increase buffer rates late in the economic or financial cycle to preserve resilience, provided that procyclical effects are avoided. Such policy action enhances the capacity of authorities to make capital available for use by releasing buffers such as the countercyclical capital buffer as and when adverse developments materialise at a later stage. Irrespective of any macroprudential measures, banks themselves should ensure that their provisioning practices and capital planning properly account for the deteriorating risk environment and are aligned with supervisory expectations.
To avoid an unintended tightening of credit conditions or procyclical effects, any macroprudential response also needs to consider current economic and energy-price headwinds. A tightening of capital buffer requirements may affect bank credit supply if banks pass on higher funding costs to customers by raising lending rates, thus adding to the upward pressure on rates induced by monetary tightening, or if they directly limit the quantity of credit when they are unable to meet higher capital requirements.[63] The risk of procyclicality is, however, mitigated by the considerable capital headroom of banks in many euro area countries and their remaining ability to generate capital internally. Moreover, buffers can be released immediately in the event of risks materialising. This, in turn, would help banks to absorb losses while maintaining the provision of key financial services to the economy when needed most. Nevertheless, possible macroprudential policy responses need to take into account the highly volatile and uncertain course of the energy crisis in Europe and should be properly tailored to the specific conditions in each country.
With regard to the review of the macroprudential framework in the EU, the ECB’s response to the European Commission’s Call for Advice has identified key priorities for an update of the Capital Requirements Regulation and Capital Requirements Directive (CRR/CRD).[64] In particular, the ECB supports progressing with a legislative proposal to increase the efficiency and effectiveness of the EU macroprudential toolkit at the first possible opportunity, given the overall legislative agenda, including in response to the current geopolitical situation. More broadly, the ECB would like to see the following points prioritised:
- creating further macroprudential space and flexibility for macroprudential policy, in particular with respect to the early implementation and timely release of countercyclical capital buffers;
- promoting the development of a common EU methodology for buffers for other systemically important institutions (O-SIIs) to decrease heterogeneity in their setting, ensure more consistency in their resilience while, amongst others, taking into account developments in the treatment of cross-border exposures within the banking union;[65]
- increasing the consistency of the EU capital framework, for instance when setting sectoral as well as broad systemic risk buffer rates.
The timely, full and faithful implementation of Basel III reforms in the EU is crucial to ensure continued resilience and stability across the financial sector.[66] The European Commission proposed some temporary deviations from the Basel III agreement on the “output floor”, notably including more preferential treatment for some residential real estate and unrated corporate exposures. Analysis by the European Banking Authority (EBA) highlights that, taken together, the proposed deviations would almost halve the overall increase in banks’ capital following the introduction of the output floor. These deviations from the Basel III agreement would substantially weaken its positive impact on banking sector resilience. Further, it would come on the back of accumulated macro-financial vulnerabilities, particularly in the real estate sector.[67] The deviations – especially if extended or made permanent – might also render the EU materially non-compliant with Basel III, thereby weakening the credibility of the EU and its banking system.[68]
Further efforts are needed to integrate climate risk considerations into the regulatory framework. In its recently published report,[69] the ECB/ESRB Project Team on climate risk monitoring highlights the need to develop a macroprudential approach for systemic aspects of climate-related risk. This report also presents new evidence on the relevance of concentrated exposures to climate risk, which the ECB has been developing further (Box 5). In this context, the ECB welcomes the Commission’s decision to include environmental, social and governance (ESG) risks more explicitly in banking regulation in its proposed revisions to the Capital Requirements Directive (CRD VI) and Capital Requirements Regulation (CRR III).[70] The ECB also welcomes the recent endorsement by the Group of Central Bank Governors and Heads of Supervision (GHOS) of the Basel Committee’s holistic approach to developing and assessing potential measures related to disclosure, supervision and/or regulation on climate-related risks.[71] Global coordination in addressing climate risks is paramount to ensure that a consistent approach is taken to climate-related risks across jurisdictions.
Box 5
Carbon-related concentration risk: measurement and applications
In the light of increasing evidence that banks’ exposures to climate risk are concentrated, European and international authorities are intensifying their focus on the management of carbon-related concentration risk. At the individual bank level, carbon-related concentration risk can be defined as the risk that a subset of a given bank’s exposures could suffer simultaneous, significant losses in value because of the materialisation of transition risk. This could threaten the bank’s financial position and its ability to maintain critical services or functions. The recently published ECB-ESRB report on climate risk highlights the prospect of systemic amplification due to concentrated exposures, and the results of the 2022 ECB Banking Supervision climate risk stress test indicate that the majority of banks’ credit income arises from high-emitting industries.[72] In parallel, the European Banking Authority (EBA) has sought public feedback on ways to address concentration risks stemming from environmental risk drivers.[73] At the international level, the Basel Committee on Banking Supervision (BCBS) has recently recommended that banks measure and manage concentrations associated with climate-related financial risks.[74]
More5.2 Addressing structural vulnerabilities in the non-bank financial sector requires a comprehensive and decisive policy response
Persistent vulnerabilities in investment funds and money market funds (MMFs) make it important to progress with enhancing the relevant policy framework from a macroprudential perspective. While the Financial Stability Board (FSB) is currently assessing the effectiveness of its 2017 recommendations on liquidity mismatch in open-ended funds (OEFs),[75] concrete policy proposals have already been developed to reform the regulation of money market funds globally.[76] In the EU, the Eurosystem, the European Systemic Risk Board (ESRB) and the European Securities and Markets Authority (ESMA) have proposed reforms to the Money Market Fund Regulation.[77] The proposed reforms aim to strengthen the sector’s resilience, while not unduly restricting the economic functions that MMFs provide to other market participants and the real economy.[78] These proposals focus on removing regulatory threshold effects, improving the availability and usability of liquidity management tools and strengthening MMF liquidity requirements. In the light of the vulnerabilities that surfaced in March 2020 and the latent risk of renewed stress in the MMF sector, it is critical that these legislative reforms are pursued without delay.
Due to the central role of OEFs in market-based finance, it is important to significantly reduce vulnerabilities arising from structural liquidity mismatch in this sector. Despite some recent improvements in funds’ aggregate cash buffers (Section 4.2 and Chart 4.4, panel b), more illiquid funds have continued expanding, and structural vulnerabilities related to liquidity mismatch remain prevalent in parts of the bond fund sector (Box 6). Enhancing the availability and use of anti-dilution liquidity management tools (LMTs) should be part of the policy response.[79] But these tools are of limited use if markets become illiquid in a stress event. In particular, priced-based LMTs, such as swing pricing, may be difficult to use and unable to effectively limit outflows and forced asset sales if robust and timely price information becomes unavailable in distorted markets. The broader availability and use of such tools can usefully complement but not replace more structural reform measures.
Box 6
Liquidity mismatch in open-ended funds: trends, gaps and policy implications
Liquidity mismatch between assets and liabilities continues to be a key vulnerability in open-ended investment funds.[80] A mismatch arises if funds give their investors the option of short-term redemptions, while at the same time investing in assets that cannot easily be liquidated at short notice. Existing evidence suggests that a larger liquidity mismatch makes it more difficult for funds to meet sudden, large redemption requests from investors, increasing the risk of procyclical asset sales and fund suspensions in response. This can adversely affect other investors and underlying markets.[81]
MorePolicies aimed at reducing structural liquidity mismatch in OEFs should ensure that funds’ redemption terms are better aligned with the liquidity of their assets. The prudential framework for investment funds in the EU stipulates that a fund’s liquidity profile should be appropriate in relation to its redemption policies.[82] However, as the March 2020 market turmoil demonstrated, many investment funds entered this episode with significant liquidity mismatches and experienced difficulties in managing liquidity amid large outflows and deteriorating liquidity in underlying markets. The regulatory and supervisory framework should therefore be enhanced by policymakers to tackle liquidity mismatch in a consistent manner, including at the global level. For funds invested in inherently illiquid assets, such as non-tradable loans or real estate, a better alignment of redemption terms with asset liquidity may mean introducing longer notice periods and restricting redemption frequencies. For funds invested in assets that are less liquid in normal times but can become illiquid under stress, such as corporate bond funds, daily dealings may be appropriate if accompanied by higher standards for liquidity management, including the use of anti-dilution levies or swing pricing. However, if this does not sufficiently reduce the vulnerability to liquidity shocks, a fund should arrange for longer notice periods or a lower redemption frequency, which would limit the risk of large and unexpected outflows ex ante. Potential costs from this for investors should be weighed against the benefits of greater resilience. Moreover, higher liquidity buffers could be considered to manage increased liquidity needs from redemptions or margin calls during periods of stress.
Given the complexities of tackling risks from leverage in the non-bank financial sector, the policy framework should be enhanced from several angles. A key priority for the FSB should be to develop a globally consistent approach for addressing risk from leverage – including synthetic leverage – in the non-bank financial sector. The work should first be geared towards better understanding how leverage at non-bank financial institutions (NBFIs) may amplify vulnerabilities in the wider financial system[83] and ultimately towards defining undesirable levels of leverage at entity level. For this purpose, it is important for work to continue on globally consistent metrics, improving currently available data (e.g. from the perspective of data quality and/or availability) and increasing the data coverage to assess leverage-related risks in the non-bank financial sector. Second, the provision of leverage through banks and broker dealers, including via repo transactions, should be considered as part of a holistic approach to NBFI leverage. Third, a comprehensive policy response should consider the role of haircuts and margining in derivatives markets to disincentivise excessive leveraging by NBFIs. However, such an approach should also take into account the potential negative consequences on the cost of hedging for end users.
Recent volatility in financial markets and associated liquidity challenges highlight the need to improve margining practices and NBFI preparedness to meet margin calls. Since the Russian invasion of Ukraine, participants in energy derivatives markets have faced recurring periods of very high margin calls (Special Feature A). More recently, some UK institutional investors faced large margin calls following sharp increases in UK government bond yields (Section 4.1). These increases in margins were an intended effect to safeguard central counterparties and market participants from the heightened counterparty exposure in the wake of large price increases and high volatility in underlying markets. But these recent cases, via distinct channels, are a timely reminder of the importance of the international work reviewing margin practices and the need for follow-up policy work.[84],[85] This includes increasing transparency and predictability of initial margin (IM) models, evaluating IM model responsiveness to market stress and enhancing the liquidity preparedness of all types of NBFIs to deal with large margin calls. In addition, it is important to strengthen global risk assessment of derivatives markets and tackle data gaps, including by enhancing the use of trade repository data and associated information-sharing across jurisdictions.
While enhancing the NBFI policy framework is now a key priority at the international level, it will take some time for regulatory reforms to be agreed and implemented. Risks in the non-bank financial sector might materialise sooner than regulation can be strengthened. In light of that, NBFI supervisors should pay particularly close attention at this time to credit risk, liquidity risk and leverage in NBFIs and take an active role in strengthening resilience within their mandate and existing regulatory frameworks.
5.3 Other ongoing policy initiatives that support euro area financial stability
Policy initiatives on climate change and crypto-assets
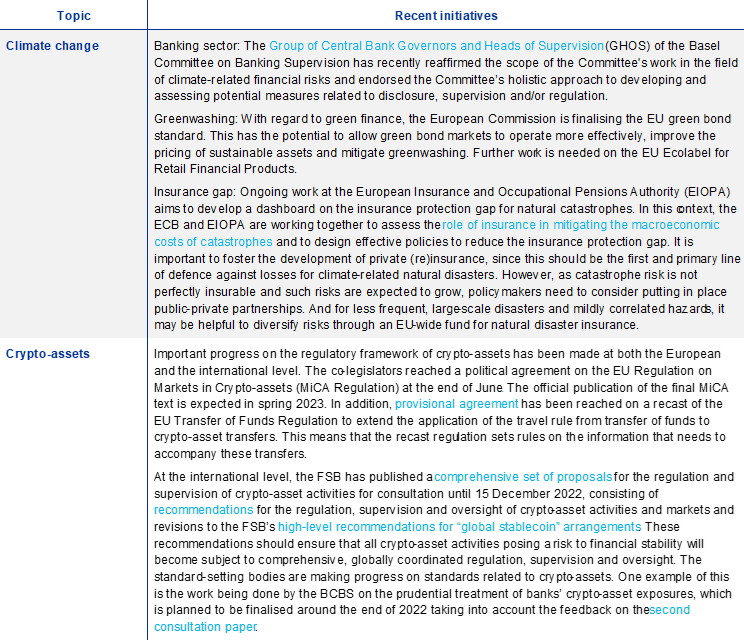
Special Features
A Financial stability risks from energy derivatives markets
Energy sector firms use energy derivatives under different strategies, depending on their main area of activity, business model and exposure to risk in physical markets. The significant volatility and a surge in prices seen in energy markets since March 2022 have resulted in large margin calls, generating liquidity risks for derivatives users. Strategies employed by companies to alleviate liquidity stress may lead to an accumulation of credit risk for their lenders or for their counterparties in less collateralised segments of the derivatives market. Further price increases would accentuate nascent vulnerabilities, creating additional stress in a concentrated market. These aspects underline the need to review margining practices and enhance the liquidity preparedness of all market participants to deal with large margin calls.
MoreB Household inequality and financial stability risks: exploring the impact of changes in consumer prices and interest rates
Since the start of 2022, euro area households have seen the largest increase in consumer prices in decades and the first increase in interest rates in over ten years. For some households – especially those with lower incomes – these shocks could lead to financial distress, including debt defaults. Simulations of the impact of rising consumer prices and interest rates on the near-term financial health of households reveal a more pronounced risk of default in lower income quintiles. For most countries, systemic risk arising from loans originated in lower income quintiles, which represent a lower share of total household debt than loans originated in higher income quintiles, is limited, although it is more significant in others. Policy support aimed at dampening the impact of shocks could help to mitigate this risk. Across the euro area, second-round effects stemming from foregone consumption in response to higher financial burdens could weigh on economic performance and further impair banks’ asset quality.
MoreC Towards a framework for assessing systemic cyber risk
Digitalisation is transforming the global economy, including by raising productivity and broadening consumer access to information. While these forces are facilitating greater competition, supporting economic growth and lowering prices, the benefits are not without risks – the flip side of digitalisation can be greater vulnerability to cyberattacks. For these to be a source of risk to financial stability, substitutability, risk correlation and interconnectedness are all key dimensions. A cyberattack on a critical infrastructure or an attack on one service that unearths vulnerabilities in another could quickly lead to system-wide stresses. Negative externalities arising from the effectiveness of financial institutions’ management of cyber risk could provide grounds for a public policy response. While the existing macroprudential policy toolkit has limited capacity to address cyber risks, their growing relevance nevertheless calls for macroprudential overseers to anticipate them, assess the capacity of the financial system to absorb them, and to issue risk warnings when warranted. In this vein, econometric evidence suggests that cyberattacks are not random, but are driven by factors such as economic strength, the degree of financial globalisation as well as policy and political uncertainty. This underscores how important it is for authorities to foster the sharing of information and the closing of data gaps on cyberattacks.
MoreThe Financial Stability Review assesses the sources of risks to and vulnerabilities in the euro area financial system based on regular surveillance activities, analysis and findings from discussions with market participants and academic researchers.
The preparation of the Review was coordinated by the ECB’s Directorate General Macroprudential Policy and Financial Stability. The Review has benefited from input, comments and suggestions from other business areas across the ECB. Comments from members of the ESCB Financial Stability Committee are gratefully acknowledged.
The Review was endorsed by the ECB’s Governing Council on 9 November 2022.
Its contents were prepared by Katharina Cera, Nander de Vette, John Fell, Sándor Gardó, Thore Kockerols, Csaba Móré, Benjamin Mosk, Tamarah Shakir, Manuela Storz, Eugen Tereanu, Josep M. Vendrell Simón, Christian Weistroffer and Jonas Wendelborn.
With additional contributions from Emil Bandoni, Markus Behn, Alexandra Born, Othman Bouabdallah, Lorenzo Cappiello, Dimitris Drollas, Margherita Giuzio, Michael Grill, Maciej Grodzicki, Lieven Hermans, Paul Hiebert, Sujit Kapadia, Benjamin Klaus, Kateryna Koroliuk, Dejan Krusec, Georgi Krustev, Giulio Mazzolini, Clementine Mc Sweeny Pourtalet, Luca Mingarelli, Charles O’Donnell, Seán O’Sullivan, Lorenzo Pangallo, Cristian Perales, Rita Periquito da Fonseca, Allegra Pietsch, Petya Radulova, Ellen Ryan, Beatrice Scheubel, Elisa Telesca, Pär Torstensson, Zoi Trachana, Mika Tujula and Balázs Zsámboki.
Editorial, multimedia and production assistance was provided by Anna Heckler, Peter Nicholson, Federica Parravicini, Katie Ranger, Simon Spornberger and Daniel Weber.
© European Central Bank, 2022
Postal address 60640 Frankfurt am Main, Germany
Telephone +49 69 1344 0
Website www.ecb.europa.eu
All rights reserved. Reproduction for educational and non-commercial purposes is permitted provided that the source is acknowledged.
For specific terminology please refer to the ECB glossary (available in English only).
PDF ISSN 1830-2025, QB-XU-21-002-EN-N
HTML ISSN 1830-2025, QB-XU-21-002-EN-Q
See the letter of the FSB Chair to G20 finance ministers and central bank governors, 14 February 2022.
See “Policy Proposals to Enhance Money Market Fund Resilience – Final report”, Financial Stability Board, 11 October 2021.
See the box entitled “Implications of the terms-of-trade deterioration for real income and the current account”, Economic Bulletin, Issue 3, ECB, 2022.
See the box entitled “The impact of Chinese macro risk shocks on global financial markets”, Financial Stability Review, ECB, May 2022.
See the box entitled “Euro area fiscal policy response to the war in Ukraine and its macroeconomic impact”, Economic Bulletin, Issue 5, ECB, 2022, as well as the September 2022 ECB staff macroeconomic projections.
Calculated as principal and interest expenditure during debt service period as a percentage of GDP.
Calculated as the change in principal payments divided by the change in total debt outstanding for the period from January 2010 to September 2022.
See the box entitled “Sensitivity of sovereign debt in the euro area to an interest rate-growth differential shock”, Financial Stability Review, ECB, November 2021.
See the box entitled “Financial stability implications of higher than expected inflation”, Financial Stability Review, ECB, November 2021.
This box uses sovereign and corporate bond pricing to construct a statistical indicator that captures the dynamics driving credit spreads in sovereign and corporate bond markets. The box does not provide a quantitative indicator that is part of the Transmission Protection Instrument (TPI) activation assessment. A decision by the ECB’s Governing Council to activate the TPI will be based on a comprehensive assessment of market and transmission indicators, an evaluation of the eligibility criteria and a judgement that the activation of purchases under the TPI is in line with the achievement of the ECB’s primary objective. See the press release entitled “The Transmission Protection Instrument”, 21 July 2022.
The authors would like to thank Luca Mingarelli for his valuable comments.
We follow the definition of fragmentation as presented in the “FSB Report on Market Fragmentation”, Financial Stability Board, 4 June 2019. See Annex A of the FSB report for an overview of the literature on market fragmentation.
Strong nominal business investment growth and the substitution of bond issuance with bank loans amid a further increase in the relative cost of market-based debt financing compared with that of bank borrowing have, in turn, supported demand for medium and long-term loans.
The bank lending survey indicates that tightening credit conditions for loans to corporates might have incentivised the frontloading of demand for bank loans, against a backdrop of expected further monetary policy normalisation.
The increasing reliance on loans with a fixed interest rate compared with the previous hiking cycle is currently mitigating part of the increase in interest rates in some euro area countries.
The RRE price-at-risk model does not take into account within-country heterogeneity. This is another relevant aspect to consider, as risks to RRE prices might be heterogenous also within countries, depending on the location and type of housing.
Markets for interest rates include sovereign bonds with low credit risk, interest rate swaps and other interest rate derivatives.
For example, between 9 June and 16 June 2022, the EURO STOXX index lost over 8.8% of its value, and the ten-year German government bond yield increased by over 40 basis points. Market commentary associated these moves with the monetary policy decisions announced, as well as the higher than expected US CPI figures released on 10 June 2022.
As of 3 November 2022, the spread between ten-year and two-year US Treasury yields reached -57 basis points, the largest inversion since the 1980s and, notably, surpassing the peak inversion seen during the global financial crisis.
For a literature review describing the link between yield curve inversion and recessions, see, for example, Benzoni, L., Chyruk, O. and Kelley, D., “Why Does the Yield-Curve Slope Predict Recessions?”, Chicago Fed Letter, No 404, 2018.
According to almost 70% of respondents to the September 2022 Bank of America Global Fund Manager Survey, “the ongoing energy crisis in Europe will likely push the domestic economy into a recession”.
See Chapter 2 and the box entitled “Financial stability implications of higher than expected inflation”, Financial Stability Review, ECB, May 2022.
See also Chapter 2 and the box entitled “The impact of Chinese macro risk shocks on global financial markets”, Financial Stability Review, ECB, May 2022.
This statement also applies to corporate issuers; see also Chapter 2, Financial Stability Review, ECB, May 2022.
See also the box entitled “Understanding what happens when ‘angels fall’”, Financial Stability Review, ECB, November 2020.
For sovereign issuers, inflation-linked bonds can also provide a natural hedge against economic conditions, notably demand shocks. When inflation is elevated, tax revenues may also be higher in nominal terms, offsetting the increase in funding cost due to inflation-linked debt. When growth is subdued, however, tax revenues might not be sufficient to offset the higher funding cost.
As of 8 November 2022, the share of outstanding corporate bonds maturing in the next two years was 20% for investment-grade issuers and 11% for high-yield issuers. This statistic covers euro-denominated bond debt issued by euro area non-financial corporations.
According to the Bank of America European Fund Manager Survey of October 2022, “70% of European investors consider demand destruction to be the main macro theme over the coming months”, and a net 32% of global investors say they are underweight European equities.
In particular, the Bank of Japan has so far maintained its yield curve control policy it induced in 2016. This policy has been associated with consistent large carry trade flows that some global portfolio and bank flows may have come to rely upon.
Issuers may fully or partially hedge foreign currency exposures. In this case, the risk is transferred to other participants in the market. In addition, hedging cost may increase. Since the start of the year, the one-year cross-currency basis for the EUR/USD pair has increased (become more negative) by around 20 basis points.
Non-financial corporations have a relatively higher share of foreign currency denominated bond debt, at 28% by outstanding amounts, compared 21% for financials. These data were obtained from Bloomberg L.P. and ECB calculations as at 8 November 2022.
The 60/40-split portfolio is often used as a reference portfolio in the investment industry, and a starting point for an initial asset allocation. It is also an important component of the “Norway Model”, which is considered one the major investment strategies for sovereign wealth funds.
For IRB-reporting banks, credit risk exposures to Russia and Ukraine amounted to 0.4% of the total at the end of the second quarter of 2022.
Stage 2 loans are still performing but are assessed by banks to have experienced a significant increase in credit risk after origination.
Energy intensive firms are defined as being active in sectors with an energy intensity ratio (OECD Trade in Value Added (TiVA) database (2018)) above the 75th percentile of the distribution across sectors.
Loans vulnerable to changes in energy prices are defined by the underlying firms being active in sectors with an energy intensity ratio (OECD Trade in Value Added (TiVA) database (2018)) above the 75th percentile of the distribution across sectors.
Corporate loans vulnerable to rising interest rates are defined as exposures with a PD above 5% and an interest coverage ratio (ICR) below 1, where ICR is defined as earnings before interest and taxes (EBIT) divided by interest paid.
The exposure-weighted average maturity of fixed-rate corporate exposures is about 16 years.
This figure differs from the headline ROE reported in ECB Supervisory Statistics for at least two reasons. First, in this chapter net income is annualised using trailing four-quarter sums as opposed to the annualised year-to-date net income. Second, ROE is calculated for a balanced sample of 86 significant institutions in contrast to the full (unbalanced) sample of significant institutions covered in the ECB Supervisory Statistics.
It should be added that not all components of non-payroll costs are affected by higher inflation. This applies to, for instance, cash contributions to resolution funds and deposit guarantee schemes which, however, represent only a small portion of non-payroll costs.
Cost of risk is defined here as the ratio of net flows of impairments on financial assets (or loan loss provisions) to total loans. It moves in tandem with – but also differs from – the cost-of risk indicators published in Supervisory Banking Statistics which are calculated on changes in the stock of loan loss reserves.
See “SRB publishes updated 2022 MREL policy”, press release, SRB, 8 June 2022.
See the box entitled “Interest rate risk exposures and hedging of euro area banks’ banking books”, Financial Stability Review, ECB, May 2022. This analysis shows that banks’ overall IRR exposure appears moderate on aggregate, although wide variations exist across individual institutions.
This exercise is carried out building on Hoffmann P., Langfield S., Pierobon, F. and Vuillemey, G., “Who Bears Interest Rate Risk?”, Review of Financial Studies, Vol. 32, Issue 8, 2019.
See also the box entitled “Market-based finance for corporations – the demand for and supply of credit”, Economic Bulletin, Issue 4, ECB, 2022.
The duration gap measures the difference in the interest rate sensitivity of assets relative to liabilities. The balance sheets of life insurers and pension funds are typically characterised by a negative duration gap as the average maturity of their liabilities exceeds that of their assets.
Usage of interest rate derivatives varies across different countries and types of NBFIs and frequently serves hedging purposes. See also “The structural impact of the shift from defined benefits to defined contributions”, Economic Bulletin, Issue 5, ECB, 2021, and the box entitled “Interconnectedness of derivatives markets and money market funds through insurance corporations and pension funds”, Financial Stability Review, ECB, November 2020.
Strong increases in UK sovereign bond yields following the UK government’s announcement of tax cuts in late September triggered substantial margin calls on UK pension funds invested in interest rate swaps. Imminent sovereign bond sales to raise liquidity to meet these margin calls amplified pressure in the UK sovereign debt market. On 28 September the Bank of England intervened with a targeted operation to restore financial stability by purchasing long-dated UK government bonds.
By contrast, banks, financial vehicle corporations and the non-financial sector were net buyers of some of these bond segments among the euro area sectors.
See the box entitled “Investment funds’ procyclical selling and cash hoarding: a case for strengthening regulation from a macroprudential perspective”, Financial Stability Review, ECB, May 2021.
See also Goldstein, I., Jiang, H. and Ng, D.T., “Investor flows and fragility in corporate bond funds”, Journal of Financial Economics, Vol. 126, Issue 3, 2017, pp. 592-613.
See Molestina Vivar, L., Wedow, M. and Weistroffer, C., “Burned by leverage? Flows and fragility in bond mutual funds”, Working Paper Series, No 2413, ECB, May 2020.
While there are concerns over materialising vulnerabilities in the short term, higher rates can be beneficial to financial stability in the medium term as they may reduce the sector’s search-for-yield behaviour.
See the box entitled “Synthetic leverage and margining in non-bank financial institutions”, Financial Stability Review, ECB, May 2022, the special feature entitled “Towards a framework for calibrating macroprudential leverage limits for alternative investment funds”, Financial Stability Review, ECB, November 2016 and “EU Alternative Investment Funds”, Annual Statistical Report, ESMA, February 2022.
Claims inflation refers to the increase in the nominal value of payments, which may be higher than the increase in the consumer price index, which often serves as a base for indexed contracts. Life insurers are less affected by claims inflation as they typically have liabilities and guarantees in nominal terms.
In Europe, severe weather, including hailstorms and heavy rain, hit France between May and early July, causing an estimated €4 billion of insured losses. And summer heatwaves resulting in record-high temperatures sparked destructive wildfires, with insured losses still to be quantified.
See, for example, “Global Reinsurance: More Stable and Improved Results Following Shift from Property Catastrophe Risks”, AM Best, August 2022.
See “Climate change, catastrophes and the macroeconomic benefits of insurance”, Financial Stability Report, European Insurance and Occupational Pensions Authority, July 2021.
For further information on the growing importance of insurers and other non-banks, see also Box 2 entitled “Measuring market-based and non-bank financing of non-financial corporations in the euro area”, Financial Integration and Structure in the Euro Area, ECB, April 2022.
See “Early lessons from the Covid-19 pandemic on the Basel reforms”, Basel Committee on Banking Supervision, July 2021, and also the “ECB response to the European Commission’s call for advice on the review of the EU macroprudential framework”, ECB, March 2022.
More specifically, further to the decisions related to macroprudential capital buffers and borrower-based measures already reported in the May 2022 Financial Stability Review, authorities in Ireland, France, Lithuania and the Netherlands have since decided to implement or pre-announce increases in their macroprudential capital buffer rates.
See the “Governing Council statement on macroprudential policies”, ECB, 2 November 2022, and the “Warning of the European Systemic Risk Board on vulnerabilities in the Union financial system”, ESRB, 22 September 2022.
For a more detailed discussion, see the box entitled “Transmission and effectiveness of capital-based macroprudential measures”, Financial Stability Review, ECB, May 2022.
See the “ECB response to the European Commission’s call for advice on the review of the EU macroprudential framework”, op. cit. The European Commission is required to review the macroprudential provisions in the European legislation by June 2022 and is expected to prepare a legislative proposal by December 2022. In this context, the Commission addressed a call for advice to the European Systemic Risk Board, the European Banking Authority and also the ECB, acknowledging the important role the ECB plays in macroprudential policy in the banking union.
See the “Governing Council statement on the treatment of the European banking union in the assessment methodology for global systemically important banks”, ECB, 27 June 2022.
See the ECB opinions on the CRR/CRD package published on 24 March and 27 April 2022.
See “Vulnerabilities in the residential real estate sectors of the EEA countries”, ESRB, February 2022; and the box entitled “Assessing the strength of the recent residential real estate expansion”, Financial Stability Review, ECB, November 2021.
In addition, the proposed deviation on residential real estate exposures may lead to further fragmentation inside the EU banking market, insofar as Member States may implement them differently and hence institutions may be subject to different capital requirements for similar risks depending on which Member State they are located in.
See “The macroprudential challenge of climate change”, ESRB, July 2022.
See Elderson, F., “Mind the gap, close the gap – the ECB’s views on the banking package reforms”, The Supervision Blog, 28 April 2022.
See GHOS, Press release, BCBS, 13 September 2022.
See “The Macroprudential Challenge of Climate Change”, the ECB/ESRB Project Team on climate risk monitoring, July 2022; and “2022 climate risk stress test”, ECB Banking Supervision, July 2022.
See “The role of environmental risk in the prudential framework”, Discussion Paper, EBA, May 2022.
See “Principles for the effective management and supervision of climate-related financial risks”, BCBS, Bank for International Settlements, June 2022.
See “Enhancing the Resilience of Non-Bank Financial Intermediation – Progress report”, FSB, November 2022.
See “Policy Proposals to Enhance Money Market Fund Resilience – Final report”, FSB, October 2021.
See “Eurosystem contribution to the European Securities and Markets Authority (ESMA) consultation on the framework for EU money market funds”, ECB, June 2021; “Recommendation of the European Systemic Risk Board of 2 December 2021 on reform of money market funds”, ESRB, January 2022; and “ESMA opinion on the review of the Money Market Fund Regulation”, ESMA, February 2022.
Money market funds are primarily used as cash management vehicles by investors, while providing short-term funding to issuers – mainly banks but also some non-financial corporations. See also “Assessing the impact of a mandatory public debt quota for private debt money market funds”, Macroprudential Bulletin, Issue 16, ECB, January 2022.
Such tools aim to impose the cost of redemptions on redeeming investors and thereby prevent remaining investors having to bear the cost. This can be achieved e.g. by adjusting the price at which investors buy and sell shares in the fund or imposing a redemption fee.
See, for instance, Section 5.2 entitled “Addressing both liquidity mismatch and leverage in the non-bank financial sector”, Financial Stability Review, ECB, May 2022.
See, for instance, Chen. Q., Goldstein, I. and Jiang, W., “Payoff complementarities and financial fragility: Evidence from mutual fund outflows”, Journal of Financial Economics, Vol. 97, Issue 2, 2010, pp. 239-262; Goldstein, I., Jiang, H. and Ng, D.T., “Investor flows and fragility in corporate bond funds”, Journal of Financial Economics, Vol. 126, Issue 3, 2017, pp. 592-613; Jiang, H., Li, Y., Sun, Z. and Wang, A., “Does mutual fund illiquidity introduce fragility into asset prices? Evidence from the corporate bond market”, Journal of Financial Economics, Vol. 143, Issue 1, 2022, pp. 277-302; and Grill, M., Molestina Vivar, L. and Wedow, M., “Mutual fund suspensions during the COVID-19 market turmoil – asset liquidity, liquidity management tools and spillover effects”, Finance Research Letters, Vol. 50, 2022.
For UCITS funds, the liquidity profile of the investments needs to be appropriate to the redemption policy laid down in the fund rules (Article 40(4) of Commission Directive 2010/43/EU of 1 July 2010 implementing Directive 2009/65/EC of the European Parliament and of the Council as regards organisational requirements, conflicts of interest, conduct of business, risk management and content of the agreement between a depositary and a management company, OJ L 176, 10.7.2010, p. 42). For alternative investment funds, the asset managers “shall ensure that, for each AIF that they manage, the liquidity profile and the redemption policy are consistent” (Article 16(2) of Directive 2011/61/EU of the European Parliament and of the Council of 8 June 2011 on Alternative Investment Fund Managers, OJ L 174, 1.7.2011, p. 1).
For instance, see Molestina Vivar, L., Wedow, M. and Weistroffer, C., “Burned by leverage? Flows and fragility in bond mutual funds”, Working Paper Series, No 2413, ECB, May 2020.
See “Review of margining practices”, report by the Basel Committee on Banking Supervision (BCBS), the BIS Committee on Payments and Market Infrastructures (CPMI) and International Organization of Securities Commissions (IOSCO), September 2022.
At the European level, ESMA is consulting on central counterparty anti-procyclicality measures; see “Review of RTS No 153/2013 with respect to procyclicality of margin”, Consultation Paper, ESMA, 27 January 2022.
This special feature has greatly benefited from data transformation support from Pablo Serrano Ascandoni.
-
16 November 2022