
Economic Bulletin Issue 3, 2023
Update on economic, financial and monetary developments
Summary
The inflation outlook continues to be too high for too long. In light of the ongoing high inflation pressures, the Governing Council decided at its meeting on 4 May 2023 to raise the three key ECB interest rates by 25 basis points. Overall, the incoming information broadly supports the assessment of the medium-term inflation outlook that the Governing Council formed at its previous monetary policy meeting on 16 March. Headline inflation has declined over recent months, but underlying price pressures remain strong. At the same time, the past rate increases are being transmitted forcefully to euro area financing and monetary conditions, while the lags and strength of transmission to the real economy remain uncertain.
The Governing Council’s future decisions will ensure that the policy rates will be brought to levels sufficiently restrictive to achieve a timely return of inflation to its 2% medium-term target and will be kept at those levels for as long as necessary. The Governing Council will continue to follow a data-dependent approach to determining the appropriate level and duration of restriction. In particular, the policy rate decisions will continue to be based on the Governing Council’s assessment of the inflation outlook in light of the incoming economic and financial data, the dynamics of underlying inflation, and the strength of monetary policy transmission.
The key ECB interest rates remain the Governing Council’s primary tool for setting the monetary policy stance. In parallel, the Governing Council will keep reducing the Eurosystem’s asset purchase programme (APP) portfolio at a measured and predictable pace. In line with these principles, the Governing Council expects to discontinue the reinvestments under the APP as of July 2023.
Economic activity
Global economic activity was stronger than expected in early 2023. The global economy was supported by China’s economic reopening after the end of its zero-COVID policy, along with resilience in the US labour market – significant monetary policy tightening notwithstanding. Trade, however, remained relatively weak as the recovery in activity was concentrated in less trade-intensive demand components, such as services. Global headline inflation continues to recede, while core inflation remains at elevated levels.
The euro area economy grew by 0.1% in the first quarter of 2023, according to Eurostat’s preliminary flash estimate. Lower energy prices, the easing of supply bottlenecks and fiscal policy support for firms and households have contributed to the resilience of the economy. At the same time, private domestic demand, especially consumption, is likely to have remained weak.
Business and consumer confidence have recovered steadily in recent months but remain weaker than before Russia’s unjustified war against Ukraine and its people. The Governing Council sees a divergence across sectors of the economy. The manufacturing sector is working through a backlog of orders, but its prospects are worsening. The services sector is growing more strongly, especially owing to the reopening of the economy.
Household incomes are benefiting from the strength of the labour market, with the unemployment rate falling to a new historical low of 6.5% in March. Employment has continued to grow and total hours worked exceed pre-pandemic levels. At the same time, the average number of hours worked remains somewhat below its pre-pandemic level and its recovery has stalled since mid-2022.
As the energy crisis fades, governments should roll back the related support measures promptly and in a concerted manner to avoid driving up medium-term inflationary pressures, which would call for a stronger monetary policy response. Fiscal policies should be oriented towards making the euro area economy more productive and gradually bringing down high public debt. Policies to enhance the euro area’s supply capacity, especially in the energy sector, can also help reduce price pressures in the medium term. In this regard, the Governing Council welcomes the publication of the European Commission’s legislative proposals for the reform of the EU’s economic governance framework, which should be concluded soon.
Inflation
According to Eurostat’s flash estimate, inflation was 7.0% in April, after having dropped from 8.5% in February to 6.9% in March. While base effects led to some increase in energy price inflation, from -0.9% in March to 2.5% in April, the rate stands far below those recorded after the start of Russia’s war against Ukraine. Food price inflation remains elevated, however, standing at 13.6% in April, after 15.5% in March.
Price pressures remain strong. Inflation excluding energy and food was 5.6% in April, having edged down slightly compared with March to return to its February level. Non-energy industrial goods inflation fell to 6.2% in April, from 6.6% in March, when it declined for the first time in several months. But services inflation increased to 5.2% in April, from 5.1% in March. Inflation is still being pushed up by the gradual pass-through of past energy cost increases and supply bottlenecks. In services, especially, it is still being pushed higher also by pent-up demand from the reopening of the economy and by rising wages. The information available up to March suggests that indicators of underlying inflation remain high.
Wage pressures have strengthened further as employees, in a context of a robust labour market, recoup some of the purchasing power they have lost as a result of high inflation. Moreover, in some sectors firms have been able to increase their profit margins on the back of mismatches between supply and demand and the uncertainty created by high and volatile inflation. Although most measures of longer-term inflation expectations currently stand at around 2%, some indicators have edged up and warrant continued monitoring.
Risk assessment
Renewed financial market tensions, if persistent, would pose a downside risk to the outlook for growth as they could tighten broader credit conditions more strongly than expected and dampen confidence. Russia’s war against Ukraine also continues to be a significant downside risk to the economy. However, the recent reversal of past adverse supply shocks, if sustained, could spur confidence and support higher growth than currently expected. The continued resilience of the labour market, by bolstering household confidence and spending, could also lead to higher growth than anticipated.
There are still significant upside risks to the inflation outlook. These include existing pipeline pressures that could send retail prices higher than expected in the near term. Moreover, Russia’s war against Ukraine could again push up the costs of energy and food. A lasting rise in inflation expectations above the Governing Council’s target, or higher than anticipated increases in wages or profit margins, could also drive inflation higher, including over the medium term. Recent negotiated wage agreements have added to the upside risks to inflation, especially if profit margins remain high. The downside risks include renewed financial market tensions, which could bring inflation down faster than projected. Weaker demand, due for example to a more marked slowing of bank lending or a stronger transmission of monetary policy, would also lead to lower price pressures than currently anticipated, especially over the medium term.
Financial and monetary conditions
The euro area banking sector has proved resilient in the face of the financial market tensions that arose ahead of the Governing Council’s meeting in March. The Governing Council’s policy rate increases are being transmitted strongly to risk-free interest rates and to the financing conditions for firms, households and banks. For firms and households, loan growth has weakened owing to higher borrowing rates, tighter credit supply conditions and lower demand. The latest euro area bank lending survey reported a tightening of overall credit standards, which was stronger than banks had expected in the previous round and suggests that lending may weaken further. Weak lending has meant that money growth has also continued to decline.
Monetary policy decisions
At its meeting on 4 May 2023, the Governing Council decided to raise the three key ECB interest rates by 25 basis points. Accordingly, the interest rate on the main refinancing operations and the interest rates on the marginal lending facility and the deposit facility were increased to 3.75%, 4.00% and 3.25% respectively, with effect from 10 May 2023.
The APP portfolio is declining at a measured and predictable pace, as the Eurosystem does not reinvest all of the principal payments from maturing securities. The decline will amount to €15 billion per month on average until the end of June 2023. The Governing Council expects to discontinue the reinvestments under the APP as of July 2023.
As concerns the pandemic emergency purchase programme (PEPP), the Governing Council intends to reinvest the principal payments from maturing securities purchased under the programme until at least the end of 2024. In any case, the future roll-off of the PEPP portfolio will be managed to avoid interference with the appropriate monetary policy stance.
The Governing Council will continue applying flexibility in reinvesting redemptions coming due in the PEPP portfolio, with a view to countering risks to the monetary policy transmission mechanism related to the pandemic.
As banks are repaying the amounts borrowed under the targeted longer-term refinancing operations, the Governing Council will regularly assess how targeted lending operations are contributing to its monetary policy stance.
Conclusion
Summing up, the inflation outlook continues to be too high for too long. In light of the ongoing high inflation pressures, the Governing Council decided at its meeting on 4 May 2023 to raise the three key ECB interest rates by 25 basis points. Overall, the incoming information broadly supports the assessment of the medium-term inflation outlook that the Governing Council formed at its previous monetary policy meeting on 16 March. Headline inflation has declined over recent months, but underlying price pressures remain strong. At the same time, the past rate increases are being transmitted forcefully to euro area financing and monetary conditions, while the lags and strength of transmission to the real economy remain uncertain.
The Governing Council’s future decisions will ensure that the policy rates will be brought to levels sufficiently restrictive to achieve a timely return of inflation to its 2% medium-term target and will be kept at those levels for as long as necessary. The Governing Council will continue to follow a data-dependent approach to determining the appropriate level and duration of restriction. In particular, the policy rate decisions will continue to be based on the Governing Council’s assessment of the inflation outlook in light of the incoming economic and financial data, the dynamics of underlying inflation, and the strength of monetary policy transmission.
In any case, the Governing Council stands ready to adjust all of its instruments within its mandate to ensure that inflation returns to its medium-term target and to preserve the smooth functioning of monetary policy transmission.
1 External environment
Global economic activity in early 2023 was stronger than expected. The global economy was supported by China’s economic reopening after the end of its zero-COVID policy, along with resilience in the US labour market – significant monetary policy tightening notwithstanding. Trade, however, remained relatively weak, as the recovery in activity was concentrated in less trade-intensive demand components such as services. Headline inflation across OECD economies continues to recede, while core inflation remains at elevated levels.
Global economic activity surprised to the upside at the start of the year. Incoming data for both emerging and advanced economies were stronger than expected, driven largely by the economic reopening in China (Chart 1). The global composite output Purchasing Managers’ Index (PMI) increased further in March and reached 51.8 for the first quarter, up from 48.4 in the previous quarter. PMI data signal a growing divergence between services, which stood at an eight-month high in March, and manufacturing, which weakened further into contractionary territory in some major advanced economies.
Chart 1
Citigroup economic data surprises
(index)

Sources: Citigroup, Haver and ECB staff calculations.
Notes: The index is a weighted average of historical standard deviations of data surprises (difference between expectations and releases) for a range of economic indicators. The index averages daily observations over a three-month rolling window. The latest observations are for 3 May 2023.
In contrast to the positive momentum in economic activity, global trade remains subdued. Momentum in world merchandise trade growth (in three-month-on-three-month terms) remained negative in February (Chart 2). The weakness in trade relative to economic activity is due in part to composition effects, as the recent rebound in activity was primarily driven by less trade-intensive services and consumption. Trade is expected to gradually pick up, also benefiting from the normalisation of global supply constraints. The PMI supply shortage index improved further in March, having crossed above the neutral threshold in February for the first time since the start of the coronavirus (COVID-19) pandemic.
Chart 2
Merchandise trade momentum
(real imports, 3-month-on-3-month percentage changes)

Sources: CPB and ECB staff calculations.
Note: The latest observations are for February 2023.
Inflation across OECD economies continued to decrease, but core inflationary pressures remain persistently high. In March, annual headline consumer price index (CPI) inflation across OECD countries (excluding Türkiye) decreased sharply to 5.8% year on year, from 7.3% in February, largely owing to lower energy price inflation (Chart 3). By contrast, excluding food and energy prices, OECD core inflation (excluding Türkiye) continues to signal more persistence in underlying price pressures, decelerating to 4.5% in March from 4.8% in February.
Chart 3
OECD consumer price inflation
(year-on-year percentage changes)

Sources: OECD and ECB staff calculations.
Notes: The OECD aggregate excludes Türkiye and is calculated using OECD CPI annual weights. The latest observations are for March 2023.
Oil prices remained broadly unchanged (+1%) since the March Governing Council meeting, as the oil price increase in reaction to the OPEC+ supply cut was counterbalanced by concerns about demand amid the recent US banking sector stress. Oil prices increased by 9% immediately after OPEC+ announced plans to reduce oil production by close to 1.7 million barrels per day (Chart 4). OPEC+ communicated an intention to act pre-emptively to stabilise oil markets in anticipation of weaker global oil demand. However, the gains in oil prices following the OPEC+ announcement were broadly reversed as oil prices continued to be affected by downside risks to US demand amid recent stress in the banking sector. However, if such downside risks do not materialise, it is worth noting that the production cut will take place in the second half of 2023, when an oil supply deficit is expected by the International Energy Agency. European gas prices fell 13% to below 40 EUR/MWh, while the EU enters the gas storage replenishment season at record-high storage levels. With the prolongation of EU gas saving measures – which envisage Member States reducing gas consumption by 15% between 1 April 2023 and 31 March 2024 – the EU is on track to achieve its 90% storage target for November 2023. Non-energy commodity prices have remained broadly unchanged since the March Governing Council meeting. International food commodity prices continued to be affected by severe droughts in Argentina and the announcements of temporary bans imposed by Poland, Hungary and Slovakia on Ukrainian grain imports, which counterbalanced the effects of the extension of the Black Sea Grain Initiative on grain prices. Meanwhile, metal prices were supported by higher Chinese demand following the recent reopening of the Chinese economy, but were weighed down by concerns over global demand amid stress in the banking sector.
Chart 4
(USD per barrel)
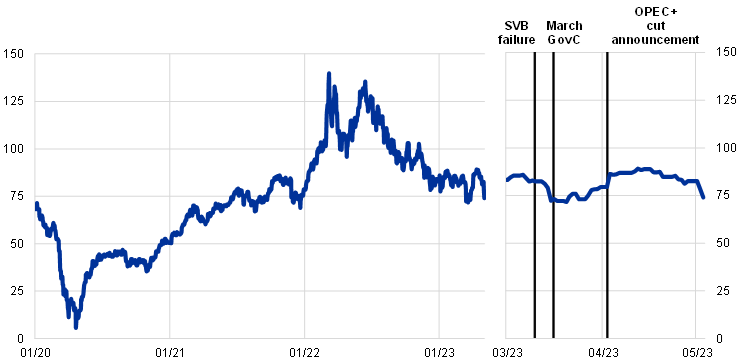
Source: Refinitiv.
Notes: The lines mark the following events: 10 March 2023 for the Silicon Valley Bank failure, 16 March 2023 for the March Governing Council meeting and 2 April 2023 for the OPEC+ cut announcement. The latest observations are for 3 May 2023.
In the United States, economic activity is moderating, reflecting weak domestic demand. GDP growth for the first quarter of 2023 was 0.3% (quarter on quarter), half that of the previous quarter, mainly reflecting a decline in private inventories and a weakening in non-residential investment. Private consumption regained momentum, reflecting a one-off reduction in taxes in January, while it remained subdued for the rest of the quarter. The failure of Silicon Valley Bank (SVB) triggered severe but short-lived stress in the banking sector, which led to a tightening of lending conditions that may weigh on consumer spending. Meanwhile, the labour market remains resilient despite the monetary policy tightening. Nominal wage growth is easing but remains high, signalling ongoing tightness in the labour market. Annual headline inflation declined to 5.0% in March from 6.0% in February, primarily owing to base effects in energy prices related to the spike in energy prices following Russia’s invasion of Ukraine in 2022. However, underlying inflationary pressures remain high, with core inflation increasing marginally to 5.6% in March due to high service price inflation.
The Chinese economy is rebounding rapidly. Economic growth in the first quarter of this year was stronger than expected, following the decline in economic activity around the turn of the year, which was related to the departure from zero-COVID policy measures and a subsequent increase in COVID-19 cases. GDP in the first quarter expanded by 2.2% quarter on quarter. The rebound in consumer spending was more frontloaded than expected, with consumption and activity in the services sector driving growth, while manufacturing and investment remained subdued. Meanwhile, the property sector is showing signs of a nascent recovery. Completions and sales of residential properties rebounded in month-on-month terms at the start of the year, while staying relatively flat year on year. Average home prices increased for the first time in 18 months, driven by developments in China’s largest and most developed cities.
In Japan, economic activity was recovering in the first quarter of the year, with inflationary pressures further broadening. High-frequency data suggest that consumer spending and confidence may be picking up, moderately supporting domestic demand despite the persistent decrease in real wages. Annual headline inflation slowed sharply in February, reflecting the impact of new government energy subsidies. Underlying price pressures are broadening, however, with core inflation increasing further to 2.3% in March, the highest level since 1992 (if VAT hike effects are excluded). Moreover, wage pressures in Japan are likely to rise, as the early rounds of the spring wage negotiations (Shunto) point to substantial wage increases compared with previous years. Regarding bond markets, the significant upward pressures on Japanese government bond yields over recent months began to ease after global yields fell amid stress in the banking sector. Overall, ten-year yields now stand somewhat below their upper target bounds as imposed by the Bank of Japan.
The United Kingdom avoided a recession, but economic prospects remain subdued. GDP increased by 0.1% (in three-month-on-three-month terms) in the three months to February, driven mainly by an improvement in the services and construction sectors. While the economy steered clear of a technical recession, declining real wages, rising interest rates and a housing market downturn continue to weigh on economic activity and point towards anaemic growth over the remainder of the year. At the same time, credit conditions appear to be stable after the recent financial market stress. Headline annual CPI inflation remains very high and stood at 10.1% in March, above market expectations, while core inflation remained unchanged at 6.2%. The government extended energy subsidies from April to June, which will lower the annual inflation rate by 1 percentage point from the second quarter of 2023. Underlying price pressures are expected to remain elevated until mid-2024.
The rise in consumer prices and weakening external demand pose headwinds to growth across key emerging market economies (EMEs). PMI new export orders in manufacturing stayed in contractionary territory in March among EMEs, and also deteriorated in several countries compared with February. Moreover, high inflation is also weighing on growth prospects across EMEs, as it erodes consumers’ purchasing power. While declining energy and food prices and the waning impact of past currency depreciations in several EME economies support lower headline inflation, core inflation remains high and shows only limited signs of decline. The recovery in China provides some short-term support to growth in Asia. However, its impact is unlikely to persist in an environment of slowing global demand.
2 Economic activity
Euro area real GDP grew by 0.1% in the first quarter of 2023. Lower energy prices, the easing of supply bottlenecks and fiscal policy support for firms and households have contributed to the resilience of the economy. At the same time, private domestic demand, especially consumption, is likely to have remained weak. Business and consumer confidence have recovered steadily in recent months but remain weaker than before Russia’s unjustified war against Ukraine and its people. The manufacturing sector is working through a backlog of orders, but its prospects are worsening. Meanwhile, the services sector is growing more strongly, especially owing to the reopening of the economy. Household incomes are benefiting from the strength of the labour market, with the unemployment rate falling to a new historical low. As the energy crisis fades, governments should roll back the related support measures promptly and in a concerted manner to avoid driving up medium-term inflationary pressures, which would call for a stronger monetary policy response. Fiscal policies should be oriented towards making the economy more productive and gradually bringing down high public debt. Policies to enhance the euro area’s supply capacity, especially in the energy sector, could also help reduce price pressures in the medium term. Downside risks to the outlook for growth relate to renewed and persistent financial market tensions, alongside Russia’s war against Ukraine. However, a sustained reversal of past adverse supply shocks as well as the continued resilience of the labour market could also lead to higher growth than anticipated.
Euro area output rose marginally in the first quarter of 2023. According to Eurostat’s preliminary flash estimate, growth edged up by 0.1% in the first quarter of the year, after stagnating at the end of 2022 (Chart 5). Several factors are shaping euro area growth at the current juncture. Activity is being stimulated by fiscal support measures – which are helping to contain the adverse impact of high energy inflation – and resilient labour markets. However, headwinds persist in the form of continued high inflation and a further tightening of financing conditions.[1] While a breakdown of growth into contributing factors is not available, short-term indicators and the available country data suggest that on the expenditure side weak private domestic demand was offset by more resilient exports.
Chart 5
Euro area real GDP, composite output PMI and ESI
(left-hand scale: quarter-on-quarter percentage changes; right-hand scale: diffusion index)

Sources: Eurostat, European Commission, S&P Global Market Intelligence and ECB calculations.
Notes: The two lines indicate monthly developments; the bars show quarterly data. The European Commission’s Economic Sentiment Indicator (ESI) has been standardised and rescaled to have the same mean and standard deviation as the composite output Purchasing Managers’ Index (PMI). The latest observations are for the first quarter of 2023 for real GDP and April 2023 for the ESI and the composite output PMI.
The incoming data that have so far become available for the second quarter of 2023 suggest continued positive but moderate growth. In April 2023 the euro area composite output Purchasing Managers’ Index (PMI) stood at 54.4, above the first quarter average of 52.0 and in line with an expanding level of output. This increase was driven exclusively by business activity in the services sector, which now stands well above the no-growth threshold of 50, benefiting from the continuing reopening of the economy (Chart 6). Despite being supported by healthy order books, the manufacturing output PMI declined to below 50, partly on account of the unfavourable effects of the strikes in France, where manufacturing output fell to its lowest level since May 2020. The European Commission’s Economic Sentiment Indicator (ESI) paints a broadly similar picture. In the latest ECB Survey of Professional Forecasters, which was conducted in early April, respondents forecast low but positive growth in the second quarter of 2023, followed by a slight increase in growth in the third quarter.[2] As the adverse effects of Russia’s invasion of Ukraine – linked to high inflation, elevated uncertainty and slow foreign demand – slowly abate, a gradual recovery is expected on the back of a resilient labour market and a further easing of supply-side conditions.
Chart 6
Value added, production and PMI for manufacturing and services
(left-hand scale: quarter-on-quarter percentage changes; right-hand scale: index, February 2021 = 50, diffusion index)

Sources: S&P Global Market Intelligence, Eurostat and ECB calculations.
Notes: The latest observation is for the fourth quarter of 2022 for value added and April 2023 for PMI output/activity. In the manufacturing panel, the latest observation for production is for February 2023, while in the services panel, it is for January 2023 (with an estimate for February 2023 based on available country data).
The labour market in the euro area remains resilient. The unemployment rate stood at 6.5% in March 2023, marginally lower than the rate of 6.6% in February and 0.9 percentage points lower than the pre-pandemic level observed in February 2020 (Chart 7). Quarter on quarter, total employment rose by 0.3% in the fourth quarter of 2022, after growing by 0.3% in the third quarter, supported by an increasing labour force (boosted, among other factors, by more inward migration). As a result of the economic recovery that followed the lifting of pandemic-related restrictions, job retention schemes largely ceased, returning to their pre-crisis level of around 0.3% of the labour force at the end of 2022. However, average hours worked in the fourth quarter of 2022 were still 1.6% below pre-pandemic levels, partially offsetting the strong increase in employment. The low level of average hours worked was a common feature across all main sectors of economic activity. While the number of average hours worked decreased by 1.2% in the industry sector (excluding construction) and by 1.4% in the market services sector relative to pre-pandemic levels, the decline was more substantial in the construction and public sectors – at around -1.9% and -2.4% respectively. In addition to sectoral drivers, the number of average hours worked appears to have been affected by the rise in sick leave in the second half of 2022.
Chart 7
Euro area employment, PMI employment indicator and the unemployment rate
(left-hand scale: quarter-on-quarter percentage changes, diffusion index; right-hand scale: percentages of the labour force)

Sources: Eurostat, S&P Global Market Intelligence and ECB calculations.
Notes: The two lines indicate monthly developments; the bars show quarterly data. The PMI is expressed as the deviation from 50 divided by 10. The latest observations are for the fourth quarter of 2022 for employment, April 2023 for the PMI assessment of employment and March 2023 for the unemployment rate.
Short-term labour market indicators continue to point to a robust euro area labour market. The composite PMI employment indicator stood at 54.7 in April 2023. The reading of above 50 suggests further employment growth in the first and second quarters of the year. Looking at developments across sectors, the PMI employment indicator continues to signal strong employment growth in services, but shows signs of weakening in the manufacturing sector. The PMI indicator for employment in the construction sector has been in contractionary territory since April 2022.
Private consumption growth is likely to have been subdued in the first quarter of 2023. The negative dynamics of household consumption in the fourth quarter of 2022 were driven mainly by weak consumption of goods, while consumption of services remained broadly resilient, benefiting from lingering reopening effects. This dichotomy is likely to have continued in the first quarter of 2023. Elevated inflation continues to weigh on disposable income, while persistent uncertainty is dampening consumer spending. Retail sales figures in January and February suggest that spending on goods in the first quarter is likely to have contracted further. New passenger car registrations declined in the first quarter, largely on account of the withdrawal of purchase incentives for electric vehicles in Germany. By contrast, consumption of services is likely to have been more resilient in the first quarter, as suggested by the PMI for contact-intensive services, which remained solidly in expansionary territory. The European Commission’s consumer confidence indicator continued its recovery in the first quarter of 2023 (Chart 8, left-hand panel), albeit from low levels, driven by an improvement in household expectations (Chart 8, right-hand panel). Incoming economic data point to improving, but still subdued, consumer spending. Consumer confidence improved further in April, but remained at low levels. While expectations for retail trade business activity deteriorated slightly, expected demand for accommodation, food and travel services remained resiliently above its historical average, and expectations for consumer goods production recovered further. The ECB’s Consumer Expectations Survey corroborates these findings, pointing to a low level of expected “big item” purchases but a rise in holiday bookings.
Household real disposable income declined in the fourth quarter of 2022, owing to elevated inflation in spite of the support from robust labour market dynamics. At the same time, the ratio of household savings to disposable income increased. While the further easing of economic uncertainty may reduce incentives to save, higher interest rates and tighter credit conditions are likely to encourage saving, thereby constraining consumption growth in the near term.
Chart 8
Household confidence, uncertainty and expectations
(standardised percentage balances)

Sources: European Commission (Directorate-General for Economic and Financial Affairs) and ECB calculations.
Note: The latest observations are for April 2023.
Business investment is expected to have grown again in early 2023 following a contraction in the fourth quarter of 2022. Quarter-on-quarter headline non-construction investment fell by 5.8% in the fourth quarter of 2022. Excluding the strongly negative contribution from investment in intellectual property products in Ireland, it would have declined by 0.3% quarter on quarter.[3] Production up to February 2023 grew by 1.2% from the previous quarter and PMI output rose in the capital goods sector against a backdrop of easing supply disruptions and lower energy costs.[4] Meanwhile, the relative importance of internal corporate financing is increasing as the cost of borrowing rises and credit standards tighten. European Commission survey data show that, while remaining above historical averages, perceived limits to production in the capital goods sector diminished in the second quarter of 2023 compared with the previous quarter, as a result of the lower impact from factors related to space and/or equipment, as well as labour (Chart 9).
Chart 9
Limits to production in the capital goods sector
(changes in de-meaned percentage balances)

Sources: European Commission (Directorate-General for Economic and Financial Affairs) and ECB calculations.
Notes: The net percentage balances have been adjusted for the average over the period 2000-19. The latest observations, referring to the second quarter of 2023, pertain to the release of data for April 2023.
Housing investment is expected to remain weak in the first half of 2023, amid some short-term volatility. Housing investment might have picked up in the first quarter of 2023, as suggested by the increase in building construction output in January and February by 3.7%, on average, compared with the fourth quarter of 2022. This reflects a strong base effect amid volatile weather conditions and a continued substantial backlog of orders. Nevertheless, the underlying momentum in housing investment remains subdued, reflecting protracted weakness in affordability (proxied by the average income needed for a mortgage payment on a typical home) and profitability (measured by the ratio of house prices to construction costs, known as Tobin’s Q). While typically moving in opposite directions, driven by house price fluctuations, affordability and profitability both contracted at an unprecedented rate in the fourth quarter of 2022, owing to rising mortgage rates and construction costs respectively (Chart 10). This weak momentum in housing investment is likely to persist in the first half of 2023, as suggested by several indicators. The PMI for residential construction output remained in contractionary territory until March 2023. The European Commission’s relevant index for recent trends in building construction activity continued to fall up to April, mainly as a result of weakening demand, growing labour shortages and tightening financial conditions, despite easing constraints in the supply of materials. The latest ECB Consumer Expectations Survey and Corporate Telephone Survey also suggest persistent expectations of high mortgage rates and tight credit access for households despite some moderation in cost pressures for firms.[5]
Chart 10
Housing investment, affordability and profitability in the euro area
(year-on-year change, percentages)
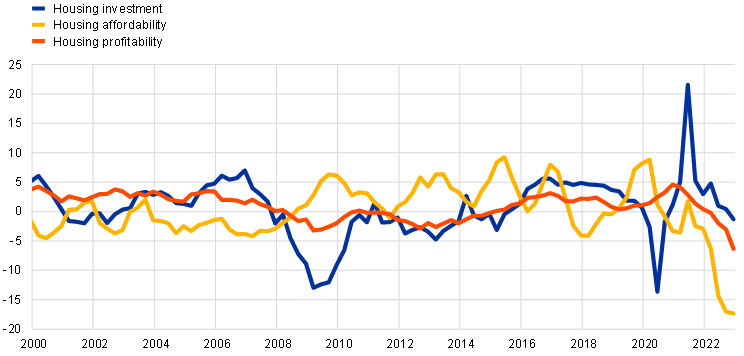
Sources: Eurostat and ECB calculations.
Notes: Housing profitability is the ratio of house prices to construction costs (proxied by the housing investment deflator), known as Tobin’s Q. Housing affordability is computed in line with the methodology used by the US National Association of Realtors, as the ratio of average household income (proxied by household gross disposable income per capita) to average mortgage payments. The latter are calculated as the average payment on a 15-year mortgage at a constant interest rate (measured by the 10-year-plus mortgage rate) and the present value of the principal (proxied by house prices). The latest observations are for the fourth quarter of 2022.
The momentum in euro area exports remained subdued in the early months of the year, while imports continued to fall. The momentum in euro area goods exports slowed in February as the moderation in global trade outweighed the benefits from easing supply chain constraints. Moreover, empirical evidence suggests that higher energy costs may have affected export performance.[6] Imports declined further, in part driven by lower gas imports, as the weaker demand for gas reduced energy needs in the winter of 2022-23. Manufacturing imports also moderated, in line with the slowdown in euro area domestic demand. Looking ahead survey indicators point to a moderate pick-up in export prospects. They also suggest that suppliers’ delivery times in the manufacturing industry have shortened further and that port congestion is easing rapidly across the world. However, while new manufacturing export orders have improved, they remain in contractionary territory, suggesting a somewhat moderate recovery in exports. The indicator for services export orders is more buoyant. In particular, tourism indicators are signalling a strong summer season ahead.
3 Prices and costs
According to the Eurostat flash estimate, inflation was 7.0% in April 2023, after having dropped from 8.5% in February to 6.9% in March. Inflation rates for food and non-energy industrial goods (NEIG) decreased, while the rate for services saw a small further increase. Price pressures remained strong across all sectors, with the effects of high energy costs, supply bottlenecks and the reopening of the economy continuing to feed through. This was mirrored in the latest available data for indicators of underlying inflation, which remained high. Meanwhile, data for the fourth quarter of 2022 indicate that wage pressures continued to strengthen in that quarter, with some sectors seeing increased profit margins. Although most measures of longer-term inflation expectations currently stand at around 2%, some indicators have edged up and warrant continued monitoring.
Headline inflation in the euro area, as measured by the Harmonised Index of Consumer Prices (HICP), was 7.0% in April, after having dropped from 8.5% in February to 6.9% in March. The rise in April was driven by an increase in energy inflation, which rose from -0.9% to 2.5% over the same period. Meanwhile, food inflation fell to 13.6% in April, down from 15.5% in March, and HICP inflation excluding energy and food (HICPX) stood at 5.6%, down slightly from 5.7% in March. These figures remain high, suggesting that earlier surges in energy input costs and past supply bottlenecks are still feeding through. While NEIG inflation fell slightly to stand at 6.2% in April, services inflation increased to 5.2% (up from 5.1% in March), probably still being driven by pent-up demand from the reopening of the economy and rising wages (Chart 11).
Chart 11
Headline inflation and its main components
(annual percentage changes; percentage point contributions)

Sources: Eurostat and ECB calculations.
Note: The latest observations are for April 2023 (flash estimates).
April’s increase in energy inflation reflected an upward base effect, while energy prices declined further in month-on-month terms. Annual energy inflation increased in most of the five largest euro area countries, with heterogeneity across those countries remaining considerable on account – among other things – of differences in energy production mixes, contract and consumption patterns, regulatory approaches and government support measures. Pipeline pressures for energy prices have continued to fall, with annual growth in energy producer prices standing at 17.3% in February 2023, down from a peak of 117.3% in August 2022 (Chart 12).
April saw food inflation in the euro area decline for the first time since September 2021, with lower annual rates for both unprocessed and processed food. It stood at 13.6% in that month, down from 15.5% in March, with annual growth in unprocessed food prices standing at 10.0% (down from 14.7% in March) on account of a sizeable month-on-month decline in prices. The decline observed for unprocessed food probably reflected a downward correction following two months of strong price increases. At the same time, the annual growth rate of processed food prices also declined, standing at 14.7% in April, down from 15.7% in March, mainly reflecting a downward base effect (as prices for processed food rose further in month-on-month terms). This decline suggests that the accumulated cost pressures on food prices as a result of prices for energy and food inputs may have started to recede (Chart 12).
Chart 12
HICP food prices, energy and food input costs
(annual percentage changes)

Source: Eurostat.
Note: The latest observations relate to April 2023 (flash estimate) for HICP food, March 2023 for euro area farm gate prices and February 2023 for the remaining items.
Most indicators of underlying inflation in the euro area remained at elevated levels (Chart 13). At the same time, heterogeneity in the levels of the various measures remained considerable, pointing to uncertainty surrounding the dynamics of underlying inflation. While HICPX data are available for April, other measures of underlying inflation only include data up to March and have been sending mixed signals. Exclusion-based indicators such as HICPXX (i.e. HICPX minus volatile travel, footwear and clothing-related items) and the domestic inflation indicator (which excludes items with a high import content) remained broadly unchanged in March, as did the Supercore indicator (which comprises cyclically sensitive HICP items). However, exclusion-based measures of underlying inflation tend to be reported in terms of year-on-year growth rates, so their signals may involve a lag. The model-based Persistent and Common Component of Inflation (PCCI) measure, which is expressed in terms of an annualised rate, declined in March (regardless of whether energy is included). More generally, the short-term growth rates of several indicators of underlying inflation, measured in terms of month-on-month or quarter‑on-quarter developments, have started to point to some moderation in price pressures. Such a moderation in measures of underlying inflation would be consistent with the notion that these measures include indirect effects of the past energy price surge which are now gradually unwinding, with energy price developments having moderated for several months now.
Chart 13
Indicators of underlying inflation
(annual percentage changes)

Sources: Eurostat and ECB calculations.
Notes: The range of indicators of underlying inflation includes HICP excluding energy, HICP excluding energy and unprocessed food, HICPX, HICPXX, 10% and 30% trimmed means, PCCI and a weighted median. The grey dashed line represents the ECB’s inflation target of 2% over the medium term. The latest observations relate to April 2023 (flash estimate) for HICPX and March 2023 for the rest.
With energy costs becoming less prominent, developments in wages and other labour costs are increasingly becoming a factor in the persistence of underlying inflation in the euro area. The latest available data point to a strengthening of wage pressures, with annual growth in negotiated wages standing at 2.9% in the third and fourth quarters of 2022, up from 2.5% in the second quarter. Actual wage growth, as measured in terms of compensation per employee and compensation per hour, increased markedly in the fourth quarter of 2022, with the annual growth rates of those two measures of wages rising to 5.0% and 4.3% respectively, up from 3.9% and 2.9% respectively in the third quarter. Wage negotiations concluded in recent months suggest that wage pressures have continued to strengthen in 2023. The extent to which these pressures will feed through into the dynamics of underlying inflation will depend on developments in profit margins, with aggregate national accounts data for the fourth quarter of 2022 pointing to a strengthening of the pressures coming from this source.
Inflation for non-energy industrial goods fell to 6.2% in April, down from 6.6% in March. Looking at early stages of the pricing chain, producer price inflation for intermediate goods and import price inflation for intermediate goods both declined strongly further in February. Looking at later stages of the pricing chain, producer price inflation for non-food consumer goods edged downward to stand at 8.6% in February, down from 8.8% in January – the second consecutive month with a decline in annual terms. While annual growth rates for import prices and producer prices have been easing, they remain elevated, indicating cumulative pipeline pressures that could keep consumer price inflation for NEIG high for some time (Chart 14).
Chart 14
Indicators of pipeline pressures
(annual percentage changes)
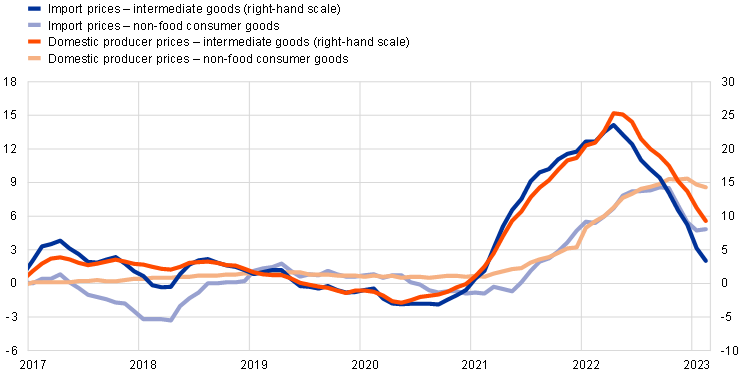
Sources: Eurostat and ECB calculations.
Note: The latest observations are for February 2023.
Most survey-based indicators of longer-term inflation expectations in the euro area remain more or less unchanged at around 2%, broadly in line with market‑based measures of inflation compensation (Chart 15). In the ECB Survey of Professional Forecasters (SPF) for the second quarter of 2023, average longer‑term inflation expectations (for 2027) were unchanged at 2.1%. In the April 2023 Consensus Economics survey, inflation expectations for 2027 increased to 2.1% (up from 2.0% in January). In the March 2023 ECB Survey of Monetary Analysts, median longer-term expectations remained unchanged at 2.0%. When combined with shorter-term expectations, these data suggest that survey participants expect a rapid decline in inflation and point to the anchoring of longer‑term expectations. In the ECB Consumer Expectations Survey for March 2023, median expectations three years ahead rose to 2.9%, up from 2.4% in February.[7] Overall, market‑based measures of inflation compensation (which are based on HICP excluding tobacco) remained broadly unchanged over the review period at the short end, while increasing at the long end amid an easing of concerns about the recent turmoil in the banking sector. At the short end, the one-year forward inflation-linked swap rate one year ahead stood at around 2.2% in early May, broadly unchanged from the start of the review period in mid-March. As regards long-term rates, the five‑year forward inflation-linked swap rate five years ahead ended the review period slightly higher, standing at around 2.4% in early May, having peaked at almost 2.5% during that period. However, it should be noted that market‑based measures of inflation compensation are not a direct gauge of market participants’ genuine inflation expectations, given that these measures include inflation risk premia which compensate for inflation risks.
Chart 15
Survey-based indicators of inflation expectations and market-based measures of inflation compensation
(annual percentage changes)

Sources: Eurostat, Refinitiv, Consensus Economics, Survey of Professional Forecasters, ECB staff macroeconomic projections for the euro area, March 2023, and ECB calculations.
Notes: The market-based measures of inflation compensation series is based on the one-year spot inflation rate, the one-year forward rate one year ahead, the one-year forward rate two years ahead and the one-year forward rate three years ahead. The observations for market-based measures of inflation compensation relate to 2 May 2023. The ECB Survey of Professional Forecasters for the second quarter of 2023 was conducted between 31 March and 5 April 2023. The cut-off for the Consensus Economics long‑term forecasts was April 2023. The cut-off date for data included in the ECB staff macroeconomic projections was 2 March 2023. The latest observation for HICP relates to April 2023 (flash estimate).
There are still significant upside risks to the inflation outlook. In the near term, existing pipeline pressures could send retail prices higher than expected, while Russia’s war against Ukraine could push energy and food prices up again. Over the medium term, inflation expectations that are persistently higher than the ECB’s target could also drive inflation up, as could larger than anticipated increases in wages or profit margins. Moreover, recent negotiated wage agreements have added to the upside risks to inflation, and those risks will be exacerbated if profit margins remain high. Downside risks include the potential for renewed financial market tensions, which could bring inflation down faster than projected. A weakening of demand – on account, for example, of a more marked slowdown in bank lending or stronger transmission of monetary policy – would also result in price pressures being weaker than is currently anticipated, especially over the medium term.
4 Financial market developments
During the review period (16 March to 3 May 2023), financial market developments were driven largely by waning concerns about the banking sector turmoil seen in early March, as well as by the Governing Council’s monetary policy decisions that month. Market expectations for euro area policy rates rose over the review period but remained lower than prior to the banking turmoil, i.e. before the broad-based sell-off in risk assets sparked by difficulties experienced by some US regional banks. Sovereign bond yields in the euro area ended the review period broadly unchanged, remaining below their pre-turmoil levels, with stable sovereign spreads. Overall, euro area risk assets improved, despite experiencing initial volatility on the back of the banking sector turmoil: euro area corporate bond spreads narrowed across segments, and equity markets – apart from bank stocks – moved somewhat higher. In both cases, this represents a general unwinding of the movement that had occurred during the turmoil. In foreign exchange markets, the euro strengthened overall in trade-weighted terms.
Euro area near-term risk-free rates rose following the Governing Council’s March 2023 meeting, as market participants revised their policy rate expectations upwards, but still remained below their pre-turmoil level. Over the review period, the euro short-term rate (€STR) averaged 284 basis points, that average having risen from 240 basis points between 16 March and 21 March to 290 basis points after 22 March, i.e. during the reserve maintenance period that followed the ECB’s interest rate hike in March. Excess liquidity was stable, increasing by approximately €31 billion to €4,096 billion. The initial reaction of risk-free rates to the Governing Council’s monetary policy decisions in March was relatively muted across maturities. Thereafter, the overnight index swap (OIS) forward curve, based on the benchmark €STR, rose for short-term maturities, reflecting market participants’ waning concerns about the banking sector and their shift in focus back towards global activity and inflation. At the end of the review period, the OIS forward curve had priced in rate hikes of 34 basis points and 16 basis points for the May and June Governing Council meetings respectively, as well as further rate increases amounting cumulatively to 30 basis points. This implies a peak rate of approximately 3.7% by the end of 2023, which is below the peak rate that had prevailed on 6 March, just before the start of the risk asset sell-off sparked by difficulties at some US regional banks.
Long-term sovereign bond yields ended the review period broadly unchanged, standing below their level prior to the banking sector turmoil in early March (Chart 16). The euro area GDP-weighted average ten-year sovereign bond yield stood at around 2.9%, seeing little change over the review period and remaining somewhat below its level prior to the turmoil. Ten-year sovereign bond yields in the euro area generally moved in line with long-term risk-free rates, resulting in a stable spread over the euro area OIS rate of around 0.2 percentage points. Outside the euro area, the ten-year US sovereign bond yield decreased by 21 basis points, to stand at 3.4%, while the UK sovereign bond yield increased by 26 basis points, standing at 3.7%.
Chart 16
Ten-year sovereign bond yields and the ten-year OIS rate based on the €STR
(percentages per annum)

Sources: Refinitiv and ECB calculations.
Notes: The vertical grey line denotes the start of the review period on 16 March 2023. The latest observations are for 3 May 2023.
Corporate bond spreads narrowed, despite widening initially on the back of the banking sector turmoil in early March. In the first few days of the review period, corporate bond spreads were highly volatile, driven primarily by bonds in the financial corporation and high-yield segments. By the end of March this volatility had abated, and spreads narrowed smoothly thereafter, leading to an overall decrease over the review period. Specifically, spreads on high-yield and investment-grade corporate bonds both fell by around 20 basis points. Within the investment-grade segment, spreads on financial corporate bonds narrowed the most, by 22 basis points, ending the review period slightly higher than prior to the banking turmoil, while those on non-financial corporate bonds declined by 17 basis points, ending the review period slightly lower than prior to the turmoil.
Euro area equity markets rose, and forward-looking measures of volatility decreased. Euro area equity prices picked up and forward-looking measures of stock market volatility decreased from the six-month high seen during the banking turmoil in early March. Overall, equity prices of non-financial corporations (NFCs) rose by around 3.8%, while the equity prices of euro area banks increased more modestly, by around 1.2%, to stand significantly below their pre-turmoil levels. In the United States, NFC equity prices went up by around 3.5% over the review period, while bank equity prices weakened by around 4.3%.
In foreign exchange markets, the euro strengthened overall in trade-weighted terms (Chart 17). During the review period the nominal effective exchange rate (EER) of the euro – as measured against the currencies of 41 of the euro area’s most important trading partners – appreciated by 2.5%. In terms of bilateral exchange rate developments against major currencies, the euro appreciated against the US dollar (by 4.2%), amid rising interest rate differentials and easing financial market tensions, and also against the Japanese yen (by 6.8%) and the pound sterling (by 0.5%). The euro likewise strengthened against the Chinese renminbi (by 4.5%) and against the currencies of other major emerging economies, but depreciated against the currencies of some non-euro area EU countries.
Chart 17
Changes in the exchange rate of the euro vis-à-vis selected currencies
(percentage changes)

Source: ECB.
Notes: EER-41 is the nominal effective exchange rate of the euro against the currencies of 41 of the euro area’s most important trading partners. A positive (negative) change corresponds to an appreciation (depreciation) of the euro. All changes have been calculated using the foreign exchange rates prevailing on 3 May 2023.
5 Financing conditions and credit developments
The funding cost of banks increased significantly over the first quarter of 2023, with bank bond spreads widening during the financial market turmoil in March. In February 2023 bank lending rates rose further, reflecting the increases in the key European Central Bank (ECB) interest rates. Over the period from 16 March to 3 May 2023 both firms’ cost of equity financing and the cost of market-based debt financing declined slightly. Bank lending to firms and households continued to moderate in March amid higher interest rates, weaker demand and tighter credit standards. In the most recent bank lending survey, euro area banks reported a further substantial tightening of their credit standards, above expectations, and a strong decline in loan demand from firms and households, pointing to a persistent weakening of loan dynamics. Monetary dynamics remained subdued in March 2023, driven by their most liquid components and slower credit growth.
The funding costs of euro area banks continued to increase in February, reflecting movements in market rates and higher deposit rates. Owing to lags in the available data on deposit rates, the composite cost of debt financing of euro area banks as of 3 May (the cut-off date for this document) could only be calculated up to February. The indicator increased further and stood at its highest level for ten years (Chart 18, panel a). Bank bond yields increased by 48 basis points since the beginning of 2023 (Chart 18, panel b) and bank bond spreads widened sharply during the market turmoil in mid-March 2023, especially for more subordinated bonds and in particular Additional Tier 1 (AT1) instruments. Despite some reversion of the initial increase, spreads remain significantly above those observed before the turmoil. The cost of deposits maintained its steady rising path, albeit with heterogeneity observed across types of products. Time deposit rates are adjusting swiftly to policy rate changes, while overnight deposit rates remain more sluggish. While depositors are reacting to this widening spread by shifting from overnight to time deposits, the former still make up a large share of the deposit base. As a result, the spread between composite deposit and policy rates continues to widen, as observed during past interest rate hiking cycles.
Banks’ repayments of funds borrowed under the third series of targeted longer-term refinancing operations (TLTRO III) also contributed to higher bank funding costs. Since the recalibration of the TLTRO III terms and conditions, which came into effect on 23 November 2022, banks have made sizeable (both mandatory and, in particular, voluntary) repayments of funds borrowed under the programme. A total of €1.015 trillion has been repaid, reducing outstanding amounts by around 48%.[8] Furthermore, banks have increased the issuance of bonds, which are remunerated above deposit and policy rates, amid the winding-down of TLTROs and the decline in deposits. Bank bond issuance has increased by almost €170 billion since September 2022, while deposits decreased by around €200 billion over the same period.
Chart 18
Composite bank funding rates in selected euro area countries
(annual percentages)

Sources: ECB, I Markit iBoxx indices and ECB calculations.
Notes: Composite bank funding rates are a weighted average of the composite cost of deposits and unsecured market-based debt financing. The composite cost of deposits is calculated as an average of new business rates on overnight deposits, deposits with an agreed maturity and deposits redeemable at notice, weighted by their respective outstanding amounts. Bank bond yields are monthly averages for senior-tranche bonds. The latest observations are for February 2023 for composite bank funding rates and 3 May 2023 for bank bond yields.
Bank lending rates for firms and households rose further in February 2023, reflecting the increases in the key ECB interest rates. Changes in the ECB’s monetary policy measures are being transmitted to bank lending conditions, with banks’ rates increasing and credit standards tightening, as described below. Bank lending rates for loans to non-financial corporations (NFCs) increased further to 3.85% in February, compared with 3.63% in January and 1.55% in May 2022. Bank lending rates for loans to households for house purchase also rose further to stand at 3.24% in February, compared with 3.10% in January and 1.78% in May 2022. These increases were faster than in previous hiking cycles, mainly reflecting the faster pace of policy rate hikes. Results from the February 2023 Consumer Expectations Survey suggest that consumers expect mortgage rates to increase further over the next 12 months. They also expect it to become harder to obtain housing loans. The spread between bank lending rates on small and large loans increased somewhat in February, reflecting country heterogeneity, but remained low in a historical context. The cross-country dispersion of lending rates to firms and households remained broadly stable (Chart 19, panels a and b).
Chart 19
Composite bank lending rates for NFCs and households in selected countries
(annual percentages; standard deviation)
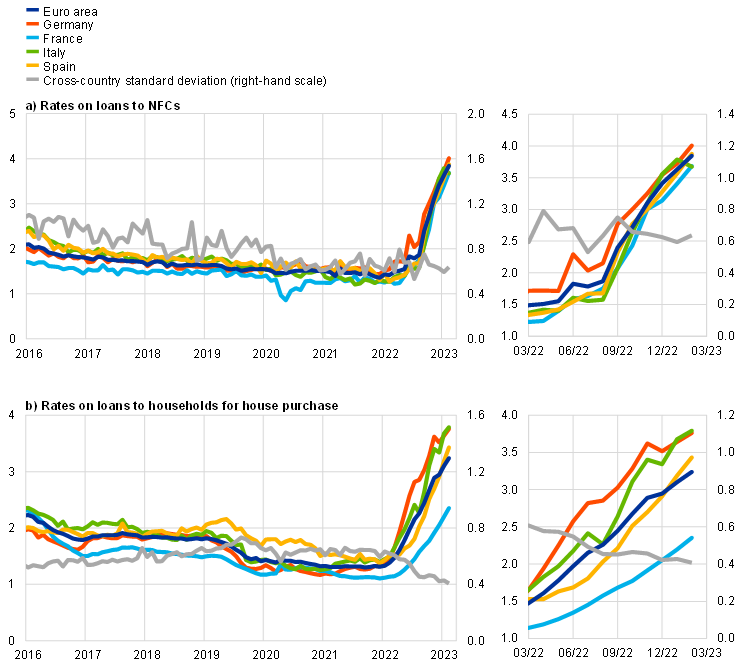
Source: ECB.
Notes: Composite bank lending rates are calculated by aggregating short and long-term rates using a 24-month moving average of new business volumes. The cross-country standard deviation is calculated using a fixed sample of 12 euro area countries. The latest observations are for February 2023.
Over the period from 16 March to 3 May 2023 both the cost of equity financing for NFCs and the cost of market-based debt declined slightly. Owing to lags in the available data on the cost of borrowing from banks, as of 3 May the overall cost of financing for NFCs – that is, the composite cost of bank borrowing, market-based debt and equity – could only be calculated up to February 2023, when it stood at 5.9%, almost unchanged from its level in the previous month (Chart 20). This was the result of a decline in the cost of equity financing compensating for a rise in the cost of market-based debt – mostly owing to the increase in the risk-free rates as corporate bond spreads were little changed – and the increase in the cost of both short and long-term bank debt. While decreasing slightly from its October 2022 peak, in February 2023 the overall cost of financing remained close to the elevated levels last seen at the end of 2011. Over the review period the cost of market-based debt declined slightly, owing to broadly stable risk-free rates combined with a sizeable compression in the spreads on corporate bonds issued by non-financial firms for both investment-grade and, more noticeably, high-yield segments. As long-term risk-free rates remained virtually stable, the cost of equity mirrored the developments in the equity risk premium, which declined over the review period.
Chart 20
Nominal cost of external financing for euro area NFCs, broken down by component

Sources: ECB and ECB estimates, Eurostat, Dealogic, Merrill Lynch, Bloomberg and Thomson Reuters.
Notes: The overall cost of financing for NFCs is calculated as a weighted average of the cost of borrowing from banks, market-based debt and equity, based on their respective outstanding amounts. The latest observations are for 3 May 2023 for the cost of market-based debt (monthly average of daily data), 28 April 2023 for the cost of equity (weekly data) and 28 February 2023 for the overall cost of financing and the cost of borrowing from banks (monthly data).
According to the April 2023 euro area bank lending survey, credit standards for loans to firms and to households for house purchase showed a further substantial tightening in the first quarter of 2023, pointing to a persistent weakening of loan dynamics (Chart 21). The tightening was stronger than banks had expected in the previous quarter and, from a historical perspective, its pace for firms remained the strongest seen since the euro area sovereign debt crisis in 2011. In an environment of increased uncertainty, the main factors underlying the tightening of credit standards for firms and households were higher risk perceptions related to the economic outlook and, to a lesser extent, lower risk tolerance by banks. Against the backdrop of increases in the key ECB interest rates and decreases in central bank liquidity, banks’ cost of funds and balance sheet conditions also had a tightening impact on credit standards for loans to euro area firms. For the second quarter of 2023 banks expect a further, though more moderate tightening of credit standards on loans to firms and households.
Banks reported a strong decrease in loan demand from firms and households in the first quarter of 2023. The decline in loan demand from firms was the strongest since the global financial crisis, while that of households was the largest since the start of the survey in 2003. The decline in loan demand from firms and households was stronger than expected by banks in the previous quarter. Banks reported that the general level of interest rates was the main driver of reduced loan demand, in an environment of monetary policy tightening. Falling financing needs for fixed investment also had a strong dampening effect on loan demand from firms. The decrease in the demand for housing loans remained strong and was mainly driven by rising interest rates, weakening housing market prospects and low consumer confidence. For the second quarter of 2023 banks expect a further, albeit smaller (net) decrease in loan demand from firms and households.
Chart 21
Changes in credit standards and net demand for loans to NFCs and to households for house purchase
(net percentages of banks reporting a tightening of credit standards or an increase in loan demand)

Source: Euro area bank lending survey.
Notes: For survey questions on credit standards, “net percentages” are defined as the difference between the sum of the percentages of banks responding “tightened considerably” and “tightened somewhat” and the sum of the percentages of banks responding “eased somewhat” and “eased considerably”. For survey questions on demand for loans, “net percentages” are defined as the difference between the sum of the percentages of banks responding “increased considerably” and “increased somewhat” and the sum of the percentages of banks responding “decreased somewhat” and “decreased considerably”. The diamonds denote the expectations reported by banks in the current round. The latest observations are for the first quarter of 2023.
Furthermore, banks expect that the ECB’s non-standard monetary policy measures will contribute to weakening lending dynamics due to their effect on banks’ funding and liquidity positions. Banks’ access to retail and wholesale funding deteriorated in the first quarter of 2023, possibly reflecting the March 2023 market turmoil and reversing the improvement in the access to these markets registered at the end of last year. Banks indicate that the winding-down of the ECB’s monetary policy asset portfolio and the phasing-out of TLTRO III has also had a negative impact on their market financing conditions and liquidity positions over the last six months. In addition to the impact from higher policy rates and increased risk aversion, repayments of funds borrowed under TLTRO III are contributing to a reduction in lending volumes, as credit standards tighten further. Meanwhile, banks reported that the impact of the key ECB interest rate decisions on their net interest margins was markedly positive, whereas the impact on bank profitability via their non-interest income was negative. Moreover, banks reported a dampening impact on profitability via higher provisions and impairments, which may reflect higher credit risk as monetary policy tightening dampens economic activity and increases the interest burden of borrowers.
Bank lending to firms and households continued to moderate in March amid higher interest rates, weaker demand and tighter credit standards. The annual growth rate of loans to NFCs declined to 5.2% in March, from 5.7% in February (Chart 22, panel a). This slowdown was widespread across the largest economies and reflects the higher interest rates, the strong decrease in loan demand and the further substantial tightening of credit standards. The annual growth rate of loans to households also continued to moderate, edging down from 3.2% in February to 2.9% in March (Chart 22, panel b) amid deteriorating housing market prospects, a substantial further tightening of banks’ credit standards and higher lending rates. It was mainly driven by the ongoing decline in the growth of housing loans, but since the beginning of 2023 other loans to households, and in particular those granted to sole proprietors (i.e. unincorporated small businesses), have shown substantial negative net flows and therefore also contributed to the weakening.
Chart 22
MFI loans in selected euro area countries
(annual percentage changes; standard deviation)

Source: ECB.
Notes: Loans from monetary financial institutions (MFIs) are adjusted for loan sales and securitisation; in the case of NFCs, loans are also adjusted for notional cash pooling. The cross-country standard deviation is calculated using a fixed sample of 12 euro area countries. The latest observations are for March 2023.
Overnight deposits contracted strongly in March, driven by the reallocation of funds to instruments with a higher remuneration, in particular time deposits but also non-bank financial instruments. The annual growth rate of overnight deposits declined to -5.1% in March, from -3.5% in February. The sharp decline in the growth of overnight deposits and therefore also in the narrow monetary aggregate M1 is the strongest contraction observed since the start of the Economic and Monetary Union in 1999 (Chart 23). After recording its first negative annual growth rate in January (-0.8%), M1 growth has continued to weaken, declining from -2.7% in February to -4.2% in March. This is especially owing to the large-scale substitution of overnight deposits with time deposits, but it also reflects the shift to bank bonds and, to a lesser extent, money market fund shares. The absence of a material increase in currency in circulation suggests that there was no widespread decrease in the public’s trust in euro area banks following the March turmoil. This pattern of portfolio rebalancing was also observed in previous tightening cycles, as the remuneration of overnight deposits adjusts sluggishly to policy rate changes. The remuneration of time deposits and market-based instruments, however, adjusts faster, leading to a widening of interest rate spreads, which in turn creates incentives for portfolio reallocation. The strong shift away from overnight deposits in the current tightening cycle can be explained by the following main factors. First, the pace of the ECB’s policy tightening is faster than in previous tightening cycles, leading to a sharp widening of the spread between overnight and time deposits. Second, the accumulated share of overnight deposits was exceptionally large after the period of low interest rates and the COVID-19 pandemic. Third, the sharp weakening of lending dynamics dampens overall money creation.
Chart 23
M3, M1 and overnight deposits
(annual growth rate, adjusted for seasonal and calendar effects)

Source: ECB.
Note: The latest observations are for March 2023.
Monetary dynamics remained subdued in March 2023, driven by their most liquid components and slower credit growth. Annual broad money (M3) growth declined from 3.4% in January and 2.9% in February to 2.5% in March, the lowest rate since October 2014 (Chart 23). Moreover, the short-term dynamics of M3 are around historical minima, with similar figures seen only in early 2010. The ongoing decline in money growth can be explained by the increasing opportunity costs of holding money and the weakening credit dynamics amid higher policy rates, weak economic activity and tighter credit standards. The phasing-out of Eurosystem net asset purchases and TLTROs are also contributing to the weakening of monetary dynamics, the latter by incentivising the issuance of bank bonds, which leads to a portfolio reallocation of money holders away from deposits.
Boxes
1 Monetary policy and housing investment in the euro area and the United States
Housing investment in the euro area and the United States fell significantly in 2022, with the fall being particularly pronounced in the United States. In the euro area, housing investment started to decline in the second quarter of 2022 and recorded a cumulative fall of about 4% by the fourth quarter of 2022 (Chart A, panel a). By contrast, the decline in the United States started as early as the second quarter of 2021. Since then, US housing investment has fallen by around 21% cumulatively, with a particularly sharp decline in the second half of 2022 when the rise in US mortgage rates led to a sharp drop in affordability for homebuyers (Chart A, panel b). These declines have taken place against the backdrop of monetary policy tightening on both sides of the Atlantic, with policy interest rates in the United States being raised earlier and reaching higher levels than euro area policy rates. Against this background, this box analyses the dynamics of housing investment in the euro area and the United States and discusses the impact of the recent monetary policy tightening on future housing investment in the euro area.
More2 Intangible assets of multinational enterprises in Ireland and their impact on euro area GDP
Activities of multinational enterprises (MNEs) in Ireland are increasingly affecting euro area output and components of GDP. MNEs in Ireland contribute to domestic output by maintaining large production facilities, offering high-paid jobs and generating tax revenues. Over the past decade Ireland has also seen a large-scale onshoring of intellectual property products (IPP) by foreign-owned MNEs, in some cases coupled with the relocation of group headquarters (“redomiciliation”) to Ireland.[9] The associated transactions in these intangible assets are often unrelated to euro area business cycle dynamics, instead reflecting tax optimisation measures conducted by large foreign-owned MNEs. Such transactions can be sizeable, irregular and instantaneous, as moving these assets (e.g. software and patents) across borders does not require any physical relocation. In the quarter when the transaction is made, the resulting volatility in headline Irish and euro area real non-construction investment is largely GDP neutral as it is offset by real services imports.[10] IPP inflows nevertheless boost both the capital stock and exports in Ireland as well as the euro area, thus contributing positively to real GDP growth in subsequent quarters. This box examines these issues relating to IPP inflows, highlighting (i) their broadly neutral impact on within-quarter euro area GDP growth, despite volatile investment and import dynamics, and (ii) their positive cumulative impact on euro area GDP growth over the medium term.
More3 The energy shock, price competitiveness and euro area export performance
Modest global demand, supply bottlenecks and surging energy costs have weighed on euro area export performance in the past year. While euro area exports rebounded sharply immediately after the coronavirus (COVID-19) pandemic, the past two years have seen relatively anaemic euro area export growth. The euro area export weakness was partly a reflection of subdued global trade dynamics as firms struggled with supply chain disruptions. However, the pick-up in the summer of last year notwithstanding, euro area exports have tended to lag the global recovery in trade, with euro area exporters failing to recover market shares lost during the pandemic (Chart A). The recent easing of supply bottlenecks should help bolster global trade prospects in the short term, including for the euro area. However, exporting firms, particularly those in the euro area, also face the challenges of still elevated energy costs. This box examines empirical evidence on the role of the energy price shock in affecting price competitiveness and euro area export performance.
More4 Main findings from the ECB’s recent contacts with non-financial companies
This box summarises the findings of recent contacts between ECB staff and representatives of 61 leading non-financial companies operating in the euro area. The exchanges took place between 30 March and 13 April 2023.[11]
More5 Indicators for producer price pressures in consumer goods inflation
The increase in consumer goods price inflation in the euro area over the last two years was preceded by a sharp rise in producer prices. Leading indicator properties of industrial producer prices for consumer prices form a well-established and central element of the ECB’s analysis of pipeline pressures.[12] A previous analysis introduced a framework to obtain a time profile for the impact of producer prices on consumer prices.[13] This box takes that analysis further by using the time profile of these impacts to derive indicators for producer price pressures (IPPIs), which summarise total price pressures from producer prices on food and non-energy industrial goods (NEIG) consumer prices over time. These IPPIs complement a broad range of various measures that are useful in anticipating and assessing the extent of underlying price pressures in the economy.[14]
More6 A model-based assessment of the macroeconomic impact of the ECB’s monetary policy tightening since December 2021
The monetary policy normalisation that started in December 2021 has taken the ECB’s policy stance from a highly accommodative position into restrictive territory. In December 2021 the ECB announced that it would begin normalising its policy stance by slowing the pace of net asset purchases, with net purchases under the pandemic emergency purchase programme (PEPP) and the asset purchase programme (APP) eventually ending in March 2022 and June 2022 respectively.[15] The ECB’s interest rate guidance was revised in June 2022, and its key policy rates were increased by a total of 350 basis points between July 2022 and March 2023, rapidly tightening policy and ultimately taking rates into restrictive territory. While the speed and magnitude of this tightening is high from a historical perspective, monetary policy is transmitted to the economy with lags, implying that the full impact of the tightening will unfold over the next few years. This box uses a variety of empirical macroeconomic modelling frameworks to illustrate the impact on economic activity and inflation in the euro area.
More7 Government expenditure in the euro area during the pandemic crisis – insights from the Classification of the Functions of Government data
On 22 February 2023 Eurostat released the 2021 data on general government expenditure according to the Classification of the Functions of the Government (COFOG). This dataset covers all EU Member States over the period from 1995 to 2021. The data are published annually with a time lag of around 14 months, and provide insights into the composition of public expenditure in the EU and the euro area. Notably, the COFOG data regroup national accounts spending data according to similar economic government objectives, thus improving its comparability across countries.[16] The ratio of euro area public expenditure to GDP increased substantially in recent years, from 46.9% in 2019 – the pre-pandemic baseline – to 52.6% in 2021 and to 50.7% in 2022. In the light of the high magnitude of public expenditure in the euro area, as well as the multiplicity of organisational and institutional settings in public administration, COFOG data provide valuable information on common and divergent trends in governmental actions across countries. Against this background, this box provides an overview of the functional composition of government spending in the euro area and across euro area countries in 2021. The effect of the COVID-19 pandemic on government spending is also discussed.[17]
More8 EUROPOP2023 demographic trends and their euro area economic implications
The recent coronavirus (COVID-19) pandemic and the influx of migrants are leaving a mark on the demographic outlook for the euro area, with implications for the long-term economic outlook. This box reviews the demographic trends derived from the latest EUROPOP2023 population projections, which were published by Eurostat on 30 March 2023. These projections cover the size and structure of the population of all EU Member States for the period 2022-2100. Revisions in the demographic projections are driven by recent changes in birth rates, mortality rates and migration flows. In view of the long-term horizon, the projections are surrounded by a high degree of uncertainty. This box focuses on revisions compared with the previous update of the population projections, which were released in 2019, and their impact on economic growth prospects and fiscal sustainability in the euro area.[18]
MoreArticles
1 The impact of Brexit on UK trade and labour markets
It has been almost two and a half years since the United Kingdom signed its post-Brexit trade deal with the European Union (EU), which was expected to have multifaceted impacts on the UK economy. The EU-UK Trade and Cooperation Agreement (TCA) was signed on 30 December 2020 and came into effect provisionally on 1 January 2021. Leaving the EU’s Single Market and the EU Customs Union represented a profound change in the economic relationship. This change was expected to have an impact on trade flows between the EU and the United Kingdom, but also on migration flows, foreign direct investment, regulation, the financial sector, science and education, and other areas of the UK economy.
More2 The impact of the recent inflation surge across households
This article investigates the impact across households of the surge in euro area inflation since mid-2021. High inflation was spurred by a combination of factors. Starting in 2021, the euro area and global economies reopened after the lockdown period against the background of lingering supply bottlenecks. In early 2022, after the Russian invasion of Ukraine, the price of imported energy, which had already been increasing, skyrocketed. This implied a large negative terms-of-trade shock for the euro area.[19] While the surge in inflation was initially triggered predominantly by global factors, the role of domestic demand increased over time with the recovery of the economy after the COVID-19 pandemic restrictions were lifted.[20]
MoreStatistics
Statistical annex© European Central Bank, 2023
Postal address 60640 Frankfurt am Main, Germany
Telephone +49 69 1344 0
Website www.ecb.europa.eu
All rights reserved. Reproduction for educational and non-commercial purposes is permitted provided that the source is acknowledged.
This Bulletin was produced under the responsibility of the Executive Board of the ECB. Translations are prepared and published by the national central banks.
The cut-off date for the statistics included in this issue was 3 May 2023.
For specific terminology please refer to the ECB glossary (available in English only).
PDF ISSN 2363-3417, QB-BP-23-003-EN-N
HTML ISSN 2363-3417, QB-BP-23-003-EN-Q
See the box entitled “A model-based assessment of the macroeconomic impact of the ECB’s monetary policy tightening since December 2021” in this issue of the Economic Bulletin.
See “Results of the ECB Survey of Professional Forecasters for the second quarter of 2023”, press release, ECB, 5 May 2023.
See the box entitled “Intangible assets of multinational enterprises in Ireland and their impact on euro area GDP” in this issue of the Economic Bulletin.
Corporate contacts also report growth in the capital goods sector on the back of a reduction in supply disruption, see the box entitled “Main findings from the ECB’s recent contacts with non-financial companies” in this issue of the Economic Bulletin.
For an assessment of the structural drivers of the decline in euro area housing investment and a comparison with the United States, see the box entitled “Monetary policy and housing investment in the euro area and the United States” in this issue of the Economic Bulletin.
See the box entitled “The energy shock, price competitiveness and euro area export performance” in this issue of the Economic Bulletin.
See “ECB Consumer Expectations Survey results – March 2023”, press release, ECB, Frankfurt am Main, 11 May 2023.
See “ECB recalibrates targeted lending operations to help restore price stability over the medium term”, Press Release, ECB, Frankfurt am Main, 27 October 2022.
The onshoring of intangible assets refers to IPP inflows, i.e. the transfer of assets, including patents, trademarks, copyrights, industrial processes and designs, from abroad to an entity residing in the reporting country.
Non-construction investment is defined as total investment minus construction investment. It is used as a proxy for business investment in the absence of such a variable in euro area national accounts data. For an insight into the impact on euro area investment of the quarterly volatility in IPP dynamics, see, for example, Box 1 in the article entitled “The recovery in business investment – drivers, opportunities, challenges and risks”, Economic Bulletin, Issue 5, ECB, 2022.
For further information on the nature and purpose of these contacts, see the article entitled “The ECB’s dialogue with non-financial companies”, Economic Bulletin, Issue 1, ECB, 2021.
See the boxes entitled “Industrial producer prices for sales in domestic and non-domestic markets”, Monthly Bulletin, ECB, April 2013; and “What can recent developments in producer prices tell us about pipeline pressures?”, Economic Bulletin, Issue 3, ECB, 2017.
See the box entitled “Recent developments in pipeline pressures for non-energy industrial goods inflation in the euro area”, Economic Bulletin, Issue 5, ECB, 2021.
See P.R. Lane, “Underlying inflation”, lecture at Trinity College Dublin, 6 March 2023.
Furthermore, in December 2022 the ECB announced its intention to reduce the size of the APP portfolio by not reinvesting some of the principal payments from maturing securities. The APP portfolio will decline by €15 billion per month on average until the end of June 2023, and the Governing Council expects to discontinue all reinvestments thereafter.
For instance, a government can effect direct expenditure (e.g. on housing) that benefits part of the population, or it can provide target groups with earmarked subsidies or make their private expenditure tax deductible. As such, government expenditure data could vary considerably when using the standard national accounts classification. In the COFOG data, however, such arrangements would be classified together under the housing function. For more details, see the article entitled “Social spending, a euro area cross-country comparison”, Economic Bulletin, Issue 5, ECB, 2019.
While a significant effort has been made to harmonise the recording of government measures intended to mitigate the economic and social impact of the COVID-19 pandemic, a full harmonisation of data for the reference years 2020 and 2021 has not yet been achieved. The likelihood of future revisions is higher than usual, and data are provisional. For more details, see “General government expenditure by function in 2021”, Eurostat, 2023.
EUROPOP2023 population projections are deterministically calculated based on the assumption of the continuation of current trends, as well as a partial convergence to the EU average. Revisions are mainly made on account of a function of three demographic events: births, deaths and migratory flows, each of which shapes the population structure over time. Cf. “Population projections in the EU - methodology”, Eurostat (2023). Some revisions may also be on account of changes in the projection methodology.
When assessing the impact of energy price changes on households’ purchasing power, the ratio between the GDP and private consumption deflators (or between income and the expenditure deflators) is a useful indicator.
See the box entitled “The role of demand and supply in underlying inflation – decomposing HICPX inflation into components”, Economic Bulletin, Issue 7, ECB, 2022.