
The labour market recovery in the euro area through the lens of the ECB Consumer Expectations Survey
Published as part of the ECB Economic Bulletin, Issue 2/2022.
This box analyses the current labour market recovery using data from the ECB Consumer Expectations Survey (CES).[1] The CES offers new insights into the euro area labour market.[2] Respondents provide information about their employment status, job searches, expectations regarding employment and earnings, their level of job satisfaction and how well their skills match their job. Some of this information is not available from the official EU labour market statistics and, for the main labour market aggregates, the CES provides more timely data. Thus, the CES data are a useful complement to the official EU data. This box uses these data to shed light on the current recovery in the euro area labour market.
The labour force participation rate is recovering overall, in line with a decline in the numbers of discouraged workers. The CES data show that the labour force participation rate – i.e. the proportion of the working-age population that is in work or actively looking for work – has rebounded since January last year (Chart A).[3] However, the data for January 2022 show a decline in the labour force participation rate and an increase in discouraged workers – i.e. those who are not currently searching for work because they think there are no suitable jobs available, or who have not yet started searching. These recent developments are likely related to the tightening of coronavirus (COVID-19) containment measures as well as seasonal factors suppressing labour demand during the winter months. The increase in the labour force participation rate during 2021 was accompanied by a decrease in discouragement.[4] Therefore, the increase in the participation rate has in part been the result of transitions of respondents who are not actively searching for work (i.e. inactive) directly into employment, hence indicating improving labour market prospects also for unemployed respondents who are actively searching for jobs. The unemployment rate, as measured by the CES, continued to decline in January 2022 to stand about 2.4 percentage points below the highest level it reached during the pandemic period.
Chart A
Labour force, unemployment and discouraged workers
(left-hand scale: percentages of the working-age population; right-hand scale: percentages of inactive respondents for discouraged workers and percentages of the labour force for the unemployment rate)
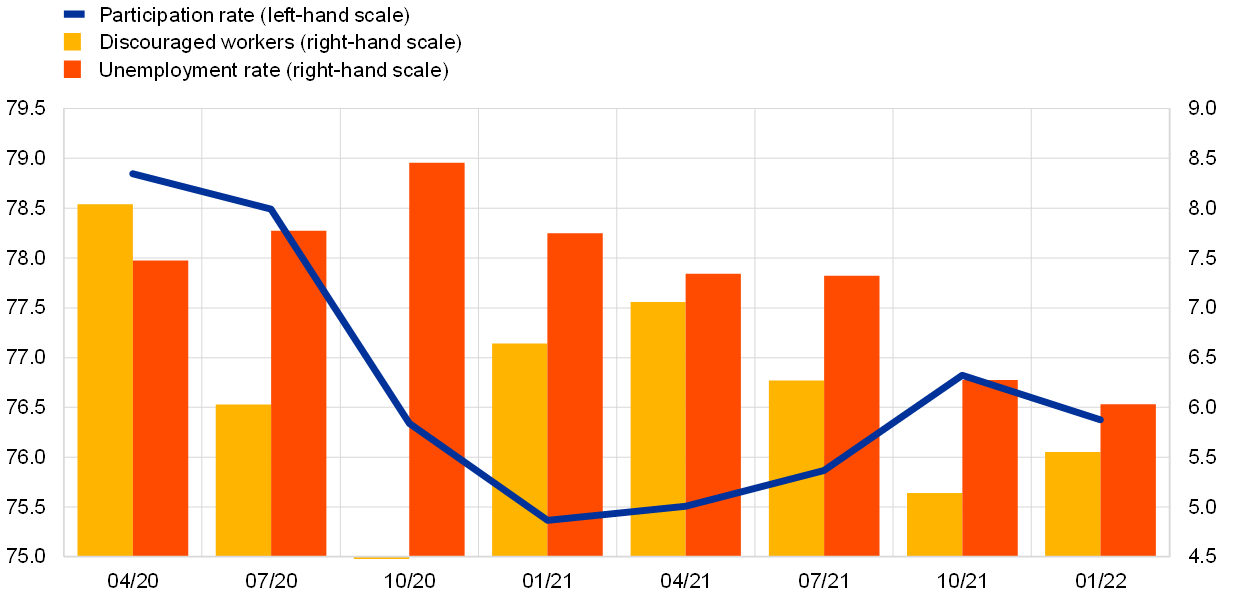
Source: CES.
Notes: The labour force participation rate is the share of employed respondents, plus the share of unemployed respondents who are currently searching for jobs, relative to all survey respondents aged 20-64. The unemployment rate is the share of unemployed respondents who are searching for jobs relative to the labour force aged 20-64. Both rates reported in the CES differ from those calculated by Eurostat owing to various sampling and methodological differences. In addition, owing to a revision to the CES question on employment status, there is potentially a break in these series in October 2020. Discouraged workers is the share of all respondents aged 20-64 who are inactive and not currently searching for a job because “there are no jobs available” or because they “haven’t started looking yet”.
Perceptions about developments in the labour market improved substantially after the first few months of the COVID-19 pandemic (Chart B). As economic conditions recovered in aggregate terms, perceptions about labour market developments improved, which was reflected in a steady decline in unemployment rate expectations across all groups of respondents based on their level of education. Respondents who have completed primary or secondary education tend to expect the unemployment rate 12 months ahead to be higher than the levels expected by respondents with a tertiary education. Unemployment rate expectations of all groups have proven significantly higher than observed rates, which is a common finding of surveys on expectations.[5] Consistent with expectations regarding the unemployment rate, employees have recently been reporting less concern that they will lose their jobs.
Chart B
Expectations regarding the unemployment rate 12 months ahead, broken down by respondents’ level of education
(percentages)
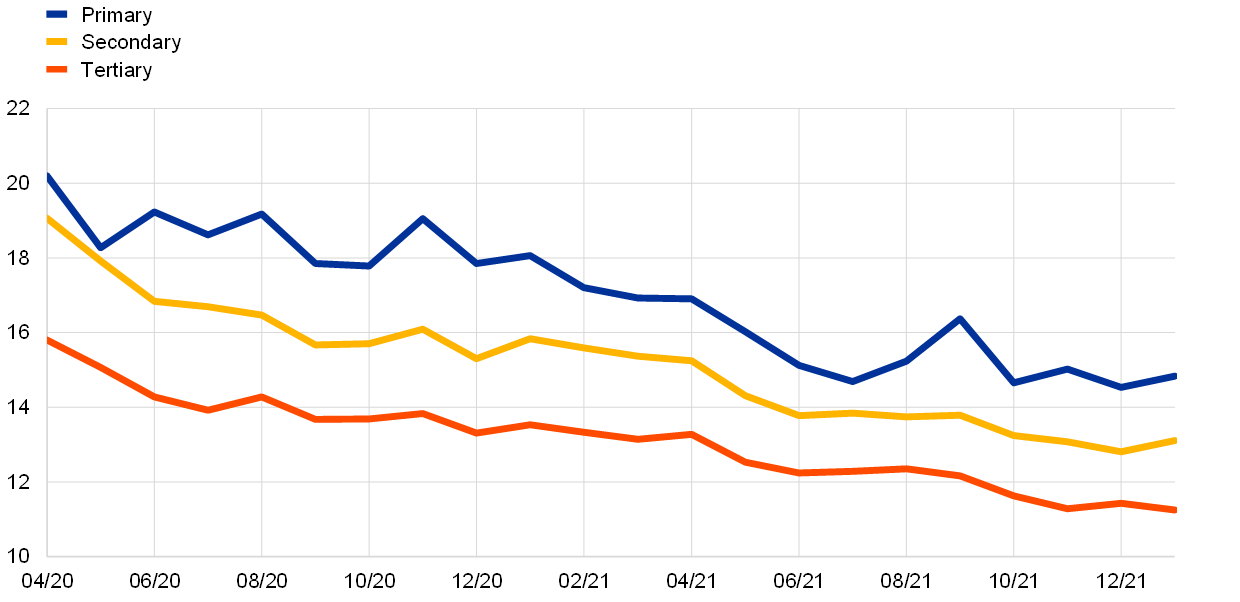
Source: CES.
Notes: The data refer to average expectations regarding the unemployment rate in the countries of the respondents 12 months ahead. The education levels refer to the highest level of schooling completed, or degree achieved, according to the International Standard of Classification of Education (ISCED).
Job-to-job transitions and improved earnings expectations show that employees’ perceptions of the labour market situation improved overall (Chart C). Job-to-job transitions tend to decrease during economic downturns and increase during upturns. As labour market conditions improve during upturns, firms compete for workers currently employed by other firms and workers use the opportunity to move to better paid jobs, which possibly implies some upward pressure on wages.[6] CES data suggest that the share of employees moving to another firm in a quarter has been steadily increasing since January 2021, except for a small decline in the latest data for January 2022, which is potentially related to similar reasons as for the drop in labour force participation. The improvement in job-to-job transitions during 2021 was accompanied by an increase in the share of respondents expecting higher total net household income over the next 12 months, as workers searching for jobs became more optimistic about their wages, hours worked or overall employment prospects.
Chart C
Job-to-job transitions and expectations of increasing earnings
(left-hand scale: percentages of respondents; right-hand scale: percentages of employees)
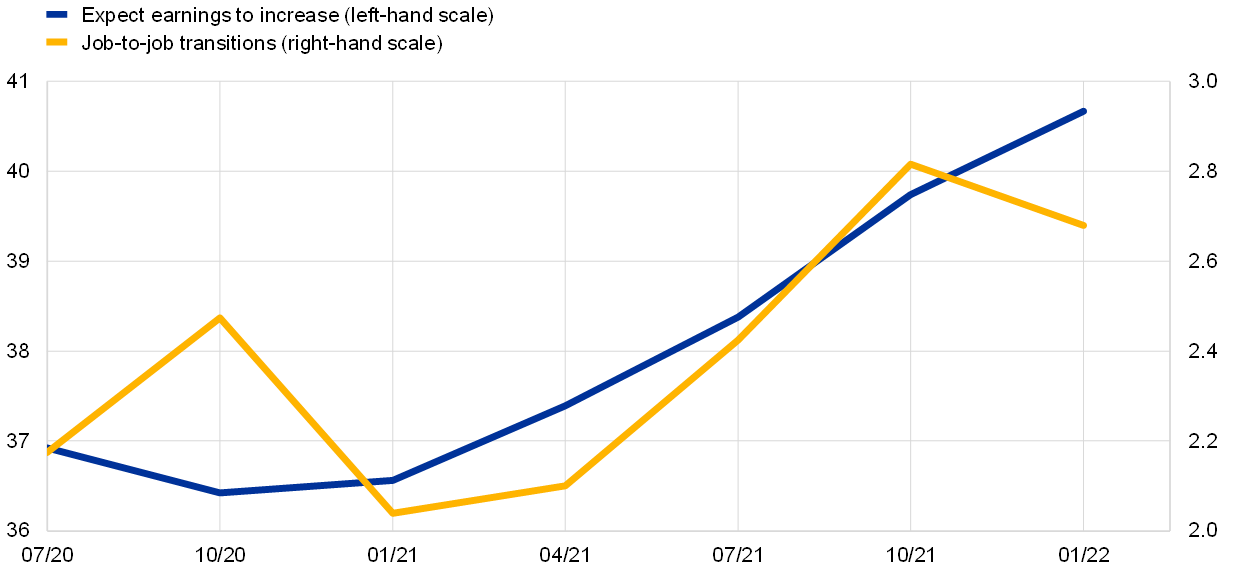
Source: CES.
Notes: Job-to-job transitions is the share of respondents who were in employment three months earlier and report a tenure of less than three months with their current employer. Earnings expectations are shown as the share of respondents who expect their net household earnings to increase in the next 12 months.
At the same time, workers do not perceive their working conditions to have worsened considerably during the pandemic. The CES includes questions on how respondents perceive skill match quality and job satisfaction, which allow information on job quality to be inferred (Chart D). In January 2022 less than 13% of respondents said that there was a low skill match in their current job and about 26% expressed low satisfaction with their jobs. Neither of the two indicators points to a significant worsening of job quality since the beginning of the pandemic, suggesting that the labour market recovery is not being driven by a surge in low quality jobs. Linking this information with the responses on job-to-job transitions suggests that workers who change jobs are more likely to report an increase in skill match and job satisfaction.
Chart D
Share of workers with low job satisfaction and low skill match
(percentages of respondents)

Source: CES.
Note: The share of employed respondents who report a low skill match in their current job is defined as those who select the lowest three values on a scale from 1 to 7, while low job satisfaction is defined as those reporting the lowest two values on a scale from 1 to 5.
Overall, the CES suggests positive dynamics in the labour market, while the pandemic continues to affect the pace of the recovery. During 2021 the number of workers in the labour force increased, accompanied by a decline in discouragement and a decrease in the unemployment rate. Labour supply has thus responded quickly to the strengthening of demand. In addition, more respondents changed jobs, revised up their earnings expectations and expected better labour market conditions. These developments suggest a dynamic labour market.
- More detail on the CES is available in “ECB Consumer Expectations Survey: an overview and first evaluation”, Occasional Paper Series, No 287, ECB, December 2021.
- The dataset covers six euro area countries: Belgium, Germany, Spain, France, Italy and the Netherlands.
- For a recent analysis of developments in the labour force using Eurostat data, see “Labour supply developments in the euro area during the COVID-19 pandemic”, Economic Bulletin, Issue 7, ECB, 2021.
- Owing to methodological changes during the pilot phase of the CES, the employment status of respondents in April and July 2020 and the ratio of discouraged workers in July and October 2020 are not fully comparable to the rest of the sample.
- See, for example, Broer, T., Kohlhas, A., Mitman, K. and Schlafmann, K., “Information and Wealth Heterogeneity in the Macroeconomy”, CEPR Discussion Paper, No 15934, 2021. For individual job loss expectations, see, for example, Stephens, M. “Job loss expectations, realizations, and household consumption behavior”, Review of Economics and Statistics, Vol. 86, No 1, 2004, pp. 253-269.
- See, for example, Karahan, F., Michaels, R., Pugsley, B., Şahin, A. and Schuh, R. “Do Job-to-Job Transitions Drive Wage Fluctuations Over the Business Cycle?”, American Economic Review: Papers & Proceedings, Vol. 107, No 5, 2017, pp. 353–357; and Moscarini, G. and Postel-Vinay, F. “The Relative Power of Employment-to-Employment Reallocation and Unemployment Exits in Predicting Wage Growth”, American Economic Review: Papers & Proceedings, Vol. 107, No 5, 2017, pp. 364–368.