
Cross-sectoral dispersion in firms’ earnings expectations during the COVID-19 crisis
Published as part of the ECB Economic Bulletin, Issue 5/2021.
While the recovery in equity prices over the last year has been underpinned by improvements in aggregate short-term earnings expectations (Chart A), developments in the latter have varied greatly across sectors (Chart B). Compared with the situation before the pandemic, expected earnings remain persistently subdued in sectors such as travel and tourism, while growing rapidly in the technology, utilities and non-bank financial services sectors. As a result, current earnings expectations are in line with what is called a cross-sectoral K-shaped recovery (where the paths of the best and worst-performing sectors resemble the two arms of the letter “K”). Similar dispersion holds true across countries (see also Box 3 of this issue of the Economic Bulletin and the May 2021 Financial Stability Review), in line with the idea that some countries are economically more dependent on particular sectors than other countries.
Chart A
Euro area broad stock market performance and earnings expectations
(left-hand scale: index; right-hand scale: EUR)
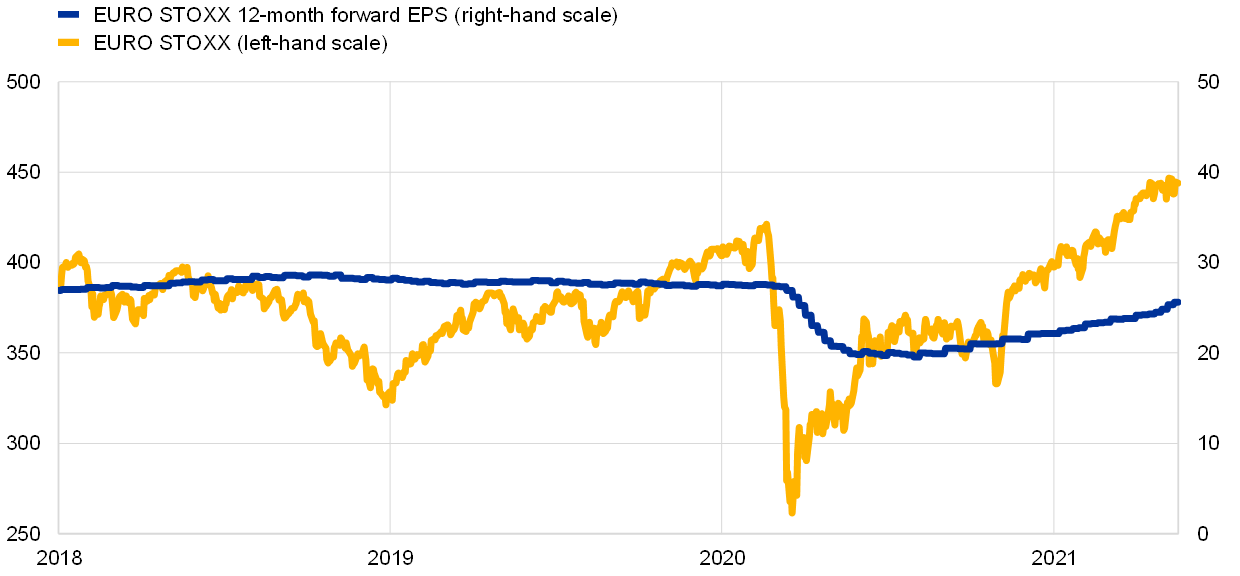
Sources: Refinitiv, IBES and ECB calculations.
Notes: EPS stands for earnings per share. This chart shows the price and the earnings forecast 12 months ahead for the Dow Jones EURO STOXX broad index. The latest observations are for 17 May 2021.
Chart B
Earnings expectations for the best and worst-performing euro area sectors
(normalised index)

Sources: Refinitiv, IBES and ECB calculations.
Notes: This chart shows the earnings forecasts 12 months ahead for the three best-performing and the three worst-performing sectors. Data are at daily frequency and normalised to 100 as at 1 January 2018. The three best-performing sectors are the technology, utilities and non-bank financial services sectors. The three worst-performing sectors are travel, banking and grocery stores. The latest observations are for 17 May 2021.
This box measures the heterogeneity of analysts’ daily 12-month ahead earnings per share (EPS) forecasts for listed firms in 20 different sectors. As there is always a possibility for analysts to revise their estimates when new information becomes available, earnings forecasts are especially useful for gauging the immediate effects of the COVID-19 crisis on cross-sectoral dispersion.[1]
To capture the impact of the COVID-19 crisis on cross-sectoral dispersion in earnings expectations, the Gini coefficient is used. For a variable of interest (here: EPS forecasts) sampled across individuals (here: sectors), the Gini coefficient provides a scaled average of the absolute differences in the variable’s outcome across all pairs of individuals.[2] As such, it is an indicator of relative dispersion ranging from 0 to 1, where an increase in the Gini coefficient reflects an increase in dispersion.
The Gini coefficient has several advantages over simpler measures of dispersion such as standard deviation. First, it represents the degree of inequality in any statistical distribution. Second, the Gini coefficient judges the dispersion through a relatively easy-to-interpret summary metric: it reaches its maximum value of 1 when earnings expectations are positive for one sector and zero for all others, and it is 0 when all sectors contribute equally to the sum of expected earnings. In addition, in this box we calculate the Gini coefficient using earnings expectations data based on levels instead of growth rates, so as to assess whether changes in cross-sectoral dispersion are structural.[3]
The data show that, according to this measure, cross-sectoral dispersion in earnings expectations has persistently risen since the onset of the COVID-19 crisis, in contrast to past crises where the impact was more homogeneous across sectors (Chart C). While the Gini coefficient dropped after the collapse of Lehman Brothers during the Global Financial Crisis – reflecting a broad-based downward revision of the earnings outlook across sectors – it has jumped upwards since the start of the COVID-19 crisis. Together, these observations signal a structural shift in expectations during the current pandemic: the market expects some sectors to persistently underperform others over the coming year.
Chart C
Gini coefficient of earnings expectations 12 months ahead for firms in the euro area during (i) the Global Financial Crisis and (ii) the COVID-19 crisis
(index)

Sources: Refinitiv, IBES and ECB calculations.
Notes: The blue line shows the Gini coefficient based on earnings expectations 12 months ahead across 20 sectors. The yellow dashed line indicates the high for the relevant period. The vertical lines mark the date of Lehman Brothers’ bankruptcy (left-hand panel) and the outbreak of the COVID-19 crisis (right-hand panel). The latest observation is for 17 May 2021.
The increase in social distancing and the associated decline in mobility due to lockdown measures help to explain why the dispersion in earnings expectations has risen during the COVID-19 crisis. The reason is that mobility restrictions affect economic activity differently across sectors. The correlation between the stringency of lockdowns and the cross-sectoral dispersion in earnings expectations is estimated by means of local projections using daily data from early January 2020 to late April 2021.[4] As an indicator of lockdown stringency, the Goldman Sachs Effective Lockdown Index (ELI) is used. The ELI accounts for a combination of official government restrictions and actual mobility data.
This empirical analysis shows that cross-sectoral dispersion in 12-month EPS forecasts has risen each time lockdown measures have further restricted mobility (Chart D). Up until December 2020, imposing a lockdown such that the ELI would rise by 50 points (which is half of its maximum range of 0 to 100 and corresponds to the change observed in March 2020) increased the Gini coefficient by 3 percentage points after 20 working days.
At the same time, the implementation of vaccination campaigns has been a game changer: stringent lockdowns have added far less to the dispersion metric since vaccination started in late 2020 (Chart D).[5] Since mid-December 2020, when vaccination started in the euro area, the effects of restrictive lockdown measures on cross-sectoral dispersion have decreased by more than two-thirds.[6] This result may reflect the conviction that the latest lockdowns are, to some extent, expected to be the last, raising the likelihood of a gradual reopening of the economy.
Chart D
Cross-sectoral dispersion in euro area EPS forecasts and estimated impact of lockdowns before and after the start of the vaccine rollout
(left-hand panel: index; right-hand panel: percentages)

Sources: Refinitiv, IBES, Goldman Sachs and ECB calculations.
Notes: This chart shows the impact of lockdowns (i.e. a 50 point increase in the lockdown stringency index) on the Gini coefficient of sectoral 12-month EPS forecasts over time (up to 20 days after the assumed lockdown takes place). The effects are estimated using local projections. The shaded areas represent 90% confidence intervals using Newey-West standard errors robust to heteroscedasticity and autocorrelation. The latest observation is for 26 April 2021.
- Several studies analyse cross-sectoral heterogeneity using backward-looking indicators such as reported profitability. See, for example, Akcigit, U. et al., “Rising Corporate Market Power: Emerging Policy Issues”, Staff Discussion Notes, No 2021/001, IMF, 2021.
- This is mathematically equivalent to the Gini coefficient’s standard formulation based on the Lorenz curve. The Gini coefficient has been used in this way in various different fields of science, including finance. See, for example, Bongaerts, D., Cremers, K.J.M. and Goetzmann, W.N., “Tiebreaker: Certification and Multiple Credit Ratings”, The Journal of Finance, Vol. 67(1), 2012, pp. 113-152; Jaremski, M., “The (dis)advantages of clearinghouses before the Fed”, Journal of Financial Economics, Vol. 127(3), 2018, pp. 435-458; and Hautsch, N. and Horvath, A., “How effective are trading pauses?”, Journal of Financial Economics, Vol. 131(2), 2019, pp. 378-403.
- Basing the Gini coefficient on levels also has the advantage of excluding base level effects. This box does not report the Gini coefficient using data on longer-term earnings expectations, as there are no daily data at the sectoral level. Moreover, this box investigates the most immediate effects of the COVID-19 crisis on firms’ expected performance, which are generally clearly reflected in revisions to shorter-term earnings expectations.
- The local projections are based on Jordà, Ò., “Estimation and Inference of Impulse Responses by Local Projections”, American Economic Review, Vol. 95(1), 2005, pp. 161-182. They estimate a series of regressions at each forecast horizon, up to 20 working days in the future. The regressions control for stock market volatility. The regressions also control for broad stock market developments by including the change in the earnings expectations for the broad stock market at each forecast horizon. The impulse responses in the right-hand panel of Chart D are generated by plotting the estimated coefficients (multiplied by 50, so as to reflect a 50 index point increase in lockdown stringency) for the effects of lockdown stringency on cross-sectoral dispersion in earnings expectations.
- While the total number of newly imposed lockdowns is relatively small, the ELI is a continuous stringency index with 259 and 84 observations for the periods before and after the start of vaccination respectively. The mean value of the ELI is approximately 50 out of 100 during both periods. Econometrically, the estimated impact of imposing a lockdown is therefore derived from the continuous data series.
- The announcement of the start of the vaccine rollout in early November 2020 may also have had implications for the correlation between the stringency of lockdowns and the cross-sectoral dispersion in earnings expectations. Indeed, a separate robustness check shows that the impact of stringent lockdowns on cross-sectoral dispersion in earnings expectations is broadly similar when looking at the period as of early November 2020 rather than the period as of mid-December 2020.