
Understanding the impact of the COVID-19 pandemic through an import-adjusted breakdown of euro area aggregate demand
Published as part of the ECB Economic Bulletin, Issue 8/2020.
This box presents an alternative method for breaking down GDP, accounting for the fact that each demand component contains goods and services which are imported. The standard breakdown of GDP into domestic expenditure components and net exports enables an assessment to be made of the domestic versus foreign drivers of growth. Such a breakdown traditionally subtracts the contribution of total imports as a stand-alone aggregate from total exports to compute net exports. In reality, however, imports contribute to all individual components of GDP, i.e. also to changes in inventories and to domestic demand, and more so to investment than to private and government consumption. This standard national accounting practice therefore has a limitation in that it magnifies the purely domestic demand contribution to GDP growth while shrinking the influence of foreign factors on domestic economic activity.
With an import-adjusted GDP measure, imports are allocated to each expenditure component and deducted separately from it on the basis of its respective import intensity. This alternative method can shed light on two, otherwise hidden, propagation mechanisms at play during the coronavirus (COVID-19) shock. First, it takes account of the impact of direct and intermediate extra-euro area imports on domestic demand – which has also suffered from global lockdown measures – by considering actual import intensities at the component level. Second, it highlights the role of external factors in exports, which becomes more visible when only the share of extra-euro area imports associated with exports is netted out from total extra-euro area exports. This box presents evidence for the importance of import intensities in the decomposition of euro area economic growth dynamics during the pandemic. It then describes an extended analysis based on sectoral proxies to adjust for possible changes in import intensities across expenditure components in the pandemic period.
A breakdown of euro area GDP adjusted for extra-euro area import intensities[1] shows that the import content of domestic demand has been an important factor amplifying domestic demand dynamics in 2020. On the basis of the traditional national accounting definition of GDP, euro area domestic demand contributed 14.0 percentage points to the cumulated 15.0% decline in euro area output in the first half of 2020 and 11.3 percentage points to the 12.5% quarter-on-quarter increase in the third quarter of 2020 (see Chart A, panel a). An adjustment of expenditure components in 2020 for the import intensities prevailing in 2019 shows a more limited contribution to the economic losses in the first half of the year for the purely domestic demand component, and a larger contribution for exports (see Chart A, panel b). In the subsequent rebound, domestic demand surged less on this basis than according to the traditional breakdown. Overall, the comparison reveals that, owing to input-output linkages, the euro area economy has been more heavily exposed to external shocks during the pandemic than suggested by the traditional breakdown.[2] This is because, through global value chains, imports are intrinsically dependent on domestic production patterns. Moreover, external shocks can propagate and be magnified because of complementarities across sectors that may arise from the presence of input-output linkages.[3] The direct and intermediate import intensities of GDP components can be calculated on the basis of Eurostat’s annual input-output data[4] for the euro area, available for the period from 2005 to 2019. The resulting estimates show that the import intensity has been particularly high for exports and investment, somewhat lower for private consumption and particularly low for government consumption expenditure (see Chart B, panel a). It is also considerably higher for manufacturing than for services.
Chart A
Euro area real GDP growth and its components since the fourth quarter of 2019
(quarter-on-quarter percentage changes; percentage point contributions)

Sources: Eurostat and ECB calculations.
Notes: Panel a): the standard expenditure-based GDP breakdown method is the method used in national accounts data. Total extra-euro area imports are deducted from extra-euro area exports to calculate the net export contribution to GDP growth. Panel b): the import-adjusted GDP breakdown is calculated in three steps. First, the yearly import intensity for each expenditure component is calculated using Eurostat’s symmetric input-output product-by-product data for the euro area. Second, the import intensities are used as weights to estimate the true nominal extra-euro area import flows for total private consumption, government consumption, investment and exports. As the import share in changes in inventories cannot be calculated, an import share of 50% is assumed. Third, the estimated import flows are deducted separately from each expenditure component, both in nominal and real terms, and the import-adjusted contribution of each component to growth is computed. Note that total nominal import flows calculated from input-output data are not always consistent with total import flows from national accounts. This means that additional assumptions have to be made to calculate the final import-adjusted GDP decomposition.
It is likely that extra-euro area import intensities have changed during the pandemic. The import adjustment shown in Chart A, panel b is based on pre-crisis import intensities and the assumption that the import intensity of domestic demand is unaffected by the pandemic. However, while they have been relatively stable in normal times, import intensities tend to change more markedly in recessions (see Chart B, panel a).[5] A gradual upward trend in normal times would reflect increased globalisation, extended global value chains and international specialisation leading to trade growth rates exceeding growth of domestic demand.[6]
Chart B
Import intensities across GDP expenditure components and main sectors
(percentages; percentage point contributions)
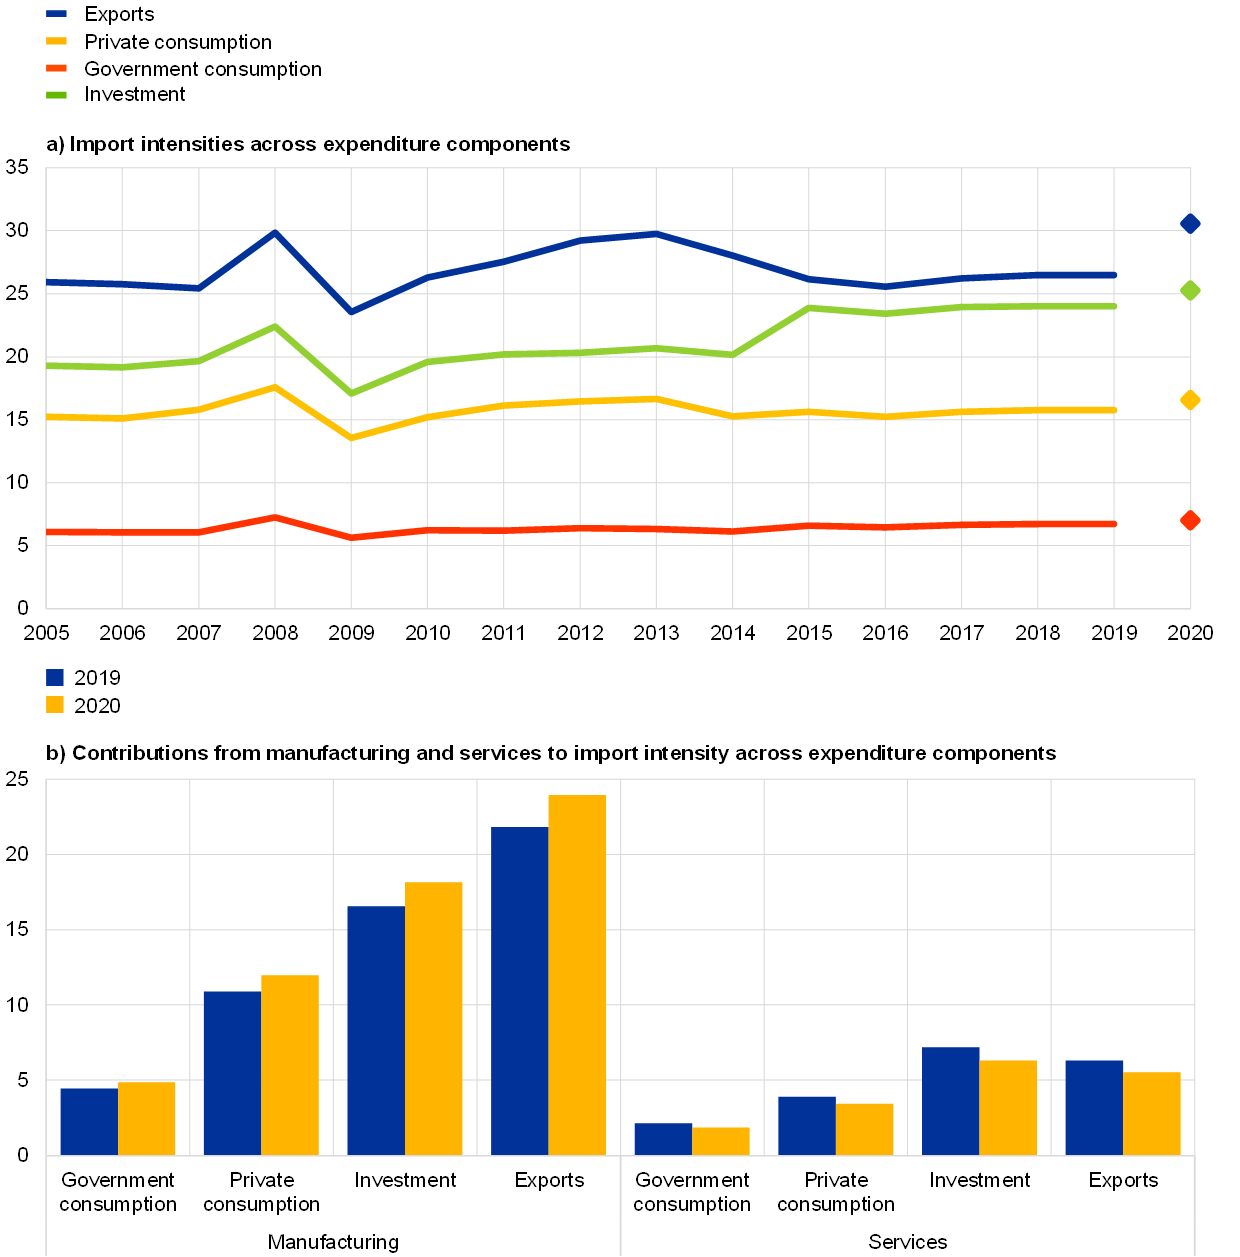
Sources: Eurostat and ECB calculations.
Notes: In panel a) import intensities are expressed as the sum of direct and intermediate intensities. Import intensities for 2020, marked with diamonds, are an approximation, calculated on the basis of the change in the ratio of imports to value added across expenditure components, as observed in actual trade and value added data for the first three quarters of 2020. The values for 2020 in panel b) are proxies of the contributions of the manufacturing and services sectors, respectively, to the overall import intensities across expenditure components. Data for 2020 are based on the average for the first three quarters of 2020. The size of and change in the contribution of the agricultural and construction sectors to import intensities across expenditure components are significantly smaller and were omitted.
During the COVID-19 pandemic the extra-euro area import intensity of manufacturing appears to have increased somewhat, while that of services has fallen. As Eurostat’s input and output data are not yet available for 2020, we use instead the ratio of sector-level extra-euro area imports to value added in the main sectors as a proxy for the respective import intensities in order to evaluate the possible impact of the pandemic up to the third quarter of 2020.[7] Interestingly, these data show that, overall during the pandemic, i.e. including the third-quarter rebound, the manufacturing sector saw a pronounced loss in value added following the supply shock from economy-wide lockdowns, while the reduction in imports was smaller. This implies that import intensity rose in the manufacturing sector (see Chart B, panel b). For the services sector, by contrast, the overall loss in extra-euro area imports for the period exceeded the loss in value added, as tourism and travel[8] had a particularly adverse impact on imports. Since the manufacturing sector accounts for a much larger share than the services sector of the import content across all expenditure components, overall import intensities increased during the first three quarters of 2020. However, this possible rise in import content would not have a significant impact on the outcome of the import-adjusted GDP breakdown compared with that shown in Chart A, panel b.
To conclude, using import intensities to disentangle domestic and external contributions to euro area growth suggests that the external contribution in the first three quarters of 2020 was larger in absolute terms than suggested by the traditional breakdown, while the role of domestic demand was smaller. A proxy based on recent data capturing changes in the contributions from the manufacturing and services sectors during the pandemic suggests that import intensities could have risen in aggregate during the crisis. However, this change in import content would not have a significant impact on the import-adjusted breakdown.
- The import-adjusted GDP expenditure breakdown shows the importance of extra-euro area exports in the recovery from 2013, see “The importance of external and domestic stimuli for the economic upturn in the euro area”, Monthly Report, Deutsche Bundesbank, Frankfurt am Main, August 2017. The import-adjusted composition of demand also played a key role in trade dynamics during the global financial crisis, according to Bussière, M, Callegari, G., Ghironi, F., Sestieri, G. and Yamano, N., “Estimating Trade Elasticities: Demand Composition and the Trade Collapse of 2008-2009”, American Economic Journal, Vol. 5, No 3, pp. 118-151.
- This is consistent with earlier findings on the importance of global value chains for the performance of global trade during the pandemic, see the box entitled “The great trade collapse of 2020 and the amplification role of global value chains”, Economic Bulletin, Issue 5, ECB, 2020.
- See, for instance, Guerrieri, V., Lorenzoni, G., Straub, L. and Werning, I., “Macroeconomic Implications of COVID-19: Can Negative Supply Shocks Cause Demand Shortages?”, NBER Working Paper Series, No w26918, National Bureau of Economic Research, 2020; and Acemoğlu, D., Akcigit, U. and Kerr, W. “Networks and macroeconomic shocks”, VoxEU, 2016.
- Eurostat’s symmetric input-output product-by-product data for 2005-19 allow import intensity to be calculated both by demand component and by sector.
- See Bems, R., Johnson, R.C. and Yi, K.-M., “Demand Spillovers and the Collapse of Trade in the Global Recession”, IMF Working Papers, No WP/10/142, June 2010.
- See Kranendonk, H. and Verbruggen, J., “Decomposition of GDP Growth in Some European Countries and the United States”, De Economist, Vol. 156, No 3, Springer, 2008, pp. 295-306.
- More will be known on the evolution of import intensities when Eurostat’s input-output tables for 2020 are published, possibly in summer 2021.
- See the boxes entitled “Impact of the COVID-19 lockdown on trade in travel services”, Economic Bulletin, Issue 4, ECB, 2020, and “Developments in the tourism sector during the COVID-19 pandemic” in this issue of the Economic Bulletin.