
The predictive power of real M1 for real economic activity in the euro area
Published as part of the ECB Economic Bulletin, Issue 3/2019.
Real M1 growth in the euro area has been moderating in recent quarters, adding to concerns about the economic outlook given the robust relationship between the business cycle and narrow money. This box shows that the leading and pro-cyclical properties of real M1 for real GDP remain a robust stylised fact in the euro area. Moreover, there are indications that these properties reflect the predictive capacity of narrow money, beyond the influence of interest rates. At the current juncture, models exploiting the predictive power of real M1 suggest that the steady decline in real M1 growth from its most recent peak in mid-2017 points to very low risks of recession in the euro area up to the beginning of 2020.
The leading and pro-cyclical properties of real M1 with respect to real GDP in the euro area remain a robust stylised fact. These properties, which can be found for the relationship between real narrow money and real economic activity in both levels and growth rates, have been documented in various publications for earlier time periods.[1] An illustration of such properties can be derived from a visual examination of monthly data from January 1970 to February 2019 for annual growth in real M1, which is defined as the nominal narrow money aggregate M1 deflated by the HICP. Specifically, it is notable that this growth rate went well into negative territory for prolonged periods just before (or in coincidence with) all historical euro area recessions, as dated by the CEPR Euro Area Business Cycle Dating Committee (see Chart A).
Chart A
Real M1 annual growth and euro area recessions
(annual percentage changes)

Sources: CEPR, ECB.
Notes: Real M1 obtained by deflating nominal M1 with the HICP. Shaded areas delimit recessions as identified by the CEPR Euro Area Business Cycle Dating Committee.
Last observation: February 2019.
In terms of turning points in the levels of real M1 and real GDP, statistical indicators suggest that the lead and pro-cyclicality of peaks and troughs in real M1 in relation to peaks and troughs in real GDP represent a historical regularity. Indeed, concordance indices[2] calculated at different leads and lags indicate that turning points in real M1 tend to lead turning points in real GDP by four quarters, on average, and that, with that lead for narrow money, real M1 and real GDP are estimated to spend almost 90% of the time in the same business cycle phase (see Chart B). Moreover, the strong degree of synchronisation between turning points appears to have remained stable since the 1970s, including over more recent sub-periods.[3]
Chart B
Concordance indices between real GDP and real M1 at different leads and lags
(percentages, quarters)

Sources: CEPR, ECB.
Notes: Concordance indices at different leads and lags computed between binary series associated with expansions and recessions in real GDP and real M1 levels, derived from a quarterly data version of the standard Bry-Boschan classical cycle turning point algorithm. The horizontal axis reports the number of quarters at which real GDP turning points are shifted forward (positive values) or back (negative numbers) relative to turning points in real M1. Based on quarterly data up to the fourth quarter of 2018 and starting in the first quarters of 1970, 1980, 1990 and 1999, respectively.
Empirical evidence suggests that the predictive power of real M1 for real output in the euro area is not simply a reflection of information contained in the yield curve. Against the background of the ample evidence pointing to the leading properties of the slope of the yield curve for predicting recessions, it is natural to ask to what extent the leading and pro-cyclical properties of real M1 are driven by the pattern of the yield curve – and to what extent controlling for yield curve constellations would obviate narrow money as a predictor for economic activity. Historical data for the euro area suggests that the slope of the yield curve exhibits a positive co-movement with respect to real M1, with a lead of two quarters. In line with this historical regularity, concordance indices at different leads and lags indicate that turning points in the slope of the yield curve tend to lead turning points in real GDP by six quarters, on average, and that, with that lead, the slope of the yield curve and real GDP are estimated to spend about 60% of the time in the same business cycle phase (see Chart C). This regularity reflects the fact that interest rates do indeed represent key variables in driving portfolio decisions by households and non-financial corporations. However, it does not necessarily imply that the predictive power of real M1 for real economic activity in general, and for recession risks in particular, is entirely driven by its relation to the yield curve. In fact, the concordance indices with respect to real GDP point to a stronger degree of co-movement with real M1 (with a one-year lead, as depicted in Chart B) than with the slope of the yield curve (with a one-and-a-half-year lead, as depicted in Chart C). Moreover, the relationship between real M1 and real GDP as measured by these indices appears more stable over sub-periods than that between the slope of the yield curve and real GDP.
Chart C
Concordance indices between real GDP and the slope of the yield curve at different leads and lags
(percentages, quarters)

Sources: CEPR, ECB.
Notes: Concordance indices at different leads and lags computed between binary series associated with expansions and recessions in real GDP levels and the slope of the yield curve, derived from a quarterly data version of the standard Bry-Boschan classical cycle turning point algorithm. The horizontal axis reports the number of quarters at which real GDP turning points are shifted forward (positive values) or back (negative numbers) relative to turning points in the slope of the yield curve. Based on quarterly data up to the fourth quarter of 2018 and starting in the first quarters of 1970, 1980, 1990 and 1999, respectively.
Turning to the current juncture, a formal econometric analysis based on probit models exploiting the predictive power of real M1 does not point to significant recessionary risks in the euro area for 2019 and early 2020. On the basis of data since 1970, the probability of a contraction in euro area real GDP derived from a probit model based on real M1 (lagged by 12 months) increased sharply before all previous euro area recessions (see Chart D), providing strong evidence of the usefulness of narrow money in predicting recessions in the euro area. Forecasts based on this model point to recession risks increasing slightly in 2019, from about 1% in January 2019 to between 5% and 7% in the second half of 2019 before falling to below 5% in February 2020, that is to say remaining very low (blue line). Controlling for the slope of the yield curve changes results only marginally (yellow line). Overall, the current level of real M1 growth is still comfortably above the zone that would be associated with risks of a recession in the near future.[4]
Chart D
Euro area recession probabilities based on probit models with lagged real M1
(percentages)
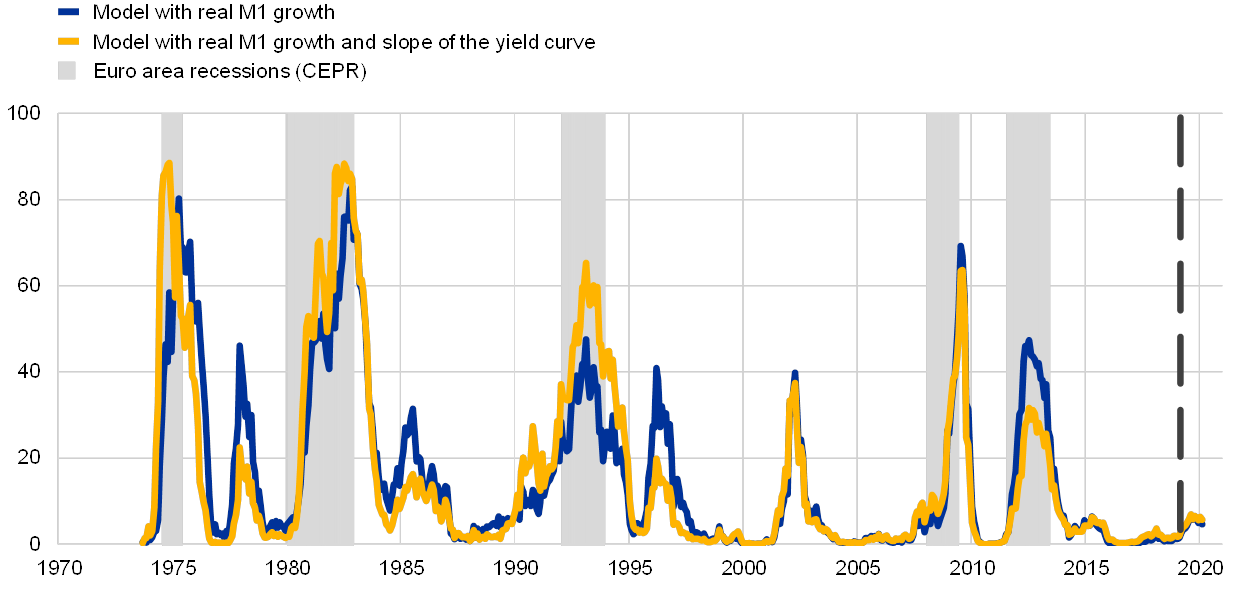
Sources: CEPR, ECB.
Notes: Probit models estimated using monthly data up to February 2019, with the vertical dashed line marking the start of forecasts for the period from March 2019 to February 2020. Shaded areas delimit recessions as identified by the CEPR Euro Area Business Cycle Dating Committee.
- See for example Brand, C., Reimers, H.-E. and Seitz, F., “Forecasting real GDP: what role for narrow money?”, Background studies for the ECB's evaluation of its monetary policy strategy, ECB, 2003, pp. 302-333; the box entitled “The informational content of real M1 growth for real GDP growth in the euro area”, Monthly Bulletin, ECB, October 2008; and the box entitled “Stylised facts of money and credit over the business cycle”, Monthly Bulletin, ECB, October 2013.
- Concordance indices, proposed by Harding, D. and Pagan, A. “Dissecting the cycle: a methodological investigation”, Journal of Monetary Economics, Vol 49, No 2, 2002, pp. 365-381, capture the percentage of time during which two binary time series (derived on the basis of a turning point identification algorithm such as the standard Bry-Boschan algorithm for classical cycles) are in the same phase.
- Note that since the most recent turning points (troughs) for real GDP and real M1 are located in the first quarter of 2013 and the second quarter of 2011, respectively, these concordance indices are identical if data from 2014 onwards are excluded. At the same time, results are very similar if only data up to 2006, i.e. covering the pre-crisis period, are used.
- Note that, while the most recent peak in real M1 annual growth in mid-2017 may have, to some extent, been influenced by special factors, including cash pooling effects and the Eurosystem’s asset purchase programme, what matters for the assessment of the recessionary risks are turning points in the level of real M1 rather than those in the annual growth of real M1. Since real M1 annual growth was 5.1% in February 2019, it is far from diving into negative territory.