
Investment in intangible assets in the euro area
Published as part of the ECB Economic Bulletin, Issue 7/2018.
Investment in intangible assets enables productivity gains. Intangible assets[1] are non‐monetary assets without physical or financial substance. They encompass a broad range of highly heterogeneous assets, including human capital, innovative products, brands, patents, software, consumer relationships, databases and distribution systems. Some of these assets enable firms to obtain productivity gains and efficiencies from new technologies and, as such, play a strategic role in a firm’s value creation. This box reviews the characteristics of intangibles and looks at a number of implications of their increasing importance.
Investment in intangible assets has increased in importance in the euro area, both in absolute terms and relative to tangible assets, with several factors contributing to that development. In euro area countries and other advanced economies, investment in intangibles has grown strongly in recent decades. Over the last 20 years, growth in intellectual property products – a group of intangible assets included in the national accounts[2] – has outpaced growth in tangible investment in the euro area (see Chart A). Investment in those products has also made a significant contribution to annual growth in euro area non-construction investment over the last two decades (see Chart B). The fact that the growth rate of intangibles is higher than that of tangibles is being driven by factors such as the increase in global competition, the sectoral shift from industry to services, the expansion of the digital economy, changing international specialisations in the area of production, new business models (e.g. for tax optimisation purposes) and general technological advances.
Chart A
Intangible investment as a percentage of total investment
(percentages)

Sources: Eurostat and ECB calculations.
Notes: Here, “intangible investment” refers to intellectual property products included in the national accounts. Volatility in Irish and Dutch data, which is mainly due to intellectual property-related transactions conducted by large multinational companies, makes a significant contribution to fluctuations in euro area data.
Chart B
Breakdown of growth in euro area non-construction investment
(annual percentage changes and percentage points)

Sources: Eurostat and ECB calculations.
Note: Data for Belgium and Cyprus are not available; data for Ireland and the Netherlands have been excluded on account of their volatility.
The specific nature of intangible assets makes them less easy to use as collateral, which may result in suboptimal investment. Intangible assets share some characteristics with tangible assets. For example, both are costly to acquire, but help to create future profits, and entail some risk-taking. However, intangible assets also have a number of specific characteristics that distinguish them from tangible assets,[3] with their scalability or non-rival nature, for instance, meaning that the benefits they provide to individual users are not dependent on the total number of users. At the same time, some intangibles have little market value and the cost of producing them is almost entirely a sunk cost, which makes them hard to trade,[4] more likely to be firm-specific, and associated with particularly high risks for firms undertaking such investment. Finally, they are productivity-enhancing, they are often more efficient when combined with other assets (e.g. training which helps workers to use software and computers more efficiently), and they tend to generate positive spillovers and benefits for people other than those developing them (i.e. they are non-excludable). Such characteristics make them less easy to use as collateral and may therefore mean that they are more reliant on internal financing (i.e. savings) than physical capital.[5] Overall, those features could lead firms to underinvest in such assets.[6]
Analysis based on microdata for listed companies shows that intangible assets can explain part of the gap between firms’ investment in tangible assets and Tobin’s Q.[7] Since the financial crisis, euro area firms’ investment in tangible assets has been weaker than one would expect on the basis of Tobin’s Q (see Chart C, panel a). This may indicate either underinvestment or overvaluation in equity markets. Two recent publications have shown that intangible assets are able to explain some of that gap in the United States.[8] Regression analysis conducted for the euro area shows that including intangible assets that are not capitalised (i.e. not included in the balance sheet as assets) in both investment and Tobin’s Q[9] reduces the size of the gap between the two (see Chart C, panel b). The sensitivity of investment to Tobin’s Q also increases, albeit in all cases Tobin’s Q explains only one-third of total variation in investment.
Chart C
Investment and Tobin’s Q
(median values)

Source: Worldscope (listed euro area firms).
Notes: Investment in tangible assets is defined as expenditure on property, plant and equipment over tangible fixed assets in the previous period. Tobin’s Q is defined as the firm’s market value plus total debt at book value minus cash and short-term investments over total assets at book value. Investment in intangible assets is defined as R&D costs plus 30% of sales, general and administrative expenses. In the lower panel, investment in tangible and intangible assets and Tobin’s Q both have as a denominator tangible fixed assets at book value plus capitalised R&D costs and 30% of sales, general and administrative expenses, using the perpetual inventory method and the depreciation rates that were used by Peters and Taylor[10].
The specific nature of intangible assets poses challenges as regards the measurement of activity, profits and capital stock, as well as the distribution of productivity across firms.[11] Measurement issues relating to activity stem from the fact that such assets are generally regarded as firm-specific intermediate consumption rather than investment in firms’ balance sheets, and they remain underreported in the national accounts to some extent.[12] Although the percentage of intangible assets that are reported in firms’ annual accounts is gradually increasing, particularly in the service sector (see Chart D), the underreporting of intangible assets could mean that real output is also being underreported. Moreover, the classification of intangibles as expenses to be deducted from earnings – as opposed to assets – is weighing on profits. As regards measurement of capital stock, while estimates of depreciation rates are associated with considerable uncertainty, the increasing share of intangible assets presumably implies higher overall depreciation rates. As a result, the amount of investment that is required to offset the consumption of capital and keep the capital stock at a constant level is rising. At the same time, it is possible that the capital stock remains underestimated owing to insufficient incorporation of intangible investment in the national accounts (see also the section on capital in the article on potential growth in the post-crisis period in this issue of the Economic Bulletin), which is particularly important when the contribution that capital makes to euro area potential output increases relative to that made by labour as labour force constraints grow. Also, a slowdown in intangible capital services growth could manifest itself in the data as a slowdown in total factor productivity growth. As regards the dispersion of productivity, intangible-rich firms appear to be scaling up investment dramatically, contributing to a widening gap between leading firms and those that are lagging behind.
Chart D
Intangible intensity
(median values)
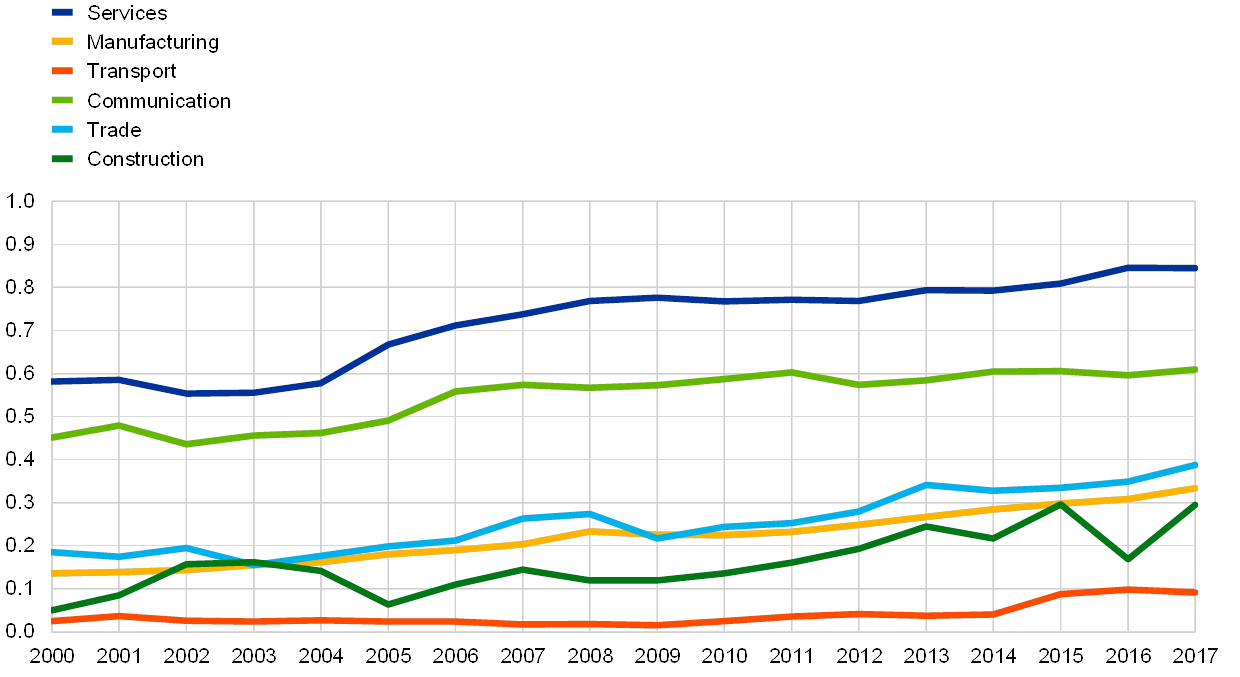
Source: Worldscope (listed euro area firms).
Note: This chart shows the ratio of intangible fixed assets to tangible and intangible fixed assets at book value.
Specific policies in a number of areas would be helpful in order to foster further investment in intangibles and enable stronger potential growth, notably as regards questions of ownership, tax treatment, property rights, competition and product regulation.
- More specifically, intangibles comprise investment relating to (i) computing and computerised information (such as software and databases), (ii) innovative properties and company competencies (such as scientific and non-scientific R&D, copyrights, designs and trademarks), and (iii) economic competencies (including brand equity, firm-specific human capital, networks linking people and institutions together, organisational know-how that increases efficiency, and aspects of advertising and marketing). These are sometimes referred to as “intellectual assets”, “knowledge assets” or “intellectual capital”.
- In 2014 the current methodological standards for national accounts, SNA 2008 and ESA 2010, began regarding spending on purchased and own-account R&D as investment. As a result, intangible investment now includes spending on ICT equipment and intellectual property products. ESA 2010 defines intellectual property products as knowledge derived from R&D, investigations or innovation which is restricted by law or other means of protection in terms of its use. Intangible assets such as human capital, consumer relationships and distribution systems are not covered by the national accounts.
- For more details, see Haskel, J. and Westlake, S., Capitalism without Capital – The Rise of the Intangible Economy, Princeton University Press, 2017. See also the appendix entitled “Characteristics of intangibles per asset type” in European Commission, “Investment in the EU Member States: An Analysis of Drivers and Barriers”, European Economy Institutional Papers, No 062, October 2017.
- In some cases, the value of an intangible asset cannot be determined before it has generated value (i.e. there is low ex ante verifiability).
- See Falato, A., Kadyrzhanova, D. and Sim, J.W., “Rising intangible capital, shrinking debt capacity, and the US corporate savings glut”, FEDS Working Paper Series, No 2013-67, Federal Reserve System, 2013.
- On the other hand, the potential to generate economies of scale that enhance market power provides incentives to invest in intangibles.
- Tobin’s Q is the ratio of the market value of a firm’s assets to their replacement value. If Tobin’s Q is greater than 1.0, this may suggest that the market value reflects some unmeasured or unrecorded assets held by the firm. High values for Tobin’s Q may encourage firms to invest more in capital assets because their value exceeds the price they paid for them, and the opposite is true where Tobin’s Q is lower than 1.0.
- See Peters, R.H. and Taylor, L.A., “Intangible capital and the investment-q relation”, Journal of Financial Economics, Vol. 123, 2017, pp. 251-272, and Crouzet, N. and Eberly, J., “Understanding Weak Capital Investment: the Role of Market Concentration and Intangibles”, paper prepared for the Jackson Hole Economic Policy Symposium, 2018.
- See Peters, R.H. and Taylor, L.A., op. cit., for details.
- ibid.
- See also European Commission, “Unlocking investment in intangible assets in Europe”, in Quarterly Report on the Euro Area, Vol. 16(1), 2017, pp. 23-35.
- For example, national accounts do not cover human capital, knowledge contained in databases, organisational capital or brands.