
Making sense of consumers’ inflation perceptions and expectations – the role of (un)certainty
1 Introduction
Published as part of the ECB Economic Bulletin, Issue 2/2021.
Understanding households’ inflation expectations is important for monetary policymakers
Inflation expectations play a key role in the monetary transmission mechanism. Other things being equal, when economic agents anticipate that inflation will increase, they perceive the real interest rate to fall. As a result, they spend more and save less to optimise their consumption and investment over a long horizon. Inflation expectations also play an important role in the wage and price-setting process and are thus an important determinant of future inflation. Therefore, understanding the nature of economic agents’ inflation expectations and how they are formed is crucial for monetary policymakers.[1]
This article presents and analyses data on euro area consumers’ quantitative inflation perceptions and expectations
This article analyses consumers’ inflation expectations using data available from the European Commission Consumer Survey (ECCS). There are several ways of measuring inflation expectations: they can be derived from financial market instruments, surveys of professional forecasters and business or household surveys. This article focuses on consumer inflation perceptions and expectations taken from the harmonised ECCS.[2] These data go back to 1985. However, up to 2004 the data only provide qualitative information on respondents’ perceptions and expectations on the direction and speed of price changes. Quantitative data on the magnitude of inflation were collected systematically in the ECCS from 2004 onwards.[3] This analysis helps address some of the more puzzling stylised facts of these inflation expectations, namely that: (a) the average perception/expectation has tended to be systematically above, although co-moving with, actual inflation; (b) there is an apparent negative correlation between inflation expectations and economic sentiment; (c) there is substantial heterogeneity both across countries and across individuals in terms of the levels of inflation expectations.
Inflation perceptions and expectations are linked to sociodemographic characteristics and to economic sentiment
Some of the stylised facts of consumer inflation expectations can be explained by sociodemographic characteristics and economic sentiment. Our analysis confirms previous findings in the literature that consumers are likely to have higher inflation perceptions and expectations if they are younger, female, have lower levels of formal education and belong to lower income groups.[4] Furthermore, we confirm that consumers that report being in a better financial situation and who have positive expectations about the economy as a whole are associated with lower inflation expectations, and that this also holds when controlling for sociodemographic factors.[5]
We also offer explanations for both the bias in quantitative inflation expectations vis-à-vis actual inflation and their negative relationship with economic sentiment. The bias seems to be related to the fact that agents who are more uncertain typically report their inflation expectations using round figures (in multiples of five). Furthermore, those who have a negative attitude about the economy as a whole also tend to be more uncertain about the inflation outlook and to report higher inflation expectations. This explains why reported inflation expectations might increase in periods of economic uncertainty.
In exploring these issues, this article is structured as follows. Section 2 provides an overview of aggregate euro area consumers’ inflation perceptions and expectations. Section 3 describes the framework for looking at inflation expectations through the lens of uncertainty. Section 4 examines the impact of specific sociodemographic characteristics and economic sentiment variables on the likelihood that individuals are uncertain about inflation and thus report rounded expectations. Section 5 discusses how the (un)certainty framework helps explain reported inflation expectations, and Section 6 concludes.
2 The nature of consumers’ inflation expectations
Consumers’ qualitative inflation perceptions and expectations broadly co-move with actual inflation, but there are some noteworthy divergences
Consumers’ qualitative inflation perceptions and expectations have tended to broadly co-move with actual inflation. The qualitative responses to the questions on inflation perceptions and expectations are summarised using a balance statistic.[6] The broad upswings and downswings in inflation and their turning points are relatively well matched by the balance statistics (Chart 1). The most noticeable divergence is in consumers’ inflation perceptions following the introduction of the euro notes and coins. More recently, in March and April 2020, as the first wave of the coronavirus (COVID-19) pandemic and related lockdowns impacted European economies, there was an unprecedented divergence between consumers’ inflation perceptions and their expectations, with the former falling, but the latter rising (Box 1). However, a significant drawback of these qualitative measures is that there is no direct way of mapping these onto quantitative perceptions and expectations.
Chart 1
Changes in euro area consumers’ qualitative inflation perceptions and expectations and actual HICP inflation
(left-hand scale: balance statistics; right-hand scale: HICP inflation as percentages)
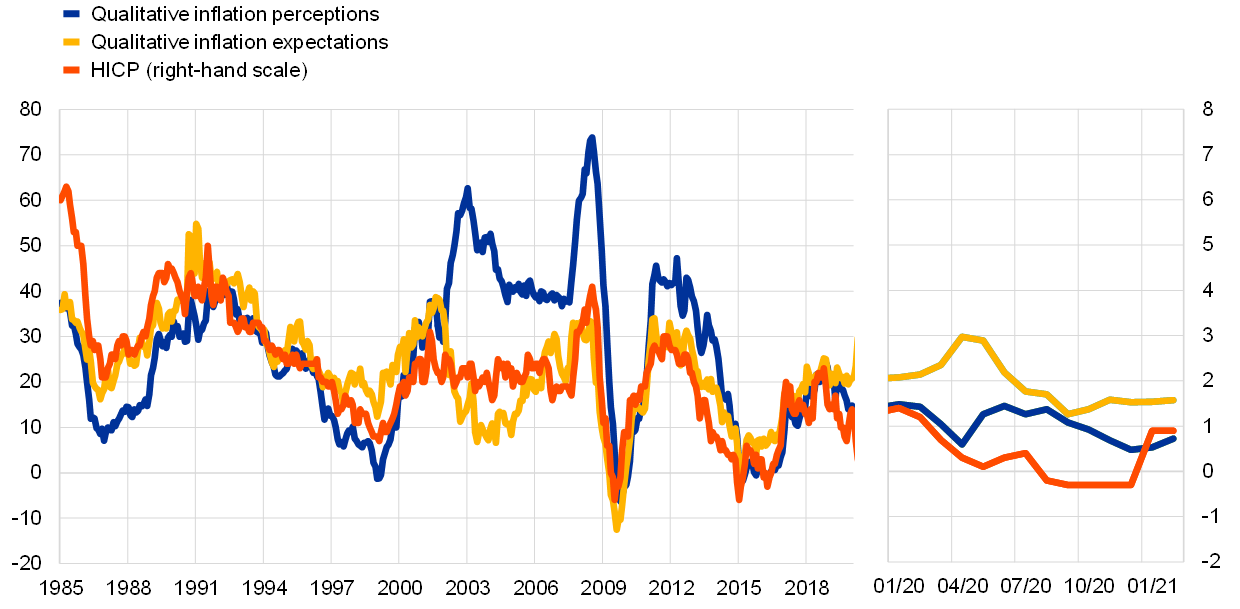
Sources: European Commission DG-ECFIN and Eurostat.
Note: The latest observations are for February 2021.
Average quantified inflation perceptions and expectations have been significantly higher than actual inflation
When asked to quantify their inflation perceptions and expectations, consumers, on average, tend to report significantly higher figures than actual inflation. Chart 2 presents the quantitative inflation perceptions and expectations reported by euro area consumers in the ECCS. For perceptions, the mean since 2004, at 8.7%, is substantially above the average HICP inflation over the same period (1.5%).[7] The lower quartile (i.e. the 25th percentile) averaged 3.6%, which is also substantially above actual inflation. While the degree of over-quantification is lower for expectations, it is still substantial. The mean since 2004 has been 5.7% (3.8% for the median). The lower quartile has averaged 2.0%, which indicates that approximately 75% of consumers reported inflation expectations higher than 2%.
Chart 2
Changes in euro area consumers’ quantitative inflation perceptions and expectations and different measures of inflation
(percentages)

Sources: European Commission DG-ECFIN and Eurostat.
Notes: The grey shading represents the inter-quartile range (i.e. the range from the first to the third quartile) of consumers’ quantitative inflation perceptions and expectations. FROOPP refers to “frequent out-of-pocket purchases”. The latest observations are for February 2021 (HICP and HICP food), January 2021 (HICP FROOPP) and the fourth quarter of 2020 (perceptions and expectations).
The correlation with actual inflation has tended to be slightly lagging for perceptions and broadly contemporaneous for expectations
The peak correlation with actual inflation has tended to be slightly lagging for inflation perceptions and broadly contemporaneous for inflation expectations. While this should be the case for perceptions, in the case of expectations, if consumers were able to anticipate inflation, one would expect to see the peak correlation with some lead (i.e. the peak correlation of expectations would be with inflation some months ahead). Table 1 shows that the contemporaneous correlation of quantitative expectations with different measures of HICP inflation over the period 2004-2020 is somewhat higher than for quantitative perceptions, while the reverse holds for the qualitative figures. Overall, however, no single expectation or perception measure correlates more than the others with actual inflation across all HICP measures and time periods. Over the most recent five-year period (the figures in brackets in Table 1), the correlation of the quantitative estimates with actual inflation is relatively low, except for food price inflation. This reflects in part a structural break in the data for Germany in May 2019 (owing to a change to the survey mode – see footnote 16), as well as the impact of the coronavirus pandemic in 2020 (Box 1).
Table 1
The contemporaneous correlation of consumers’ qualitative and quantitative inflation perceptions and expectations with various measures of inflation
(correlation coefficients)

Source: ECB staff calculations.
Notes: Contemporaneous correlation coefficients over the period 2004-2020. Numbers in brackets denote the correlation over the five-year period 2016-2020. FROOPP refers to “frequent out-of-pocket purchases”.
3 Looking at consumers’ inflation expectations through the lens of uncertainty
Rounding is a practicable measure of uncertainty
The apparent rounding observed in consumers’ quantitative inflation expectations points to uncertainty in reported inflation expectations. A considerable share of euro area consumers reports their quantitative expectations (and perceptions) using round numbers (most notably multiples of 5 and 10), while other consumers report to single digits or even to decimals. Chart 3 shows noticeable peaks at 0%, 5%, 10%, 15% and 20%, with a smaller distribution of respondents reporting to single digits. The modal responses of this latter group are around 2%-3% and thus not as biased as the aggregate numbers.[8] According to communications and linguistics theory, round numbers –typically multiples of five or of ten, depending on the context – are frequently used to convey that a quantitative expression should be interpreted as imprecise. We use the “round numbers suggest round interpretations” principle to identify the existence of an uncertainty channel which may influence reported inflation expectations.[9]
Chart 3
Distribution of responses (2004-2020)
Histogram of responses from -10% to +50%
(y-axis: frequency of response as percentages)

Sources: European Commission DG-ECFIN and ECB staff calculations.
Note: Histogram constructed at integer level.
The uncertainty framework is flexible enough to accommodate different periods of inflation
The uncertainty framework is flexible enough to help provide an understanding of average inflation expectations over the period 2004-2020, as well as in specific periods when inflation has been relatively high and relatively low respectively. For instance, the left panel of Chart 4 shows the distribution of quantitative inflation expectations in July 2008 (when overall HICP inflation was 4.1%). At this time, there were noticeable peaks at multiples of 10 as high as 50%, while the share of respondents reporting 0% inflation was relatively low. Among those who reported to single digits or even more precisely, the modal answer was 3%-4%. One year later, in July 2009, when overall HICP inflation had declined to -0.6%, the overall distribution shifted significantly to the left and there was a very strong peak in those reporting 0%, as well as some reporting negative values.
Chart 4
Distribution of responses at specific points in time
Histogram of responses from -10% to +50%
(percentages)
Sources: European Commission DG-ECFIN and ECB staff calculations.
The uncertainty framework (and in particular rounding behaviour) allows the share of uncertain consumers in every month to be calculated. The overall distribution of quantitative expectations is seen as a composite of three categories of reporting, namely in (i) digits and decimals, which are not multiples of five or ten, (ii) multiples of five, which are not multiples of ten, and (iii) multiples of ten. Those reporting in digits and decimals can, on average, be considered more “certain”, whereas those reporting in multiples of five and ten can be considered “uncertain”. The respective shares of each group in the overall survey population can be derived for each survey month.[10] On average, approximately one-third of respondents are more certain, while two-thirds are more uncertain (report to multiples of 5 or 10). These weights fluctuate but show notable increases in the share of uncertain respondents around the time of the global financial crisis and, more recently, since the onset of the coronavirus pandemic (Chart 5).
Chart 5
Increase in uncertainty during periods of economic distress
Share of uncertain respondents
(percentages)

Sources: European Commission DG-ECFIN and ECB staff calculations.
Notes: The chart shows the share of individuals that report in multiples of five and ten when asked about their inflation expectations. The latest observation is for September 2020.
Inflation estimates co-move strongly with actual inflation, suggesting consumers are knowledgeable about broad inflation regimes
While uncertain respondents may not precisely quantify inflation, they appear able to capture the broad developments in inflation. The upper panel of Chart 6 shows that the modal expectations of certain consumers are not too far off, and evolve broadly along with, actual inflation. The lower panel shows that, although the modal expectations of consumers who are more uncertain are substantially higher than those who are certain (shown on different axes), they co-move very closely.[11] This suggests that, while less certain consumers may find it hard to precisely articulate their inflation expectations, they are able to distinguish low and high inflation just as well as more certain consumers. Thus, even if their level of expected inflation is biased with respect to actual inflation, the changes over time correlate closely.
Chart 6
Modal inflation expectations of the “certain” group and the “uncertain” group
(percentages)

Sources: European Commission DG-ECFIN, Eurostat and ECB staff calculations.
Note: The latest observations are for September 2020 (certain and uncertain mode) and February 2021 (HICP).
Box 1
Consumers’ inflation expectations during the COVID-19 pandemic – applying the uncertainty framework
During the early months of the first wave of the coronavirus (COVID-19) outbreaks and lockdowns in Europe, there was an extraordinary movement in consumers’ inflation expectations, in particular compared with that for perceptions. In March and April 2020 consumers’ quantitative inflation expectations rose, while their quantitative perceptions fell slightly and, for the first time, mean expectations for future inflation were higher than perceptions of past inflation.[12] However, this divergence was short-lived, as by June the differential between perceptions and expectations had reverted to around the level observed in the months prior to the start of the pandemic.
It is challenging to reconcile these movements in inflation perceptions and expectations between February and June with actual inflation developments. While overall HICP inflation fell from 1.2% in February to 0.3% in April (in line with the movements in perceptions, but not those in expectations), it stood at 0.3% in June (neither explaining the reversion in perceptions nor that in expectations). The annual rate of change in the so-called FROOPP (frequent out-of-pocket purchases) index showed a broadly similar evolution, although it declined slightly more sharply than overall inflation between February and April (from 1.8% to 0.6%). It also stood at the same rate (0.6%) in June as in April, and thus cannot explain the reversion in perceptions or expectations. The annual rate of change in food prices rose from 2.1% in February to 3.6% in April, before easing over the following months. These developments in food price inflation could therefore potentially partly explain the changes in expectations but not the changes in perceptions.
Viewing consumers’ quantitative inflation perceptions and expectations through the lens of uncertainty can help explain their apparently puzzling evolution. Chart A shows the change in the share of consumers reporting specific inflation perceptions and expectations in April 2020. For perceptions, there was a noteworthy increase in the share reporting unchanged prices (i.e. zero inflation), which is largely in line with actual inflation, which fell close to zero. For expectations, there was a decline in the share of consumers reporting zero or digits from 1%-4%, with noticeable increases in those reporting multiples of five (in particular 10%, 15%, 20%, 25% and 30%). Thus, when viewed through the uncertainty lens and the use of rounded numbers, it is possible to rationalise the simultaneous decrease in perceptions (in line with actual inflation) and increase in expectations (an uncertainty shock).[13]
Chart A
Changes in inflation perceptions and expectations from March to April 2020
Changes in histogram of responses from -10% to +30%
(percentage points)

Sources: European Commission DG-ECFIN and ECB staff calculations.
Note: The chart shows the changes in the share of respondents for each answer from March to April 2020.
4 What determines whether individuals are (un)certain?
Sociodemographic and opinion characteristics can be shown to partially determine consumer (un)certainty
Whether a consumer is certain about price developments can depend on sociodemographic characteristics and economic sentiment. To analyse this, we look at the “probability that a consumer is certain” about inflation and try to explain this using a range of sociodemographic and economic sentiment variables.[14] The sociodemographic variables include characteristics, such as age, level of formal education, gender and income quartile. In addition, sentiment indicators are used, which take the form of expressed economic opinions on the expected personal financial and general economic situation, a qualitative inflation assessment about inflation in the next 12 months and opinions on unemployment development, as well as on the timing of purchases and savings. Selected results are displayed in Chart 7 and Chart 8. On average, and other things being equal, a higher income and higher level of formal education contribute positively to an individual’s estimated probability of being certain. Certainty increases further with age and if respondents are male. At the same time, respondents tend to be less certain if they are more negative about their personal finances, the general economic situation including unemployment and their ability to purchase and save.[15] These patterns hold robustly across most time periods and euro area countries in our sample.
Chart 7
Estimated probability that a consumer is certain about inflation expectations – sociodemographics
(percentages)

Sources: European Commission DG-ECFIN, Eurostat and ECB staff calculations.
Notes: The charts display the estimated probability that an individual is certain about inflation by subcategory of each variable, assuming modal values for all other variables. All estimated effects are statistically significant at the 99% confidence level.
Chart 8
Estimated probability that an individual is certain about inflation expectations– economic sentiment
(percentages)
Sources: European Commission DG-ECFIN, Eurostat and ECB staff calculations.
Notes: The charts display the estimated probability that an individual is certain by subcategory of each variable, assuming modal values for all other variables. All estimated effects are statistically significant at the 99% confidence level.
The correlation between uncertainty and inflation expectations holds across countries
The probability that an individual is certain about inflation expectations differs significantly across euro area countries. The upper panel of Chart 9 shows that those countries where consumers are estimated to be more certain also have a lower mean inflation expectation across the time periods. While there is also some correlation between the mean inflation expectation and the average rate of actual inflation (see the lower panel of Chart 9), it is much lower. This suggests that the certainty channel plays an important role in explaining the differences in reported inflation expectations across countries in our sample.[16] However, thus far, the analysis has simply identified sociodemographic characteristics and economic sentiment indicators that suggest whether consumers may be more or less uncertain about their inflation expectations. How much these factors contribute to reported inflation expectations is considered below.
Chart 9
Negative relationship between certainty and inflation expectations across countries
(x-axis: estimated probability that a consumer is certain about inflation for a modal individual in each country; y-axis: mean inflation expectation (January 2004 – September 2020))
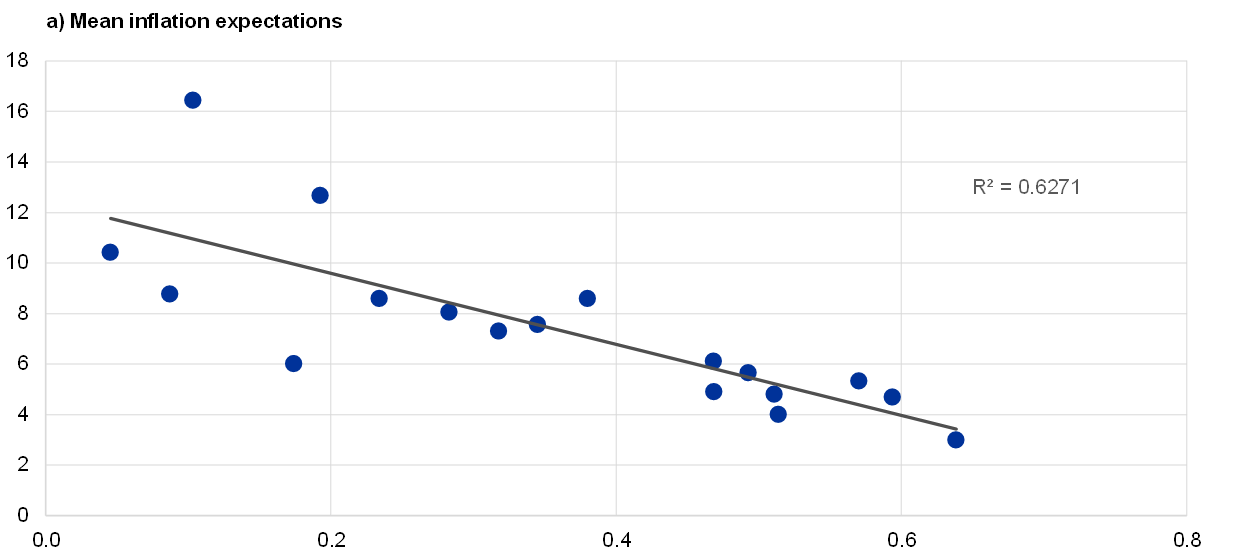
(x-axis: estimated probability that a consumer is certain about inflation for a modal individual in each country; y-axis: mean HICP (January 2004 – September 2020))

Sources: European Commission DG-ECFIN, Eurostat and ECB staff calculations.
Notes: The probability that an individual is certain is estimated using the same modal individual, assuming different nationalities. The mean inflation expectation describes the mean of the individually weighted means for each survey month. The 18 dots represent all euro area countries, except for Ireland where consistent data on the quantitative question are only available since May 2016.
5 Does this (un)certainty framework help explain and foster greater understanding of inflation expectations?
A large part of consumers’ inflation overestimation can be explained by consumer uncertainty
The role of (un)certainty in consumers’ quantitative inflation expectations is estimated with a model. First, the linear effects of sociodemographic and economic sentiment variables on quantitative inflation expectations are estimated.[17] Moreover, to control for potentially different macroeconomic environments, actual inflation (HICP), inflation forecasts by Consensus Economics and GDP growth by country and time are incorporated. The (un)certainty framework is then used to split the sample. This makes it possible to show whether the effect of these sociodemographic and economic opinion variables differs between more and less certain consumers.
Consumer characteristics allow us to develop a model of inflation expectations that fits the data well
At the aggregate level, this model replicates stylised facts on the impact of sociodemographics and economic sentiment on inflation expectations.[18] This study finds that the same characteristics described in the previous section as contributing to greater uncertainty (for example, lower age, lower income group and lower formal education or a worse economic sentiment and a lower ability to save) also contribute to higher expectations. This appears intuitive, given that rounded numbers (i.e. 5, 10 and 15) are typically a lot higher than the reported digits with a median of 2 over the reference period. The fitted values from the model closely match the actual measured inflation expectations. Using this model to estimate the inflation expectation of an “average” person (i.e. mean values in all categories) and averaging across countries for the whole sample period yields a value close to the measured mean expectations (Chart 10, Panel a).
Chart 10
Estimated inflation expectations – fitted versus survey results
(percentages)

Sources: European Commission DG-ECFIN, Eurostat and ECB staff calculations.
Notes: This chart displays the estimated inflation expectation calculated for a mean individual (i.e. an individual with mean characteristics in each category) in each country. HICP country weights are then used to aggregate across the euro area. The latest observation is February 2021 for HICP and September 2020 for other series.
The large gap between actual and expected inflation can be explained by uncertainty measured in rounding
Dividing the sample into the “certain” and “uncertain” groups explains a large part of the so-called inflation expectation conundrum, i.e. the overestimation of inflation in consumer surveys.[19] Applying the above model to each group separately shows that sociodemographic and sentiment variables have a smaller impact on the inflation expectations of the “certain” group (Table 2). The difference in inflation expectations between the “certain” and “uncertain” groups is visualised in Chart 10, panel b and estimated over all time periods separately. It suggests that the differential in inflation estimates observed between socioeconomic groups and respondents of diverging economic assessments can at least in part be explained by the different levels of certainty these groups of respondents have. These results also hold in a model version that controls for perceptions, given their strong link with expectations.[20] However, it should be noted that even consumers who are certain overestimate inflation. Therefore, the certainty channel should not be considered in isolation from other hypothesised reasons, including psychological aspects of loss aversion, seasonality and the idea that consumers might have in mind different and very heterogeneous baskets (including house prices, for instance) when estimating inflation.[21]
Table 2
Contribution of “certainty” to the level of inflation expectations
Magnitude of coefficients in the model
(coefficients from a linear model with inflation expectations as the dependent variable)

Source: ECB staff calculations.
Notes: * denotes not statistically significant at the 99% confidence level. All other coefficients are statistically significant at the 99% level. The coefficients show the relative magnitude and direction of a unit change in one of the individual variables on the inflation expectations, holding all other variables at a constant level. For example, holding all other factors constant, being female increases inflation perceptions by 1.03 percentage point when estimated for the whole sample, 1.23 when estimated for uncertain respondents and 0.19 when estimated for certain respondents. Note that, contrary to the other sentiment questions, for the question on unemployment, a low (high) value implies a negative (positive) situation. For more details on the wording of the questionnaire, see the European Commission’s User Guide.
6 Conclusion
Inflation (un)certainty is an important framework for analysing consumers’ quantitative inflation expectations
Inflation (un)certainty is a channel that sheds light on some of the more puzzling aspects of reported quantitative inflation expectations. First, the (un)certainty lens helps explain why we can observe high estimated aggregates despite rather low inflation. This is because in conditions of uncertainty many consumers report rounded numbers, whereby they often quantitatively overestimate inflation. Second, since rounding is more prevalent in some sociodemographic groups, it also helps explain why we observe higher levels of inflation perceptions and expectations for specific population characteristics. However, it should be borne in mind that, although consumers who are less certain may not precisely quantify future inflation, their expectations identify relatively low and high inflation in a similar manner to more consumers who are more certain and in broad alignment with the actual inflation cycle.
The reported negative correlation between the economic outlook and inflation estimates may be caused by increased uncertainty
Furthermore, the uncertainty channel is also a possible explanation for the negative correlation sometimes observed between the economic outlook and inflation expectations. It thus offers an alternative perspective to the view that this negative correlation is a so-called supply-side interpretation of inflation, whereby individuals interpret an increase in expected inflation as unambiguously adverse.[22] We show that this correlation could reflect increased uncertainty, which, in turn, increases reported inflation expectations.
However, there remain aspects of consumers’ inflation expectations that cannot be addressed using the data considered in this article. For instance, as we do not observe the same individual over time, it is challenging to understand how expectations are formed and the extent of their economic impact. In the future, the ECB’s Consumer Expectations Survey (CES), which was launched as a pilot in 2020 and has a genuine panel structure, could offer a more in-depth view of consumer expectations over time, their formation and how consumers understand and react to monetary policy.[23]
- See, for example, Draghi, M., Introductory Statement, European Central Bank, 22 October 2015 and Yellen, J., "Comments on Monetary Policy at the Effective Lower Bound", Brookings Papers on Economic Activity, Economic Studies Program, The Brookings Institution, Vol. 49, No 2, Fall, 2018, pp. 573-579.
- Consumer inflation perceptions relate to perceived price changes in the past, and consumer inflation expectations refer to expected price changes in the future.
- These data were made publicly available in aggregated form for the EU and the euro area and include breakdowns by socio-economic category following a study by Arioli R., Bates, C., Dieden, H., Duca, I., Friz, R., Gayer, C., Kenny, G., Meyler, A. and Pavlova, I., “EU Consumers’ Quantitative Inflation Perceptions and Expectations: An Evaluation”, European Economy - Discussion Paper, No 038, European Commission Directorate General Economic and Financial Affairs, November 2016. They have been reported quarterly since early 2019 by the European Commission in its European Business Cycle Indicators (EBCI) publication. See also European Commission, “New data set on consumers’ quantitative estimates of past and expected inflation in the euro area and the EU”, European Business Cycle Indicators (EBCI) – 1st Quarter 2019, Technical Paper, No 31, pp. 17-22, 12 April. The data are available for download here (under Consumers – Qualitative and Quantitative Inflation perceptions).
- For a first assessment (of Swedish consumers), see Jonung, L., “Perceived and Expected Rates of Inflation in Sweden”, The American Economic Review”, Vol. 71(5), 1981, pp. 961-968; and for a more recent overview of the euro area, see Arioli et al. (2016, op. cit.). A study by Bryan, M. and Venkatu, G., “The Demographics of Inflation Opinion Surveys”, Federal Reserve Bank of Cleveland Economic Commentary, October 2001, argues that these differences cannot be explained purely by different consumption baskets across these different socio-economic groups.
- This has been pointed out for Italian consumers in Del Giovane, P., Fabiani, S. and Sabbatini, R., “What's behind "inflation perceptions”? A survey-based analysis of Italian consumers”, Temi di discussione (Working papers), No 655, Banca d'Italia, January 2008; and for the European level by Ehrmann, M., Pfajfar, D. and Santoro, D., “Consumers' Attitudes and Their Inflation Expectations”, International Journal of Central Banking, February 2017, pp. 225-259.
- For consumers’ qualitative inflation perceptions, the balance statistic is calculated using replies to the question “How do you think that consumer prices have developed over the last 12 months? They have: (a) risen a lot; (b) risen moderately; (c) risen slightly; (d) stayed about the same or (e) fallen”. Respondents may also respond “don’t know”. For consumers’ qualitative inflation expectations, the balance statistic is calculated in response to the question “By comparison with the past 12 months, how do you expect that consumer prices will develop in the next 12 months? They will: (a) increase more rapidly; (b) increase at the same rate; (c) increase at a slower rate; (d) stay about the same; (e) fall”. Respondents may also respond “don’t know”. For both perceptions and expectations, the balance statistic is calculated as a+(b/2)-(d/2)-e, where a-e are the percentages of consumers responding with a, b, d and e.
- This is also the case when considering the median (which can attenuate the impact of outliers) with an average of 6.2%, Over the past five years (2016-2020) the mean (6.0%), median (4.1%) and lower quartile (2.3%) of inflation perception are also above average actual inflation (1.0%).
- The broad pattern of some consumers rounding to multiples of 5 and others reporting to single digits or decimals has also been observed for US and Japanese data on consumer expectations. For the United States, see Binder, C., “Measuring uncertainty based on rounding: New method and application to inflation expectations”, Journal of Monetary Economics, Elsevier, Vol. 90(C), 2017, pp. 1-12; and for Japan, see Abe, N. and Ueno, Y., “The Mechanism of Inflation Expectation Formation among Consumers”, RCESR Discussion Paper Series, No DP16-1, Hitotsubashi University, March 2016.
- For additional references to the communications and linguistics literature, see Binder (2017, op. cit.) and Krifka, M., “Approximate Interpretations of Number Words: A Case for Strategic Communication” in Hinrichs, E. and Nerbonne, J. (eds.), Theory and Evidence in Semantics, Stanford: CSLI Publications, 2009. Consumer inattention has also been used to explain some of the stylised features of observed consumers’ inflation expectations (see, for example, Kamdar, R., “The Inattentive Consumer: Sentiment and Expectations”, Meeting Papers, No 647, Society for Economic Dynamics, 2019, pp. 109-132. However, it is difficult to reconcile inattention with the increased rounding that is observed at times of heightened uncertainty (when consumers should be more attentive than normal).
- As a portion of those reporting in multiples of five might be more “certain”, fitting distributions to the data allows the share of uncertain consumers to be calculated by adding the relative weights of groups (ii) and (iii). In technical terms, a mix of three log-normal distributions, on supports of (i) single digits, (ii) multiples of five, and (iii) multiples of ten, are fitted using maximum likelihood methods. For more details, see Arioli et al. (2016, op. cit.).
- The mode shows the highest portion (or most common part) of the distributions. As the distributions tend to have long right-hand tails, their means tend to be above the mode.
- There were also unprecedented developments in the qualitative estimates. The balance statistic for consumers’ perceptions of past inflation fell between February and April 2020, whereas that for expectations of future inflation rose. The balance statistic for inflation perceptions fell from 14.2 in February to 5.9 in April, whereas that for expectations of future inflation rose from 21.1 in February to 29.2 in April. The difference between the qualitative perceptions and expectations balance statistics reached its lowest level (-23.3) since the early 1990s.
- This assessment is broadly in line with that from a specific survey carried out by the Banca d’Italia between April and May 2020, in which it was reported that the role of pessimism is evident in that expected inflation was higher among respondents that expected a significant reduction in their income. For further details, see “Italian households’ assessments and expectations during the current public health emergency”, Annual Report for 2019, Banca d’Italia, pp. 69-71.
- Similarly to Section 3, the measure of (un)certainty used in this study is based on the rounding of quantitative inflation expectations. If an estimate is a multiple of 5, the respondent is classified as “uncertain”, while all others are classified as being “certain”. This creates a binary variable which allows the probability that a consumer is certain about inflation expectations/perceptions given their characteristics to be estimated. The estimation then follows a maximum likelihood regression using a logit functional form. Potential misclassification in the dependent variable is accounted for, given that individuals may either be certain but still respond in multiples of five, or may be uncertain but reply with a digit that is not a multiple of five. The method is identical to that proposed in Hausman, J., Abrevaya, J. and Scott-Morton, F., “Misclassification of the dependent variable in a discrete response setting”, Journal of Econometrics, Vol. 87(2), 1998, pp. 239-269.
- . In addition, the level of actual inflation (measured by the overall HICP) and GDP growth in the respective time period and geography is included to capture more structural differences in the panel of respondents. It is found that a higher level of actual inflation and the qualitative level of expected inflation reduces overall certainty.
- Note that “certainty” (as measured in rounding) can be affected by the survey mode and design in each country. For example, switching from phone to online surveys might have an impact on the propensity of people to respond in much larger (and often rounded) numbers, seemingly increasing “uncertainty”. For example, in May 2019 Germany changed its survey mode from face-to-face interviews in respondents’ homes to an online survey with Computer Aided Web Interviewing (CAWI), which resulted in a significant increase in the share of respondents reporting rounded estimates. In addition, when responding to the survey, some countries do not allow for respondents to provide decimals, while others may cap responses (for example, at less than 20). This could impact the observed certainty for a given country.
- A simple linear regression framework is used with the response to the two quantitative questions as the dependent variable respectively. This implies an assumption of linear effects which is deemed justified given that individuals respond in rather broad categories and since it facilitates interpretation of the results.
- See, for example, Jonung (1981, op. cit.); Bryan and Venkatu (2001, op. cit.); Arioli, et al. (2016, op. cit.); Del Giovane, Fabiani and Sabbatini (2009, op. cit.); Ehrmann, Pfajfar and Santoro (2017, op. cit.).
- A study by Abildgren, K. and Kuchler, A , “Revisiting the inflation perception conundrum”, Journal of Macroeconomics, Vol. 67, 2021) describes the issue of overestimation bias in inflation perceptions and expectations across countries and time periods, and suggests various explanations. The term “inflation perceptions conundrum” is coined in that article but is also found here to be equally applicable in the context of expectations.
- In Duca-Radu, I., Kenny, G. and Reuter, A., “Can consumers’ inflation expectations help stabilise the economy?”, Research Bulletin, No 79, European Central Bank, 12 January 2021, ECCS data are used to examine the link between inflation expectations and consumption. This study finds that the raw relationship between readiness to spend and inflation expectations is, on average, negative and quite unstable. They attribute this to the unobserved factors and consumer-specific characteristics which may have an impact on reported inflation expectations. When inflation expectations are normalised (based on the current inflation perception), it finds a more stable and positive relationship with the readiness to spend.
- For a summary of the available literature, see Abildgren and Kuchler (2021, op. cit.).
- Candia, B., Coibion, O. and Gorodnichenko, Y., “Communication and the Beliefs of Economic Agents”, paper presented at Federal Reserve Bank of Kansas City’s Jackson Hole Economic Policy Symposium, 28 August 2020.
- For more information, see the ECB Consumer Expectations Survey.