
Sixth report on card fraud
Executive summary
This sixth oversight report on card fraud analyses developments in card payment fraud with a particular focus on the 2018 data, which is put into the context of a five-year period from 2014 to 2018. It is based on data reported by the card payment schemes in the euro area with a breakdown per Single Euro Payments Area (SEPA) country.[1] The report covers almost the entire card market.[2] The reporting card payment scheme operators are required to report card fraud as defined within their own rules and procedures. Card fraud is composed of (i) fraudulent transactions with physical cards (card-present fraud), such as cash withdrawals with counterfeit or stolen cards, and (ii) fraudulent transactions conducted remotely (card-not-present fraud), such as those with card details obtained by criminals through phishing and used for online payments.
The total value of fraudulent transactions using cards issued[3] within SEPA and acquired[4] worldwide amounted to €1.80 billion in 2018. When it comes to cards issued in the euro area only, the total value of fraudulent card transactions acquired worldwide amounted to €0.94 billion in 2018.
As a share of the total value of card transactions, fraud increased by 0.002 percentage points to 0.037% in 2018 compared with 2017 for SEPA and by 0.002 percentage points to 0.031% for the euro area. A 0.037% share means that an average of 3.7 cents was lost to fraud for each €100 worth of transactions using SEPA cards in 2018. Over the five-year period, the highest fraud share with SEPA cards was recorded in 2015 (0.042%) while the lowest was recorded in 2017 (0.035%).
The upward trend in card fraud observed between 2012 and 2015 reversed until 2017 but increased again in 2018. The overall level of fraud in card payments shows the importance of continuous fraud monitoring and vigilance by card scheme overseers as well as security measures.
In respect of the composition of card fraud in 2018, 79% of the value of card fraud resulted from card-not-present (CNP) payments (i.e. payments via the internet, mail or phone), 15% from transactions at point-of-sale (POS) terminals, such as face-to-face payments at retailers or restaurants, and 6% from transactions at automated teller machines (ATMs).[5] CNP fraud accounted for €1.43 billion in fraud losses in 2018 (an increase of 17.7% compared with 2017). Card-present fraud committed at POS terminals went up by 3.6% in 2018 compared with 2017, while fraud committed at ATMs decreased by 14.7%. This decrease in card-present fraud could be a result of an increasing adoption rate of chip-and-pin transactions[6] at ATMs also outside of Europe.[7]
For the purpose of these statistics, the reporting entity must differentiate between cards with the following functions: (i) debit and (ii) delayed debit or credit. The share of delayed debit card and credit card fraud in overall transactions (0.099%) remained larger than that of debit card fraud (0.016%) in 2018.
From a geographical perspective, domestic[8] transactions accounted for 89% of all card transactions but only 36% of fraudulent transactions. Cross-border transactions[9] within SEPA represented 9% of all transactions but 49% of fraudulent transactions. Finally, although only 2% of all transactions were acquired outside SEPA, they accounted for 15% of all fraud. The euro area experienced slightly lower fraud levels from an issuing and acquiring perspective than SEPA as a whole.
Most of the countries with significant card markets (defined as countries with high volumes and values of card transactions per inhabitant) and with a high level of use of cards for online purchases experienced higher relative fraud rates as seen in Figure 1 below. By contrast, countries with limited online card use experienced relatively lower levels of fraud.
From a market perspective, both payment service providers and card payment scheme operators have developed a range of fraud prevention and detection security tools such as card tokenisation with the objective of bringing fraud rates down as well as offering new payment features on portable devices, such as mobile phones. In addition, European regulators have strengthened the security requirements for electronic payments with the revised Payment Services Directive (PSD2) in 2015 and with its secondary legislation, the regulatory technical standards for strong customer authentication and common and secure open standards of communication in 2017. The latter became applicable in September 2019, and was, at the time of the reporting period, in the process of being implemented by the market. The plans for their implementation are also monitored by the overseers of card payment schemes.
Value of fraud as a share of transactions with cards issued in a specific country and acquired anywhere
(value of fraud as a share of value of transactions)
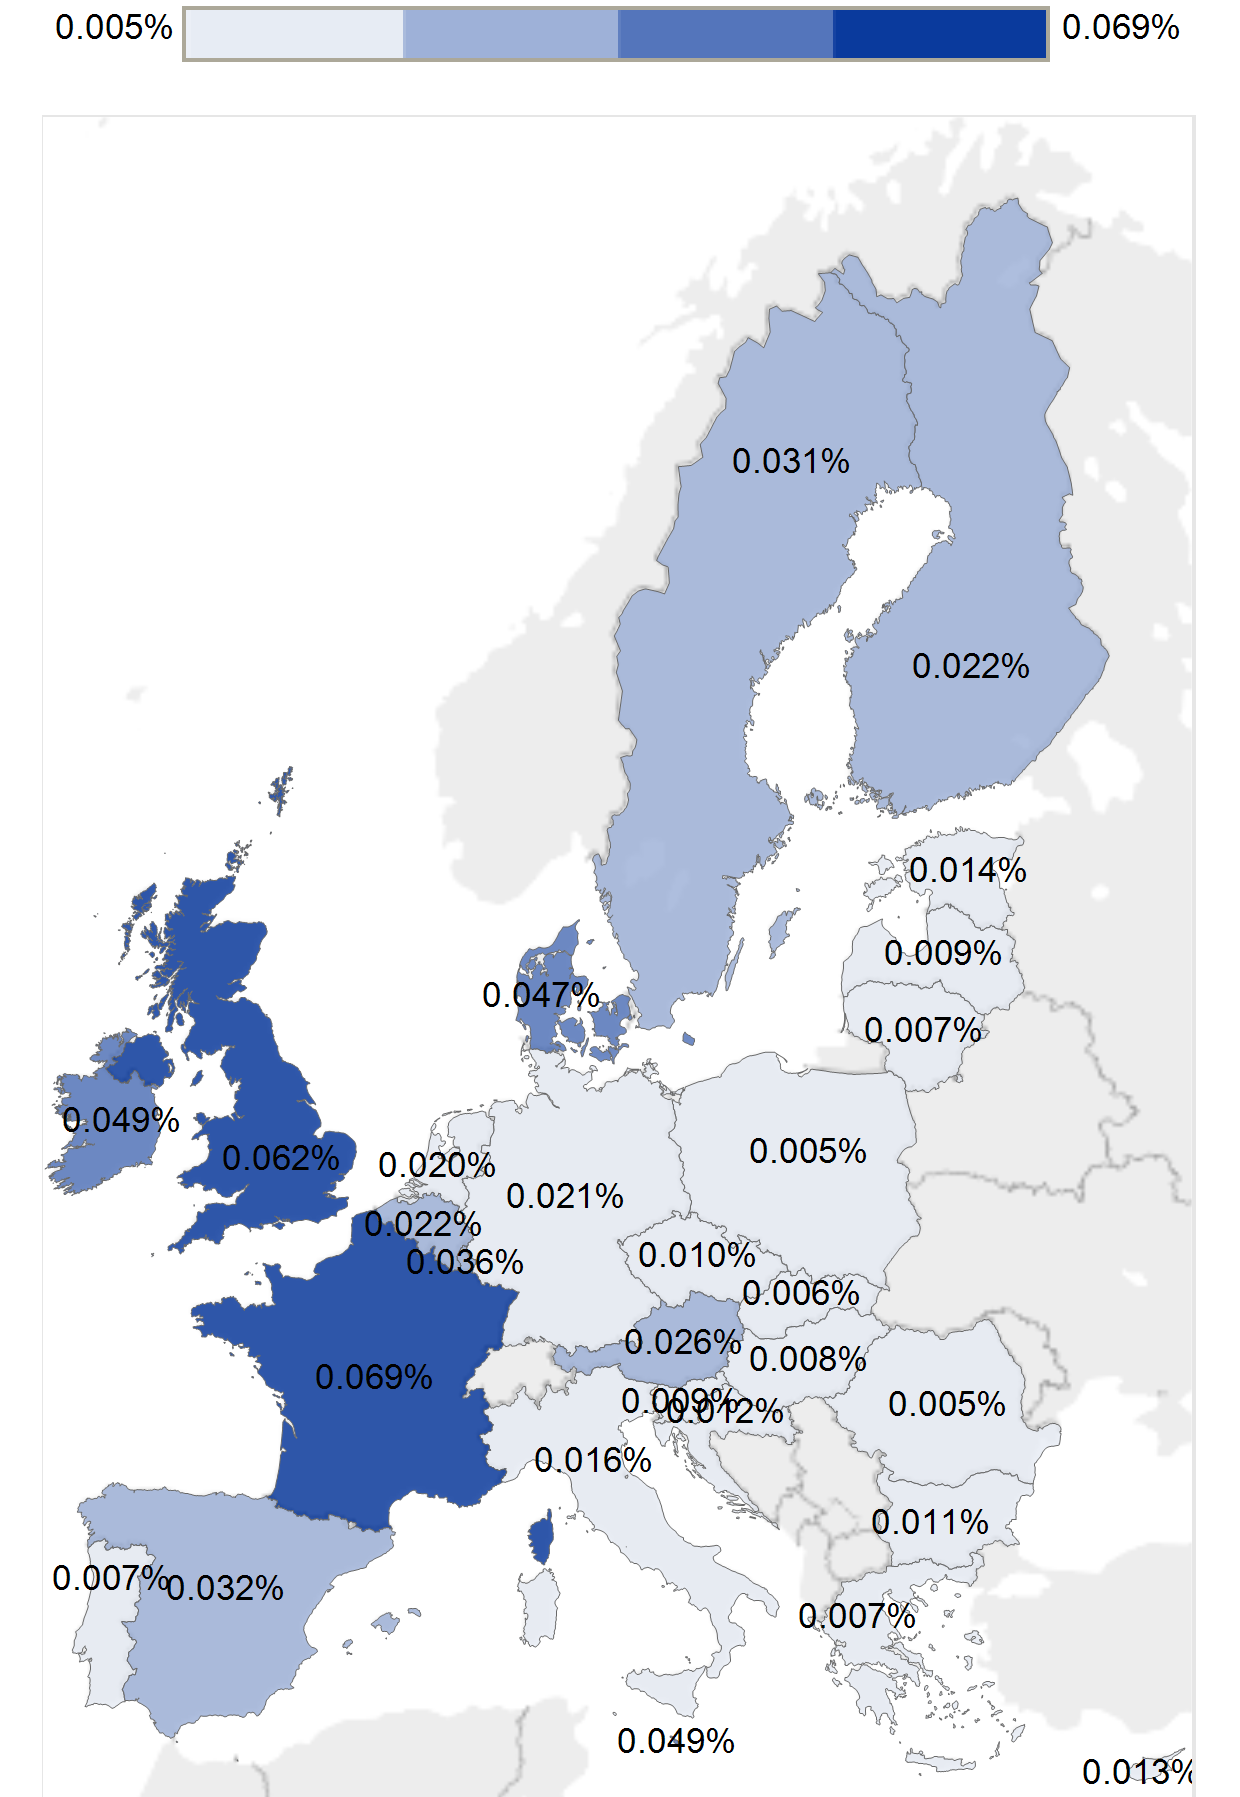
Source: All reporting card payment scheme operators, 2018.
In conclusion, fraud saw a constant decrease since 2015 until 2017, but it increased slightly in 2018 compared to the previous year. Therefore, given the card payments fraud levels registered in 2018, the industry needs to remain vigilant and take preventive measures. For example, the fraud level largely depends on the efforts that fraudsters have to make versus the benefits obtained by compromising sensitive card payment data. It also depends on what other types of digital crimes can be more appealing compared with card payment fraud (e.g. theft of personal data for extortion or selling to marketing companies).[10] Therefore, the market – both card payment scheme operators and their participating payment service providers – is encouraged to continue sharing information related to fraud prevention and best security practices, such as the implementation of tokenisation, EMV standards and geo-blocking[11], enhanced customer security education, and increased physical security measures at terminals (e.g. skimming device detectors). Law enforcement also plays a key role in preventing and punishing card payment fraud. Moreover, European regulators, overseers of payment schemes and payment instruments as well as supervisors of payment service providers need to continue to ensure timely and appropriate implementation of security requirements in order to prevent and reduce payment fraud.
Introduction
The Eurosystem monitors developments in card payment fraud in its role as overseer of card payment schemes active in the euro area. In this context, the ECB’s Governing Council approved an oversight framework for card payment schemes in January 2008. As part of the harmonised implementation of this framework, statistical information is collected on card schemes. Each scheme is asked to supply general business data and volumes and values of transactions and fraudulent transactions per country for all Single Euro Payments Area (SEPA) countries as well as in aggregate for all countries outside SEPA. For card-present transactions at automated teller machines (ATMs) and point-of-sale (POS) terminals, fraud figures are broken down into the following categories: “lost and stolen”, “card not received”, “counterfeit” and “other”. For total card-not-present (CNP) transactions, there is an option to provide a breakdown of the figures according to “online” and “mail or phone” fraud. Fraud is recorded as having occurred regardless of whether the loss was borne by the cardholder, issuer, acquirer or merchant.
This report analyses and summarises the information received from the following 23 card payment schemes: American Express, Bancontact, BNP Paribas Personal Finance, Cartes Bancaires, Cashlink, Cofidis, Cofinoga, CONSORZIO BANCOMAT, Crédit Agricole Consumer Finance, Dankort, Diners Club International, EURO 6000, Franfinance, girocard, JCB International, Karanta, MasterCard Europe, Oney Bank, ServiRed, SIBS’ MB, Sistema 4B,[12] UnionPay and Visa Europe.
Two methodological data issues identified a few years ago remain valid for this report, namely that some card payment scheme operators allocate (i) transactions with cross-border issued cards to the country of issuance as opposed to the location of the issuer and (ii) cross-border acquired CNP transactions according to the location of the acquirer instead of the location of the merchant. These methodological divergences result in some inconsistencies between data collected from the card payment schemes and similar data from the payment service providers reported for Statistical Data Warehouse (SDW) purposes; however, as they are limited to some schemes and countries, they are considered tolerable. Moreover, some adjustments have been made to the data reported with the purpose of avoiding double counting of domestic transactions where cards are co-badged[13] by both an international scheme and a domestic one. This may have, for a few countries (e.g. France), led to some under-reporting of transactions and thus a slightly over-estimated fraud rate. This discrepancy has also been tolerated for this report.
Results “from an issuing perspective” refer to payments made with cards issued within SEPA and acquired worldwide. Results “from an acquiring perspective” refer to transactions conducted using cards issued worldwide and acquired inside SEPA. Results are generally derived from an issuing perspective,[14] except in Chapter 6, where the acquiring perspective is adopted for some results. In these cases, the change of perspective is highlighted.
The report is structured as follows: the first chapter presents findings on the total level of card fraud. The second chapter looks at card fraud for different card functions and is followed by a chapter on CNP fraud. Next is an analysis of card-present fraud. Chapter 5 compares fraud figures for domestic transactions with cross-border figures both within and outside SEPA. Chapter 6, which is based on EU Member States only, looks at absolute and relative fraud levels, as well as other information about individual EU Member States. Chapter 7 concludes and provides an outlook on potential fraud-related developments.
1 Total level of card fraud
The total value of transactions using cards issued in SEPA amounted to €4.84 trillion in 2018,[15] of which €1.80 billion was fraudulent.
Card fraud increased by 13% in terms of value compared with 2017 while the value of all card transactions grew by 6.5%. The value of card fraud therefore grew faster than the value of all card transactions, leading to an increase in fraud as a share of the total value of transactions of 0.002 percentage points, from 0.035% in 2017 to 0.037% in 2018.[16] Nevertheless, fraud as a share of the total value of transactions saw a five-year low in 2017 (0.035%) and its 2018 level remains below the five-year high recorded in 2015 (0.042%).
Over the reported years, CNP fraud increased as a share of the total value of card fraud, representing 79% in 2018, whereas the proportion of card fraud at ATMs and POS terminals decreased to 6% and 15% respectively in 2018.
Evolution of the total value of card fraud using cards issued within SEPA
(left-hand scale: total value of fraud (EUR millions); right-hand scale: value of fraud as a share of value of transactions (percentages))
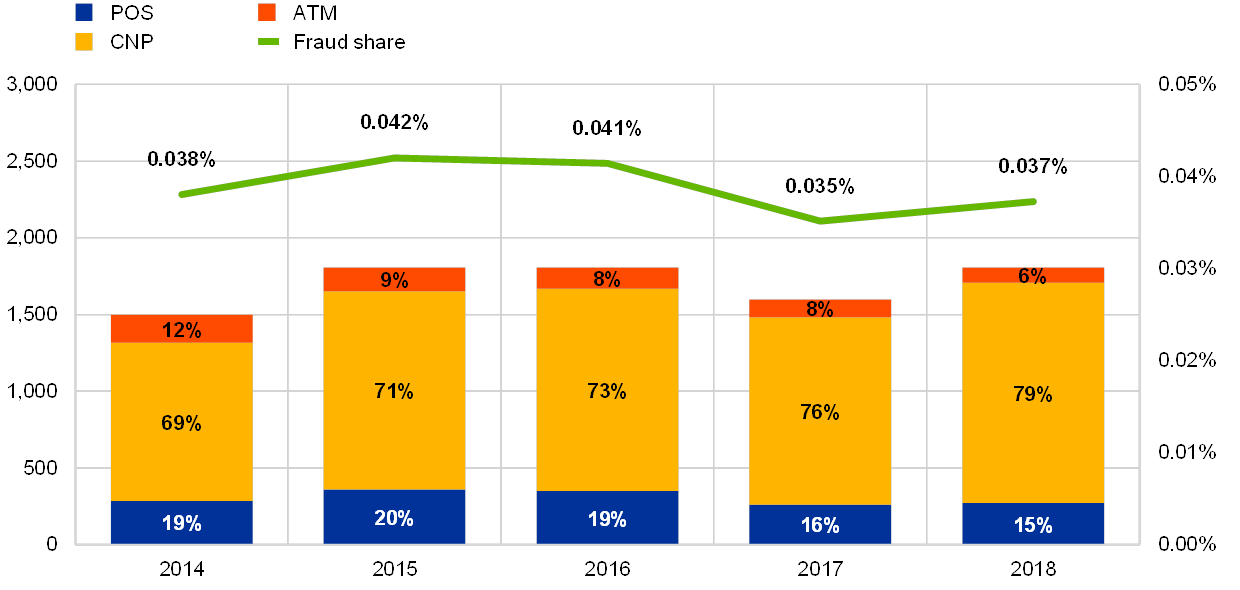
Source: All reporting card payment service operators.
The total number of card transactions using cards issued in SEPA amounted to 89.65 billion in 2018,[17] of which 21.05 million were fraudulent.
Card fraud volume increased by 25.1% compared with 2017 while the total number of card transactions increased by 11.3%. Card fraud volume therefore grew faster than the total volume of card transactions, leading to an increase in fraud as a share of the total number of transactions of 0.002 percentage points, from 0.021% in 2017 to 0.023% in 2018.
As with ATM and POS fraud in value terms, the volume of such fraud as a share of total fraud decreased in 2018 compared with 2017, whereas the volume of CNP fraud as a share of total fraud increased. The share of ATM fraud in terms of volume was lower than its share in terms of value, owing to the growing average values for fraudulent ATM transactions.
Evolution of the total volume of card fraud using cards issued within SEPA
(left-hand scale: total volume of fraud (million transactions); right-hand scale: volume of fraud as a share of volume of transactions (percentages))

Source: All reporting card payment scheme operators.
Chart 2 shows that CNP fraud makes up the largest share of card fraud, while the most prominent categories at ATMs and POS terminals are lost-and-stolen and counterfeit card fraud.
Value of fraud types as a share of total card fraud using cards issued within SEPA
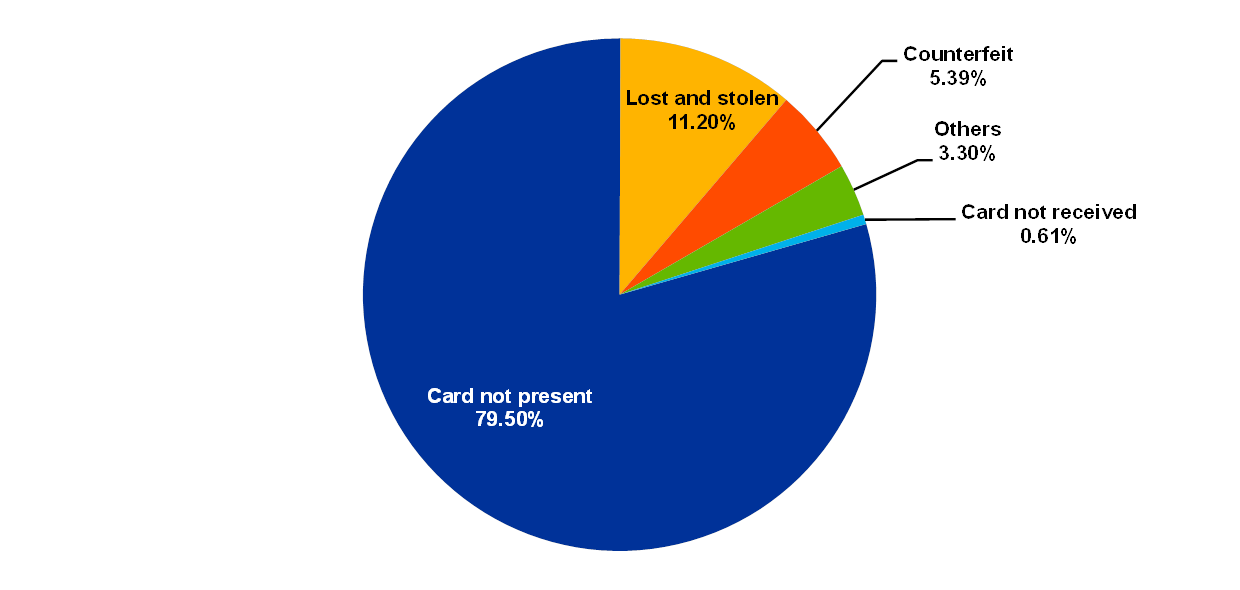
Source: All reporting card payment scheme operators.
Looking back over the past ten years, fraud has generally increased in absolute values (represented by the colour of the circles in Chart 3) but generally decreased in relative terms, as a share of total value of transactions (represented by the height of the lollipops in the below chart). The overall absolute value of transactions (represented by the size of the circles in Chart 3) has also increased over this period. The minimum share of fraud in the value of total transactions over this period was recorded in 2017 (0.035%), while the maximum was recorded in 2009 (0.048%).
Evolution of the total value of card fraud using cards issued within SEPA
(circle colour: total value of fraud (EUR billions); circle size: total value of transactions (EUR trillions); height of the lollipop: value of fraud as percentage of value of transactions)

Source: All reporting card payment scheme operators.
2 Card fraud according to different card functions
Data are collected for this report on (i) debit cards, and (ii) delayed debit cards and credit cards. In 2018, the total share of fraud in overall transactions increased slightly for debit cards (to 0.016%) as well as for delayed debit cards and credit cards (to 0.099%) compared with the previous year. In general, the share of fraud with debit cards remained lower than that with delayed debit cards and credit cards. This was also true in the majority of SEPA countries.
For delayed debit cards and credit cards:
- in both absolute and relative terms (as a percentage of total delayed debit card and credit card transactions), fraud increased in 2018 compared with the previous year for the CNP channel but decreased at ATMs and POS terminals.
For debit cards:
- in absolute terms (not displayed in the chart), CNP and POS fraud increased in 2018 compared with the previous year but ATM fraud decreased;
- in relative terms (as a percentage of total debit card transactions), the share of CNP fraud increased, while the shares of POS and ATM fraud decreased slightly in 2018 compared with the previous year.
Share of value and breakdown of fraudulent transactions by card function
(value of fraud as share of value of transactions (percentages))

Source: All reporting card payment scheme operators excluding cards issued in France and Spain which are reported in aggregate without distinguishing the card function.
3 Card-not-present fraud
In 2018 the total value of CNP[18] fraud increased by 17.7% compared with the previous year, reaching €1.43 billion, accounting for 79% of the total value of card fraud. This share grew steadily for the 10 years since 2008 (not displayed in the chart) and is in line with the continuously increasing importance of card payments over the internet.
An increase in CNP fraud of 39.31% over the five-year period, i.e. from 2014 to 2018, was the main driver of the 21% increase in overall fraud over this period. The largest share of CNP fraud takes place across borders within SEPA as shown in Chart 5.
Evolution of the value of CNP fraud and its share of the total value of card fraud
(left-hand scale: total value of CNP fraud (EUR millions); right-hand scale: value of CNP fraud as share of value of card fraud (percentages))

Source: All reporting card payment scheme operators.
Box 1 Tokenisation in card payments[19]
Tokenisation is part of a broad industry effort to protect sensitive card payment data when it is more vulnerable, i.e. while stored or in transit across the acceptance environment (e.g. card-on-file systems). Furthermore, tokenisation has become a cornerstone in enabling card digitisation, aimed at securing new digital solutions for mobile payments and e-commerce.
Tokenisation is a security measure where the actual card details (i.e. expiry date and primary account number (PAN)) are replaced by unique digital identifiers (tokens) which can be parametrised to be used in a restricted way. In practice, the added security from payment tokens relies on the enforcement of their domain restriction controls to ensure the intended valid use of a given token. For example, a token provisioned to a mobile phone could be setup to only initiate proximity payments from that particular device by a given cardholder, where the trusted consumer device itself becomes a multi-factor authenticator. Another token could be issued for in-app payments at a specific merchant only. Additionally, a token might be set to be valid for a single use or restricted to a set number of purchases before expiring.
The security strategy consists of devaluing tokens as payment credentials. Therefore, if a data breach occurs, compromised tokens are less sensitive, less exploitable and much easier to replace than traditional primary account numbers. Prior to authorising a tokenised transaction, the issuer, or the designated token service provider (TSP) on its behalf (see Figure A), performs the cryptographic validation of the payment token and the application of the aforementioned usage restriction controls. This ensures that a genuine token is used within one of the acceptable domains for that token, therefore ring-fencing the potential side effects in the event of a token being compromised. As a result, tokenised payment credentials become less attractive to fraudsters and help to reduce the risk and costs associated with card data breaches. The token service provider stores the original credentials in a secured vault and maps the relationships between payment account numbers and tokens (potentially in a one-to-many relationship). In the figure, the blue arrows represent requests and the yellow arrows indicate responses. The dashed lines are new relationships/exchanges introduced by the EMV payment tokenisation along with the new roles of a token requestor and token service provider.
Figure A
EMV tokenisation model

Payment tokenisation is also useful in a scenario where a consumer reports a card as stolen but remains in possession of a mobile device provisioned with a digital card (token). The issuer would immediately block the stolen card but could decide to keep the device’s token active, managing the life cycle of the payment token independent of the physical card. The consumer could keep on using the device to make purchases while waiting for the replacement card. The expiration date and new primary account number of the replacement card (if changed by the issuer) could be updated in the background by the token service provider and mapped to the same payment token (thus keeping the same “digital card”). In this way, the consumer would not need to digitise the replacement card.
Tokenisation was not originally conceived as an authentication solution but rather as a security mechanism to protect card data from compromises, especially those suffered by merchants. However, card payment tokenisation has evolved to add value in the context of PSD2’s strong customer authentication requirements. A token-based payment instrument could potentially serve as a “possession” element in two-factor authentication as requested by PSD2 if the proper security measures are implemented (e.g. application of token domain restriction controls and cryptographic validation of the token’s dynamic data). Security and usability can benefit from binding both token and payer to a payer’s multi-purpose device with authentication capabilities, such as biometrics. Enriched data stemming from token assurance and from the consumer device used to initiate payment transactions can be leveraged as a risk-assessment factor to reduce online fraud.
Thus, from an oversight perspective, tokenisation is a security feature that, in combination with encryption and cryptography, supports innovative forms of payment for a better customer experience while aiming to mitigate the related fraud and data security risks. EMV tokenisation therefore addresses security needs for innovative digital payments similarly to the worldwide implementation of EMV chip technology for transactions with physical payment cards.
4 Categories of card-present fraud
Fraud types
In absolute terms, the combined value of ATM and POS fraud (as a sum representing the total of card-present fraud) decreased by 2.1% in 2018 compared with the previous year. The value of ATM fraud alone decreased by 14.7% in 2018 compared with 2017 while that of POS fraud slightly increased by 3.6%.
The decrease in the value of ATM fraud in 2018 was driven by considerably lower losses from lost-and-stolen and counterfeit card fraud. However, these categories were the first and the second most significant types of ATM fraud in 2018, respectively, continuing the trend observed since 2015.
At POS terminals, a 70.8% increase in other types of fraud (e.g. account takeover, fraudulent application – see Box 2 for further details) contributed to the overall increase of POS fraud in 2018 compared with the previous year. However, all the other POS fraud categories, i.e. counterfeit, lost-and-stolen and card-not-received, decreased in 2018. Nevertheless, lost-and-stolen card fraud and counterfeit card fraud were the most significant categories of POS fraud in 2018.
Over the five-year period from 2014 to 2018 the value of counterfeit card fraud at ATMs and POS terminals combined decreased by 52.6% in absolute terms, while card-not-received fraud decreased by 14.4% for the two channels. Over the same period, lost-and-stolen card fraud decreased by 4% while remaining the leading category of card-present fraud in terms of absolute value.
Evolution and breakdown of the value of card-present fraud by category
(total value of card present fraud (EUR millions))

Source: All reporting card payment scheme operators.
Geographical breakdowns of counterfeit card present fraud
The total value of counterfeit card fraud at both ATMs and POS terminals decreased by 18.14% in 2018 compared with the previous year.
As in previous years, counterfeit card fraud in 2018 mostly involved transactions acquired outside SEPA. More specifically, 91% of ATM counterfeit card fraud and 46% of POS counterfeit card fraud concerned transactions of this type.
In 2018, cross-border counterfeit card fraud (at both ATMs and POS terminals) acquired outside SEPA saw a drop of 32.05% compared with the previous year. This is most likely owing to the fact that migration to the EMV security standard has made substantial progress in countries outside SEPA as well. In total, over the five-year period from 2014 until 2018, counterfeit card fraud outside SEPA decreased by 66%.
Evolution and breakdown of the value of counterfeit card fraud at ATMs and POS terminals
(total value of counterfeit fraud (EUR millions))

Source: All reporting card payment scheme operators.
Box 2 Account takeover, compromised application fraud and data breaches
Based on communication with the payment scheme operators, the broader community of payments market participants, European legislators and law enforcement and supported by the analysis in this report, two other types of fraud were observed in the card payment space: compromised application fraud and account takeover (captured by the reported data within the “other” category of card-present fraud[20]). Both scenarios are connected to a more general phenomenon in the digital economy over the past few years – data breaches. This category of cyber-dependent crimes has been consistently highlighted in the last five editions (2015‑2019) of the Internet Organised Crime Threat Assessment (IOCTA) report published by Europol. For example, the 2017 IOCTA report stated that over two billion personal data records related to EU citizens were reportedly leaked over a 12‑month period.[21] Such leaks enable fraudsters to, for example, apply for a credit card in someone else’s name (i.e. compromised application fraud) and, via a series of multiple fraudulent transactions, to acquire easily resaleable high-value commodities (e.g. consumer electronics). The fraudsters thus incur considerable debt “on behalf of” the unsuspecting consumer. While combating this type of fraud can be facilitated by the general obligation to report data breaches, set out in the General Data Protection Regulation (GDPR), which entered into force in 2018, it also requires more agile know-your-customer (KYC) procedures to be implemented by the payment service providers.
The other fraud type facilitated by data breaches – account takeover – occurs when a criminal takes over another person’s genuine card account. Based on the personal information from data breaches, fraudsters are able to impersonate the genuine cardholder and, for example, request a replacement card by falsely reporting theft or loss. Since this fraud type affects existing accounts, it can be more easily prevented by cardholders actively monitoring their transaction history. Its automated detection and prevention is also facilitated by new security measures, such as automated transaction monitoring tools. These mechanisms were previously applied by some issuers as a best practice and are now imposed on all payment service providers by the PSD2 and secondary legislation thereto.[22] As the fraudulent transactions made as a result of taking over an account would probably not always match usual spending patterns of the genuine cardholder, they could at least partly be prevented by the monitoring tools.
In addition to the fraud scenarios described above, the law enforcement perspective provided by Europol’s IOCTA reports also sheds more light on a more direct effect of data breaches – illegal trade in payment credentials (e.g. card numbers), that mostly fuel card-not-present fraud. Such credentials, obtained either from data breaches, merchant websites compromised by malware or sometimes directly from the cardholders (e.g. via phishing, scam text messages)[23] are often not immediately used for fraud, but offered for sale on underground marketplaces on hidden internet pages (the “dark web”) as a commodity. They are acquired by criminal groups and often used for the purchase (usually via online channels) of physical goods, airline tickets, car rentals and accommodation,[24] thus often facilitating other types of crime, especially human trafficking.[25] Fortunately, coordinated responses from European and international law enforcement agencies, often facilitated by Europol, result in significant successes in takedowns of such illegal marketplaces, thus disrupting the fraudsters’ business model.[26] Fraud of this type can also be prevented by the strong customer authentication tools mandated by PSD2 and the regulatory technical standards for strong customer authentication and common and secure open standards of communication as of 14 September 2019. Since that date, two authentication factors are required to initiate an electronic transaction, except in some cases defined in the regulations mentioned above (e.g. low-value transactions or trusted beneficiaries). These factors can be something the user knows (e.g. a password), something the user is (e.g. a fingerprint taken via a mobile device reader) or something the user has (e.g. a card evidenced by a card reader). Therefore, even if the fraudster is in possession of complete card details,[27] the additional authentication requirements limit the potential fraud.
5 Geographical distribution of card fraud
From 2014 to 2018, the geographical composition of the value of all card transactions was marked by an increase in the proportion of cross-border card transactions within SEPA. The proportion of cross-border card transactions outside SEPA has remained relatively stable over this five-year period at 2%, with domestic card transactions still representing the vast majority of card transactions.
In 2018, domestic transactions accounted for 89% of all transactions, a decrease in the share of transactions but an increase of 5.89% in terms of absolute values compared with the previous year. Cross-border transactions within SEPA, on the other hand, went up by 12.11% in 2018 compared with 2017 although they only represent 9% of all card transactions. This indicates that cardholders are increasingly purchasing goods and services across borders at physical or e-commerce merchants within SEPA.
In turn, cross-border transactions within SEPA accounted for the largest share of fraudulent transactions in 2018 (49%), followed by domestic fraud (36%) and cross-border fraud outside SEPA (15%).
Cross-border card fraud within SEPA as a share of total card fraud increased slightly in 2018 compared with the previous year after being constantly on the rise since 2014, increasing in value by 89.61% over the five-year period. As a result, cross-border fraud within SEPA now represents the most significant geographical category of card fraud.
Evolution of the value of domestic and cross-border transactions and fraud
(value of fraud or transactions by geographical breakdown as percentage of total (percentages))

Source: All reporting card payment scheme operators.
The geographical composition of reported card fraud allows the following observations to be made regarding the type of fraud:
- counterfeit card fraud is typically committed outside SEPA; however, the proportion of this type of fraud committed outside SEPA substantially decreased in 2018 compared with the year before (most probably due to the migration to EMV, which also occurred outside SEPA);
- lost-and-stolen card fraud typically takes place at the domestic level; the proportion of cross-border lost-and-stolen fraud acquired inside SEPA, outside SEPA and the domestic lost-and-stolen fraud remained the same in 2018 compared to the year before.
Geographical composition of lost-and-stolen and counterfeit card fraud at ATMs and POS terminals in terms of fraud value
(value of fraud as percentage of total lost and stolen or counterfeit fraud (percentages))

Source: All reporting card payment scheme operators.
In 2018, both domestic transactions and domestic fraud rose compared with the previous year. Both cross-border transactions acquired within SEPA and corresponding fraud also increased.
However, while cross-border transactions acquired outside SEPA rose in 2018, the corresponding fraud decreased.
Cross-border fraud within SEPA in 2018 exceeded its 2014 level, whereas domestic fraud and fraud outside SEPA were both below their 2014 levels.
Evolution of the total value of domestic and cross-border transactions and fraud
(percentage difference in fraud value)

Source: All reporting card payment scheme operators.Notes: For ease of reference “IN” refers to transactions or fraud acquired in SEPA while “OUT” refers to transactions or fraud acquired outside SEPA. 2014 values represent the base values for comparison.
6 A country-by-country and regional perspective on card fraud
The share of fraud in card transactions varied considerably across EU Member States in 2018.
From an issuing perspective,[28] the rates of fraud in France and the United Kingdom were the highest while rates in Romania and Poland were the lowest.
The euro area in particular experienced lower fraud rates than SEPA as a whole from an issuing perspective. However, from an acquiring perspective, the euro area experienced slightly higher fraud rates than SEPA as a whole in 2018.
Fraud rates for SEPA (and the euro area) continue to remain generally lower from an issuing perspective than from an acquiring perspective. This indicates that cards issued inside SEPA experienced lower fraud rates for transactions acquired outside SEPA than cards issued outside SEPA for transactions acquired inside SEPA, which could be a source of reassurance to European cardholders when shopping abroad.
Fraud share from an issuing and acquiring perspective
(value of fraud as share of value of transactions)
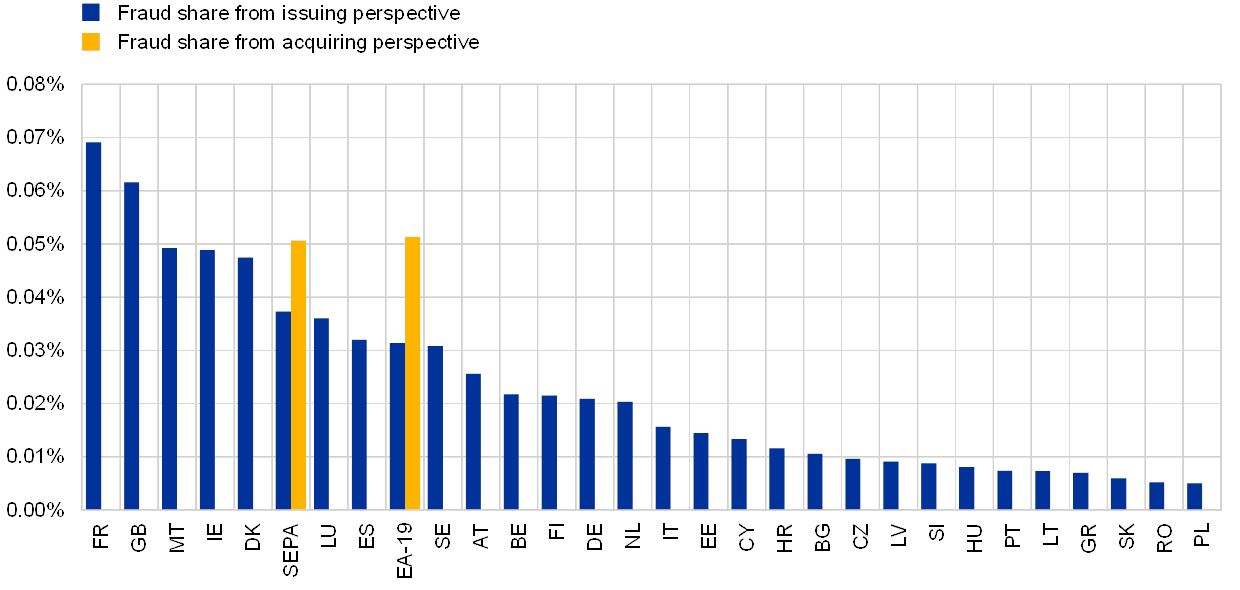
Source: All reporting card payment scheme operators, 2018.Notes: Blue bars: fraud share based on fraud and transactions with cards issued in a specific country and acquired anywhere.Yellow bars: fraud share based on fraud and transactions with cards issued anywhere and acquired within the geographical area.
Compared with 2014, fraud from an issuing perspective as a share of the total value of transactions has increased in the majority of EU Member States. 16 EU countries have seen such increases over five years, some of which seem to be in line with a similar increase in the corresponding e-commerce transactions. 12 EU countries saw a decrease in their share over the five-year period. The share of fraud in SEPA overall decreased by 3.73% over the five years.
Even though the growth rate of fraud as a share of transactions was highest in Lithuania, this was owing to the comparatively low level of its respective fraud share in 2014.
Growth rate of the value of fraud as a percentage of the total value of transactions for cards issued in a specific country or area over five years (2014‑2018)
(growth rate of fraud as a share of transactions 2014/2018)

Source: All reporting card payment scheme operators.
In general, higher shares of cross-border transactions are observed for smaller countries. Over the five-year period, the picture has not changed significantly and a much higher percentage of card transactions take place at the domestic level than across borders. However, it can be seen that the proportion of cross-border transactions has been increasing steadily over the past five years for the great majority of EU countries.
Percentage of the value of all card transactions taking place domestically or cross-border from an issuing perspective

Source: All reporting card payment scheme operators, 2018.
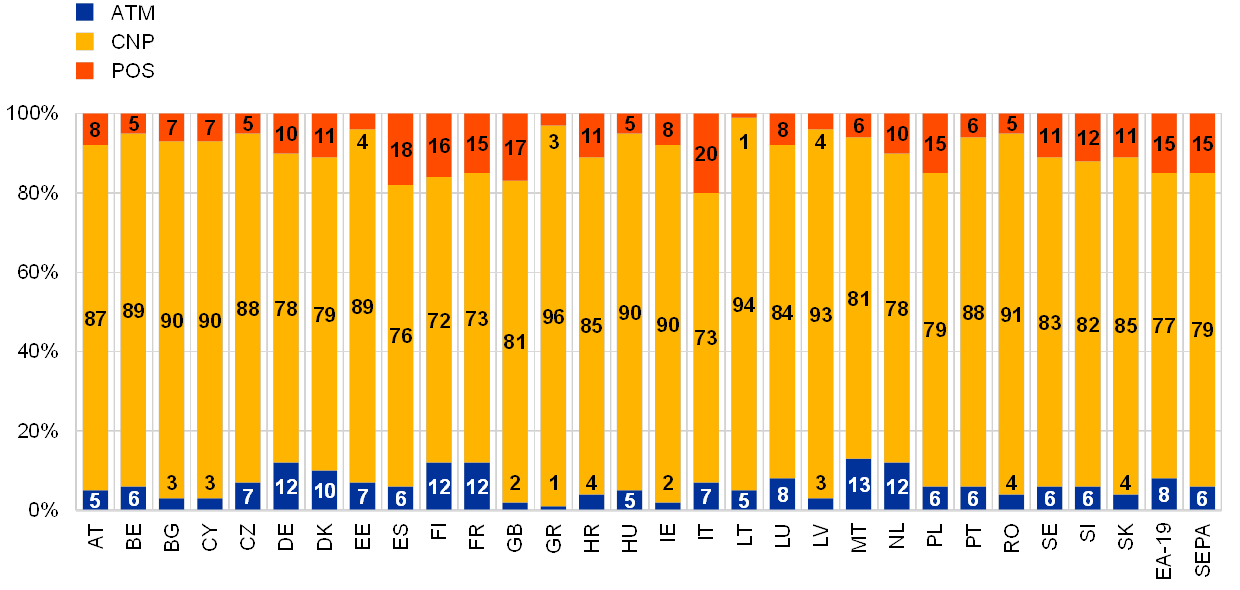
From an issuing point of view, CNP fraud was the main channel for card fraud in all countries. The countries with the highest proportion of CNP fraud were: Greece, Lithuania, Latvia and Romania with over 90% of CNP fraud in all fraudulent transactions.
Compared with the start of data collection, the variation in the fraudulent use of each channel for cards issued in different EU countries from an issuing point of view has decreased:
- CNP fraud accounted for between 72% and 96%, with a median share of 85%
- POS fraud accounted for between 1% and 20%, with a median share of 8%
- ATM fraud accounted for between 1% and 13%, with a median share of 6%
Geographical distribution of the value of card fraud by transaction channel from an issuing perspective
(value of fraud by channel as percentage of total fraud (percentages))
Source: All reporting card payment scheme operators, 2018.
From an acquiring point of view, the variation in the transaction channel used to commit fraud in different EU countries has decreased compared with previous years:
- ATM fraud accounted for between 0% and 19%, with a median share of 3%
- CNP fraud accounted for between 46% and 91%, with a median share of 75%
- POS fraud accounted for between 9% and 50%, with a median share of 19%
In general, variations in the fraudulent use of POS terminals and CNP channels were more pronounced from an acquiring perspective than from an issuing perspective. For ATM fraud, variation is similar from both perspectives.
Geographical distribution of the value of fraud using cards issued worldwide by transaction channel from an acquiring perspective
(value of fraud by channel as percentage of total fraud (percentage))

Source: All reporting card payment scheme operators, 2018.
There were large variations in card use and fraud levels across EU countries.
Most of the significant card markets, which are characterised by high transaction values and volumes per inhabitant and with a high level of use of cards for online purchases (e.g. Luxembourg, the United Kingdom and Denmark) experienced higher fraud rates. Fraud in these markets was predominantly CNP fraud (see Chart 13) and mostly occurred in cross-border transactions.
In countries where card use was rather low (e.g. Poland, Romania and Slovakia), fraud shares were typically also low. In addition to the low card usage, another reason noted to have contributed to low fraud levels in these countries was increased usage of contactless chip cards and contactless chip readers at POS terminals and ATMs, which helped to decrease card-present fraud. Moreover, the mass implementation of the 3D Secure protocol for all cards and e-commerce merchants, starting in 2013, helped to decrease CNP fraud in domestic e-commerce transactions.
Table 2 shows figures for countries which are listed according to fraud as a share of the total value of transactions.
Card use, transaction and fraud levels from an issuing perspective

Sources: Data on cards, inhabitants, transactions per card and transactions per inhabitant were drawn from the ECB’s SDW; data on fraud and fraud per transaction were collected for oversight purposes by all reporting card payment scheme operators for 2018. Therefore, the fraud/transaction indicator is constructed from data coming from the same source. No data is available for Croatia in SDW on 2018 transaction values.Notes: Values are in euro. The cell colour helps to interpret the table: green indicates high card usage or low levels of fraud, red indicates low card usage or high levels of fraud, and darker colours indicate more extreme values. Each column is formatted independently.
Table 3 shows fraud levels and changes in fraud levels in 2018 at country level in total and for selected types of fraud.
Developments in, and levels of, fraud differed significantly across countries.
Although issuers and card schemes managed to reduce fraud in some countries with relatively high fraud rates, such as Denmark, they experienced rises in other markets, such as Ireland, France, Malta and the United Kingdom.
Similarly, among countries with low fraud shares, some, such as Romania and Slovakia, experienced a further reduction in fraud, while others, such as Poland, experienced major growth.
Fraud shares and growth rates for individual fraud categories are jointly formatted in Table 3 to allow the comparison of different types of fraud.
Relative fraud levels and trends by channel and category from an issuing perspective
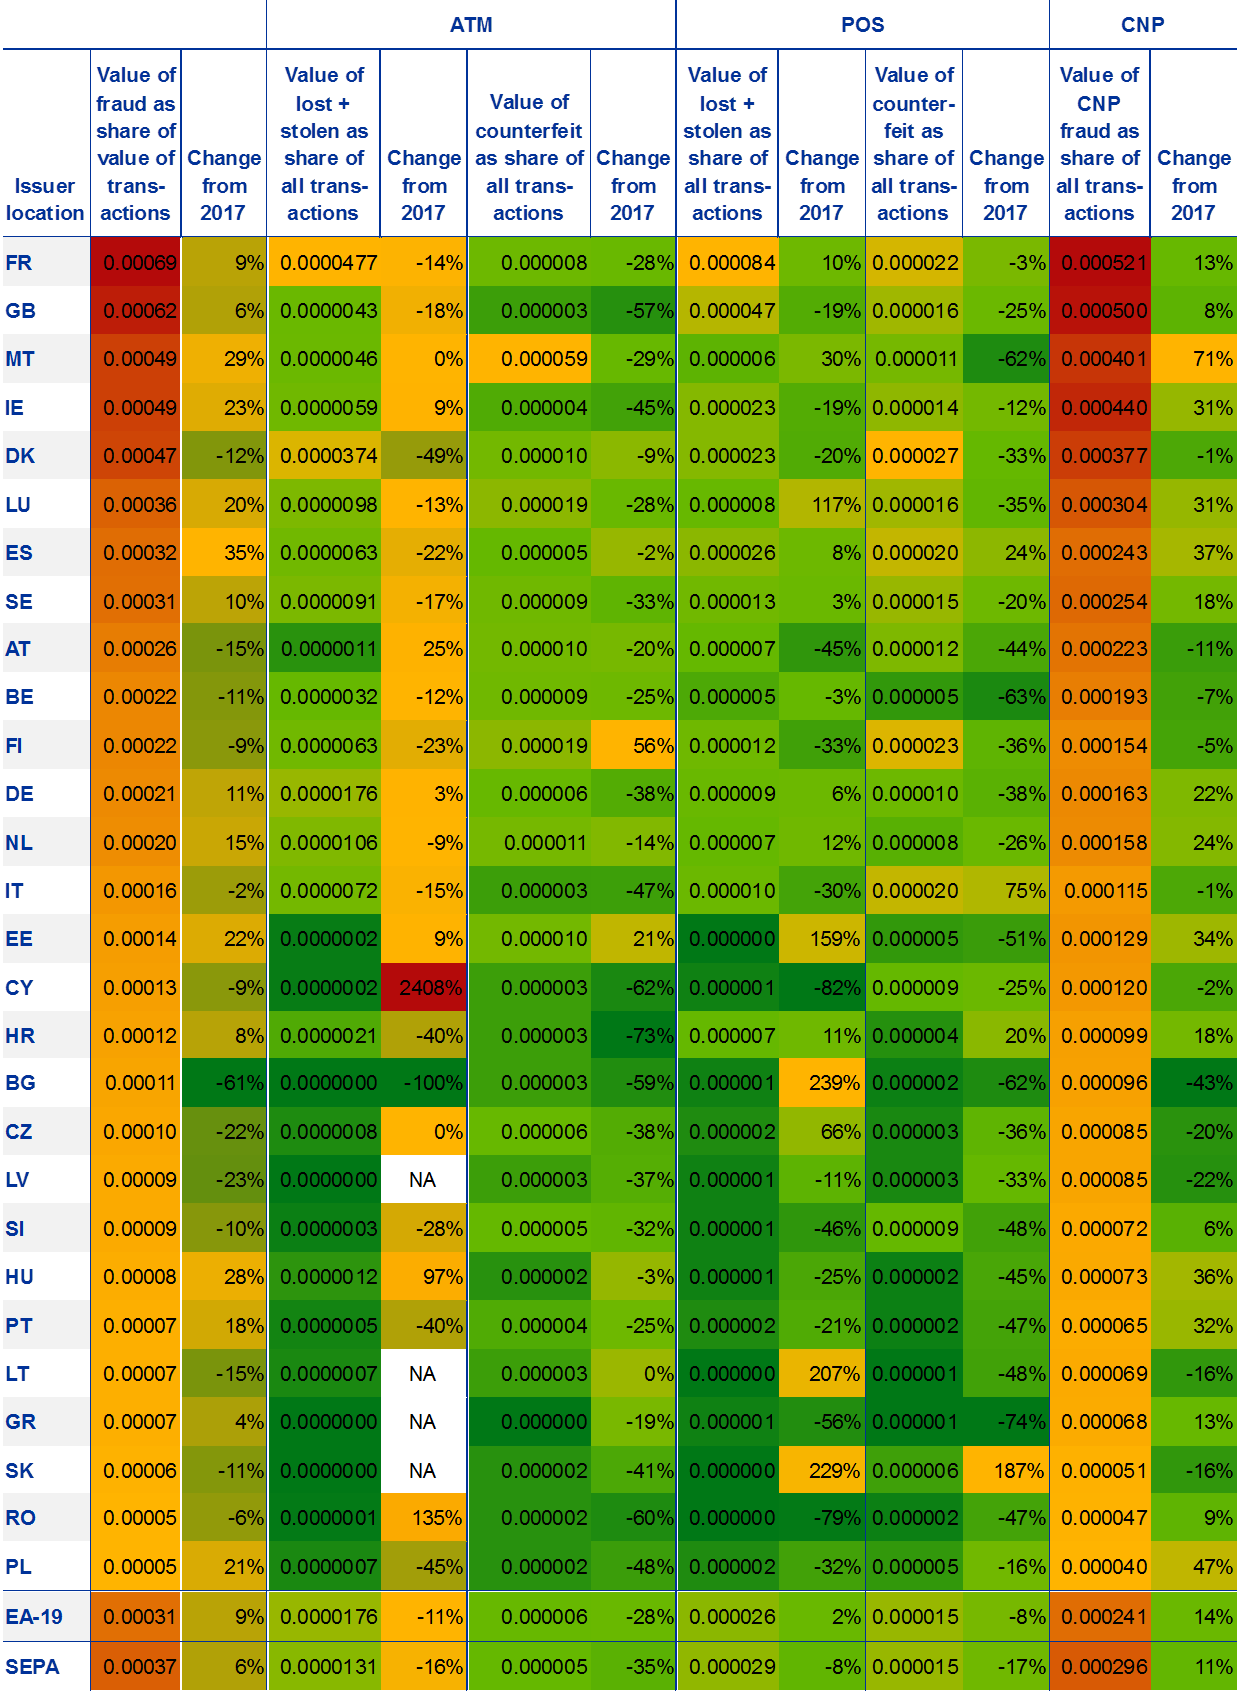
Sources: All reporting card payment scheme operators, 2017 and 2018.Notes: The fraud rate deducted from data collected using Eurosystem methodology differs from the fraud rate according to the Banque de France’s data collection (0.00062 according to data in the 2018 Annual Report [FR] of the Observatory for the Security of Payment Means of the Banque de France) owing to potential reporting inconsistencies or methodological divergence with regard to the collection of data on domestic transactions and fraudulent transactions. The cell colour helps to interpret the table: green is associated with low fraud shares or reductions in fraud shares, red is associated with high fraud shares or increases in fraud shares, and darker colours indicate more extreme values.
7 Conclusions and outlook
This report shows that the total value of card fraud increased in 2018 compared with the previous year in both absolute terms (by 13% to €1.80 billion) and relative terms, i.e. as a share of total value of transactions (by 0.002 percentage points to 0.037%). The overall increase in fraud is mainly a result of the increase in CNP fraud (by 17.7% to €1.43 billion). This type of fraud accounts for 79% of all fraud losses on cards issued inside SEPA. In view of increasing CNP fraud, enhanced security standards for payment service providers (the regulatory technical standards for strong customer authentication and common and secure open standards of communication under PSD2 drafted by the European Banking Authority (EBA) and the ECB) were published by the European Commission in November 2017 and entered into force in September 2019. A subsequent EBA Opinion set a new deadline for the implementation of these standards by 31 December 2020 and prescribed the expected actions to be taken during the migration period. The consistent and timely implementation of this secondary legislation should help in reducing fraud rates in the EU. Moreover, the ECB expects the card payment scheme operators it oversees to require their participants to comply with the applicable legislation and support them with the technical means for performing strong customer authentication. In this respect, the overseers are monitoring the migration of these schemes and respective fraud developments. Further details regarding consumers’ protection against payment fraud can be found in specific publications of the EBA.[29]
The lower rate of card-present fraud in 2018 compared with 2017 was mainly a result of a decrease in counterfeit and lost-and-stolen card fraud and, from a geographical point of view, decreases in fraudulent cross-border transactions acquired outside SEPA. However, as magnetic stripe usage in countries outside SEPA may not be completely avoidable, card schemes and issuers are encouraged to adopt further measures (e.g. geo-blocking, better education of cardholders) to prevent counterfeit fraud. Nevertheless, should cardholders fall victim to fraud, they would only be liable for the limited amount of €50 (or, depending on the PSD2 national implementation, even less in some Member States such as the Netherlands where a zero liability policy is pursued), while the rest of the defrauded amount would need to be refunded by their issuing bank in accordance with PSD2 provisions (unless the cardholder is proven to have acted fraudulently or with gross negligence).[30]
As in previous years, this report shows that levels of fraud were lower in the euro area than in SEPA as a whole. Data on fraud and transactions using cards issued inside and outside SEPA show that fraud losses incurred outside SEPA on cards issued inside SEPA were lower than losses incurred inside SEPA on cards issued outside SEPA. This suggests that SEPA residents benefit from the high-security features of their cards.
The Eurosystem will continue to monitor and report on fraud and security developments for card payment schemes and take action if needed, in line with its oversight policy framework.
© European Central Bank, 2020
Postal address 60640 Frankfurt am Main, GermanyTelephone +49 69 1344 0Website www.ecb.europa.eu
All rights reserved. Reproduction for educational and non-commercial purposes is permitted provided that the source is acknowledged.
For specific terminology please refer to the ECB glossary (available in English only).
PDF ISBN 978-92-899-3641-5, ISSN 2315-0033, doi:10.2866/77260, QB-BI-19-001-EN-NHTML ISBN 978-92-899-3646-0, ISSN 2315-0033, doi:10.2866/375287, QB-BI-19-001-EN-Q
- [1]Unless otherwise specified, total figures in this report (transactions, fraud, fraud shares) refer to values and cover the SEPA perspective. Country-based tables across the report reflect EU countries’ figures. On occasions, where relevant, the euro area total figures are also provided.
- [2]The general information on card usage, data collection methodology and classification provided in the first report on card fraud is not repeated in this version (see “Report on Card Fraud”, ECB, July 2012).
- [3]The “issuing country” is the country of the card issuing payment service provider.
- [4]The “acquiring country” is the country of the card transaction beneficiary. For card-present transactions, the acquiring country is determined by the location of the ATM or POS terminal used. For CNP transactions, the acquiring country is determined by the country where the merchant (or the respective subsidiary) is legally incorporated.
- [5]The same trends were observed for fraud volumes although ATM fraud was less prevalent and CNP fraud was more common.
- [6]Most implementations of chip and pin are based on EMV as an industry standard for card transactions at POS terminals and ATMs, based on smart card technology.
- [7]Compare with EMVco global adoption statistics, 2018‑19.
- [8]A domestic transaction is a transaction where the issuing and acquiring countries are the same.
- [9]A cross-border transaction is a transaction where the issuing and acquiring countries are different.
- [10]See, for example, “Underground Hacker Markets – Annual Report”, SecureWorks, April 2016 which lists the price of obtaining confidential information, such as personal data or sensitive card payment credentials.
- [11]Geo-blocking refers to blocking transactions abroad using EU-issued cards unless options allowing such transactions have been activated in advance.
- [12]The three Spanish domestic card schemes – Sistema 4B, EURO 6000 and ServiRed – merged into Sistema de Tarjetas y Medios de Pago S.A. (STMP) in 2018. STMP released the unified scheme operating rules in 2019. The data used in this report refer individually to each of the three former card schemes.
- [13]A co-badged card is a card where there are two badges on the card, two payment schemes and two payment propositions, two liable parties for each part, but they share the same physical plastic card.
- [14]From an issuing perspective, some card payment scheme operators have split their card data according to the country of issuance (including cross-border issuing), while other operators have reported data according to the country in which the card issuer is domiciled. This may lead to discrepancies in data for some countries (e.g. Luxembourg).
- [15]The fraud and transactions value figures cover data from one additional domestic scheme as of 2015 onwards and from another scheme as of 2018 onwards.
- [16]The growth rates are not influenced by variations in data provision and the baseline fraud amounts used in the calculation of the share come from the same schemes and comparable data.
- [17]In general, volume figures are less accurate than value figures and some small card schemes do not report them completely. Over time, their quality and completeness has increased; therefore, the percentage increase over five years is to be treated with caution.
- [18]For the purpose of these statistics, cashless transactions via channels other than ATMs and POS terminals are defined as “card-not-present” (CNP) transactions. This terminology refers to “remote transactions” as defined by the SEPA Cards Framework: any transaction where either the card, the cardholder, or the merchant are not present in the same place at the time of the instruction of the payment for the transaction by the cardholder. For example: mail order, telephone order, basic and secure electronic commerce, mobile.
- [19]This technology is used for both card-present and card-not-present payments. However, the box is placed in this chapter as CNP fraud is the largest category of fraud, which this technology is intended to address.
- [20]These fraud categories are also relevant for card-not-present fraud, but in the underlying data collection of this report such a breakdown is only known for card-present fraud. Therefore, this box appears under this section of the report.
- [21]See “The year when cybercrime hit close to home”, Europol, September 2017.
- [22]Especially the regulatory technical standards for strong customer authentication and common and secure open standards of communication.
- [23]See “Internet Organised Crime Threat Assessment”, Europol, 2019, p. 36.
- [24]See “Internet Organised Crime Threat Assessment”, Europol, 2016, p. 29.
- [25]See “Internet Organised Crime Threat Assessment”, Europol, 2019, p. 37.
- [26]For example, see “Double blow to dark web marketplaces”, Europol, May 2019.
- [27]Card number, expiry date, cardholder name and security code, i.e. CVV2 or CVC2.
- [28]From an issuing perspective, some card payment scheme operators have split their card data according to the country of issuance of a card (including cross-border issuing), while other operators have reported data according to the country in which the card issuer is domiciled. This may lead to discrepancies for some countries (e.g. Luxembourg).
- [29]See Consumer Trends Report 2018/19, EBA, February 2019.
- [30]The PSD2 also stipulates that “there should be no liability where the payer is not in a position to become aware of the loss, theft or misappropriation of the payment instrument. Moreover, once users have notified a payment service provider that their payment instrument may have been compromised, payment service users should not be required to cover any further losses stemming from unauthorised use of that instrument.”