
Executive summary
This fifth oversight report on card fraud analyses developments in fraud related to card payment schemes (CPSs) in the Single Euro Payments Area (SEPA) and covers almost the entire card market.[1] It provides an overview of developments in card payment fraud between 2012 and 2016.
The total value of fraudulent transactions conducted using cards issued within SEPA and acquired worldwide amounted to €1.8 billion in 2016 – a decrease of 0.4% compared with 2015. In relative terms, i.e. as a share of the total value of transactions, fraud dropped by 0.001 percentage point to 0.041% in 2016, down from 0.042% in 2015. Compared, again in relative terms, with the levels of fraud observed in 2012, fraud increased by 0.003 percentage points in 2016. Although there was an upward trend in card fraud between 2012 and 2015, it seems the trend is changing, given that fraud went down in 2016.
With respect to the composition of card fraud in 2016, 73% of the value of card fraud resulted from card-not-present (CNP) payments, i.e. payments via the internet, post or telephone, 19% from transactions at point-of-sale (POS) terminals and 8% from transactions at automated teller machines (ATMs).[2]
With €1.32 billion in fraud losses in 2016, CNP fraud was not only the largest category of fraud in absolute value but, unlike ATM and POS fraud, it was also the only one to record an increase (of 2.1%) compared with the previous year. Data on regular, i.e. non-fraudulent, CNP transactions, which are only partially available, suggest that there was also considerable growth in CNP transactions on the whole. Based on this partial information, it can be concluded that CNP fraud grew at a lower rate than CNP transactions.
In an interview, market representatives from a European security forum[3] confirmed that there is an ongoing shift of fraud from the card-present to the card-not-present environment. However, the market has started to develop a plethora of fraud prevention and detection security tools with the objective of bringing online fraud rates down (e.g. implementation of 3D Secure, risk-based analysis, Tokenization). In addition, the European regulators have contributed to fighting online fraud with regulatory tools – the 2013 Recommendations for the security of internet payments and the 2014 Guidelines on the security of internet payments[4]. Recently, they also strengthened the security requirements for electronic payments with the revision of the Payment Services Directive (PSD2) in 2015 and specified further such requirements in the Regulatory Technical Standards for strong customer authentication and common and secure open standards of communication in 2017.
The largest drop in the level of fraud concerned card fraud committed at ATMs, with 12.4% less fraud in 2016 compared with 2015, while fraud committed at POS terminals went down by 3.0%. The lower level of ATM fraud was mainly due to a substantial decrease in counterfeit card fraud and fraud using lost and stolen cards following the migration of cards and terminals to EMV. Fraud using lost and stolen cards accounted for 47% of the value of fraud at ATMs and POS terminals, while counterfeit card fraud made up 43%. As observed in previous years, counterfeit card fraud was predominant for transactions acquired in countries outside SEPA. This trend continued in 2016, although that geographical category has seen a decrease in counterfeit card fraud compared with 2015.
For delayed debit cards and credit cards, CNP fraud was the most common type of fraud in 2016, accounting for 76% of the total value, followed by fraud occurring at POS terminals (20%) and ATMs (4%). For debit cards, CNP fraud was also the most common type, making up 71% of the total fraud value for these cards, followed by POS and ATM fraud, which accounted for 19% and 10% respectively.
From a geographical perspective, domestic transactions accounted for 90% of all transactions, but only 35% of fraudulent transactions. Cross-border transactions within SEPA made up for 8% of all transactions, but 43% of fraudulent transactions. Finally, although only 2% of all transactions were acquired outside SEPA, they accounted for 22% of all fraud. The euro area experienced slightly lower fraud levels from an issuing and acquiring perspective than SEPA as a whole.
Compared with SEPA as a whole, fraudsters in the euro area focused more on ATM and POS fraud (fraud committed at ATMs and POS terminals accounted for 30% of the total value of fraud in the euro area, compared with 27% in SEPA). The difference can be attributed mainly to the influence of the United Kingdom, which had a relatively high share of CNP fraud and, with its total level of fraud, accounted for 40% of total fraud losses on cards issued within SEPA.
This report also covers data on transactions conducted using cards issued outside SEPA, but acquired inside SEPA. These data show that there are higher fraud losses on non-SEPA issued cards used inside SEPA than there are on SEPA issued cards used outside SEPA. This also holds true in relative terms in relation to the value of transactions: 0.57% of the value of transactions acquired inside SEPA using non-SEPA issued cards was fraudulent, compared with 0.44% of the value of transactions acquired outside SEPA using cards issued inside SEPA. The finding suggests that European cardholders also benefit from high European security standards for transactions conducted outside SEPA.
For individual European Union (EU) Member States, large variations with respect to card usage were identified, as in the previous report: the number of cards per inhabitant ranged from 0.8 to 3.9[5], the number of payments made per year per inhabitant ranged from 26 to 329, while the corresponding transaction values ranged between €1,800 and more than €17,000 per year and inhabitant. Fraud shares, i.e. the fraud-related share of the transaction value or volume, ranged from 0.005% for cards issued in Poland to 0.073 % for cards issued in Denmark in terms of value, and from 0.002% in Poland to 0.043% for cards issued in France in terms of volume. There were also big differences with respect to the transaction channels used by fraudsters in the EU. Broken down by country of card issue, fraud committed at ATMs ranged from 0% to 18% of the total, the share of CNP fraud ranged from 41% to 84%, and the share of POS fraud ranged from 13% to 55%. Broken down by country of acquirer, these variations were even larger; ATM fraud ranged from 0% to 26%, CNP fraud from 33% to 93% and POS fraud from 7% to 61%.
Most of the countries with significant card markets (defined as countries with high volumes and values of card transactions per inhabitant) experienced high rates of fraud. CNP fraud was typically the most common type of fraud involving cards issued in these markets. By contrast, countries with limited card usage experienced relatively low levels of fraud.
In summary, in 2016 the total value of card fraud decreased. Fraud involving cards issued inside SEPA increased for CNP transactions and decreased across the other transaction channels. In 2016 CNP fraud accounted for 73% of total fraud losses on cards issued inside SEPA, compared with 71% in 2015. Furthermore, and unlike 2015, fraud at ATMs and POS terminals decreased in 2016 following the near completion of migration to the EMV standard within SEPA. The drop in card-present fraud could be a result not only of this migration within SEPA but also of an increasingly high adoption rate of EMV for terminals outside Europe[6]. A wider usage of geo-blocking[7], as well as increased physical security measures at terminals (e.g. lids to protect PIN entry, skimming device detectors, etc.) and the deactivation of the option to fall back to magnetic stripe (or “magstripe”) usage for cards might also be among the factors that contributed to this reduction. While ATM and POS fraud diminished substantially (and at a high pace between 2012 and 2016) as more countries outside SEPA migrated to EMV, CNP fraud saw a slight increase in 2016. The application of the Eurosystem’s “Guide for the assessment of card payment schemes against the oversight standards” (February 2015) could also have contributed to making card payment schemes more secure. In particular, the application of the Recommendations for the security of internet payments[8], which are incorporated into the above-mentioned guide, may have helped limit the increase of online fraud.
Introduction
In January 2008 the ECB’s Governing Council approved an oversight framework for card payment schemes (CPSs). As part of the harmonised implementation of this framework, statistical information is gathered on card schemes. Each scheme is asked to supply general business data and volumes and values of transactions and fraudulent transactions per country for all Single Euro Payments Area (SEPA) countries as well as in aggregate for all countries outside SEPA. For automatic teller machines (ATMs) and point-of-sale (POS) terminals, fraud figures are broken down into “lost and stolen”, “card not received”, “counterfeit” and “other”, while for total card-not-present (CNP) transactions, there is an option to provide a breakdown of the figures according to “online” and “mail or phone” fraud. Data collection is based on common templates and definitions. Please note that fraud is defined independently of whether the loss ends up being borne by the customer, issuer, acquirer or merchant.
This report summarises the information received from the following 22 CPSs: Sistema 4B, American Express, Bancontact, Oney Bank, BNP Paribas Personal Finance, Cartes Bancaires, Cashlink, Cofidis, Cofinoga, CONSORZIO BANCOMAT, Crédit Agricole Consumer Finance, Dankort, Diners Club International, EURO 6000, Franfinance, girocard, JCB International, Karanta, MasterCard Europe, Quikcash, ServiRed, SIBS’ MB, and Visa Europe.
A comparison of the transaction data gathered from CPSs with data held in the ECB’s Statistical Data Warehouse (SDW) suggests that the data available for 2016 exceed the total value of transactions within the European Union (EU) by 5%. However, this figure must be treated with caution as it may reflect both gaps in SDW data and double-counting of data reported for oversight purposes. Unfortunately, for four countries the coverage is below 90% of the value of transactions owing to the fact that either oversight requirements, including statistical reporting, were waived for some CPSs or as a result of incomplete data reporting. For another six countries the coverage is above 110% of the total value of transactions in SDW owing to the double-reporting of data – by international and domestic schemes alike – or to the fact that some types of small payment service providers (PSPs) are exempt from reporting under the ECB Regulation on payment statistics.
For Luxembourg, a further comparison of data available from other sources with the data provided for oversight purposes showed discrepancies in transaction and fraud levels.[9] Such discrepancies, as well as those mentioned earlier, have been tolerated for the purpose of the present report.
This report rests on a number of assumptions and thus data adjustments in order to avoid the double-counting of figures reported by domestic card schemes and international ones have been made. Two methodological data issues identified a few years ago remain valid for this report, namely that some CPSs allocate (i) transactions with cross-border issued cards to issuing SEPA countries by the area of use as opposed to the location of the issuer and ii) cross-border acquired CNP transactions according to the location of the acquirer instead of the location of the merchant. These methodological divergences result in some inconsistencies between data collected from the CPSs and similar data from the PSPs reported for SDW purposes; however, as they are limited to some schemes and countries they are considered tolerable.
The national central banks and the ECB have checked and processed the data with due care. Nevertheless, errors related to data provision, transmission or processing cannot be excluded.
Results “from an issuing perspective” refer to payments made with cards issued within SEPA and acquired worldwide. Results “from an acquiring perspective” therefore refer to transactions conducted using cards issued worldwide and acquired inside SEPA. Results are generally derived from an issuing perspective[10], except in Chapter 6, where the acquiring perspective is adopted for some results. In these cases, the change of perspective is highlighted.
The report is structured as follows: the first chapter presents findings on the total level of card fraud. The second chapter looks at card fraud for different card functions and is followed by a chapter on CNP fraud. Next is an analysis of different categories of card fraud at ATMs and POS terminals. Chapter 5 compares domestic transactions and fraud figures with cross-border figures both within and outside SEPA. Chapter 6, which is based on EU Member States only, looks at absolute and relative fraud levels, as well as other information about individual EU Member States. Chapter 7 concludes.
1 Total level of card fraud
The total value of card fraud using cards issued in SEPA amounted to €1.8 billion in 2016. The total value of card transactions using cards issued in SEPA amounted to €4.38 trillion in 2016.[11]
Card fraud experienced a decrease in terms of value of 0.4% compared with 2015, and an increase of 35% compared with 2012. However, since the value of all card transactions grew by 1.8% in 2016 compared with the previous year, fraud as a share of the total value of transactions decreased by 0.001 percentage point, i.e. from 0.042% in 2015 to 0.041% in 2016.[12]
Compared with 2015, CNP fraud has increased in proportion, whereas fraud at ATMs and POS terminals has become less prominent.
CNP accounted for 73%, POS for 19% and ATM for only 8% of the total value of card fraud.
Evolution of the total value of card fraud using cards issued within SEPA
left-hand scale: total value (EUR millions); right-hand scale: value of fraud as share of value of transaction (%)
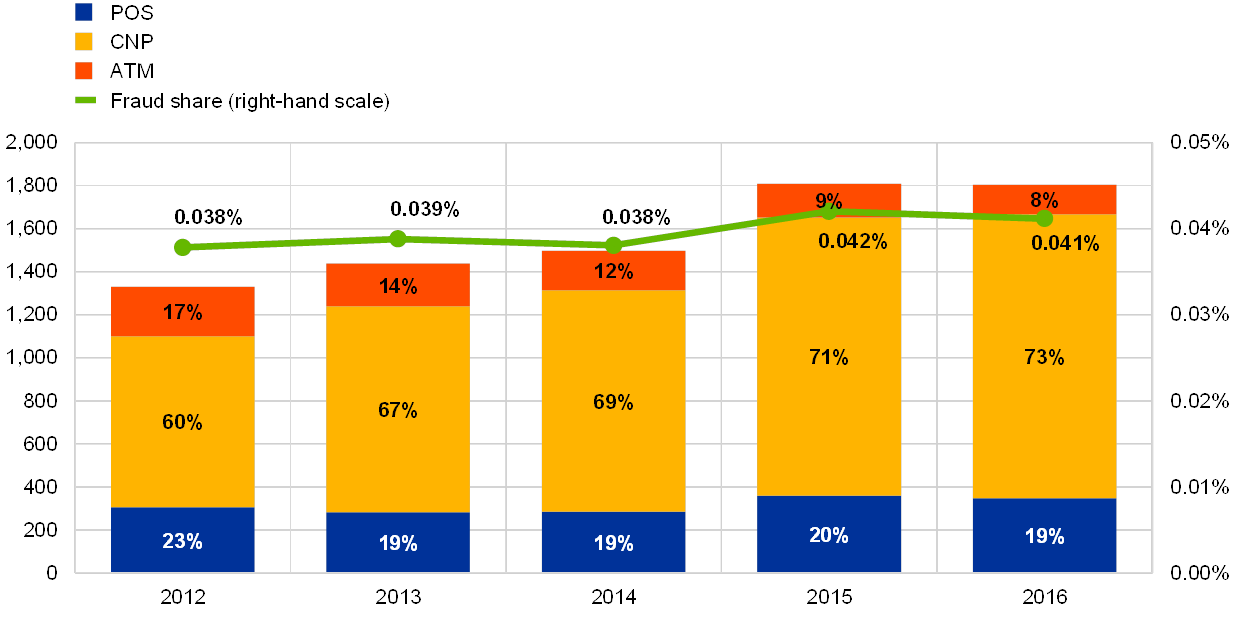
Source: All reporting CPSs.
The total number of cases of card fraud using cards issued in SEPA amounted to 17.30 million in 2016. The total number of card transactions using cards issued in SEPA amounted to 74.9 billion in 2016.[13]
Card fraud increased in terms of volume by 27.2% compared with 2015, and by 92% compared with 2012. In comparison, the total number of transactions increased by only 9.6% in 2016 compared with the previous year. Therefore, fraud as a share of the total number of transactions increased to 0.023% in 2016 (i.e. by 0.003 percentage point compared with the previous year).
Compared with 2015, the relevance of ATMs as a channel for fraud has decreased when looking at fraud volumes, while the relevance of CNP and POS terminals continues to increase.
The share of ATM fraud in terms of volume was lower than its share in terms of value, owing to the high average values for fraudulent ATM transactions.
Evolution of the total volume of card fraud using cards issued within SEPA
left-hand scale: total volume (million transactions); right-hand scale: volume of fraud as share of volume of transaction (%)

Source: All reporting CPSs
2 Card fraud according to different card functions
In 2016 the total share of fraud in overall transactions declined slightly for debit cards and increased slightly for delayed debit cards and credit cards compared with the previous year.
The share of delayed debit card and credit card fraud in overall transactions remained larger than that of debit card fraud.
For delayed debit cards and credit cards:
- in absolute terms, fraud increased in 2016 compared with the previous year for the CNP channel and POS terminals, but decreased for ATMs (not displayed in the chart);
- in relative terms (as a percentage of total delayed debit card and credit card transactions), CNP fraud increased in 2016 compared with the previous year, while POS remained constant and ATM fraud decreased.
For debit cards:
- in absolute terms (not displayed in the chart), all components of fraud (CNP, POS and ATM) decreased;
- in relative terms, the share of total fraud in all transactions decreased slightly, owing to the rise of transactions and the fall in fraudulent transactions for this card function.
Share and composition of fraud for different card functions
value of fraud as share of value of transaction

Source: All reporting CPSs excluding cards issued in France and Spain.
3 Card-not-present fraud
In 2016 the total value of CNP fraud increased by 2.1% compared with the previous year, reaching €1.32 billion.
CNP fraud accounted for 73% of the total value of card fraud in 2016. This share has been growing steadily since 2008 (not displayed in the chart).
An increase in CNP fraud of 66% over a period of five years was the main driver for the 35% increase in overall fraud over this period.
Evolution of the value of CNP fraud and its share of the total value of fraud
EUR millions

Source: All reporting CPSs.
Box 1Some market perspectives on online card fraud
Card-not-present (CNP) fraud, which nowadays covers mainly “online fraud”, has become the most prominent type of card fraud, amounting to 73% of total card fraud losses in 2016.
Given this development, the ECB conducted a limited survey with market representatives (card schemes, banking associations and merchant/e-commerce associations) from the Card Fraud Prevention Forum of the European Payments Council on fraud modus operandi and prevention.
When asked to specify the top three types/modus operandi of online card fraud observed in its market in 2016, a merchant association provided the following classification:
1. Clean fraud – where criminals obtain genuine cardholder details including 3D Secure and Address Verification credentials, etc. It is almost impossible for merchants to recognise that the individual using the card fraudulently is not the bona fide cardholder.
2. Identity theft – where the fraudster makes use of the cardholder’s personal data in order to make an unauthorised transaction. This fraud can also be categorised as “lost or stolen” fraud since customer card details are stolen and used to purchase goods and services online for the purpose of resale, for example. This type of fraud partly overlaps with clean fraud.
3. Friendly fraud or first-party fraud – where the payer, after having performed a genuine transaction to purchase goods or services online, contacts the card issuer to claim that they have been defrauded and request a chargeback. This type of fraud has reportedly been growing in recent years.
According to the security laboratory of one banking association, the increase in digital banking services had inevitably led to a shift of attacks and fraud towards the “card-not-present” type. In instances of CNP fraud, cards were both the target and the vector of the attacks, given that fraudsters aimed first to subtract data and then to spend money online (preferably at online merchants that had not adopted the highest security measures). For them, phishing had turned out to be the most relevant, widespread and effective means of gathering sensitive payment card data. In addition, another banking association remarked that online card fraud in its market was mainly related to credit cards, whereas the debit card part was negligible. This was mainly due to card issuers in these markets blocking the use of debit cards in an online e-commerce environment.
In the same context, one card scheme remarked upon the noticeable continued growth in “unsecured e-commerce transactions” (i.e. transactions without strong customer authentication) and consequently in related fraud. The scheme also mentioned that the increased digitisation of merchant payments was changing CNP risk dynamics.
When it came to fraud prevention, the surveyed respondents made reference to detection systems implemented by card issuers and merchants. In particular, tools such as Tokenization and 3D Secure authentication, particularly when used as part of a risk-based authentication process, had been helpful in reducing online fraud. Predictive measures based on neural systems also represented an effective security tool, in some cases more than other reactive solutions.
In one market, an incremental shift from card-based payments towards credit transfer payments initiated by a third-party provider had lowered fraud rates on payments.
In addition to 3D Secure and strong customer authentication more generally, the following security tools were mentioned from a merchant perspective as the most effective for detecting and preventing e-commerce fraud:
- Card Verification Code (CVV, CVN, CVC2, CID, etc.)
- Address verification service (AVS)
- Negative/black lists – including those provided by the international card schemes as well as internal lists within the organisation/merchant
- Fraud scoring models
- Geo-location
- Customer purchase history
- Device fingerprinting
- Email verification
With respect to the expected main threats to card payment security in the future, the surveyed entities mentioned a potential shift towards attacks against mobile payments, owing to an increase in the use of mobile services. The use of social engineering to obtain sensitive payment data relating to credit or debit cards was seen as an ongoing problem.
One respondent made a more detailed distinction between internal and external weakness:
Internal weaknesses included a lack of resources within organisations, especially personnel with the relevant expertise in fraud detection and prevention (seen as a key issue), gaps in fraud tool functionality and issues related to the speed of response to emerging threats and tracking friendly fraud.
Externally, threats could come from data compromises, such as data hacks on merchant client systems, system compromises etc., which continue to concern merchants. A potential risk that the detailed regulatory regime might limit the industry’s ability to adjust to new threats was also mentioned by one card scheme in this context.
Finally, as to whether a reduction in online card fraud could be expected in the near future, some respondents either already saw a decrease in online fraud figures or expected it to happen as a result of increased security measures. However, a note of caution was sounded by the market regarding the ever-evolving nature of fraud and the resulting expected shift to other fraud methods.
4 Categories of fraud committed at ATMs and POS terminals
The combined value of ATM and POS fraud decreased by 5.9% in 2016, and the values of both ATM and POS fraud also decreased individually.
The decrease in ATM fraud values – down by 12.4% in 2016 – was more pronounced than for POS and was driven by considerably lower losses on counterfeit and lost and stolen card fraud in absolute values in 2016 compared with 2015.
At POS terminals, a 21.5% decrease in card-not-received fraud losses and a 1.9% decrease in counterfeit and lost and stolen card fraud in 2016 contributed to the overall decrease of POS fraud by 3.0%.
From 2015, fraud using lost and stolen cards became the most onerous type of ATM fraud, followed by fraud using counterfeit cards. At POS terminals, counterfeit card fraud and fraud using lost and stolen cards were the most relevant categories in 2016.
Over the five years in question the value of counterfeit card fraud at ATMs and POS terminals combined decreased by 24.4%, while card-not-received fraud decreased by 39.1% (albeit from a comparatively low level). Over the same period, lost and stolen card fraud increased by 9.9% and became, starting from 2014, the most prominent category of card-present fraud in absolute value.
Evolution of the value of fraud by category at ATMs and POS terminals
EUR millions
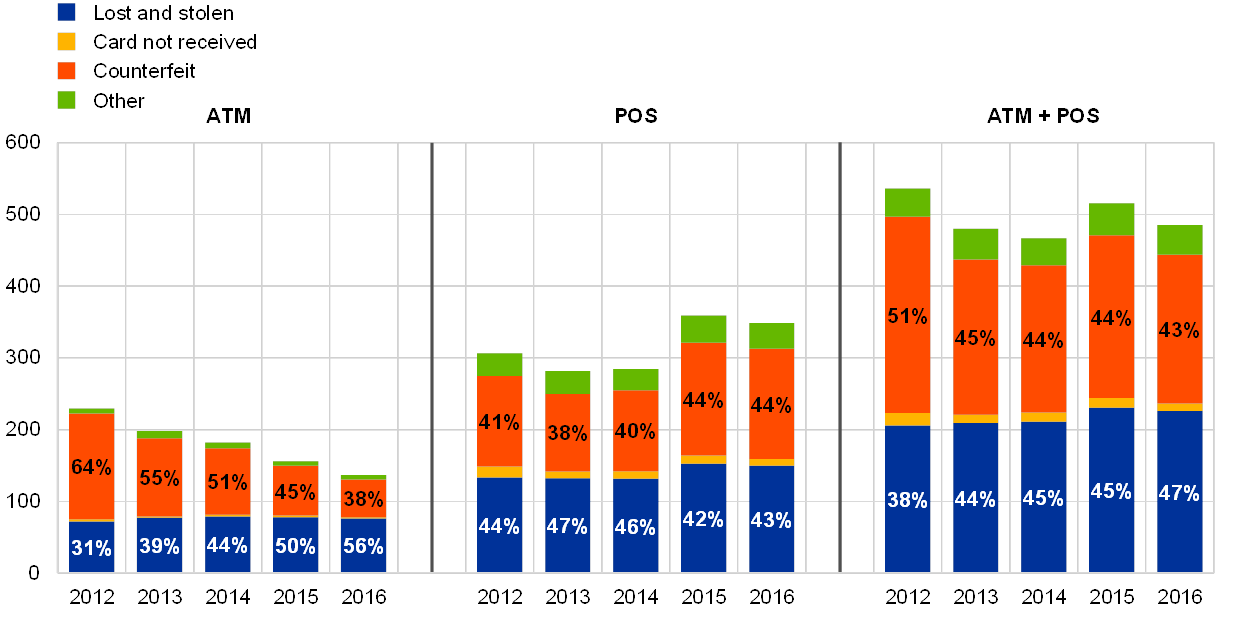
Source: All reporting CPSs.
As in previous years, counterfeit card fraud in 2016 mostly involved transactions acquired outside SEPA.
94% of ATM counterfeit card fraud and 79% of POS counterfeit card fraud concerned transactions acquired outside SEPA.
The total value of counterfeit card fraud decreased by 8.8% in 2016.
In 2016 two geographical categories saw decreases in counterfeit card fraud compared with the previous year, namely domestic counterfeit card fraud (by 13.85%) and to a smaller extent cross-border counterfeit card fraud acquired outside SEPA (by 9.76%). The latter was most likely due to the fact that migration to the EMV security standard was still ongoing in countries outside SEPA.
Evolution of the value of counterfeit card fraud at ATMs and POS terminals
EUR millions
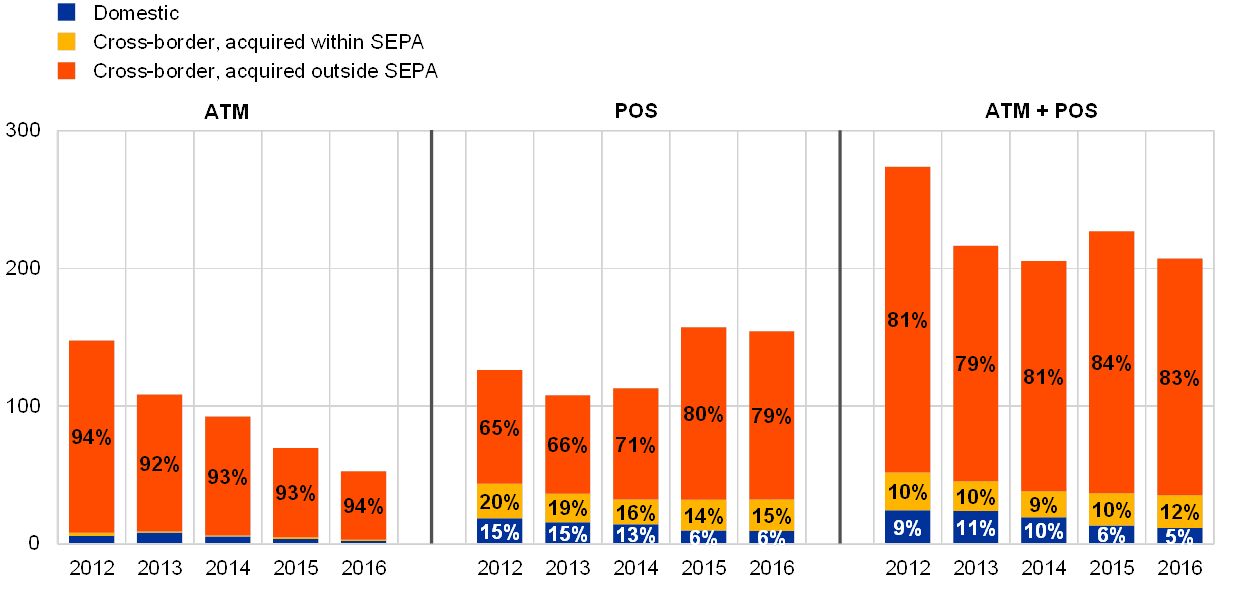
Source: All reporting CPSs.
Box 2Some market perspectives on card-present fraud
Card-present fraud decreased substantially between 2012 and 2016, falling by 9.5%. EMV migration in Europe reached 84.9% in 2016 with respect to the deployment of EMV-chip cards, according to statistics published by EMVCo[14]. Even outside SEPA, there has been great progress in this respect, with adoption rates exceeding 50% in the majority of geographical areas in 2016.
When asked to specify the top three types/modus operandi of card-present fraud observed in their market in 2016, representatives of the Card Fraud Prevention Forum (see Box 1) mentioned:
- Counterfeit card fraud – performed by cloning the magnetic stripe of a card, particularly to spend money outside SEPA in countries where EMV standards have not yet been implemented.
- Lost and stolen card fraud – primarily lost cards being used to perform unauthorised card transactions. Theft of physical cards had also been noticed but to a lesser extent than lost card fraud.
- Identity theft/takeover – as described in Box 1, fraudsters impersonate the genuine cardholder and make use of their personal information to carry out unauthorised card-present transactions (e.g. at a POS terminal). This category of fraud may overlap with other categories such as counterfeit card fraud or lost and stolen card fraud.
One representative of a merchant association also mentioned that there had been a slight increase in fraud in relation to contactless card transactions using stolen cards; however this remained quite low in absolute terms given the need for the cardholder to key in a PIN after a number of contactless transactions or when exceeding a certain cumulative threshold.
On the question of whether counterfeit card fraud was still an issue for Europe, the surveyed entities unanimously agreed that it had become an issue of low priority for European transactions. However, given that EMV had not been implemented worldwide and the liability shift was not always in place across European borders, this type of fraud was still a problem.
5 Domestic and cross-border card fraud
From 2012 to 2016, the geographical composition of the value of all transactions was marked by an increase in cross-border transactions within SEPA.
In 2016, domestic transactions accounted for 90% of all transactions, a decrease in the share of transactions but a slight increase (of 1.2%) compared with the previous year. Cross-border transactions within SEPA, on the other hand, went up by 10.16% in 2016 compared with the previous year.
However, cross-border transactions within SEPA accounted for the largest share of fraudulent transactions in 2016 (43%), followed by domestic fraud (35%) and cross-border fraud outside SEPA (22%).
The share of cross-border card fraud within SEPA increased slightly in 2016 compared with the previous year and has been constantly rising since 2012.
Evolution of the value of domestic and cross-border transactions and fraud

Source: All reporting CPSs.
The geographical composition of card fraud largely depends on the type of fraud:
- lost and stolen card fraud typically takes place at the domestic level, whereas counterfeit card fraud is typically committed outside SEPA;
- for counterfeit card fraud, the proportion of fraud committed outside SEPA decreased in 2016 compared with the year before;
- for lost and stolen card fraud, there was a slight drop in the proportion of domestic fraud at the expense of a rise in cross-border fraud acquired inside SEPA.
Geographical composition of lost and stolen and counterfeit card fraud at ATMs and POS terminals according to fraud value

Source: All CPSs, 2015 and 2016.
In 2016, domestic transactions rose while domestic fraud fell. In the same vein, cross-border transactions acquired outside SEPA increased slightly, whereas the respective fraud decreased.
Cross-border transactions and fraud acquired within SEPA both rose in 2016, with the former increasing at a higher rate than the latter.
Conversely, the number of cross-border transactions within SEPA rose more slowly than the number of those that were fraudulent (not displayed).
Cross-border fraud within SEPA and outside SEPA both exceeded their 2012 levels, whereas domestic fraud remained under its 2012 level.
Evolution of the total value of domestic and cross-border transactions and fraud
2012 = 100
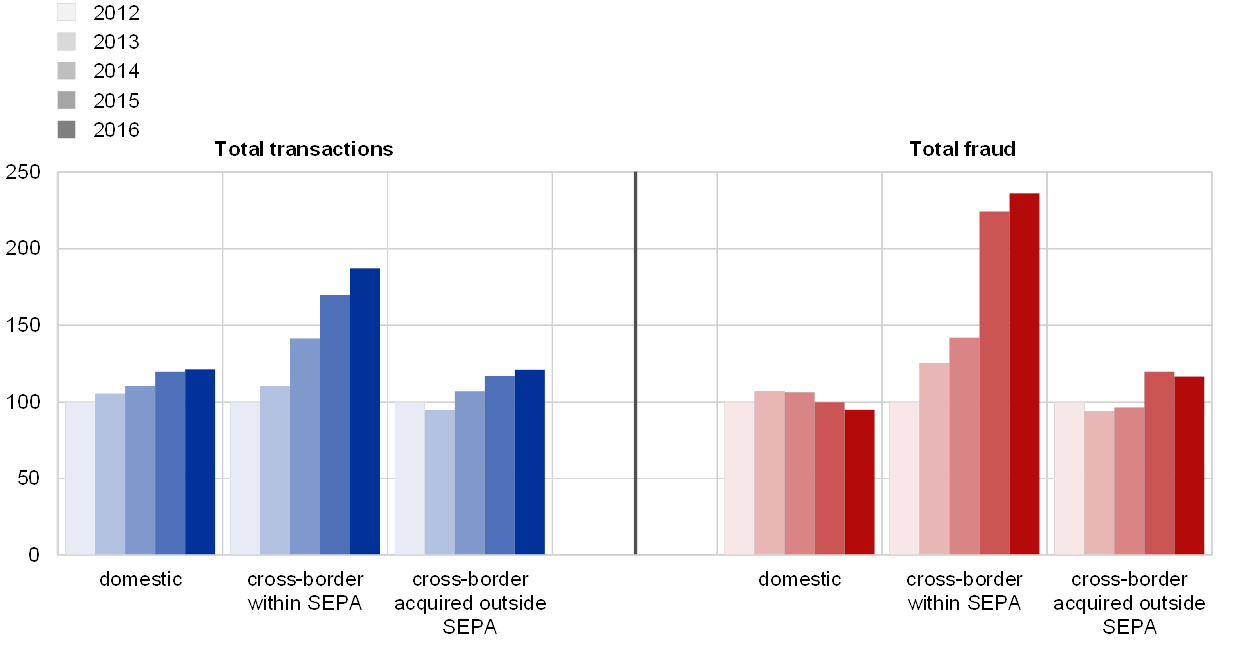
Source: All reporting CPSs.
6 A country-by-country perspective on card fraud
Fraud shares varied considerably in different EU Member States in 2016.
From an issuing perspective[15], the rates of fraud in Denmark, the United Kingdom and France were the highest. Fraud rates in Hungary, Romania, Greece, Lithuania, and Poland were the lowest. In the case of Denmark, official statistics on card fraud[16] show that the high levels of fraud in 2016 are mostly due to the high level of cross-border e-commerce fraud, which should be viewed in the light of the large number of e-commerce transactions made in this country in combination with a high share of cross-border transactions more generally. Nevertheless, domestic fraud levels remain low in Denmark.
The euro area in particular experienced lower fraud rates than SEPA as a whole (both from an issuing and an acquiring perspective).
Fraud rates for SEPA (and the euro area) were lower from an issuing perspective than from an acquiring perspective. This indicates that cards issued inside SEPA experienced lower fraud rates for transactions acquired outside SEPA than cards issued outside SEPA for transactions acquired inside SEPA, thus providing a sense of security to European cardholders when shopping abroad.
Fraud share for transactions with cards issued in a specific country and acquired anywhere (blue) vs fraud share with cards issued anywhere and acquired within the country (yellow)
value of fraud as share of value of transactions

Source: All CPSs, 2016.
Compared with 2012, fraud as a share of the total value of transactions from an issuing perspective has increased for the majority of EU Member States. Thirteen countries have seen larger increases than the average increase of this share recorded in SEPA, which stood at around 7.86%.
Even though the growth rate of fraud as a share of transactions was highest in Finland, this was due to the comparatively low level of its respective fraud share in 2012.
Growth rate of the value of fraud as a percentage of the total value of transactions for cards issued in a specific country[17] or area over five years (2012-2016)

Source: All CPSs.
In general, smaller countries had much higher shares of cross-border transactions than larger countries. Over the five-year period, the picture has not changed much, i.e. a much higher percentage of card transactions take place at domestic level. However, for a few countries the share of cross-border transactions increased substantially over the five-year period in question (e.g. in Malta that share increased from 20% in 2012 to 30% in 2016).
Percentage of the value of all transactions taking place domestically or cross-border from an issuing perspective

Source: All CPSs, 2016.
CNP was the main channel for committing fraud using cards issued in all but one country (Portugal).
Main fraud channel by country of issue:
- CNP fraud: Austria, Belgium, Bulgaria, Croatia, Cyprus, Czech Republic, Denmark, Estonia, Germany, Finland, France, Greece, Hungary, Ireland, Italy, Lithuania, Luxembourg, Latvia, Malta, Netherlands, Poland, Romania, Spain, Slovakia, Slovenia, Sweden, United Kingdom;
- POS fraud: Portugal[18]
There was a large variation in the fraudulent use of each channel for cards issued in different EU countries:
- ATM fraud accounted for between 0% and 18%, with a median share of 8%
- CNP fraud accounted for between 41% and 84%, with a median share of 71%
- POS fraud accounted for between 13% and 55%, with a median share of 20%
Geographical distribution of the value of card fraud by transaction channel from an issuing perspective

Source: All CPSs, 2016.
There was a large variation in the transaction channel used to commit fraud in different EU countries:
- ATM fraud accounted for between 0% and 26%, with a median share of 4%
- CNP fraud accounted for between 33% and 93%, with a median share of 69%
- POS fraud accounted for between 7% and 61%, with a median share of 24%
Variations in the fraudulent use of each channel were more pronounced from an acquiring perspective than from an issuing perspective.
Geographical distribution of the value of fraud using cards issued worldwide by transaction channel from an acquiring perspective

Source: All CPSs, 2016.
There were large variations in card use and fraud levels across EU countries.
Most of the significant card markets, which are characterised by high transaction values per inhabitant (for example, France and the United Kingdom) experienced high fraud rates. Fraud in these markets was predominantly CNP fraud (see Chart 11) and mostly occurred on cross-border transactions.
In countries where card use was rather low, e.g. Greece, Lithuania and Poland, fraud shares were typically also low.
Countries are listed according to fraud as a share of the total value of transactions.
The cell colour helps with the interpretation of the associated values:
- green is associated with high card usage or low levels of fraud;
- red is associated with low card usage or high levels of fraud;
- darker colours indicate more extreme values;
- each column in Table 2 is formatted independently.
Card use, transaction and fraud levels from an issuing perspective
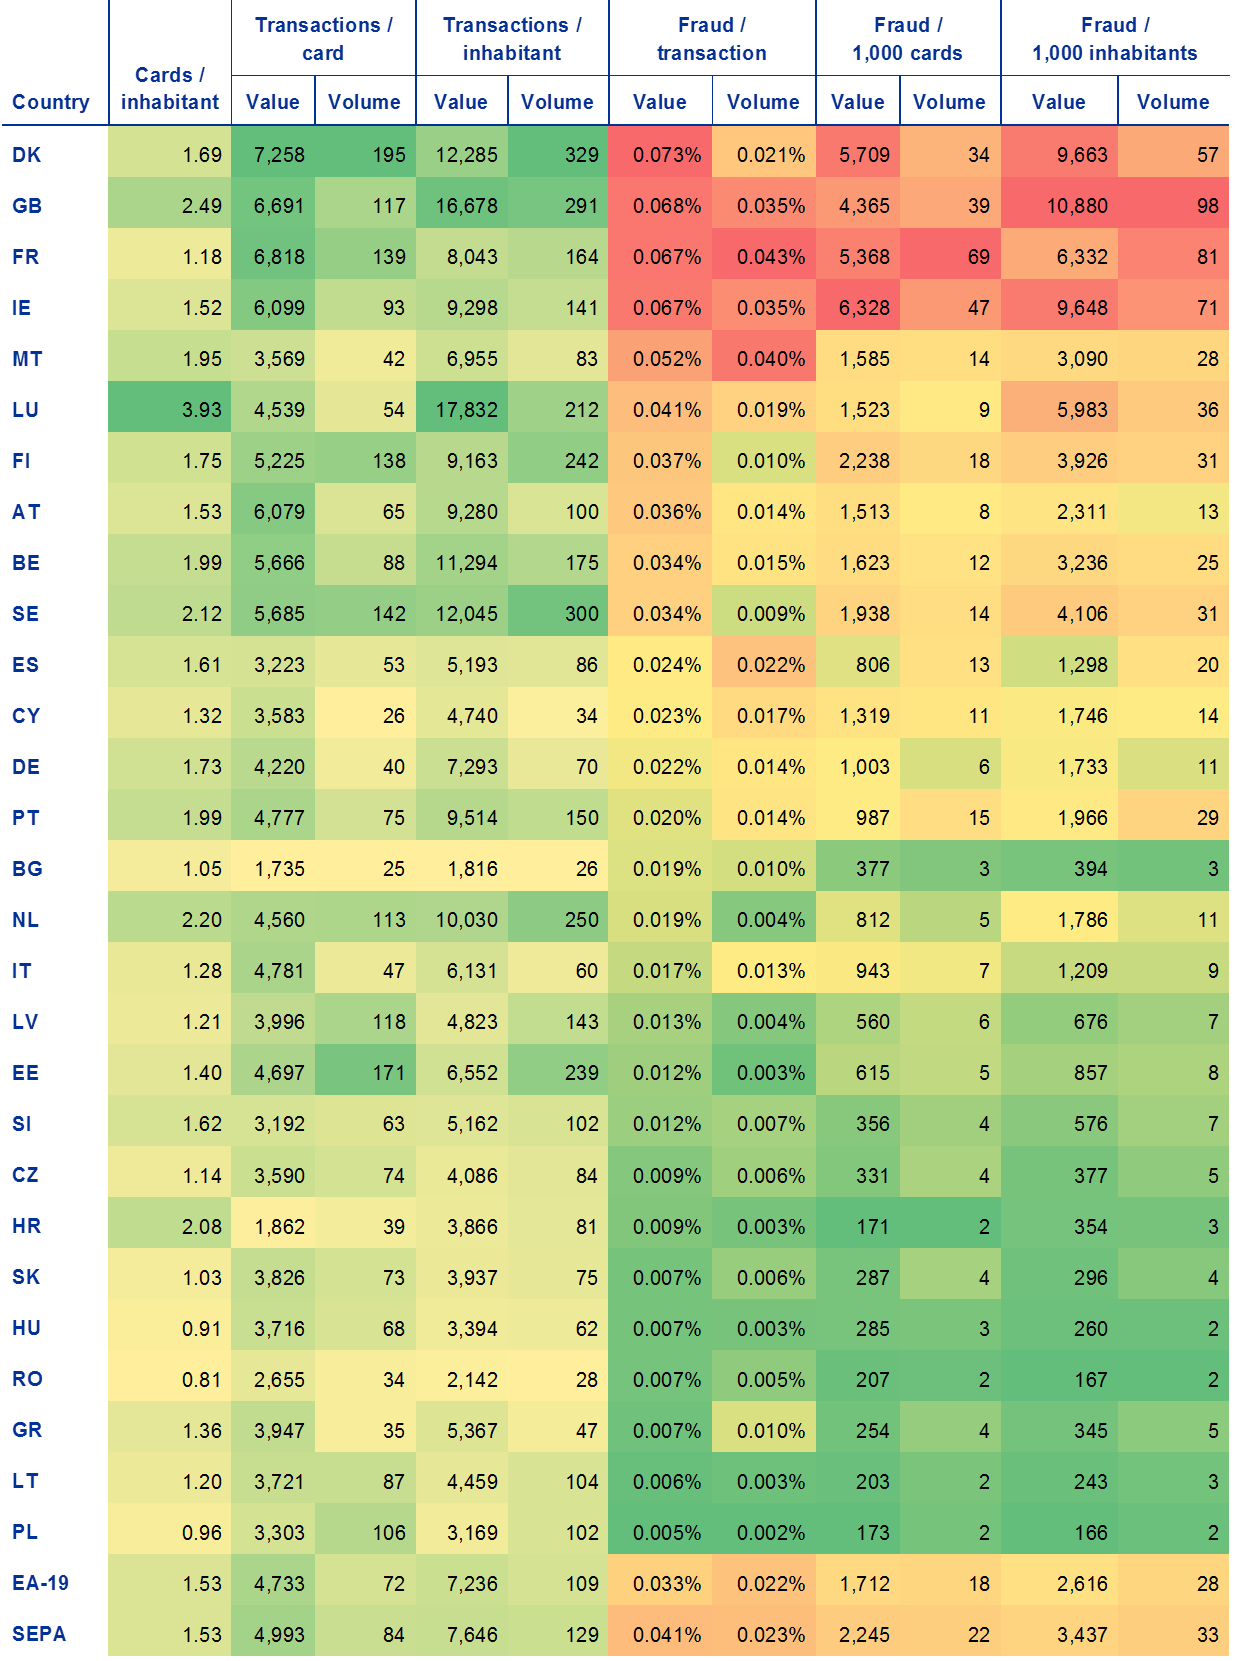
Sources: Data on cards, inhabitants, transactions per card and transactions per inhabitant were drawn from the ECB’s SDW; data on fraud and fraud per transaction were collected for oversight purposes by all CPSs for 2016. Therefore, the fraud/transaction indicator is constructed from data coming from the same source.Note: Values are in euro.
Table 3 reports fraud levels and changes in fraud levels in 2016 at country level in total and for selected types of fraud.
Developments in, and levels of, fraud differed significantly across different countries.
Although issuers and card schemes managed to reduce fraud in some countries with relatively high fraud rates, such as Denmark, the United Kingdom, France and Luxembourg, they experienced further growth in other markets, such as Ireland.
Similarly, among countries with low fraud shares, some, such as Poland and Slovakia, experienced a further reduction in fraud, while others, such as Hungary, experienced major growth.
The cell colour helps with the interpretation of the associated values:
- green is associated with low fraud shares or reductions in fraud shares;
- red is associated with high fraud shares or increases in fraud shares;
- darker colours indicate more extreme values.
Fraud shares and growth rates for individual fraud categories are jointly formatted in Table 3 to allow the comparison of different types of fraud.
Relative fraud levels and trends per channel and category from an issuing perspective

Source: All reporting CPSs, 2015 and 2016.1) The fraud rate deducted from data collected using Eurosystem methodology differs from the fraud rate according to the Banque de France’s data collection (0.00064 according to data from www.banque-france.fr) owing to potential reporting inconsistencies or methodological divergence with respect to the collection of data on cross-border transactions and fraudulent transactions.2) This percentage of increase for Portugal is due to a very onerous cross-border case of POS counterfeit fraud outside SEPA reported by one payment scheme in 2016.
7 Conclusions
This report shows that the total value of card fraud decreased in 2016 compared with the previous year. The overall decrease of 0.4% was due to a decrease in fraud using the ATM and POS transaction channels, which outweighed a slight increase in CNP fraud.
CNP fraud went up by 2.1%, accounting for 73% of all fraud losses on cards issued inside SEPA. Data on total CNP transactions, which unfortunately are only partially available, suggest that fraud has grown at a slower rate than transactions. Enhanced security standards for payment service providers and card schemes issued by the EBA and the Eurosystem at the end of 2014 and beginning of 2015 seem to have led to early signs of improvement in fraud rates in the EU. The banking associations and card schemes have already noted a positive shift with respect to online fraud and believe that this type of fraud should go down in the near future.
As to the card-present environment, the lower rate of ATM and POS fraud was mainly a result of a decrease in card-not-received and counterfeit fraud levels and, from a geographical point of view, decreases in domestic fraudulent transactions. Cross-border card-present fraud – in particular counterfeit card fraud – acquired outside SEPA also decreased, while countries outside SEPA made substantial progress in migrating to EMV. However, as magnetic stripe usage in such countries cannot be completely avoided, card schemes and issuers are encouraged to adopt further measures to prevent counterfeit fraud and to improve the protection of their customers.
As in previous years, this report shows that levels of fraud were lower in the euro area than in SEPA as a whole. Data on fraud and transactions using cards issued inside and outside SEPA show that fraud losses incurred outside SEPA on cards issued inside SEPA were lower than losses incurred inside SEPA on cards issued outside SEPA. The finding suggests that SEPA residents benefit from the high security features of their cards, even though the proportion of ATMs and POS terminals outside SEPA making use of enhanced security features is still small.
Although fraud seems to have decreased slightly in 2016, the Eurosystem will keep on monitoring developments within SEPA. As mentioned by market participants, fraud has a tendency to shift from one channel to another, from one instrument to another, and evolve towards new modus operandi. Regulators and overseers should therefore remain vigilant and monitor security developments in order to take prompt action if needed.
© European Central Bank, 2018
Postal address 60640 Frankfurt am Main, GermanyTelephone +49 69 1344 0Website www.ecb.europa.eu
All rights reserved. Reproduction for educational and non-commercial purposes is permitted provided that the source is acknowledged.
For specific terminology please refer to the ECB glossary.
PDF ISBN 978-92-899-3192-2, ISSN 2315-0033, doi:10.2866/333885, QB-BI-18-001-EN-N HTML ISBN 978-92-899-3647-7, ISSN 2315-0033, doi:10.2866/450506, QB-BI-18-001-EN-Q
- [1]This report focuses mainly on data analysis and key messages. The general information on card usage, data collection methodology and classification provided in the first report on card fraud is not repeated in this version (see https://www.ecb.europa.eu/pub/pdf/other/cardfraudreport201207en.pdf).
- [2]The same trends were observed with respect to fraud volumes, although ATM fraud was less prevalent and CNP fraud was more common.
- [3]Card Fraud Prevention Forum (CFPF) of the European Payments Council (EPC).
- [4]These guidelines, published by the European Banking Authority, applied as of August 2015 and thus may have had an impact in slowing down the increase of online fraud in the second half of 2015 and 2016.
- [5]The 3.9 cards issued per inhabitant relates to Luxembourg, where a portion of cards are issued to cardholders not living in Luxembourg.
- [6]Source: EMVco global adoption statistics.
- [7]Geo-blocking refers to blocking transactions abroad using EU-issued cards unless options allowing such transactions have been activated in advance.
- [8]Recommendations for the security of internet payments, European Central Bank, January 2013.
- [9]The main discrepancies came from the way CPSs split their card data per country, as explained in Footnote 10. The fact that Luxembourg issues a large number of cards for areas of use other than its own greatly affects the statistics for the country.
- [10]From an issuing perspective, some CPSs have split their card data according to the area of use of a card, i.e. the main country of use defined by the issuer upon issuance of a card, while other CPSs have reported data according to the country in which the card issuer is domiciled. This may lead to discrepancies for some countries (e.g. Luxembourg) if card issuers issue cards for areas of use other than their own country.
- [11]The fraud and transactions value figures cover data from two additional domestic schemes as of 2013 and 2015 respectively. As these schemes do not necessarily report correspondent volumes, this footnote does not apply to Chart 1b.
- [12]The growth rates are not influenced by variations in data provision and the baseline fraud amounts used in the calculation of the share come from the same schemes and comparable data.
- [13]In general, volume figures are less accurate than value figures, and some small card schemes do not report them completely. Over time, their quality and completeness has increased; therefore, the percentage of increase over five years is to be treated with caution.
- [14]https://www.emvco.com/about/deployment-statistics/
- [15]From an issuing perspective, some CPSs have split their card data according to the area of use of a card, i.e. the main country of use defined by the issuer upon issuance of a card, while other CPSs have reported data according to the country in which the card issuer is domiciled. This may lead to discrepancies for some countries (e.g. Luxembourg) if card issuers issue cards for areas of use other than their own country.
- [16]http://nationalbanken.statbank.dk/nbf/208814.
- [17]Croatia is not included in this particular chart since it joined the European Union in 2013. Denmark is also excluded as the 2016 and 2012 data are not comparable for that country.
- [18]The high percentage of POS fraud in Portugal is due to a very onerous cross-border case of POS counterfeit fraud outside SEPA reported by one payment scheme.