
- Statistical release
Euro area quarterly balance of payments and international investment position:
fourth quarter of 2021
5 April 2022
- Current account surplus at €292 billion (2.4% of euro area GDP) in 2021, up from €219 billion (1.9% of GDP) in 2020
- Geographic counterparts: largest bilateral current account surpluses vis-à-vis United Kingdom (€172 billion) and Switzerland (€77 billion), largest deficit vis-à-vis China (€83 billion)
- International investment position showed net liabilities of €180 billion (1.5% of euro area GDP) at end of 2021
Current account
The current account surplus of the euro area increased to €292 billion (2.4% of euro area GDP) in 2021, up from €219 billion (1.9% of GDP) in 2020 (Table 1). This increase mainly reflected larger surpluses for services (up from €6 billion to €96 billion) and primary income (up from €35 billion to €63 billion) and, to a lesser extent, a reduction in the deficit for secondary income (down from €163 billion to €158 billion). These developments were partly offset by a decline in the surplus for goods (down from €341 billion to €290 billion).
The increase in the surplus for services in 2021 was due to larger surpluses for telecommunication, computer and information services (up from €101 billion to €127 billion), transport services (up from €5 billion to €16 billion) and travel services (up from €11 billion to €19 billion) as well as due to a reduction in the deficit for other business services (down from €103 billion to €47 billion). Conversely, a lower surplus was recorded for insurance, pension and financial services (down from €15 billion to €10 billion) and the deficit for other services increased (up from €24 billion to €29 billion).
The increase in the primary income surplus in 2021 was driven by a larger surplus for investment income (up from €5 billion to €37 billion). This reflected larger surpluses for direct investment income (up from €26 billion to €38 billion), portfolio debt income (up from €41 billion to €50 billion) and other investment income (up from €7 billion to €12 billion). Moreover, a smaller deficit was recorded for portfolio equity (down from €73 billion to €67 billion).
Table 1
Current account of the euro area
(EUR billions, unless otherwise indicated; transactions during the period; non-working day and non-seasonally adjusted)

Source: ECB.
Notes: “Equity” comprises equity and investment fund shares. Discrepancies between totals and their components may arise from rounding.
Data for the current account of the euro area
Data on the geographic counterparts of the euro area current account (Chart 1) show that in 2021 the euro area recorded its largest bilateral surpluses vis-à-vis the United Kingdom (€172 billion, up from €147 billion in 2020), Switzerland (€77 billion, up from €58 billion) and the United States (€56 billion, down from €74 billion). It also recorded a current account surplus vis-à-vis a residual group of other countries (€129 billion, down from €186 billion). The largest bilateral deficits were recorded vis-à-vis China (€83 billion, up from €80 billion), EU Member States and EU institutions outside the euro area (€30 billion, down from €51 billion) and offshore centres (€27 billion, down from €108 billion).
The most significant geographic changes in 2021 relative to 2020 in the components of the current account were as follows. In goods the deficit vis-à-vis China increased from €93 billion to €112 billion, while larger surpluses were recorded vis-à-vis the United States (up from €163 billion to €182 billion) and the EU Member States and EU institutions outside the euro area (up from €40 billion to €61 billion). Moreover, the goods balance vis-à-vis the residual group of other countries turned from a surplus of €83 billion to a deficit of €1 billion. In services the deficit vis-à-vis offshore centres declined strongly (down from €90 billion to €27 billion), while the surplus vis-à-vis the residual group of other countries increased from €76 billion to €99 billion. In primary income a larger deficit was recorded vis-à-vis the United States (up from €7 billion to €36 billion), while the surpluses widened vis-à-vis the United Kingdom (up from €14 billion to €30 billion) and Switzerland (up from €9 billion to €24 billion). In secondary income the deficit vis-à-vis the EU Member States and EU institutions outside the euro area decreased slightly from €96 billion to €90 billion.
Chart 1
Geographical breakdown of the euro area current account balance
(four-quarter moving sums in EUR billions; non-seasonally adjusted)

Source: ECB.
Note: “EU non-EA” comprises the non-euro area EU Member States and those EU institutions and bodies that are considered for statistical purposes as being outside the euro area, such as the European Commission and the European Investment Bank. “Other countries” includes all countries and country groups not shown in the chart, as well as unallocated transactions.
Data for the geographical breakdown of the euro area current account
International investment position
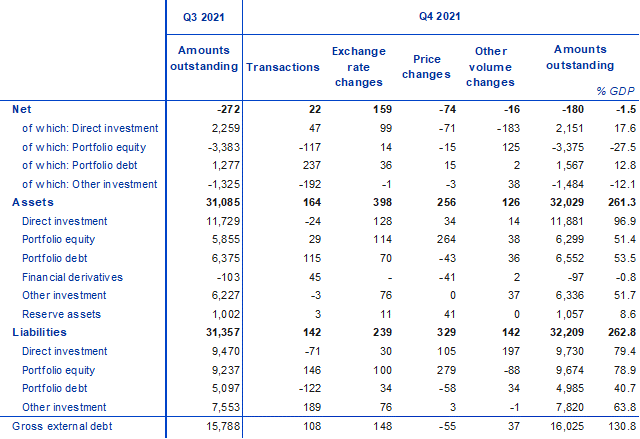
At the end of the fourth quarter of 2021 the international investment position of the euro area recorded net liabilities of €180 billion vis-à-vis the rest of the world (1.5% of euro area GDP), down from €272 billion in the previous quarter (Chart 2 and Table 2).
Chart 2
Net international investment position of the euro area
(net amounts outstanding at the end of the period as a percentage of four-quarter moving sums of GDP)

Source: ECB.
Data for the net international investment position of the euro area
The decline in net liabilities of €92 billion reflected large but partly offsetting changes in the various investment components. Larger net assets were recorded for portfolio debt (up from €1.3 trillion to €1.6 trillion), while net liabilities remained stable in portfolio equity (€3.4 trillion). Conversely, net assets in direct investment declined (down from €2.3 trillion to €2.2 trillion), while net liabilities increased in other investment (up from €1.3 trillion to €1.5 trillion).
Table 2
International investment position of the euro area
(EUR billions, unless otherwise indicated; amounts outstanding at the end of the period, flows during the period; non-working day and non-seasonally adjusted)
Source: ECB.
Notes: “Equity” comprises equity and investment fund shares. Net financial derivatives are reported under assets. “Other volume changes” mainly reflect reclassifications and data enhancements. Discrepancies between totals and their components may arise from rounding.
Data for the international investment position of the euro area
The developments in the euro area’s net international investment position in the fourth quarter of 2021 were mainly driven by positive net flows owing to exchange rate changes and, to a lesser extent, transactions, which were partly offset by negative net price changes and other volume changes (Table 2 and Chart 3).
The increase in net assets for portfolio debt was mainly driven by positive net flows for transactions and exchange rate changes (Table 2). The decline in net assets for direct investment resulted from negative net flows in other volume changes (mostly reclassifications) and price changes. The stability in net liabilities for portfolio equity was mainly due to positive net flows in other volume changes (mostly reclassifications) that were largely offset by negative net transactions. Larger net liabilities for other investment were driven by negative net transactions.
At the end of the fourth quarter of 2021 the gross external debt of the euro area amounted to €16.0 trillion (around 131% of euro area GDP), up by €237 billion compared with the previous quarter.
Chart 3
Changes in the net international investment position of the euro area
(EUR billions; flows during the period)

Source: ECB.
Note: “Other volume changes” mainly reflect reclassifications and data enhancements.
Data for changes in the net international investment position of the euro area
At the end of 2021 the stock of euro area direct investment assets was €11.9 trillion, 25% of which was invested in the United States and 21% in the United Kingdom (see Table 3). The stock of foreign direct investment liabilities was €9.7 trillion, with 31% being investments originating from the United States, 19% from the United Kingdom and 18% from offshore centres.
In portfolio investment, euro area holdings of foreign securities amounted to €6.3 trillion in equity and €6.6 trillion in debt at the end of 2021. The largest holdings of equity securities by the euro area were in securities issued by residents of the United States (accounting for 52%), followed by those issued by residents of the United Kingdom and offshore centres (each accounting for 9%). For debt securities, the largest euro area holdings were in securities issued by residents of the United States (accounting for 35%), the United Kingdom (21%) and the EU Member States and EU institutions outside the euro area (14%).
On the portfolio investment liabilities side, non-residents’ holdings of securities issued by euro area residents stood at €9.7 trillion in equity and at €5.0 trillion in debt at the end of 2021. The largest holder countries of euro area equity securities were the United States (42%) and the United Kingdom (11%), while for euro area debt securities the largest holders were the BRIC group of countries (18%), the United States (15%) and Japan (13%).
In other investment, euro area residents’ claims on non-residents amounted to €6.3 trillion, 31% of which was vis-à-vis the United Kingdom and 23% vis-à-vis the United States. Euro area other investment liabilities amounted to €7.8 trillion, with the United Kingdom accounting for 30%, while the shares of the EU Member States and EU institutions outside the euro area and the United States were 19% and 15% respectively.
Table 3
International investment position of the euro area – geographical breakdown
(as a percentage of the total, unless otherwise indicated; at the end of the period; non-working day and non-seasonally adjusted)

Source: ECB.
Notes: “Equity” comprises equity and investment fund shares. “EU non-EA” comprises the non-euro area EU Member States and those EU institutions and bodies that are considered for statistical purposes as being outside the euro area, such as the European Commission and the European Investment Bank. The “BRIC” countries are Brazil, Russia, India and China. “Other countries” includes all countries and country groups not listed in the table as well as unallocated positions.
Data for the international investment position of the euro area – geographical breakdown
Data revisions
This statistical release incorporates revisions to data for the reference periods between the first quarter of 2018 and the third quarter of 2021. The revisions reflect revised national contributions to the euro area aggregates as a result of the incorporation of newly available information.
Next releases
- Monthly balance of payments: 22 April 2022 (reference data up to February 2022)
- Quarterly balance of payments and international investment position: 5 July 2022 (reference data up to the first quarter of 2022)
For queries, please use the Statistical information request form.
Notes
- All data are neither seasonally nor working day-adjusted. Ratios to GDP (including in the charts) refer to four-quarter sums of non-seasonally and non-working day-adjusted GDP figures.
- Hyperlinks in this press release lead to data that may change with subsequent releases as a result of revisions.